1. Introduction
Ethereum [
1] is one of the most popular, fully decentralized, and open-source blockchain platforms, pioneering the groundbreaking functionality of smart contracts. Its core principle embodies a global cryptocurrency ecosystem free from single-entity control. Initially, Ethereum employed the Proof-of-Work (PoW) [
2] consensus mechanism, involving miners utilizing their computational power to solve cryptographic hashes, known as mining. Miners are rewarded with Ether, the native cryptocurrency of Ethereum, and transaction fees for validating blocks and transactions on the blockchain. However, with the evolution of blockchain technology and the recognition of the energy consumption and scalability challenges associated with PoW, Ethereum has transitioned to a Proof-of-Stake (PoS) [
3] consensus mechanism since the September 2022 upgrade, known as
the Merge [
4]. Under the PoS consensus, validators are selected based on the amount of Ether that they stake as collateral, which aims to distribute rewards more evenly among participants, enhancing the fairness of the blockchain.
However, the emergence of the Maximal Extractable Value (MEV) [
5] poses significant challenges to achieving desired fairness in blockchain networks, as it represents the total potential income a block producer can extract through the inclusion, exclusion, or reordering of transactions in a block [
6]. For instance, validators can capitalize on arbitrage opportunities by reordering transactions or even censoring transactions to capture the Maximal Extractable Value (MEV) [
7]. To address MEV risks, some users opt for private transaction pools. Unlike MemPools, which are open to all, private pools restrict visibility to the pool owner. By selecting a reputable and trusted pool owner, users can conceal profitable arbitrage transactions from public view, effectively safeguarding against malicious validators engaging in front-running or sandwich attacks [
8]. Private transaction pools are indeed a double-edged sword threatening fairness in the blockchain ecosystem. On the upside, validators with vast private transaction pools can expedite transaction processing for blockchain users. However, on the downside, these large validators can reap significant additional MEV profits and boost their MEV capabilities due to the substantial number of transactions. This trend could potentially undermine the equity of reward distribution and network decentralization, contrary to the core goal of blockchain decentralization.
To address this issue, proposer–builder separation (PBS) was introduced alongside the Merge. PBS introduces builders, who are responsible for independent transaction ordering and block construction. They submit their blocks to proposers for bidding. PBS empowers proposers to choose from these blocks, reducing centralization risks and promoting equal chances for proposers of all sizes to earn block rewards. Since its launch alongside the Merge, PBS has gained rapid adoption and currently dominates over 80% of Ethereum’s block production. However, comprehensive analyses of PBS’s ecosystem-level impacts remain lacking. While existing studies predominantly focus on MEV extraction [
8,
9,
10] or examine PBS’s impacts on block validation and censorship resistance [
11], critical gaps remain in understanding PBS’s real-world impacts on reward distribution, role-based decentralization, and protocol fairness across the Ethereum ecosystem. Our work presents one of the first systematic measurement studies tracking PBS’s operational impacts before/after its deployment, combining quantitative evidence with protocol insights to inform future blockchain security designs.
In this paper, we conduct a comprehensive systematic measurement and quantitative analysis on the Ethereum ecosystem since the Merge and the adoption of builder–proposer separation (PBS). We develop tools for collecting and analyzing data that span from 1 March 2022 to 30 April 2023, comprising blockchain transactions, relay data, and token prices from various public sources. We assess PBS’s influence on proposers’ and builders’ revenue (
Section 5 and
Section 6), highlighting its robust participant incentives. Additionally, we analyze PBS’s global effects on network decentralization, revealing a growing trend towards decentralization among builders, proposers, and relays (
Section 7).
Our key findings include the following:
Rapid PBS adoption: PBS adoption has surged, driven by a remarkable 224% increase in proposer revenue. PBS consistently yields higher block rewards, with 97.1% allocated to proposers, fostering its widespread adoption.
Builder revenue challenges: Builders, however, receive only 2.9% of block rewards, reflecting intense competition. Revenue distribution reveals peaks, with around 40.5% of blocks yielding minimal revenue and 28.5% requiring builders to subsidize their revenue.
Fairness improvement: PBS significantly enhances fairness, as evidenced by comparable proposer revenue for different-sized proposers and a reduction in the Gini index from 0.155 to 0.066. It mitigates proposer centralization concerns.
No monopoly trends: Builders exhibit no centralization tendencies, with the top three builders’ market shares decreasing by 0.07% daily post-Merge. Users are willing to send transactions to multiple major builders to reduce on-chain delays. Relays also experience decentralization trends, reducing the top three relay market shares by 0.08% daily. These trends align with Ethereum’s decentralization principles.
This paper is organized as follows:
Section 2 introduces proposer–builder separation (PBS) and MEV fundamentals.
Section 4 details our methodology, including data collection and analysis framework.
Section 5 and
Section 6 present proposer and builder revenue analyses, respectively, followed by PBS’s decentralization effects in
Section 7.
Section 8 examines PBS risks and impacts, while
Section 3 reviews related work. Finally, this paper concludes with
Section 9.
2. Background
This section introduces the fundamental concepts underlying Ethereum’s transaction ecosystem and proposer–builder separation (PBS) mechanism. We begin by examining MemPool transactions as the entry point for all network activity, followed by an analysis of the Maximal Extractable Value (MEV) as the key economic force shaping block production. The discussion then turns to MEV auctions and builder centralization dynamics, which collectively form the operational context for PBS. These interconnected concepts provide the necessary background for understanding PBS’s design rationale and its impact on Ethereum’s block production landscape.
MemPool Transactions: In the Ethereum network, transaction processing begins when users submit transactions to the
MemPool, a temporary storage area for pending transactions awaiting validation and block inclusion [
12]. As a publicly accessible component of the network architecture, MemPool maintains complete transaction visibility since all participating nodes continuously broadcast their pending transactions to this shared pool.
Maximal Extractable Value (MEV): Besides traditional rewards like block rewards and transaction fees, Ethereum proposers can earn additional rewards known as the Maximal Extractable Value (MEV). Proposers, who dictate the order of transactions within blocks, can boost profits through transaction manipulation [
6]. With the removal of the ETH 2 per block reward, MEV has gained prominence. In particular, there are three well-studied types of MEV [
8,
10]: (a)
Sandwich: proposers exploit price fluctuations caused by automated market maker (AMM) mechanisms in decentralized exchanges (DEXs) [
8]. They purchase an asset before a transaction that affects its price and then sell it afterward, profiting from the price change. (b)
Liquidation: Lending platforms such as AAVE [
13] and DyDx [
14] offer collateral at a discount during liquidation. Proposers buy this collateral and promptly resell it, making a profit. (c)
Arbitrage: Proposers profit from price variations across different DEXs. They buy low on one exchange and sell high on another in immediate successive transactions. The profitability of all MEV strategies fundamentally depends on the proposer’s exclusive ability to determine transaction ordering—without this control, externally inserted transactions would erode the extractable value.
Private Transactions: To mitigate MEV exploitation risks (particularly sandwich attacks), users may opt for private transactions that bypass the public mempool, and these are submitted directly to proposers [
15]. However, this approach presents two key limitations: (1) Transaction owners must trust proposers not to exploit their transactions, and (2) potential processing delays may occur since most proposers lack infrastructure to receive private transactions directly.
MEV Auctions: In 2020, miners employed Priority Gas Auctions (PGAs) to sequence transactions, prioritizing those with higher gas prices. This mechanism frequently resulted in network congestion and extreme gas fee fluctuations [
6,
16]. The root cause stems from MEV competition dynamics—when multiple searchers simultaneously pursue the same arbitrage opportunity, their conflicting transactions congest the block space while consuming substantial execution resources. To address these issues, Flashbots [
17] proposed the
MEV auction mechanism and implemented it through MEV-geth in January 2021 [
18]. In this framework, searchers submit MEV transaction bundles along with corresponding bids via the Flashbots Relay, after which proposers select the highest-bidding bundle for inclusion in the block through a private channel. By restricting each block to contain only one Flashbots bundle, this approach effectively reduces network congestion and prevents the duplication of MEV transactions from competing searchers.
Proposer Builder Separation: While Flashbots eases network congestion, it fails to ensure proposer fairness. Significant resource disparities lead to asymmetric MEV competition, particularly after the Proof-of-Stake (PoS) transition [
5]. Large proposers have an edge because they have more resources and faster transaction times, which draws more ETH stakes to them and exacerbates proposer centralization risks in Ethereum. To address this issue, the community implemented the proposer–builder separation (PBS) mechanism, which decouples block construction from proposal responsibilities: Specialized builders (without staking requirements) assemble blocks while validators (with staking) focus on block proposal and consensus. This separation establishes distinct revenue streams—builders earn through MEV extraction capabilities while proposers gain from staking rewards. The detailed transaction execution process is as follows (
Figure 1):
S1: Users initiate and broadcast transactions to the public MemPool, awaiting inclusion in a block.
S2: MEV searchers monitor the MemPool and bundle victim transactions with their own for arbitrage.
S3: Builders collect MemPool transactions for block construction (S3.1). Users opt for private transactions with reputable builders to avoid MEV attacks (S3.2). MEV searchers may send bundles via private transactions to builders for precise ordering (S3.3).
S4: Builders send bids to relays to get their bundles on-chain, adjusting based on the highest bid information.
S5: Relays forward the highest bid to proposers; if accepted, they send block headers. After proposer approval and signing, the entire block is added to the blockchain, awaiting confirmation.
Builder Centralization: Even under the PBS mechanism, centralization risks persist as specialized builders may accumulate disproportionate influence over block construction. This concern mirrors the Ethereum community’s longstanding worry about centralized block production, where a dominant builder could control most block rewards [
19]. This concern stems from
private orderflow [
20], where users predominantly send transactions to specific builders, consolidating control over block production. This creates a self-reinforcing cycle that leads to builder centralization and eventual market monopolization.
3. Related Works
In this paper, we investigate how PBS influences participant revenues and system decentralization within Ethereum’s ecosystem. Our analysis shows that PBS not only redefines the profit distribution among builders, proposers, and searchers but also introduces new trust assumptions that affect network health. This work builds on previous research that analyzed PBS mechanics and Ethereum’s decentralization trend, and here, we provide an overview of the major related work.
Proposer Builder Separation (PBS): The increasing complexity of block building is mainly caused by MEV. The concept of MEV was first studied in two important early papers [
6,
7]. Daian et al. [
6] analyzed how arbitrage bots make profits and found that MEV could affect blockchain security. Around the same time, Eskandari et al. [
7] examined front-running cases in Ethereum’s top 25 DApps and discussed possible solutions. Multiple studies [
10,
21,
22] have emerged to quantify MEV extraction on the Ethereum network To address MEV-related centralization risks, Ethereum introduced PBS [
23]. Community researchers also provide valuable insights into MEV and PBS. Obadia et al. [
5] examine Ethereum transaction ordering and model MEV-enabled staking yields, concluding that while MEV boosts proposer rewards, it may exacerbate proposer inequalities. Several analyses [
24,
25,
26] investigate PBS-related censorship risks, proposing CRlists—a mechanism enforcing transaction inclusion to combat censorship. Kilbourn et al. [
20] focus on builder centralization, highlighting how exclusive order flow creates advantages for certain builders. However, these community findings remain largely theoretical, lacking empirical validation. Yang et al. [
27] conduct early research on PBS by developing a systematic taxonomy of 30 MEV mitigation approaches and evaluate MEV auction mechanisms using comprehensive blockchain and MemPool data. Among prior studies, the work of Heimbach et al. [
11] is most closely related to ours, as they provide a comprehensive analysis of PBS’s impact on block validation and content. However, while their focus remains primarily on PBS’s ability to prevent censorship, our paper breaks new ground by systematically investigating PBS’s effects on ecosystem revenue distribution and decentralization. Our study represents one of the first empirical examinations of these critical economic dimensions.
Ethereum Decentralization Measurement: Gencer et al. [
28] assess decentralization by analyzing node network resources and interconnections. Gao et al. [
29] conduct graph analysis to evaluate centralization and network health in Ethereum. Lin et al. [
30] measure decentralization with respect to Bitcoin and Ethereum using diverse metrics and timescales. Zeng et al. [
31] measure Ethereum’s mining power decentralization from the aspect of pool participants. Lee et al. [
32] construct an interaction graph to conduct an extensive social network study on Ethereum. While previous studies have examined centralization primarily from the perspective of network structure, our research introduces an economic dimension to this analysis. Specifically, we investigate whether PBS participants can equitably acquire revenue and explore whether MEV gains will give rise to new decentralization risks.
5. Proposer Revenue in PBS
The success of PBS fundamentally depends on proposers who commit substantial assets to blockchain consensus. Post-Merge, with the elimination of the ETH 2 block proposal reward, MEV and priority fees have become proposers’ primary income streams. PBS ensures sustainable adoption by creating robust economic incentives through two key mechanisms: (1) augmenting overall block rewards and (2) directing the majority of rewards to proposers. This section empirically examines PBS’s impact on proposer revenue, demonstrating rapid PBS adoption rates, measurable increases in proposer earnings, quantitative analyses of reward enhancement, and the verification of predominant reward allocations to proposers.
5.1. Rapid Adoption of PBS Blocks
Based on our identification of PBS blocks, we track the daily proportion of PBS blocks following the Merge, starting from 16 September 2022.
Observation 1: PBS adoption surged rapidly after MEV-boost’s deployment, reaching the peak within two months. Figure 2 presents the daily distribution of block types and PBS adoption rates, where Type 1 blocks are characterized by builder-fee allocation (fee recipient = builder address) while Type 2 blocks follow proposer-fee allocation (fee recipient = proposer address). Under Ethereum’s PoS consensus, while the total daily block production remains stable, PBS blocks demonstrate rapid adoption growth within two months post-MEV-boost implementation. The PBS adoption rate increased from 18.3% (16 September 2022) to over 80% (18 October 2022), subsequently maintaining this level. Our analysis of 1,619,783 blocks reveals that PBS blocks account for 81% (1,311,840 blocks) of the total. A temporary decline in PBS adoption occurred on 13 April 2023 following the
Shapella Upgrade, which required system updates for network participants (proposers, relays, and builders), temporarily disrupting PBS functionality.
5.2. Enhanced Proposer Revenue Through PBS
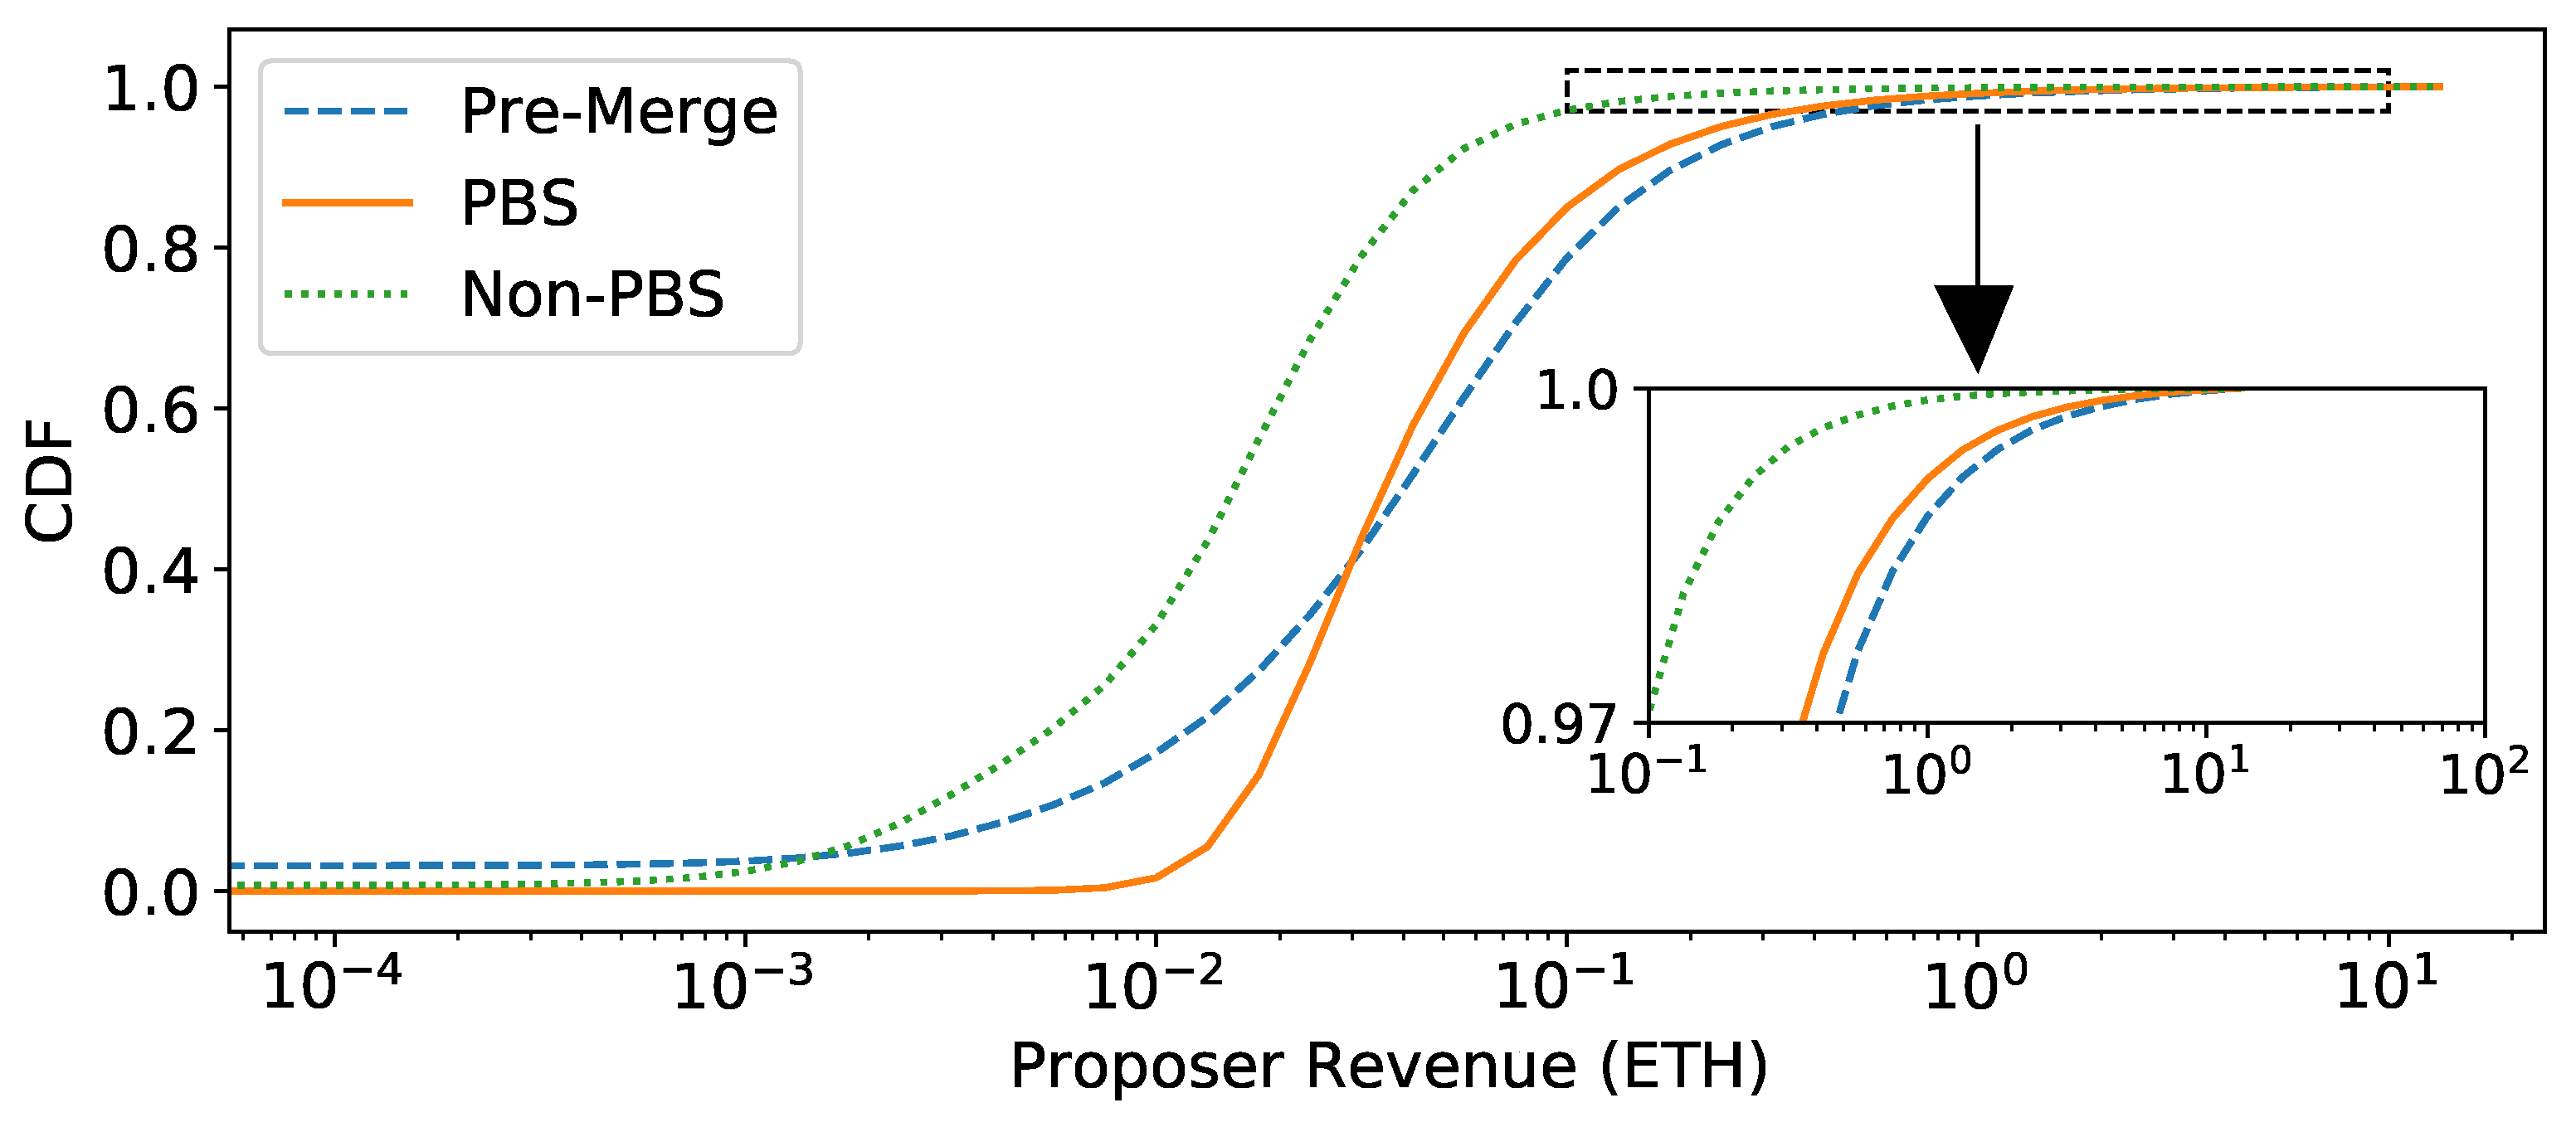
We compare proposer revenue distributions via cumulative distribution functions (CDFs) for PBS, Non-PBS, and Pre-Merge blocks from 1 March 2022 to 30 April 2023 in
Figure 3.
Observation 2: PBS simultaneously raises the ETH 0.01 revenue floor and preserves 1 ETH+ yields, with consistently higher average revenue than Non-PBS blocks. First, PBS establishes a robust revenue floor by reducing the proportion of blocks earning less than ETH 0.01 to just 0.4%. This contrasts sharply with Non-PBS blocks at 25.6% and Pre-Merge blocks at 13.4%. Second, PBS maintains competitive high-yield potential, as 1.2% of its blocks achieve at least ETH 1 in revenue. By comparison, only 0.2% of Non-PBS blocks reached this threshold, while Pre-Merge blocks performed slightly better at 1.7%. Most significantly, PBS demonstrates consistent superiority across all revenue percentiles, delivering a 104% increase in median earnings over Non-PBS blocks while maintaining comparable advantages at both the 25th and 75th percentiles. These results confirm that PBS has a measurable impact on proposer incentives, as clearly demonstrated in
Table 2, by simultaneously eliminating extreme low rewards while sustaining access to MEV-driven premium opportunities.
5.3. PBS Boosts Block Rewards
We further compare PBS and Non-PBS blocks to evaluate their impact on block reward distribution. Our analysis reveals that PBS blocks consistently achieve higher total rewards, which are attributable to two key factors: (1) their capacity to include more transactions per block and (2) the more efficient extraction of MEV profits through optimized transaction ordering. We next present empirical evidence quantifying these findings.
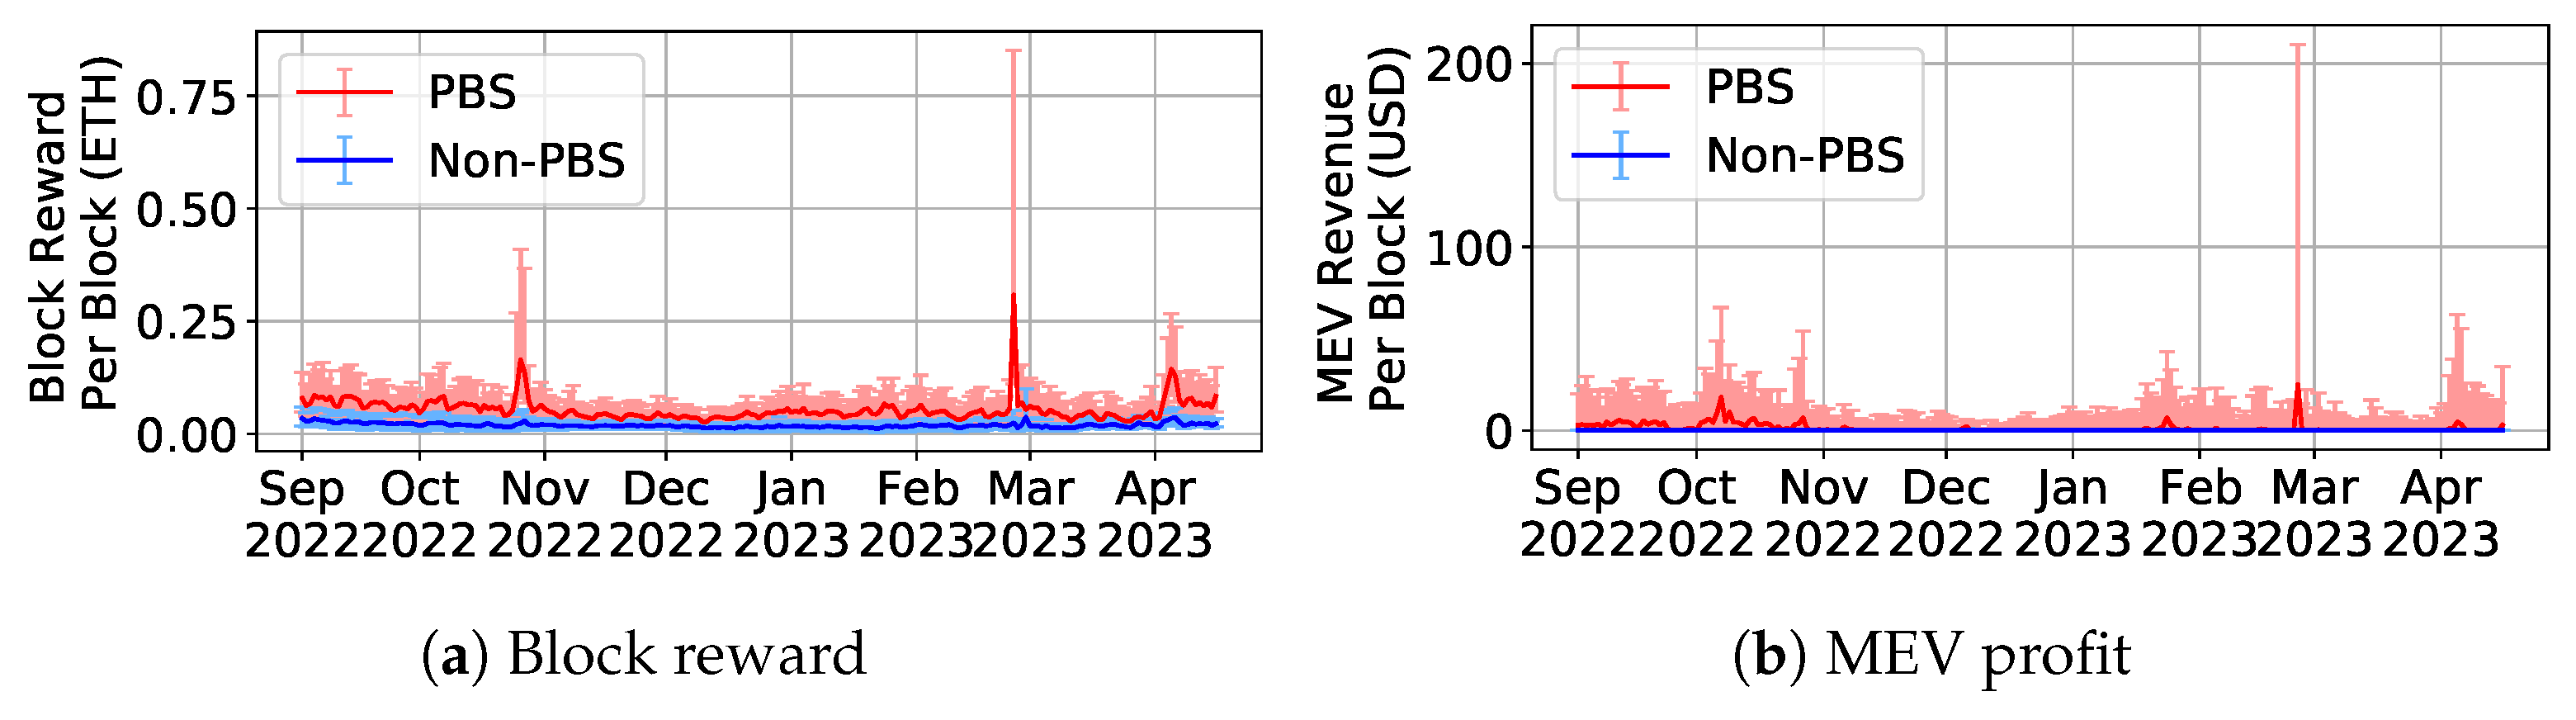
Observation 3: PBS blocks consistently achieve higher rewards than Non-PBS blocks through superior MEV extraction. Our analysis reveals that PBS blocks consistently achieve superior reward performance compared to Non-PBS blocks by fundamentally improving MEV extraction efficiency.
Figure 4a presents the 25th, median, and 75th percentiles of block rewards for both PBS and Non-PBS blocks over a 227-day period. Specifically, PBS blocks demonstrate a median daily increase of at least 46% in rewards, with an average surge of 236.1%. A one-tailed Mann–Whitney U test, conducted at a 0.01 significance level, confirms that PBS block rewards exceed those of Non-PBS blocks on every single day of the observed period. Furthermore, the observation extends to block utilization, where PBS blocks accommodate a greater number of transactions. The median number of trade transactions within PBS blocks consistently surpasses that of Non-PBS blocks by at least 5%. This elevated transaction volume not only enhances block activity but also contributes to the robustness of block rewards. Additionally, PBS blocks exhibit a higher frequency of MEV transactions, averaging 0.82 MEV transactions per block, in contrast to Non-PBS blocks, which average only 0.13 per block. This disparity further bolsters the reward capture capability of PBS blocks, underscoring their superior performance in reward accumulation.
We further analyze the MEV revenue of different blocks, as shown in
Figure 4b. PBS blocks consistently exhibit higher or equal 25th, median, and 75th percentiles of MEV revenue compared to Non-PBS blocks. For the 75th percentile, PBS blocks consistently surpass Non-PBS blocks by at least 4.12 times daily. This validates that PBS blocks consistently receive greater tips from MEV transactions, aligning with the widely held belief that MEV seekers prefer the security of transaction bundles sent via private transactions to builders. In summary, PBS improves block utilization and integrates a greater number of MEV transactions, leading to heightened block rewards in comparison to Non-PBS blocks. This can be attributed to the following: (1) builders utilizing more efficient monitoring and block construction strategies to promptly identify high-value transactions within the candidate pool; (2) MEV searchers and users choosing private transactions with reputable builders to reduce the risk of potential attacks [
9].
5.4. Proposers Reap Most Block Rewards
To quantitatively analyze the reward allocation between the proposers and builders, we study the transfer of tips from 16 September 2022 to 30 April, analyzing a total of 1,619,783 blocks. We calculate the sum of all priority fees and coinbase transfers (including base fees) to obtain the total transaction-derived block reward.
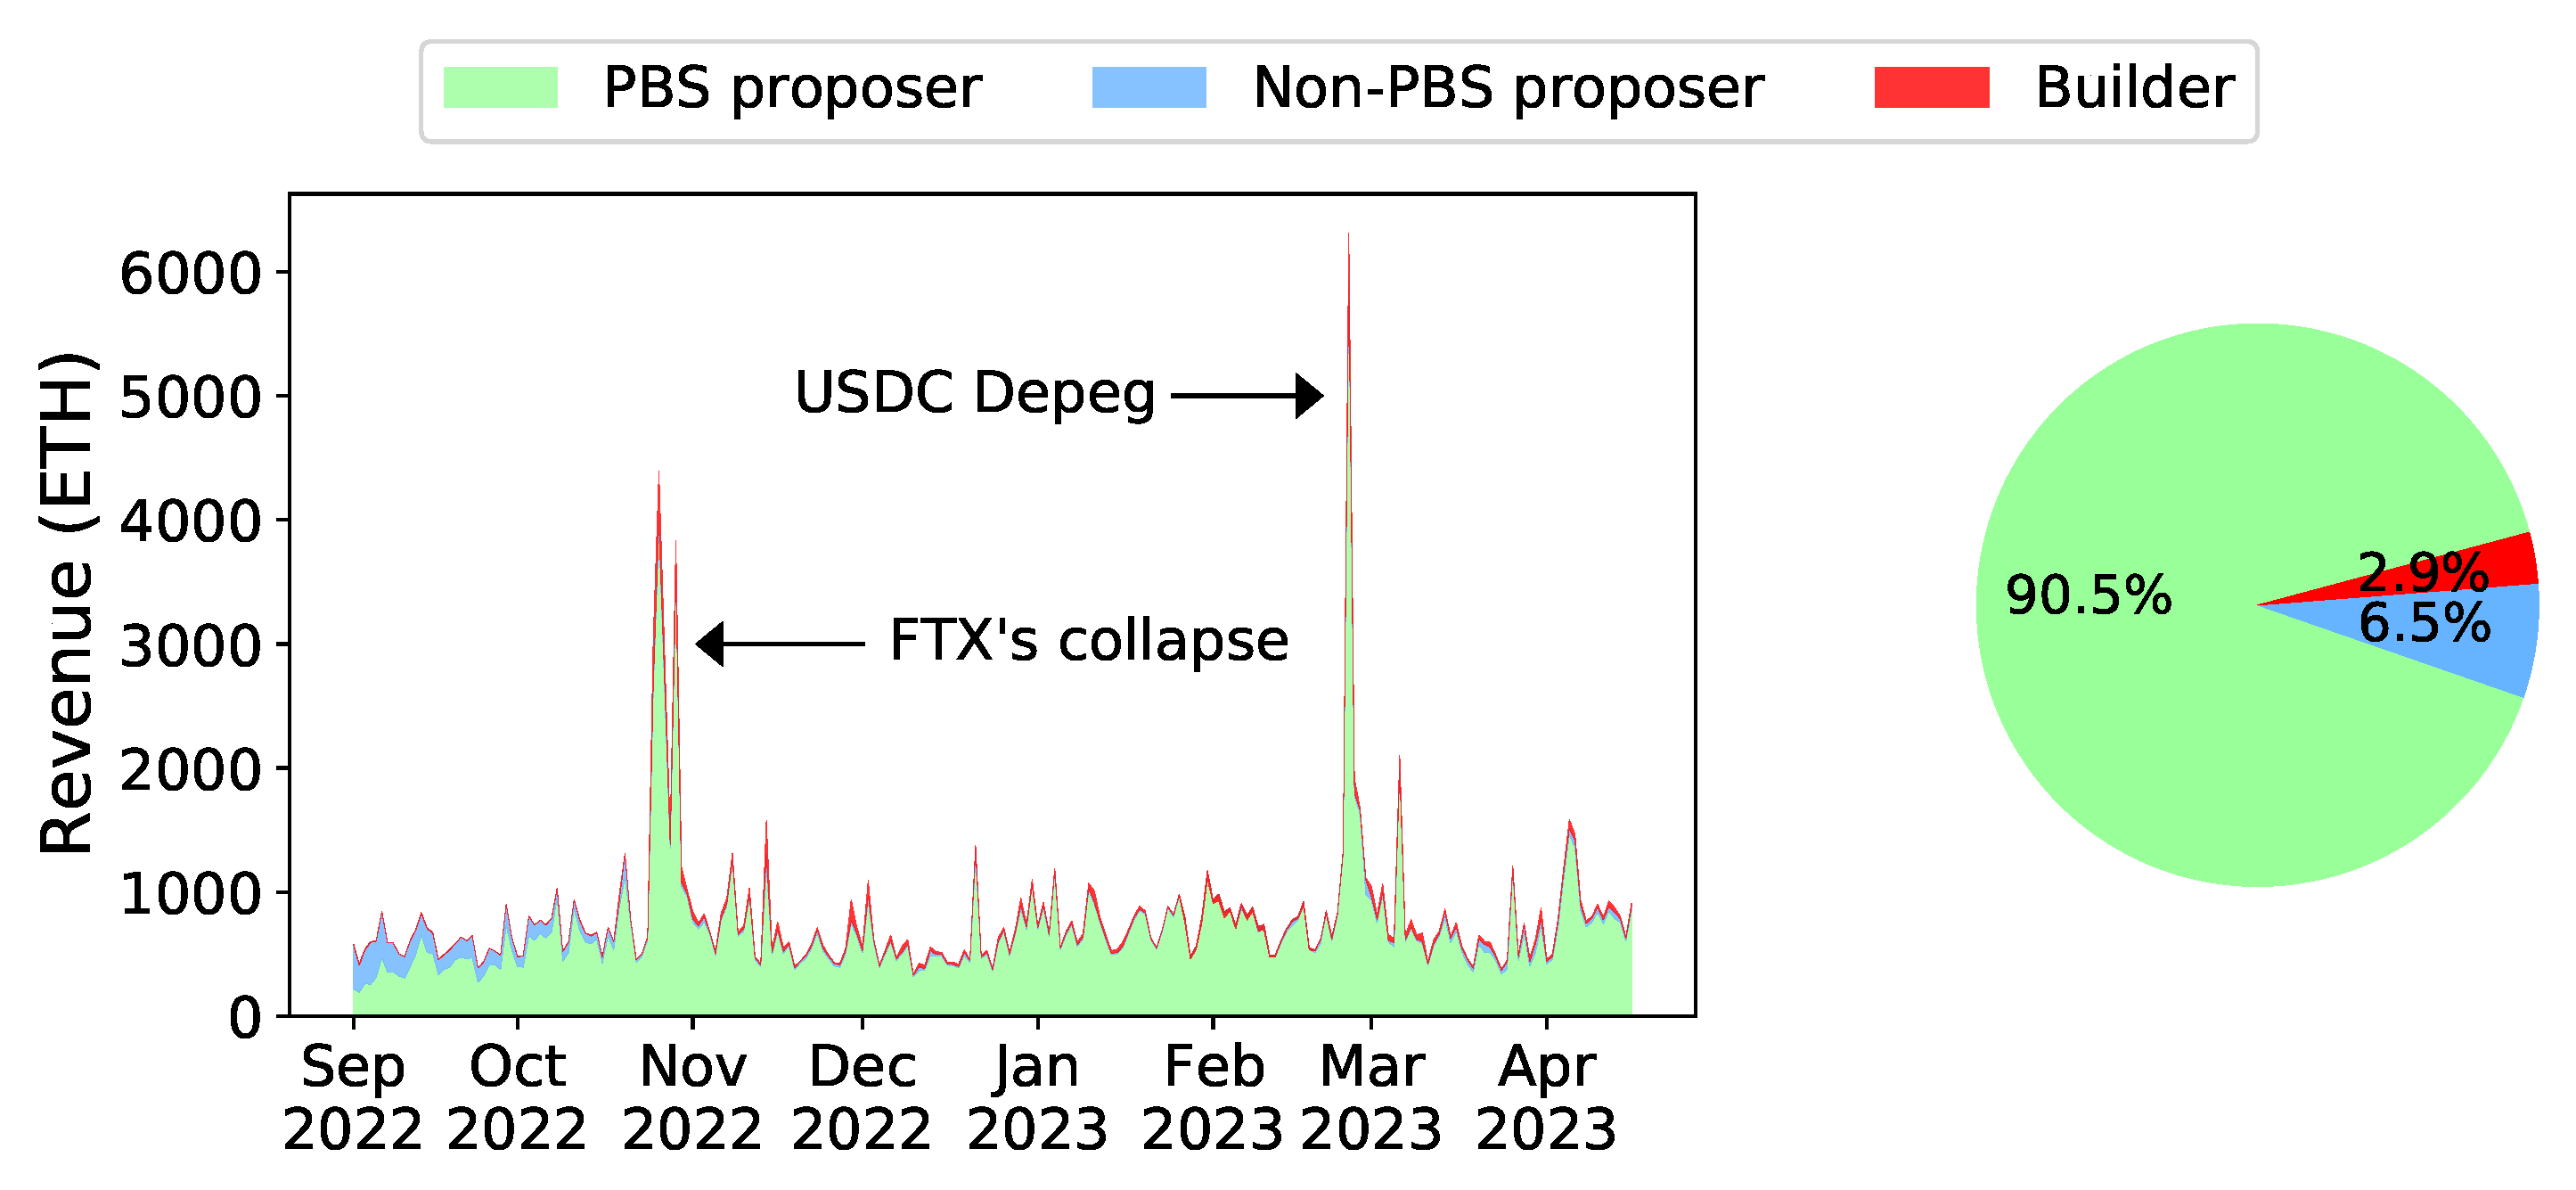
Figure 5 illustrates the daily revenue distribution for builders, along with the overall percentage of builder revenue.
Observation 4: Proposers receive most block rewards, with 97% of the block reward going to them. As can be seen from
Figure 5, proposers receive the vast majority of rewards, with a total of 97% of the rewards going to proposers. For 1,311,840 PBS blocks, users contribute ETH 169,380 as tips, averaging ETH 0.129 per block, with proposers securing ETH 163,540 in profits at an average of ETH 0.125 per block, while builders earn only ETH 5292 in total, averaging ETH 0.004 per block. Conclusively, the majority of block rewards flow to proposers, with 96.6% of rewards in PBS blocks and 97% for all blocks going to them, highlighting proposers’ crucial role in the PBS ecosystem. Furthermore, there are three notable peaks in proposer revenue, with the first two coinciding with the FTX breakdown [
44] in November 2022 and the third corresponding to the March 2023 USDC’s depeg [
45] caused by the breakdown of Silicon Valley Bank, which significantly increased market activity and resulted in more revenue for both proposers and builders.
6. Builder Revenue in PBS
In the PBS mechanism, builders require robust incentives to engage in the auction process. As detailed in
Section 4.2, we have calculated the builder revenue. Although builders have the potential to directly extract MEV, identifying self-extracted MEV poses a significant challenge. In particular, we observed that the vast majority of block rewards are channeled to proposers. Consequently, in this section, we delve deeper into the distribution of builder revenue, discussing their income situations and exploring the possible strategies underlying these observations.
6.1. Revenue Distribution
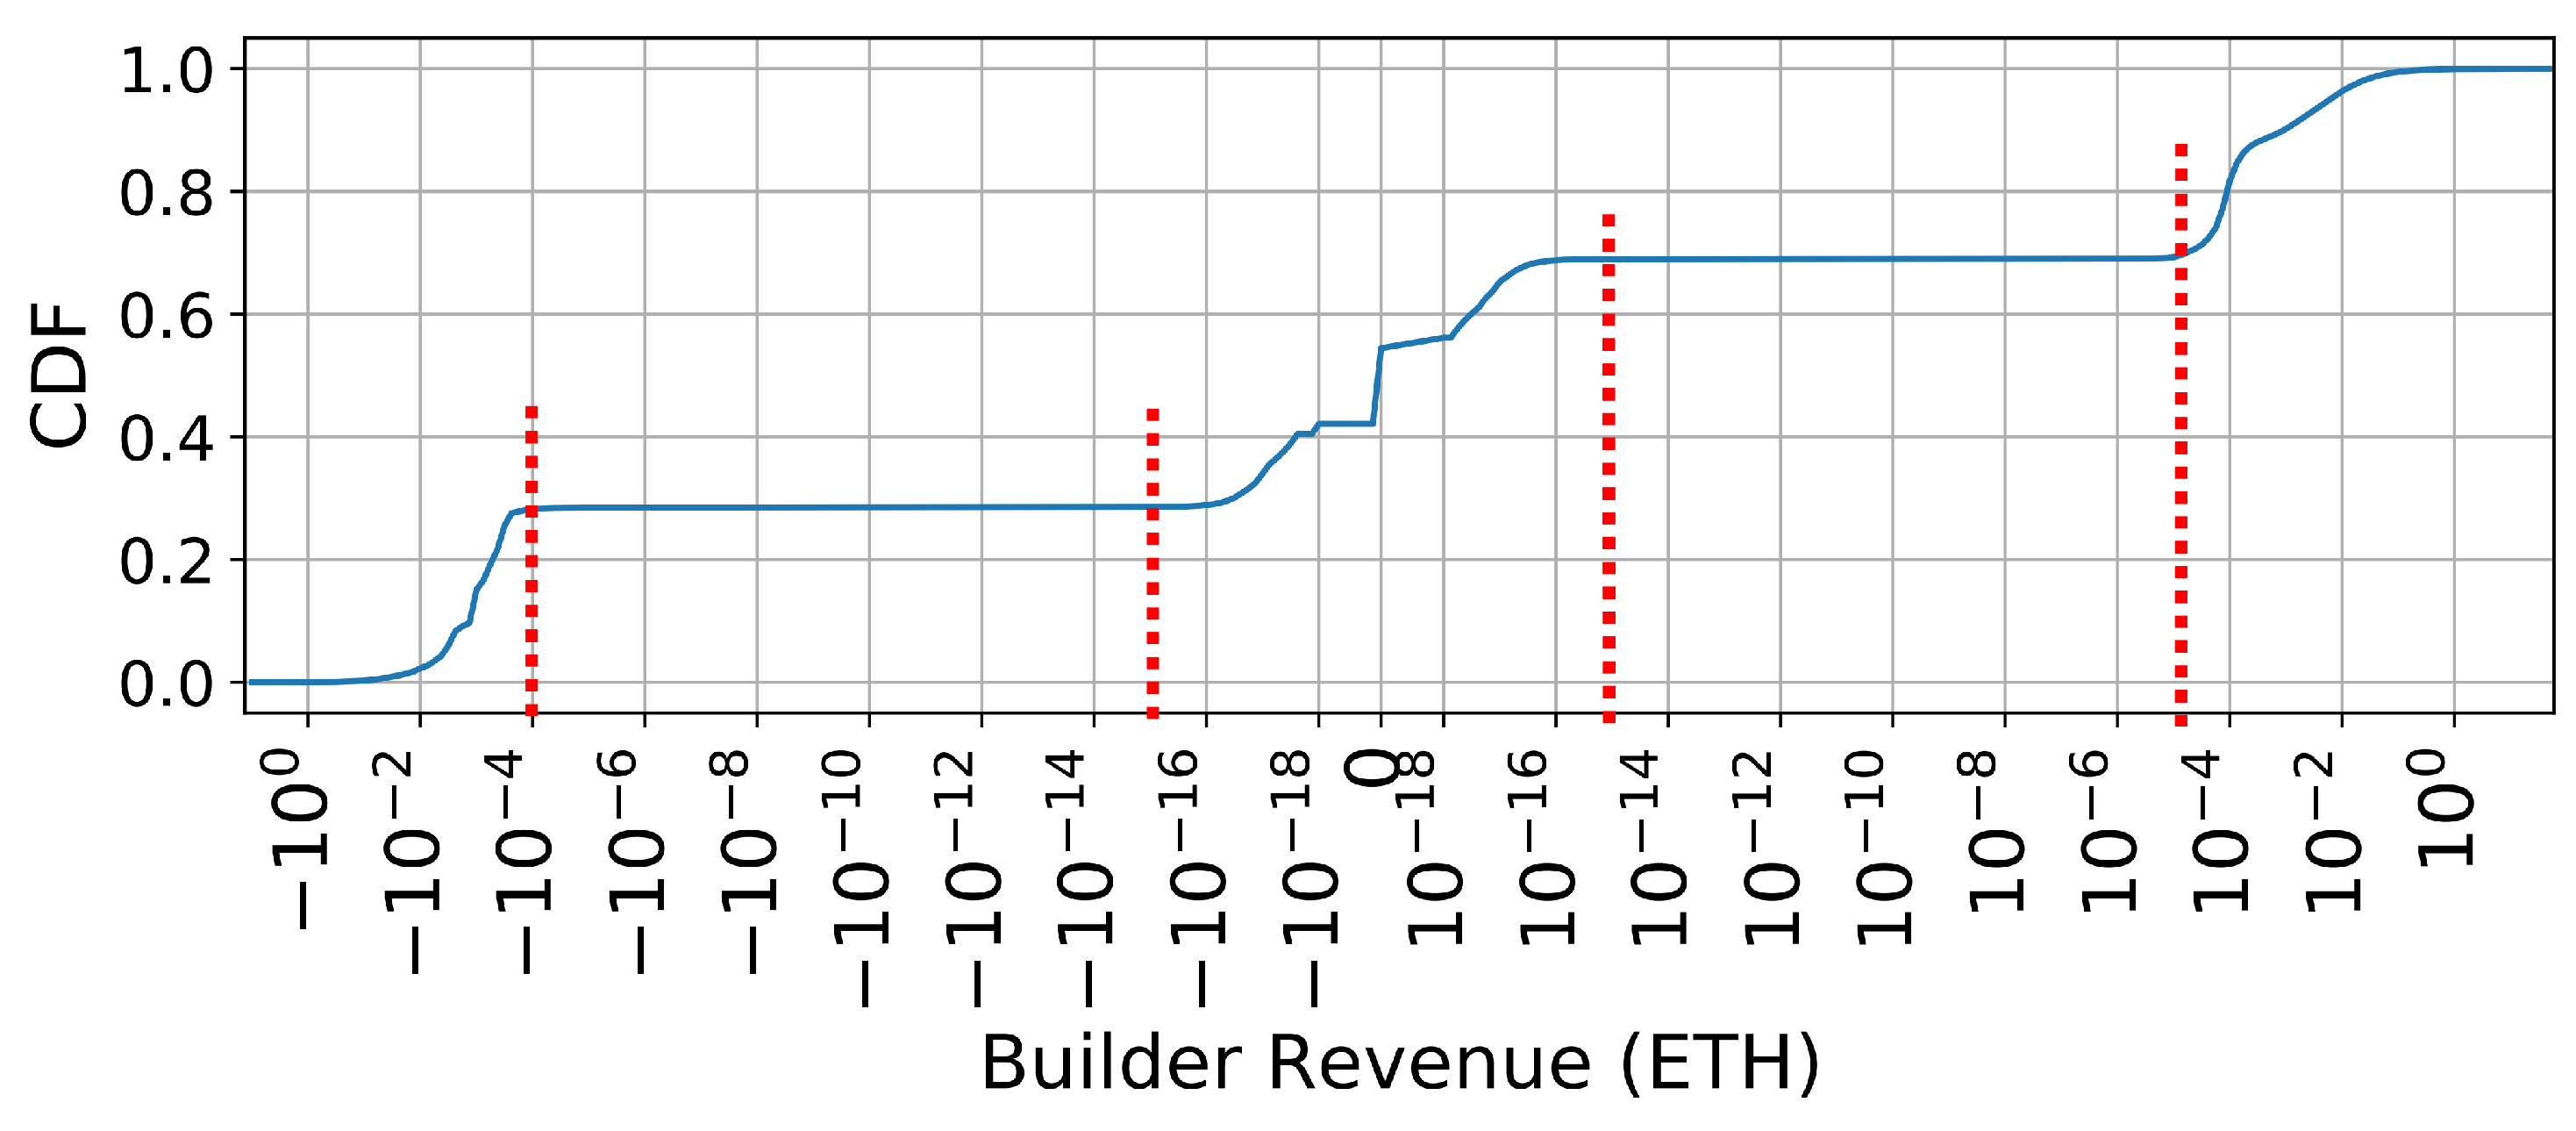
Observation 5: A striking clustering of builder revenue into three distinct regions emerges, with nearly a third of blocks resulting in builders subsidizing their participation. As illustrated in
Figure 6, this distribution highlights three prevalent scenarios within PBS auctions. (1)
Loss-making blocks: A significant 40.5% of PBS blocks fall into the builder revenue range of ETH
. In these instances, builder bids closely align with block rewards, suggesting that builders are unable to extract MEV beyond what is available in the MemPool. Consequently, the lion’s share of block rewards flows to proposers. (2)
Profit-making blocks: Representing 31.0% of PBS blocks, builder revenue in the range of ETH
indicates scenarios where builders bid substantially lower than the block rewards. This high builder revenue suggests the employment of unique MEV strategies or the inclusion of additional private transactions to construct high-reward blocks. (3)
Subsidy-paying blocks: Alarmingly, 28.5% of PBS blocks see builder revenue in the range of ETH
, revealing situations where builders incur losses by paying extra subsidies for block construction, effectively subsidizing their own participation in the auction.
Additionally, we observe that an increasing number of builders are opting to directly set the fee recipient of PBS blocks to the proposer, which is referred to as PBS Type 2. As illustrated in
Figure 2, the proportion of PBS Type 2 blocks within the total PBS blocks has risen from 0% to 36.9%. Furthermore, among the data points falling within the
range in
Figure 6, 10.6% are attributed to PBS Type 2 blocks.
From this, we can see that competition among builders is extremely fierce. At this stage, their primary focus is not on making profits but on capturing market share. Even if this means not making money or having to subsidize the blocks, builders are determined to secure more blocks. They utilize Type 2 blocks, which eliminate the transaction fee of the last payment to proposers, enabling them to place higher bids and increase their chances of winning a block. This strategy is driven by the understanding that producing more blocks will reduce the on-chain delay of the private transactions they receive, thereby attracting more users to send private transactions their way. In the long run, this can lead to increased revenue from private order flow.
6.2. Builder Strategy
Furthermore, our analysis reveals that certain leading builders subsidize the majority of their blocks while generating profits from others. Upon examining the top builders in the market, we found notable differences among them, indicating that they employ various strategies.
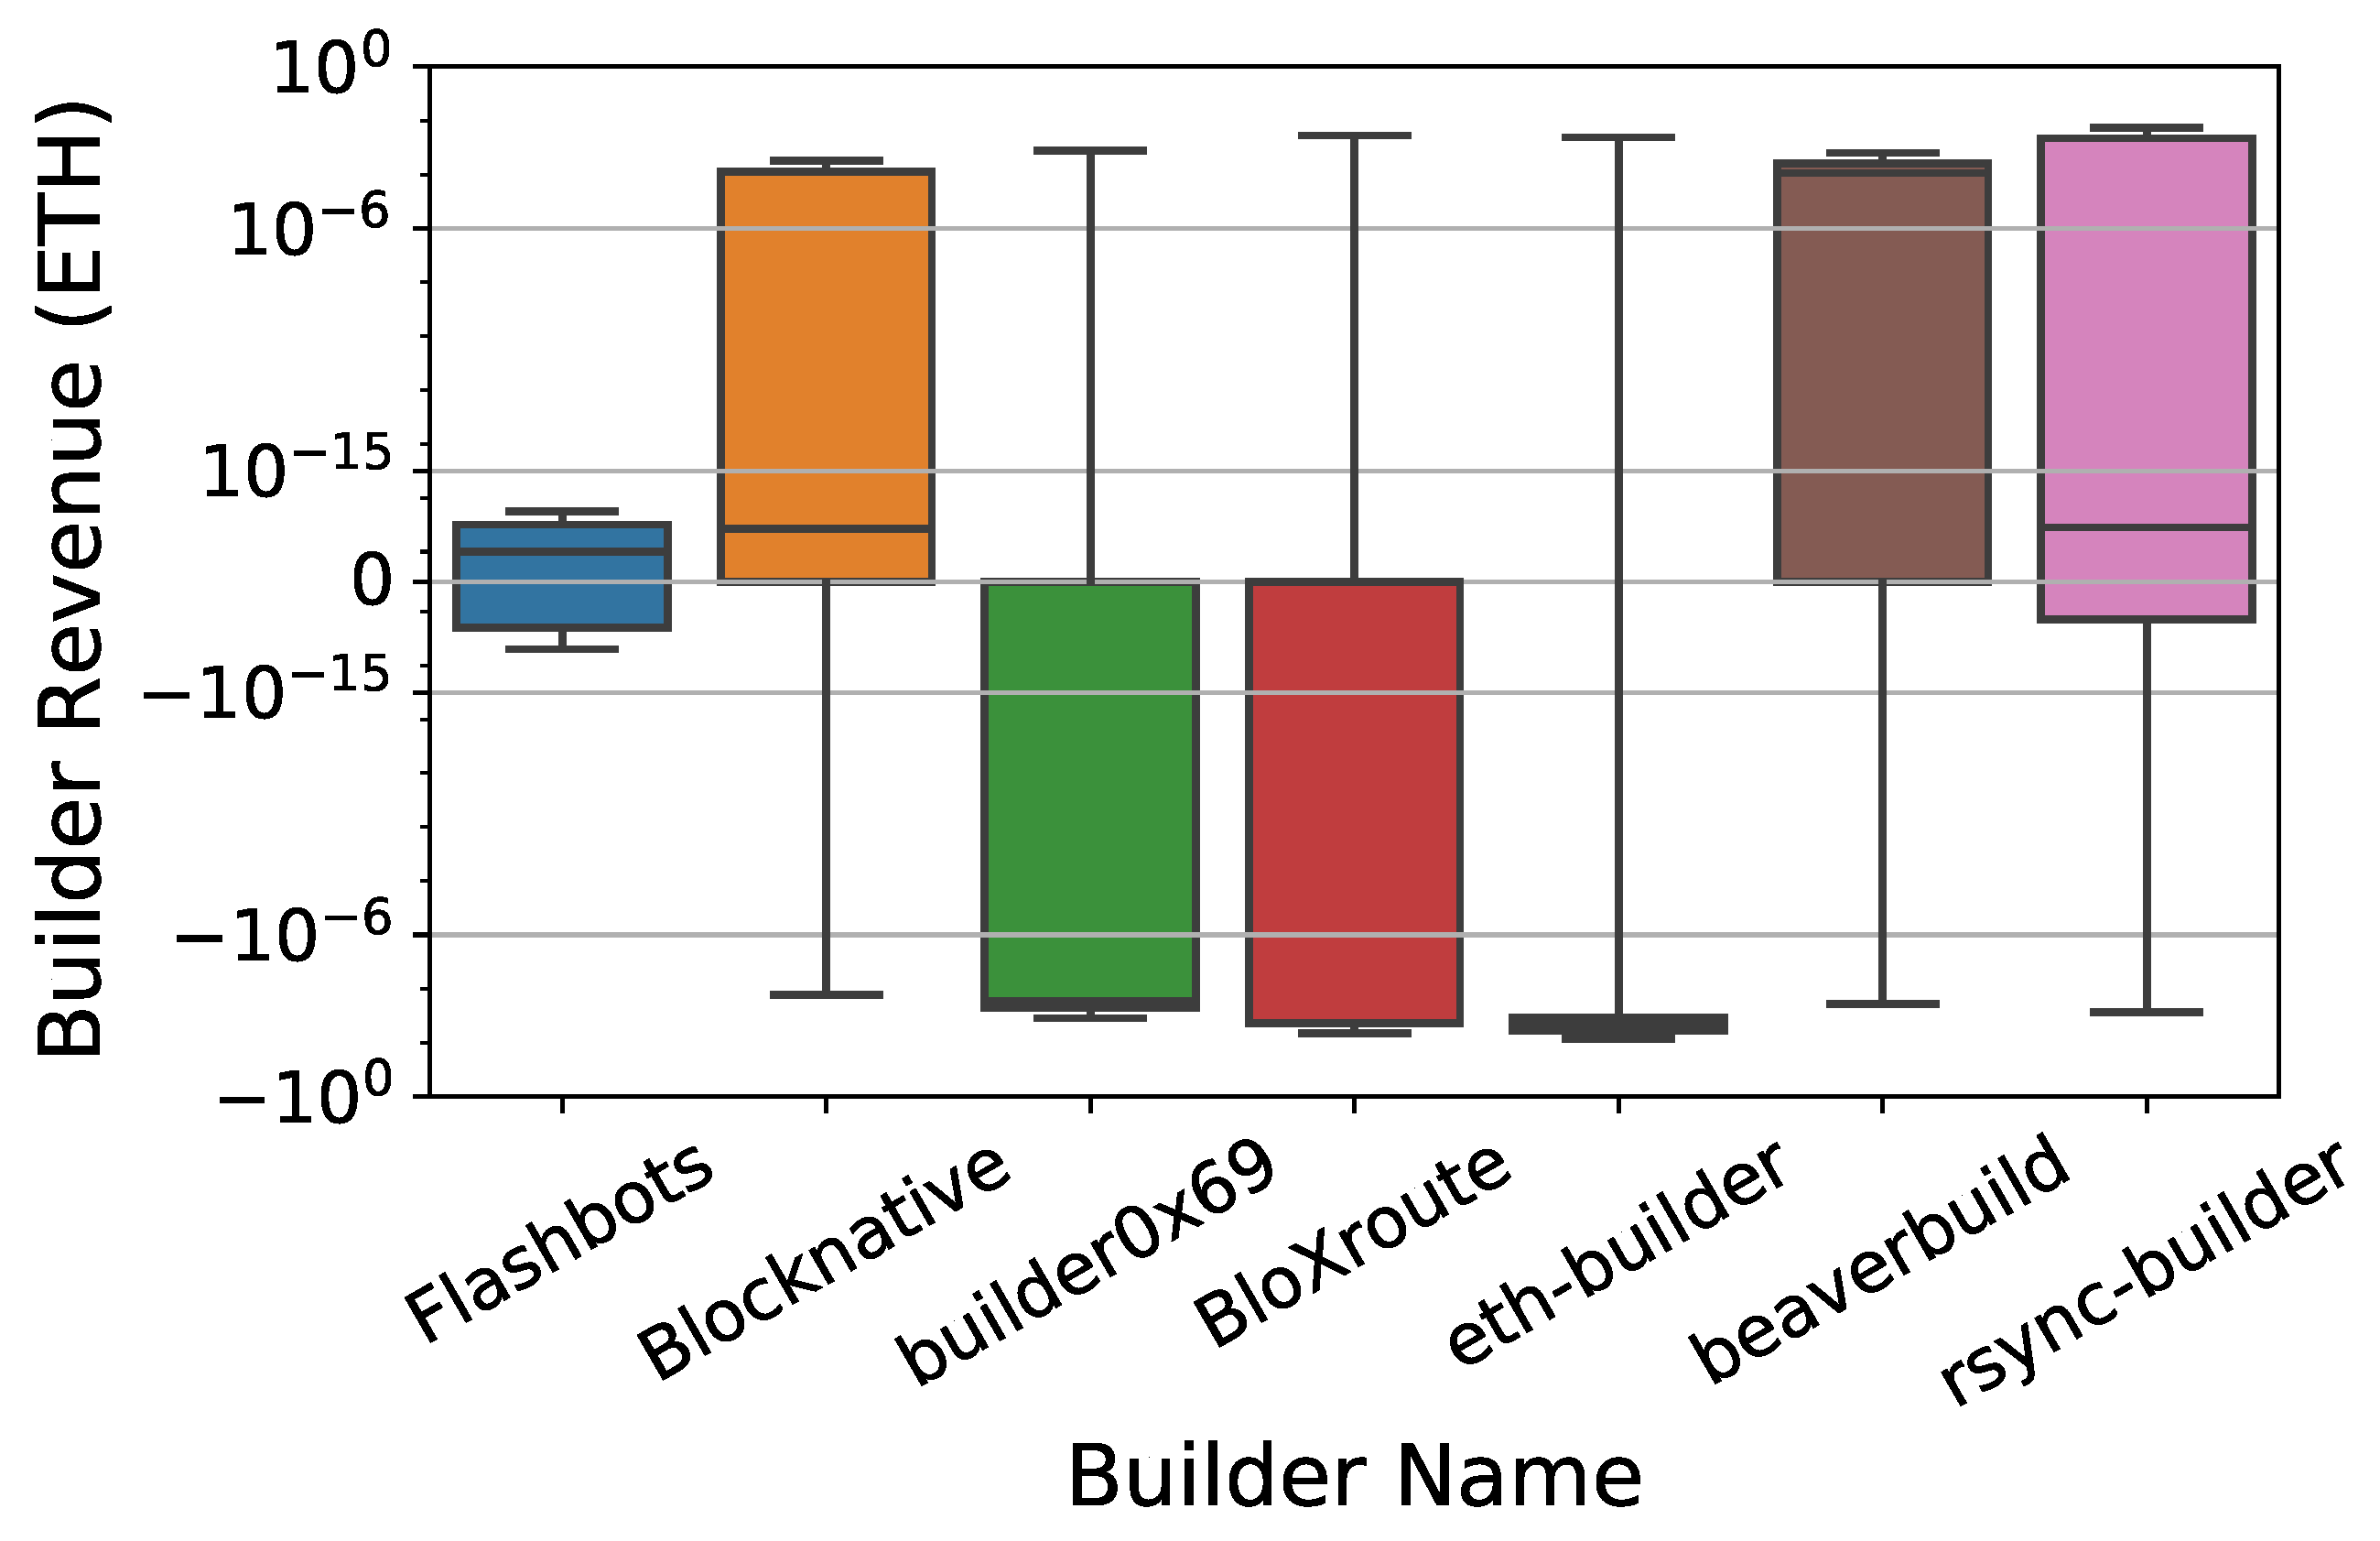
Observation 6: The top builders exhibit starkly different revenue outcomes, reflecting the diversity in their strategic approaches. Figure 7 illustrates the diverse revenue distributions among the top seven builders. We can see that
Blocknative and
Rsync-builder demonstrate a significant portion (52% to 69%) of blocks generating positive profits.
Flashbots stands out, with a high proportion (90.7%) of blocks yielding near-zero revenue. In stark contrast,
Builder0x69,
BloXroute, and
Eth-builder often subsidize block construction, with 81% to 91% of their blocks falling into this category. This underscores the considerable variations in strategies and performance among these builders.
As further detailed in
Table 3, we analyze each top builder’s number of subsidized blocks, as well as their maximum, average, and total subsidy amounts. We found that
Builder0x69,
Beaverbuild,
BloXroute, and
Eth-builder frequently provide subsidies for blocks. Notably, we observed that
Builder0x69 offers remarkably low subsidies per block, with a maximum of ETH 0.078 and an average of ETH 0.0005. On average,
Builder0x69 pays a subsidy of ETH 0.0005 per block across 204,780 blocks. It is reasonable to believe that
Builder0x69 offers modest block subsidies as a strategic move to gain an edge in highly competitive block auctions. This approach not only significantly boosts their on-chain success rate but also incentivizes a greater number of users and MEV searchers to submit private transactions to them, thereby enhancing their overall competitive advantage in the market.
It is interesting to notice that Beaverbuild provided a large amount of subsidies in some of its constructed blocks. It provides at least a subsidy of ETH 5 in 21 blocks, and we find that it provides ETH 56 as a subsidy in block 16,627,349. We examined these blocks and did not find significant MEV arbitrage in them. The reason for Beaverbuild’s large subsidy in these blocks is unclear, but we suspect that there may be time-sensitive transactions that require Beaverbuild to buy opportunities of block construction.
7. Decentralization Impacts of PBS
The PBS mechanism separates the functions of block construction and transaction bundle construction, with the aim of reducing disparities among proposers and preventing their centralization. However, the complexity of MEV transactions leads to variations in MEV capture capabilities among proposers and builders with different abilities, resulting in earnings disparities. These disparities have the potential to introduce new centralization risks, thereby posing a security threat to Ethereum. In this section, we investigate whether the PBS mechanism has successfully achieved its intended goal. We delve deeply into the roles of three key participants, including proposers, builders, and relays. We explore how the PBS framework may impact the decentralization and security of the Ethereum ecosystem.
7.1. PBS Improves Proposer Decentralization
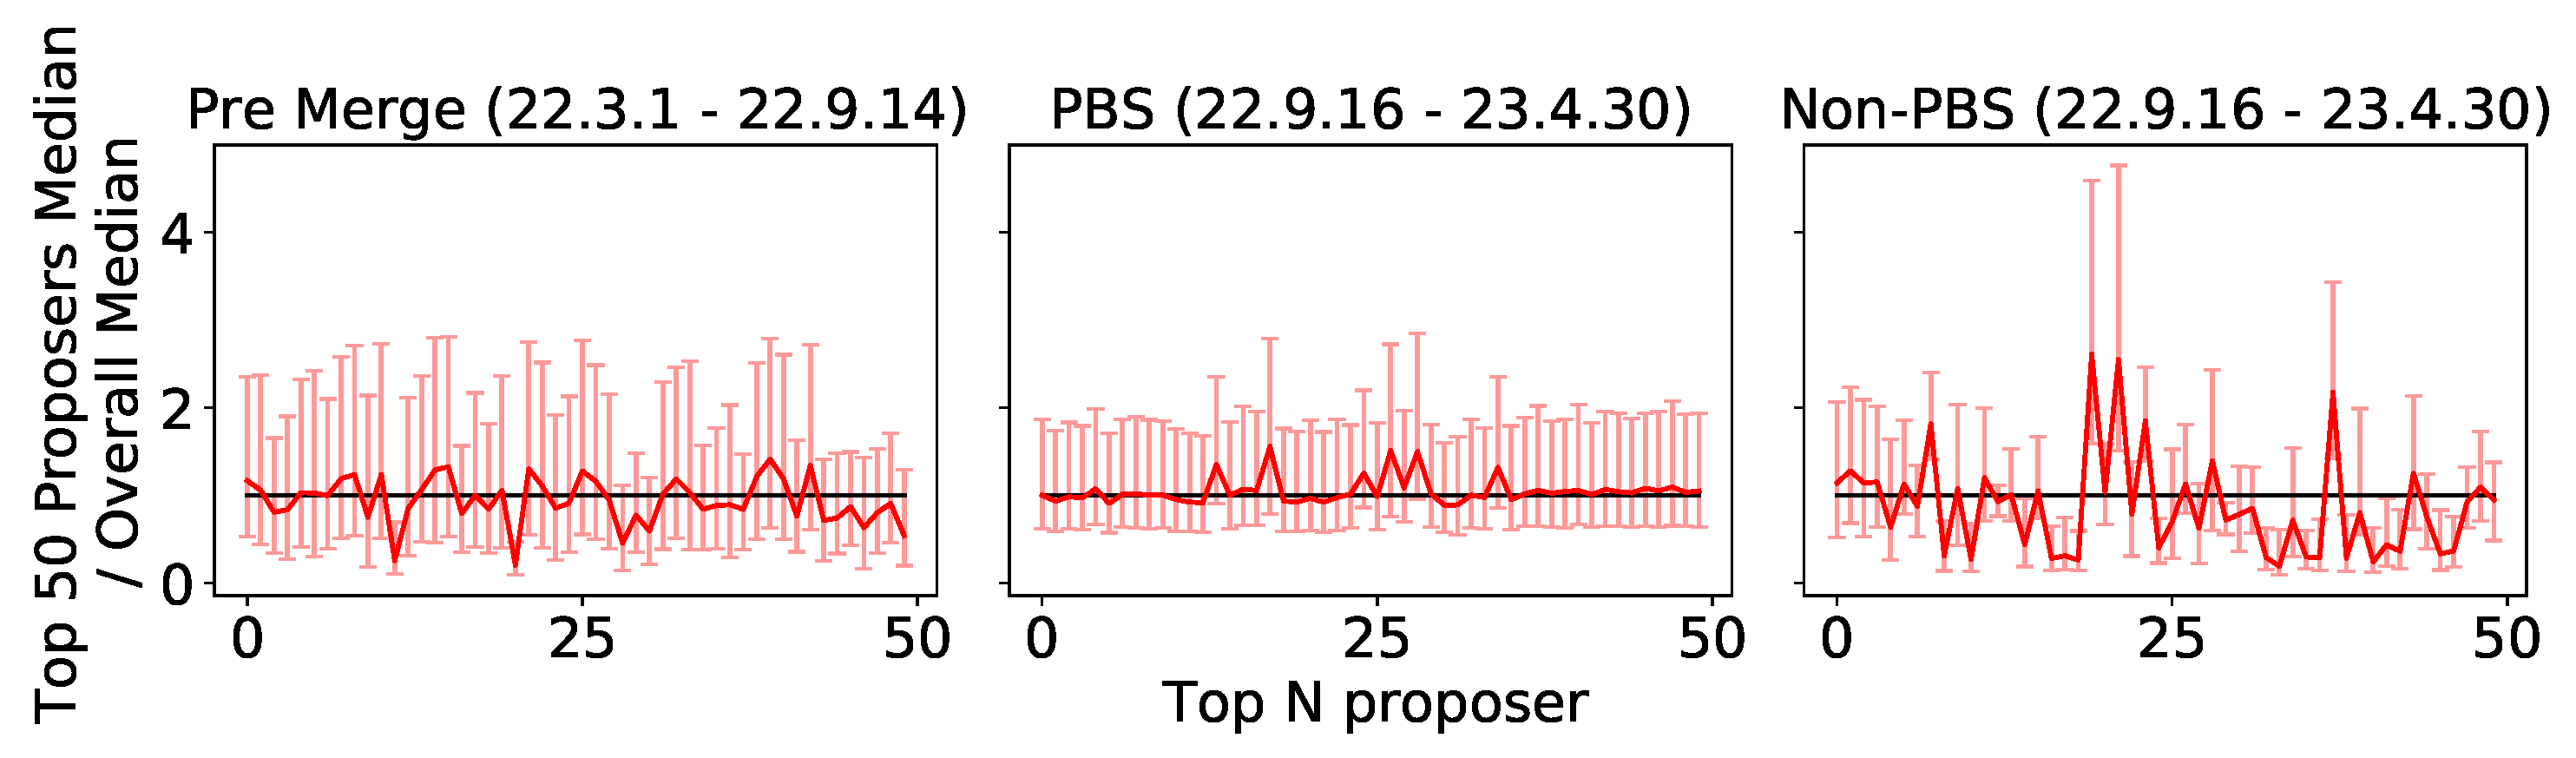
Observation 7: PBS guarantees proposers’ relatively fair earnings. Our analyses focus on the revenue of the top 50 proposers during three distinct phases: Pre-Merge, PBS, and Non-PBS. We normalize the 25th, median, and 75th quantile revenues per block to the aggregate median, allowing us to assess fairness across categories. As indicated in
Figure 8, PBS notably reduces the disparity in median revenues compared to both Pre-Merge and Non-PBS phases, showcasing enhanced fairness. This improvement is corroborated by the Gini index of the top 50 proposers’ average block revenue: 0.066 for PBS, contrasting with 0.345 for Non-PBS and 0.155 for Pre-Merge, highlighting a more equitable revenue distribution under PBS.
In addition to analyzing the distribution of revenue, we also examine the distribution of block production to assess the centralization of proposers under the PoS consensus mechanism and the PBS framework. To measure Ethereum proposer concentration, we employ two metrics, the evolving market share of the top n proposers and the proposer count, by varying block production volumes.
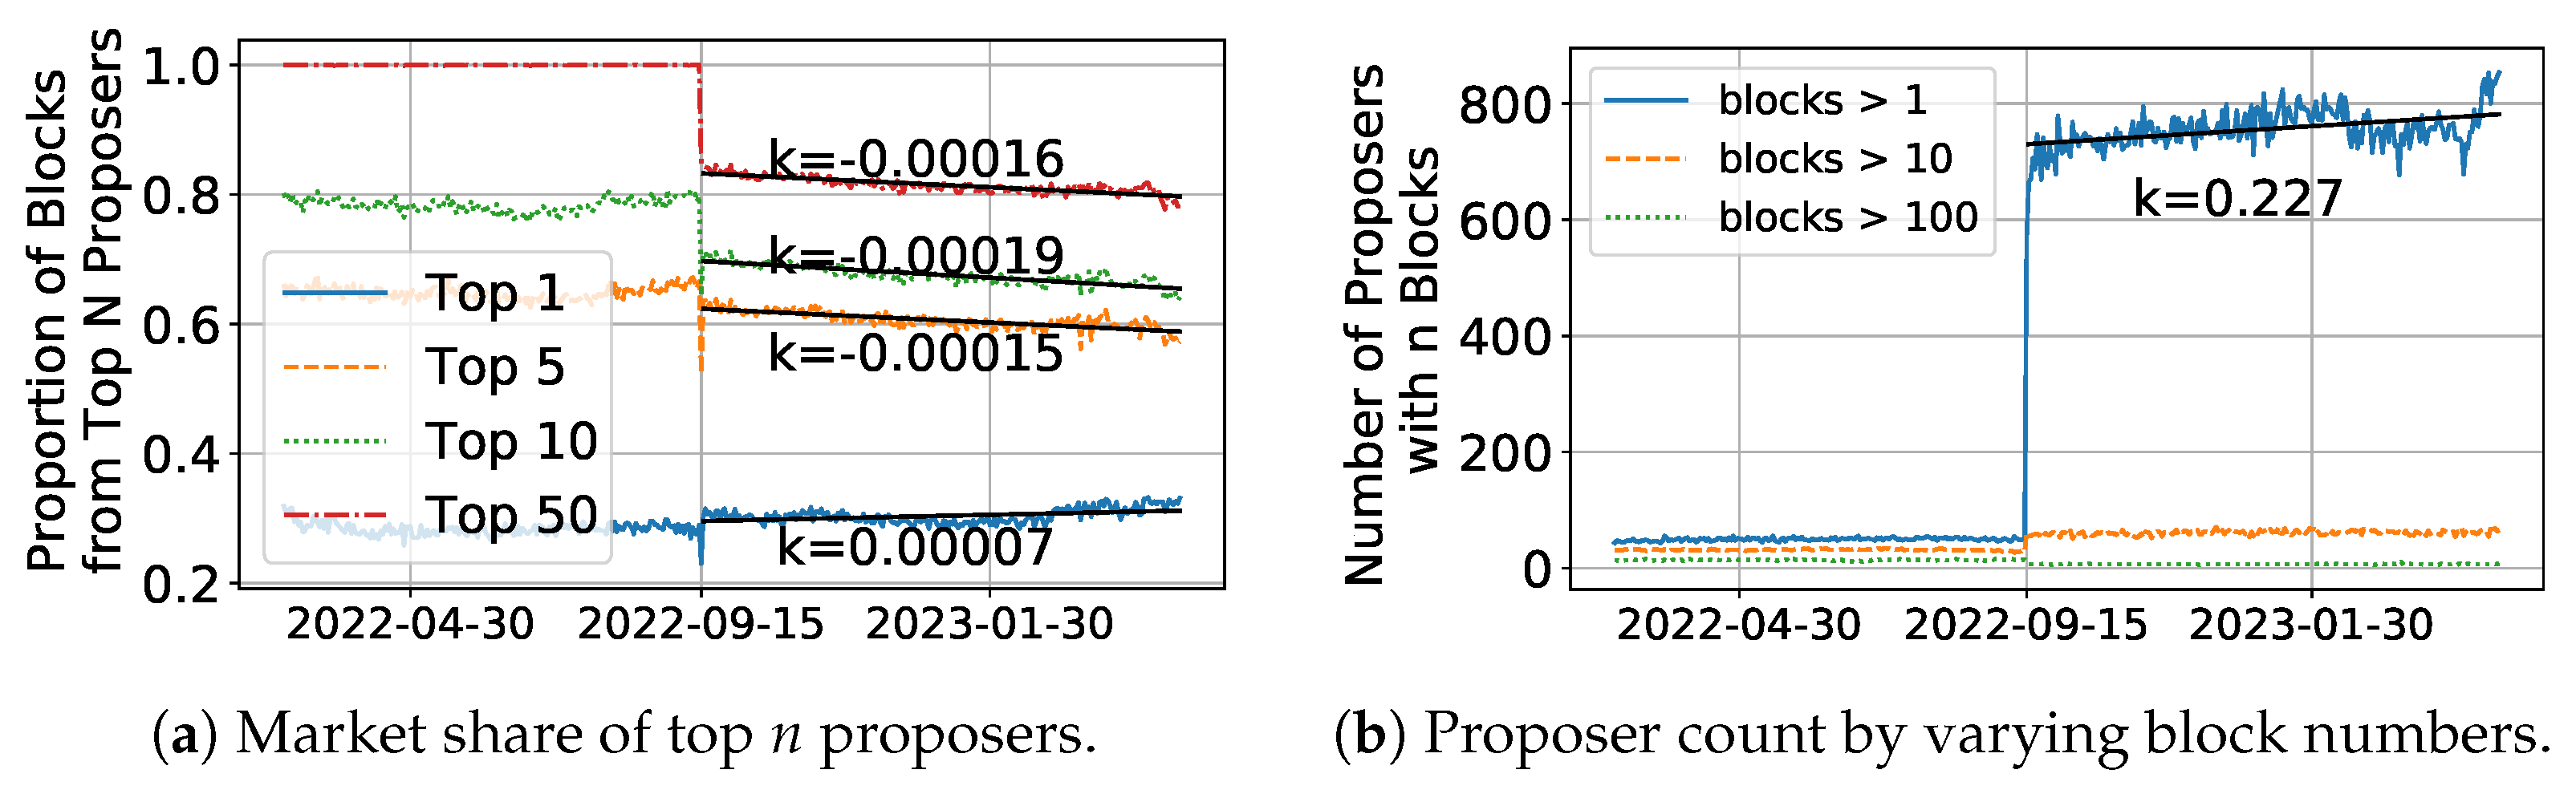
Observation 8: Ethereum’s shift to POS and PBS notably reduces proposer centralization. Figure 9a illustrates the change in the market share of the top
n proposers over time. After the Merge, the market shares of the top 5/10/50 proposers decreased by 16%/11%/5%. The linear fits of post-Merge for the top 5/10/50 reveal slopes of −0.00016, −0.00019, and −0.00015, indicating continuing declines. Although the market share of the largest proposer increases by 7%, its identification as Lido [
46], a decentralized staking protocol, does not pose a threat to Ethereum’s decentralization. Notably, there has been a marked increase in the number of daily block producers (those able to create at least one block per day) following the Merge, rising from 50 to 665, as depicted in
Figure 9b. Additionally, the number of proposers generating more than 10 blocks, as well as those producing over 100 blocks, has grown steadily over time. This trend underscores the significant role of PBS in democratizing participation within the network, effectively attracting a broader validator base.
In summary, PBS has effectively improved revenue fairness among Ethereum proposers while mitigating centralization risks. By streamlining MEV extraction and distributing rewards more equitably, PBS encourages broader validator participation, thereby reducing the dominance of large actors. It is worth noting that PBS operates within Ethereum’s PoS framework, where the synergy between proposer–builder separation and stake-based consensus further reinforces decentralization. Ultimately, PBS serves as a critical—but not standalone—component in sustaining a healthy and decentralized ecosystem.
7.2. PBS Enables Builder Decentralization
As a newly introduced role in the PBS mechanism, builders warrant separate examination for potential centralization trends. While previous sections focused on proposer centralization, this section specifically investigates whether private transactions could lead to builder centralization. Our analysis of current builder market share and private transaction distribution reveals no significant centralization tendencies.
Observation 9: PBS demonstrates builder decentralization through market share dispersion. Figure 10a demonstrates the evolving decentralization of block production. Initially,
Flashbots dominated as the primary builder, controlling over 80% of blocks. However, within two months of PBS implementation, new builders emerged and gained significant traction:
Builder0x69 and
Beaverbuild progressively increased their market shares, while
Flashbots’ dominance rapidly declined to below 50% in terms of market share—no longer holding majority control. By April 2023, the market distribution showed a healthy equilibrium:
Builder0x69 accounted for 27.5% of blocks,
Flashbots reduced to 17.7%, Beaverbuild captured 22.0%, and
Rsync-builder held 18.1%. This redistribution illustrates PBS’s effectiveness in promoting builder decentralization, as no single entity maintained sustained dominance.
The linear regression of the top builders’ market shares in
Figure 10b shows consistent negative slopes (k < 0) for all cohorts (top 1/3/5/10 builders), confirming a strong decentralization trend. While existing research suggests private orderflow would promote builder centralization [
20,
24,
26,
47], our data reveal that the top builder’s share stabilized around 30%, with the top three collectively maintaining approximately 70% of the market share. This distribution, coupled with users’ natural tendency to distribute transactions across multiple builders, demonstrates that private transactions have not led to the predicted centralization effects under PBS. The competitive builder market and PBS framework’s design effectively prevent any single entity from gaining sustained dominance.
Observation 10: Users generally prefer utilizing multiple builders. To further assess builder decentralization, we analyze user preferences in builder selection through
Table 4, focusing exclusively on active users (April 2023, >100 transactions). The data reveals strong multi-builder adoption patterns. The data shows remarkably low single-builder adoption rates, with only 3.226% of MEV searchers and a mere 0.166% of regular users exclusively relying on a single builder. Instead, significant portions of users (24.195% for MEV and 2.119% for regular transactions) distribute their transactions across multiple builders (2–7). And there is a larger proportion of users opting for more than seven different builders. This widespread multi-builder usage pattern demonstrates users’ inherent preferences for builder diversification rather than showing loyalty to any particular builder. By randomly submitting transactions to different builders, users not only achieve reduced latency through parallel processing but also effectively fragment private orderflow, thereby preventing the concentration of market power. These empirical findings clearly indicate that user behavior under PBS actively counters potential centralization forces, maintaining a healthy decentralized builder ecosystem despite concerns about private transactions promoting centralization.
7.3. PBS Promotes Relay Network Decentralization
In the PBS mechanism, relays serve as trusted third parties that play a crucial dual role: safeguarding block contents while ensuring that proposers receive valid blocks without being able to steal builders’ block value. Our research identified a noteworthy trend where major MEV participants—including Flashbots, BloXroute, and Blocknative—established their own relay networks. Since builders often run their own relays, we analyze whether this hurts decentralization and weakens the trust in PBS.
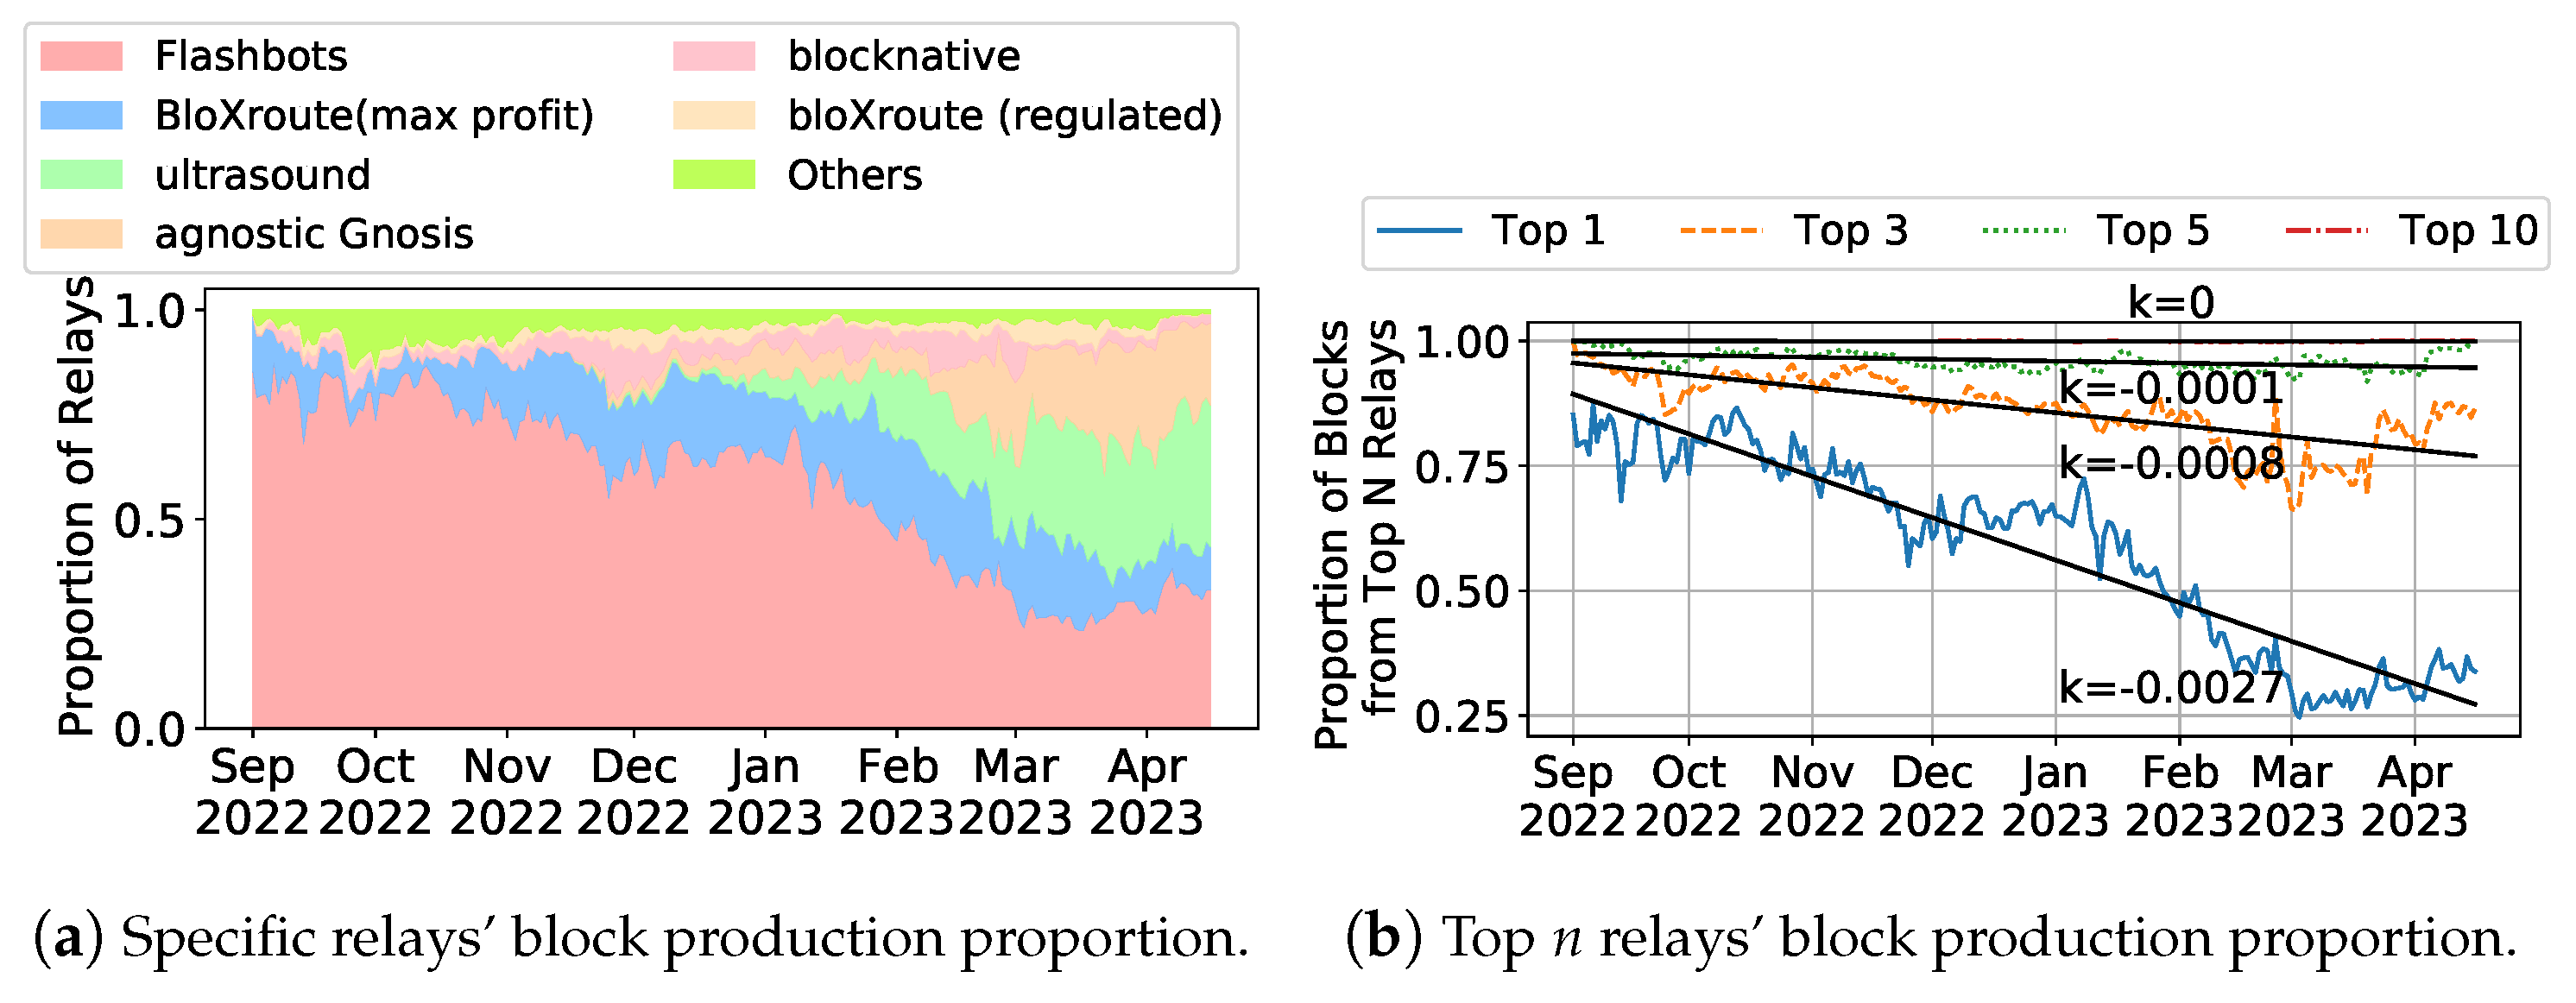
Observation 11: Relay market remains decentralized with presence of builder-operated relays. During the observation period (September 2022–April 2023), the relay market exhibited clear decentralization trends.
Figure 11a demonstrates this shift: Flashbots’ initial 80% market share progressively eroded to 30% by April 2023. The trends in
Figure 11b further underscore this decentralization, showing the top three relays’ combined market share declining at a daily rate of 0.07%, ultimately stabilizing at approximately 75% of the total blocks. This equilibrium, achieved despite the presence of builder-operated relays, indicates healthy competition and the absence of monopolistic consolidation in the relay layer. Although operating relays provide no direct economic incentives, eight independent organizations have voluntarily launched their relay services. A notable example is BloXroute, which maintains three distinct relay implementations featuring differentiated designs, including specific protections against front-running. This phenomenon can be attributed to strategic advantages for builders—operating dedicated relays significantly reduces latency and accelerates bid delivery to proposers [
47] while simultaneously contributing to network-level decentralization through increased relay diversity.
8. Discussion: Decentralization Risks in PBS
In this section, we examine potential security risks introduced by the PBS mechanism. While PBS strengthens Ethereum’s security by decentralizing block production, these improvements hinge on critical trust assumptions regarding builders and relays. Specifically, PBS requires four key trust relationships: (1) Users trust builders to refrain from front-running their swap transactions. (2) MEV searchers trust builders to maintain MEV bundle integrity. (3) Builders trust relays to conduct auctions fairly and maintain bid confidentiality. (4) Proposers trust relays to faithfully deliver the highest-bid block. Violations of these trust assumptions pose serious systemic risks, as evidenced by the
$20M exploit on Ethereum (block #16,964,664) [
48]. In this incident, a relay software flaw permitted invalid block headers to propagate, enabling MEV theft—highlighting how critical these trust dependencies are and how costly their failure can be.
At present, the decentralization trend does not have an obvious monopoly. Various parties are actively competing for market share. However,
Section 5 results reveal troubling signs: 40.5% of blocks yield near-zero builder profits (ETH
), while 28.5% show outright losses (ETH
) as builders pay to win blocks. While this competitive environment currently discourages deliberate market disruption, the emerging “race to lose money” could unintentionally harm decentralization. Smaller builders may be forced out, while deep-pocketed participants gain transaction flow advantages that could later be exploited—especially given PBS’s structure, where multiple builders/relays access transaction data pre-confirmation. This “lose money to win” strategy, similarly to ride-sharing apps’ USD 1 promotions, which eliminated competitors before raising prices—may ironically create new centralization pressures despite PBS’s original goal of preventing single-point dependencies. While long-term data remains limited, we are open-sourcing our analysis tools to monitor builder profits and market concentration as part of ongoing research into these risks.
Consequently, in the event of an attack based on leaked transactions, it becomes increasingly difficult for the community to accurately identify the source of the leak. The nature of decentralization and multi-option engagement makes it challenging to precisely attribute blame, which in turn diminishes the effectiveness of the reputation system as a deterrent against attacks. Therefore, there is a need to optimize and design the PBS mechanism in a way that reinforces these trust foundations.


