1. Introduction
Microalgae can efficiently utilize carbon dioxide (CO
2) as a carbon source and light as an energy source to produce phospholipids, proteins, nucleic acids, and lipids. These lipids can be further converted into biodiesel through transesterification processes. As a renewable energy source, microalgae offer significant economic and environmental advantages due to their high photosynthetic efficiency, rapid growth rates, and substantial biomass productivity. Additionally, microalgae can effectively mitigate gas pollutants such as ammonia (NH
3), CO
2, nitrogen oxides (NO
x), and sulfur oxides (SO
x), converting them into valuable products such as animal feed [
1,
2,
3].
Accurate estimation of algal cell concentration (cells mL
−1) and dry algal biomass (g L
−1) is essential for evaluating algal growth and productivity. However, traditional monitoring methods, such as gravimetric biomass analysis and microscopic cell counting, present notable limitations: they are labor-intensive, time-consuming, expensive, and prone to contamination due to manual sampling from photobioreactors (PBRs). These drawbacks hinder real-time process control and scalability, which are critical for large-scale or continuous algal production systems. Various methods have been employed, including solid measurements, microscopic methods [
4,
5], fluorescence techniques, flow cytometry [
6], spectroscopy [
1], and macroscopic methods [
7]. For instance, to determine dry algal biomass, algal cells in a liquid sample are dried after being captured on a filter and then weighed. Cell concentrations can be determined by counting algal cells under a microscope using a hemocytometer [
8]. Both methods require the manual collection of algal samples in a photobioreactor (PBR). However, sampling from PBRs or culture flasks increases the risk of contamination, affects throughput, and may degrade culture conditions. Another drawback of these two methods is their high costs and time-consuming nature. Therefore, it is essential to develop automated, precise, and cost-effective techniques for accurately determining microalgae concentrations.
Given these limitations, there is a pressing need for automated, accurate, and cost-effective alternatives. In recent years, digital imaging techniques have emerged as a promising direction, enabled by the transparency of PBRs which allows for visual access to culture conditions. The integration of image analysis—especially color-based models such as RGB and HSI—provides an indirect, non-invasive, and scalable way to monitor microalgal growth [
9,
10,
11,
12]. These color models are sensitive to changes in culture density and pigmentation, which correlate with biomass and cell concentration.
Moreover, machine learning (ML) algorithms offer powerful tools for analyzing complex image data, detecting patterns, and making accurate predictions. Prior studies have demonstrated the success of ML in identifying and quantifying algal populations using fluorescence microscopy, spectral data, and morphological features [
13,
14]. These approaches overcome the subjectivity and time constraints of manual assessments and enable predictive analytics for proactive system management.
Despite the potential of ML and image analysis in algal monitoring, there is limited research that combines these techniques specifically using color histograms for real-time prediction of cell and biomass concentrations in bulk algal suspensions. Most existing works rely on high-end imaging equipment or spectral sensors, which limits practical applicability due to cost and system complexity. This study addresses this gap by evaluating four widely used ML models—Decision Trees (DTS), Random Forests (RF), Gradient Boosting Machines (GBM), and K-Nearest Neighbors (k-NN)—combined with RGB color histograms to estimate algal cell and biomass concentrations from digital images of Scenedesmus dimorphus suspensions.
Among the models, Decision Trees are appreciated for their interpretability and ability to handle diverse data types [
11]; Random Forests offer high accuracy and robustness through ensemble learning [
15]; Gradient Boosting Machines sequentially refine predictions by correcting prior errors [
16]; and K-Nearest Neighbors utilize local instance similarities to make non-parametric predictions [
11]. The use of color histograms allows for a simplified and robust quantitative descriptor of culture coloration, effectively reflecting biomass levels [
17].
In summary, this study introduces a novel, low-cost, and scalable approach for real-time algal growth monitoring by combining digital image analysis and machine learning. It addresses specific gaps in traditional techniques—namely manual labor, contamination risk, lack of automation, and high operational costs—and proposes a method suitable for continuous monitoring in industrial photobioreactor systems.
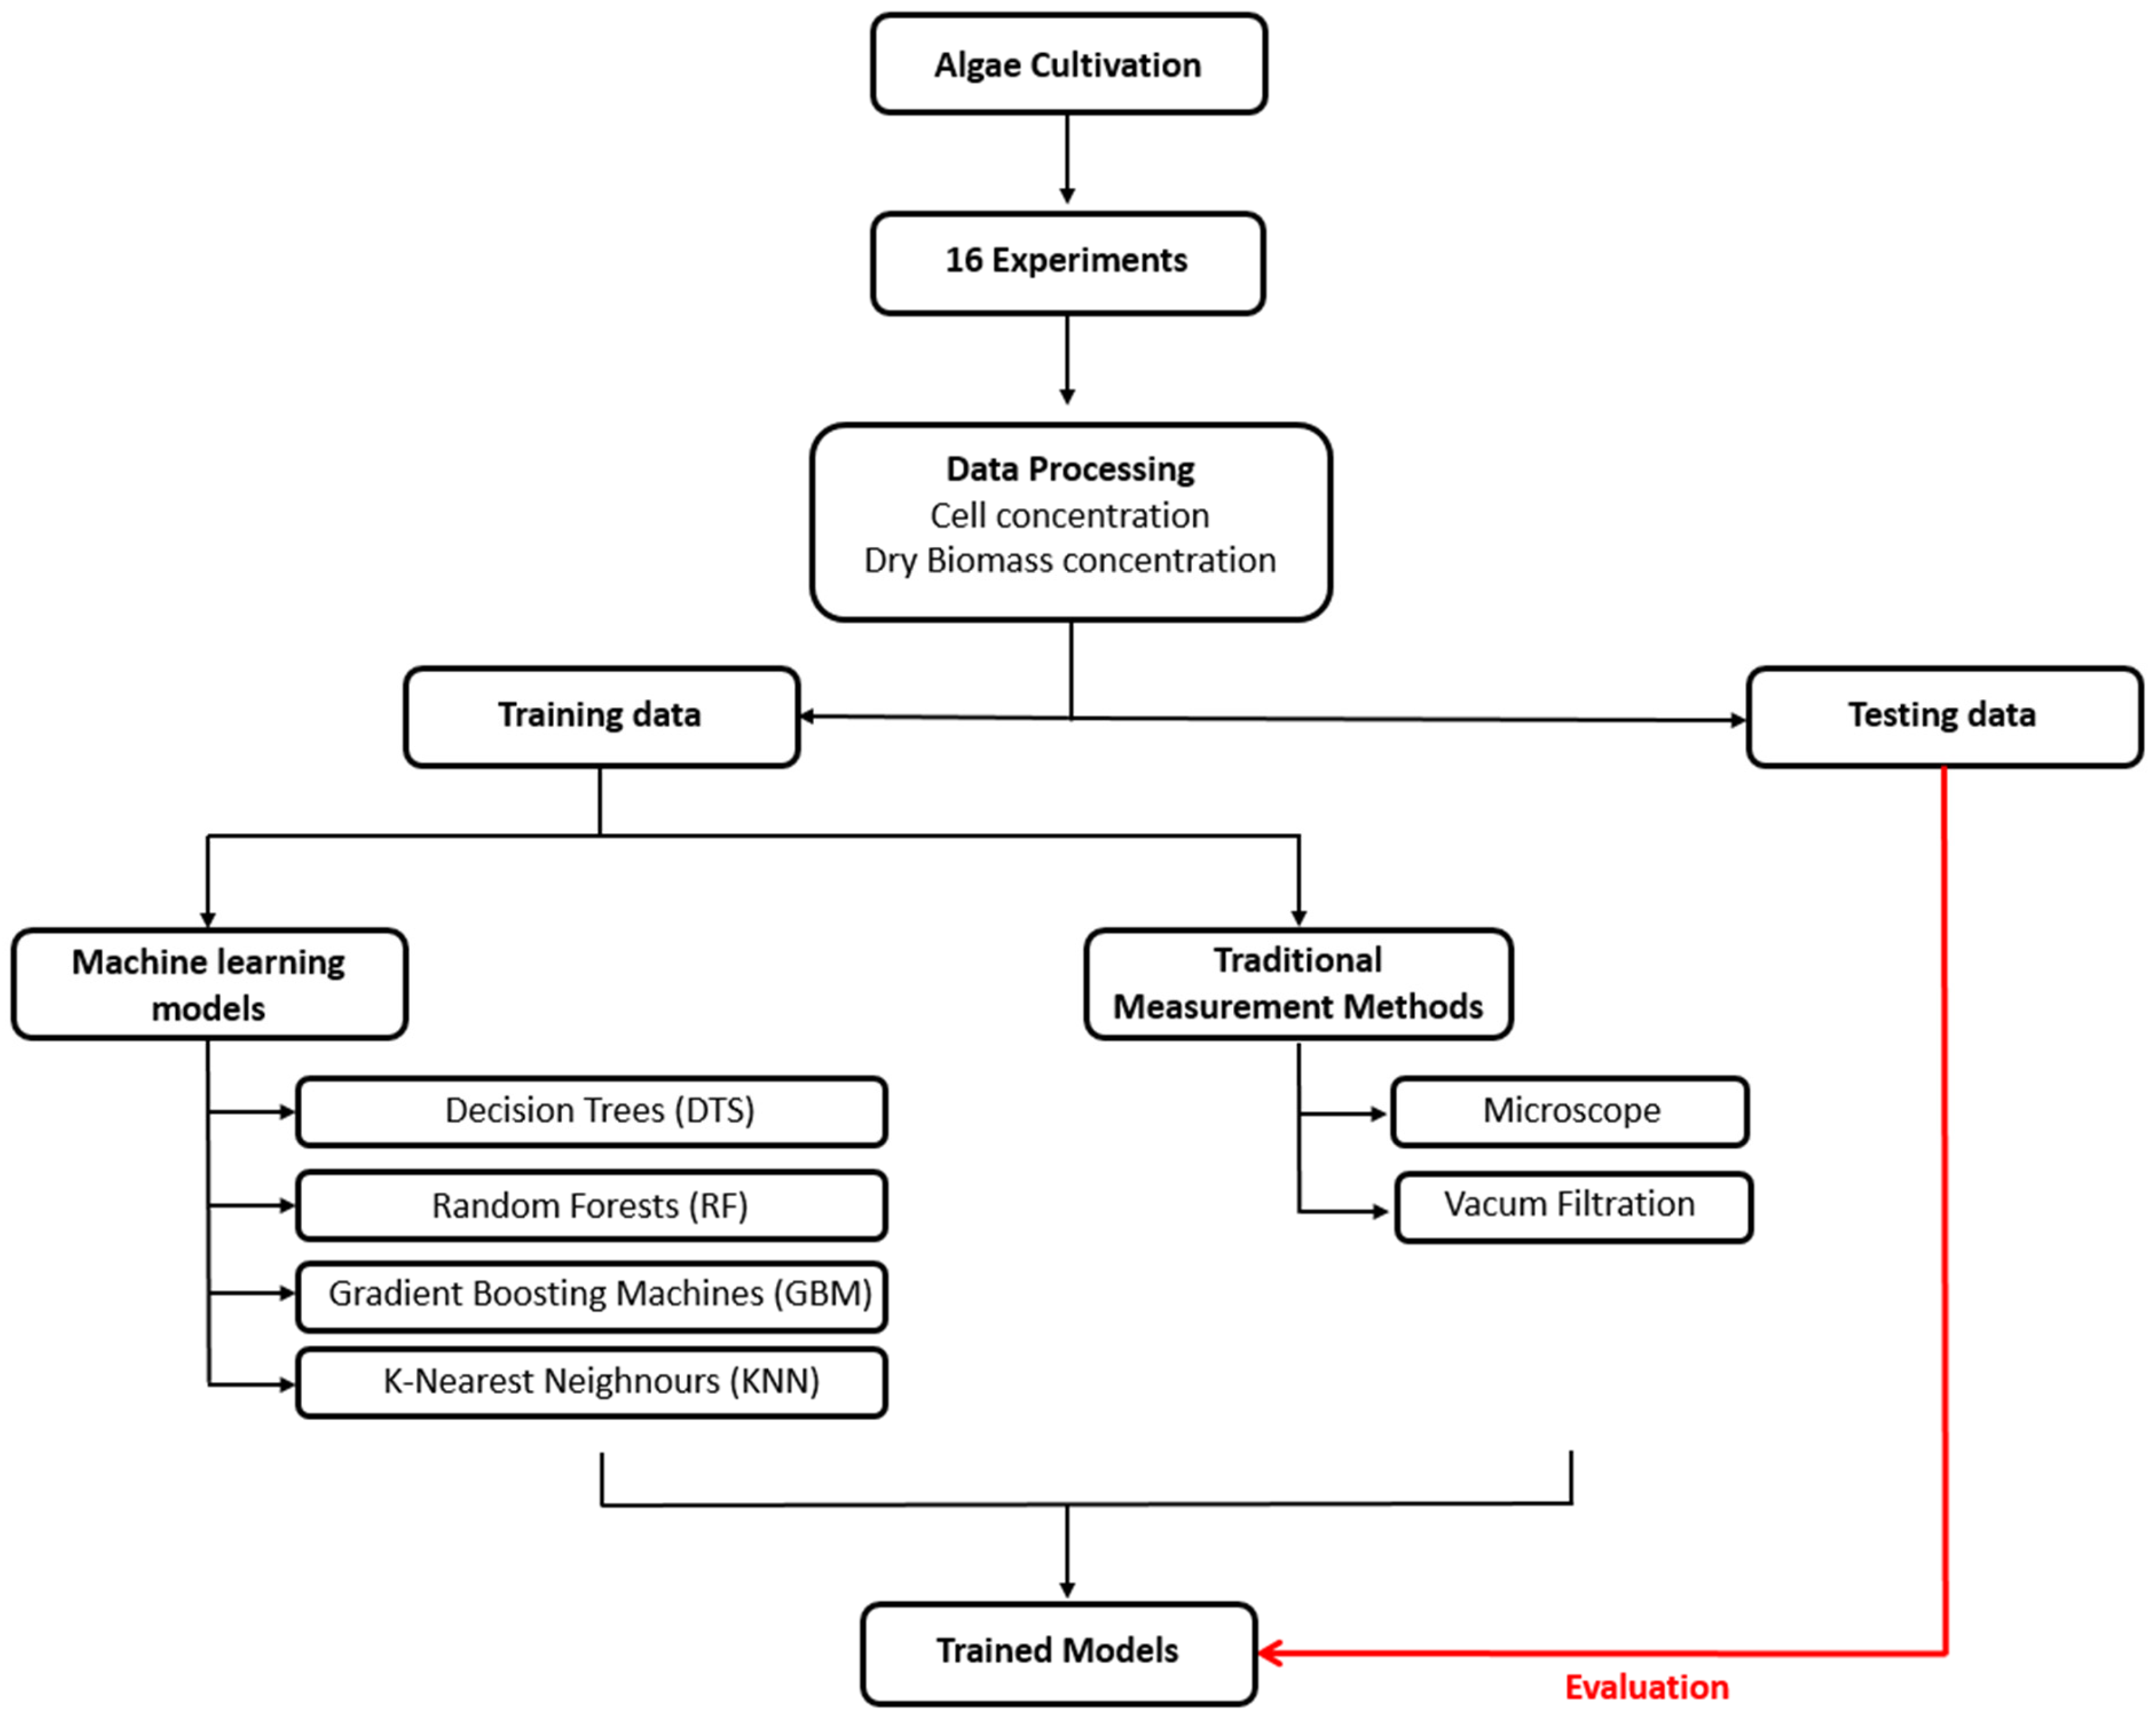
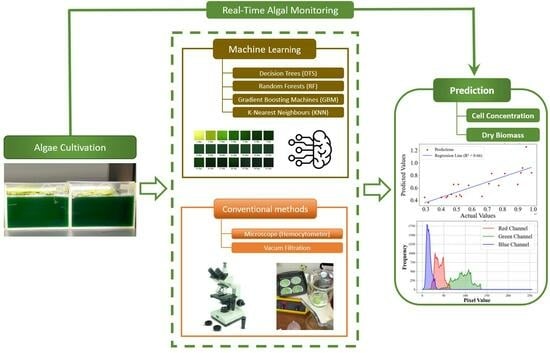
Figure 1 illustrates the overall workflow and model development process employed in this study.
2. Materials and Methods
2.1. Microalgae Strain and Algal Cultivation
The microalgal strain used in this study was
Scenedesmus dimorphus (UTEX 1237) was obtained from the UTEX Culture Collection of Algae at the University of Texas at Austin (Austin, TX, USA). The strain was initially cultured in 250 mL Erlenmeyer flasks containing 100 mL of Bold’s Basal medium (BBM), with detailed BBM composition provided in Uguz et al. [
2]. The BBM was sterilized by autoclaving at 121 °C for 20 min. Culture volumes were doubled every week until reaching a working volume of 5 L, after which they were transferred to 15 L PBRs for experimental testing. The PBRs were constructed from acrylic plastic sheets, each measuring 35 cm in height, 50 cm in length, and 10 cm in width. CO
2-laden air was supplied via spargers positioned parallel to the length at the bottom of the PBRs. Rotameters with needle valves (Cole Parmer, Vernon Hills, IL, USA) were used to regulate the air CO
2 flow into the PBRs.
2.2. Experimental Procedure
Following initial cultivation, 16 experiments were conducted under laboratory conditions to create a training dataset. Microalgae were cultivated in PBRs filled with a 5 L culture medium. The PBRs were aerated with CO
2-rich air at a flow rate of 2.5 L min
−1, and exposed to a light intensity of 180–200 µmol m
−2 s
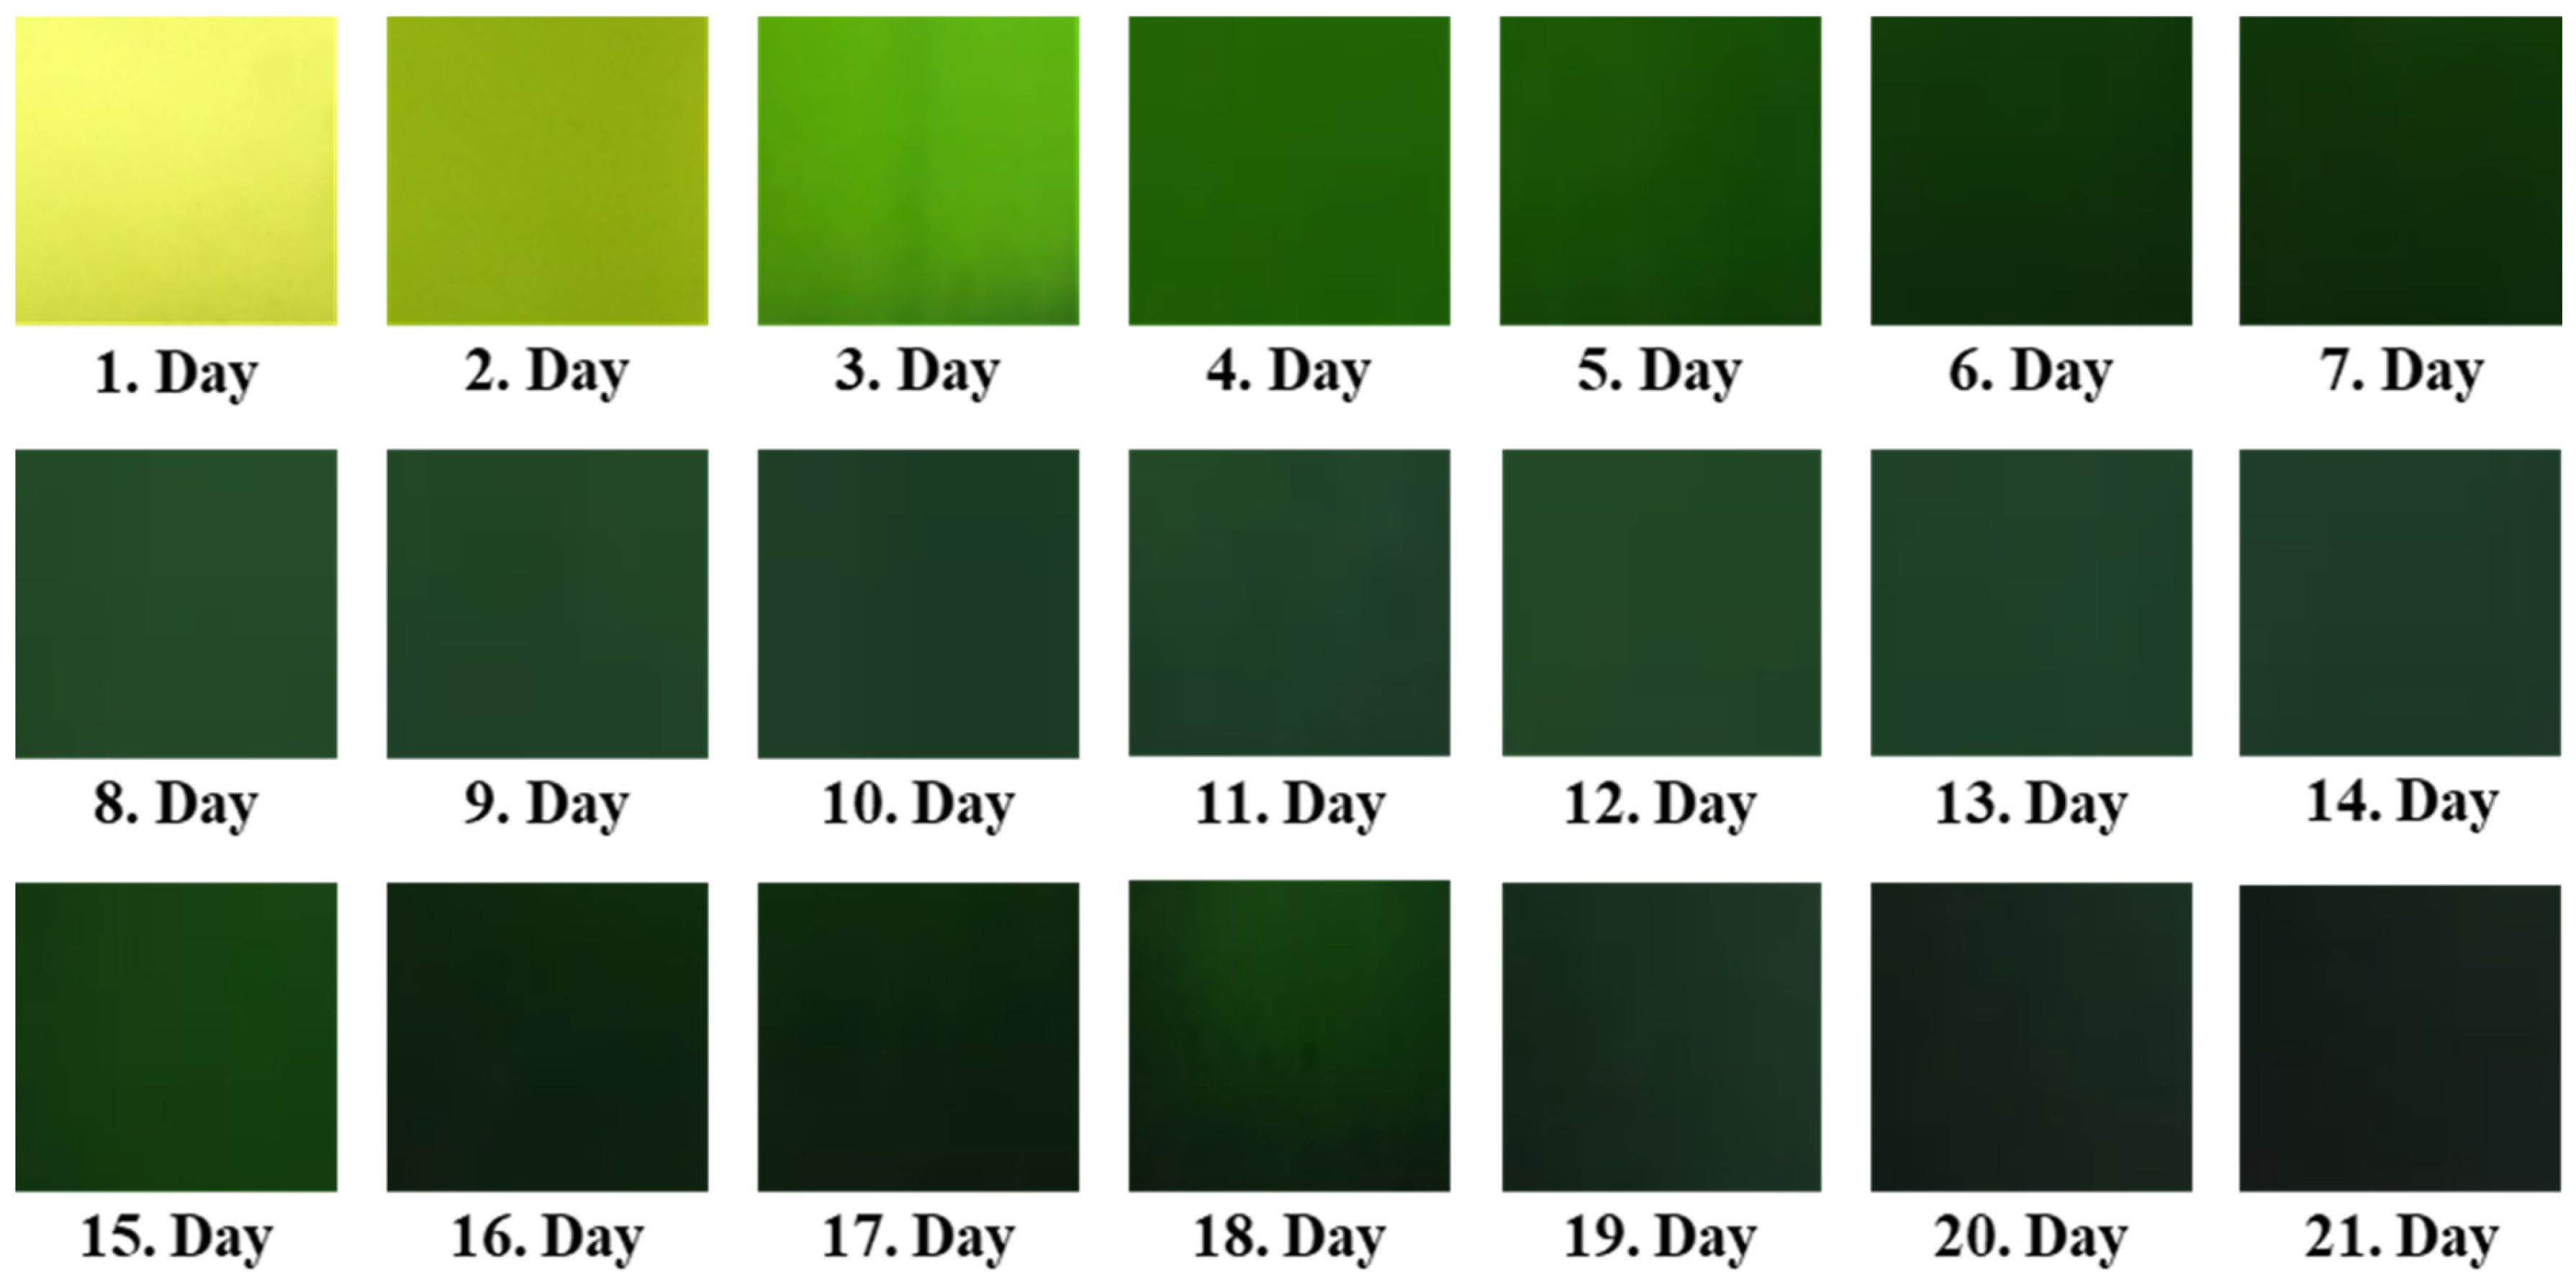
−1. Each experiment was conducted in triplicate, including control tanks, under constant environmental conditions for pH (maintained at 7.0 ± 0.3) using a digital pH meter (Hanna Instrument, Cole-Parmer, Vernon Hills, IL, USA, HI98128), temperature (kept at 24 ± 2 °C) in the temperature-controlled room with air conditioner, light intensity, and airflow rate. The pH in the PBRs was adjusted with a 0.5 M HCl or 0.5 M NaOH. During the 21-day cultivation period, samples were taken from the PBR tanks and photographed daily to document microalgal growth every 24 h (
Figure 2). Subsequently, cell and dry biomass concentrations were measured using traditional laboratory methods, as outlined in
Section 2.5. These photographs and the corresponding quantitative data were compiled to create a comprehensive dataset.
2.3. Sample Collection and Data Preparation
In this study, four ML models—Decision Trees (DTS), Random Forests (RF), Gradient Boosting Machines (GBM), and K-Nearest Neighbours (k-NN)—alongside the Color Histograms (Red, Green, and Blue channels) method, were employed to predict algal cell counts and dry biomass concentrations based on watercolor. The dataset was assembled by enumerating algal cells and biomass under a microscope and documenting watercolor with RGB photography. This approach, integrating ML and color histograms for the prediction of algal cell counts from water coloration, holds promising agricultural applications [
9].
Color histograms were constructed based on the full central region of interest (ROI) manually cropped from each image to exclude irrelevant background edges, reflections, and border artifacts. The ROI was selected to represent a homogeneous area of the algal culture, typically covering ~80% of the image area. To minimize the influence of light reflection, air bubbles, and shadows, image preprocessing steps were performed using OpenCV in Python. These included brightness normalization, histogram equalization, and median filtering to reduce noise. Images with significant anomalies (e.g., excessive surface reflection or camera blur) were excluded from the dataset. This preprocessing ensured that the extracted RGB histograms reliably captured the color intensity distribution representative of the algal culture.
Camera Specifications: The images were captured using a Nikon D750 camera equipped with a Nikkor 50 mm lens. This setup was chosen for its high resolution and ability to capture detailed images necessary for accurate color analysis [
10]. The camera settings were adjusted to ensure consistent image quality across all samples. The size of the captured images was 6016 × 4016 pixels, and the images were stored in raw format for further analysis.
Photography Distance and Angle: Photos were taken at a fixed distance of 1 m from the samples, with the camera positioned at a 90-degree angle perpendicular to the water surface. This setup minimized distortion and ensured uniform lighting conditions [
11]. A total of 576 images of
Scendesmus sp. algae were collected and analyzed.
Cell and Dry Biomass Counting Procedure: For cell concentration and dry biomass estimation, daily microalgal samples were transferred to 10 mL wells. These samples were subsequently imaged under controlled laboratory conditions, maintaining constant illumination and precise spectral lighting conditions. The imaging protocol ensured uniform distance from each well to guarantee consistency in the captured images. Alongside imaging, cell counts were conducted on these samples. These counts were then correlated with the corresponding images [
12].
Lighting Conditions: Photographs were taken under controlled lighting conditions, using natural daylight with an intensity of approximately 1000 lux, which provides accurate color representation and consistent data for agricultural studies [
13].
Image Processing and Normalization Procedures: All images were processed to ensure consistency and minimize variability due to external factors. Each raw image was first cropped to a standardized ROI representing the culture area, excluding edges and backgrounds [
18,
19]. Subsequently, images were resized to a fixed resolution of 1024 × 768 pixels to maintain uniform input dimensions across the dataset.
Brightness normalization and histogram equalization were applied using OpenCV (Python) to correct for lighting inconsistencies [
20]. Additionally, a median filter (3 × 3 kernel) was used to remove noise such as air bubbles and surface reflections. Color intensity values were normalized to a 0–1 range to prevent model bias due to lighting variations [
21,
22]. These preprocessing steps ensured that the extracted RGB histograms reliably reflected the culture’s visual characteristics and improved model reproducibility and accuracy.
2.4. Model Development and Training
Digital images were analyzed using Python (version 3.11.8) to capture the H and I index. The hyperparameter optimization methods and libraries used for model training are detailed in
Table 1. Hyperparameters, like learning rate and number of trees, are crucial for optimizing model performance [
14]. The feature vectors (color histograms) and corresponding algal cell counts were compiled into a dataset [
15]. The dataset was split into training and testing sets using the train_test_split function from Scikit-learn, with an 80–20 split, where 80% of the data was used for training the models, and the remaining 20% was used for performance assessment of the models as a test dataset. Hyper-parameter grids were evaluated with stratified 5-fold K-fold cross-validation (StratifiedKFold,
n = 5), preserving biomass distribution across folds. To avoid potential bias arising from uneven biomass distribution, the train–test split and all cross-validation folds were stratified by biomass quantiles, ensuring comparable density ranges in each subset.
The selection of the four machine learning algorithms—Decision Trees (DTS), Random Forests (RF), Gradient Boosting Machines (GBM), and K-Nearest Neighbors (k-NN)—was based on their distinct advantages in handling regression problems involving non-linear relationships, small to medium-sized datasets, and limited feature sets (i.e., RGB histograms).
DTS was chosen for its interpretability and ability to handle both numerical and categorical data with minimal preprocessing.
RF, as an ensemble of multiple decision trees, improves prediction robustness and reduces overfitting, which is particularly beneficial for noisy ecological datasets.
GBM was selected for its strong predictive performance through sequential boosting, which is effective in refining errors made by previous models.
k-NN was included due to its simplicity and effectiveness in capturing local data patterns, especially when working with image-derived features like color intensity distributions.
These models have been widely applied in ecological and agricultural studies, demonstrating their capability to extract patterns from complex biological data. Our goal was to evaluate their relative performance in predicting algal concentrations from RGB image data under consistent experimental conditions.
During model development, we made the following assumptions:
The RGB color distribution of the culture is an adequate proxy for cell density and biomass concentration.
The dataset is representative of the full range of culture growth stages over the 21-day period.
Environmental variables such as lighting, camera angle, and distance were controlled and consistent, thus not introducing bias.
There are no significant outliers or mislabeled data points that could affect model training.
RGB histograms alone are sufficient as input features for this specific monitoring objective, without requiring additional spectral data.
GridSearchCV was employed for hyperparameter optimization to ensure unbiased selection of model parameters and to avoid overfitting. Parameters such as the number of estimators, depth of trees, learning rate, and neighborhood size were systematically explored and evaluated using five-fold cross-validation.
The trained models were evaluated on the test data using Mean Absolute Error (MAE), Mean Squared Error (MSE), and the coefficient of determination (R
2) metrics. Predicted algal cell counts were compared with actual counts to assess model accuracy. R
2 quantifies error variability, ranging from 0 to 1. A higher R
2 indicates less error variability and greater accuracy [
16]. MAE is the average of the absolute differences between predicted and actual values. MSE squares the errors before averaging them, emphasizing larger errors. The MAE, MSE, and R
2 are described by Equations (1)–(3):
where
Ytrue is the actual value of the target variable intended to be predicted by the model,
Ypred is the predicted value by the model based on the input data,
Ymean represents the average of the actual values, and
n denotes the total number of observations or data points present in the dataset. The results, including histograms and predicted versus actual cell counts, were visualized using Matplotlib (V.3.6.3, 2022) to facilitate the interpretation and comparison of model performances.
2.5. Analytical Methods
The algal samples used in the image analysis were also quantified for cell and dry biomass concentrations. The algal samples collected from each experiment were analyzed for cell concentration (cells mL
−1) and dry algal biomass concentration (g L
−1). Cell concentration was determined manually using a Neubauer improved hemocytometer under an Olympus optical microscope (CX23 model) at 400× magnification. Each sample was mixed thoroughly, and a 10 µL aliquot was loaded into the hemocytometer chamber. Cell counts were performed in four large squares (each subdivided into 16 smaller squares), and the average value was calculated [
2]. To ensure accuracy and reproducibility, each sample was counted three times independently by the same trained operator, and the coefficient of variation (CV) across replicates was maintained below 10%. If variation exceeded this threshold, additional counts were conducted. Calibration checks of the microscope scale were performed weekly. The dry algal biomass concentration was determined by filtering a known volume of an algal sample and weighing the filter after it was dried in a laboratory oven at 80 °C for 3 h [
17,
23]. Detailed protocols for determining cell and dry biomass concentrations can be found in Uguz et al. [
2].
2.6. Statistical Analysis
The statistical analysis in this study involves evaluating the performance of the Decision Trees (DTS), Random Forests (RF), Gradient Boosting Machines (GBM), and K-Nearest Neighbors (k-NN) models using Mean Squared Error (MSE), Mean Absolute Error (MAE), and R2 scores. Hyperparameter optimization is performed using GridSearchCV to identify the best model parameters. Performance metrics are calculated on the test set to ensure accuracy. Paired t-tests and Wilcoxon signed-rank tests were used to determine significant differences between models. Cross-validation is employed to ensure robustness and generalizability. This rigorous approach ensures the reliability and validity of the findings in predicting algal cell counts and biomass measurements for the experiment dataset. Model hyper-parameters were selected via stratified 5-fold cross-validation; fold-averaged (mean ± SD) MAE, MSE, and R2 values to document stability. Six pairwise Wilcoxon tests (Bonferroni-corrected α = 0.0083) showed DTS significantly out-performed GBM for cell-count, while all other differences were non-significant.
3. Results and Discussion
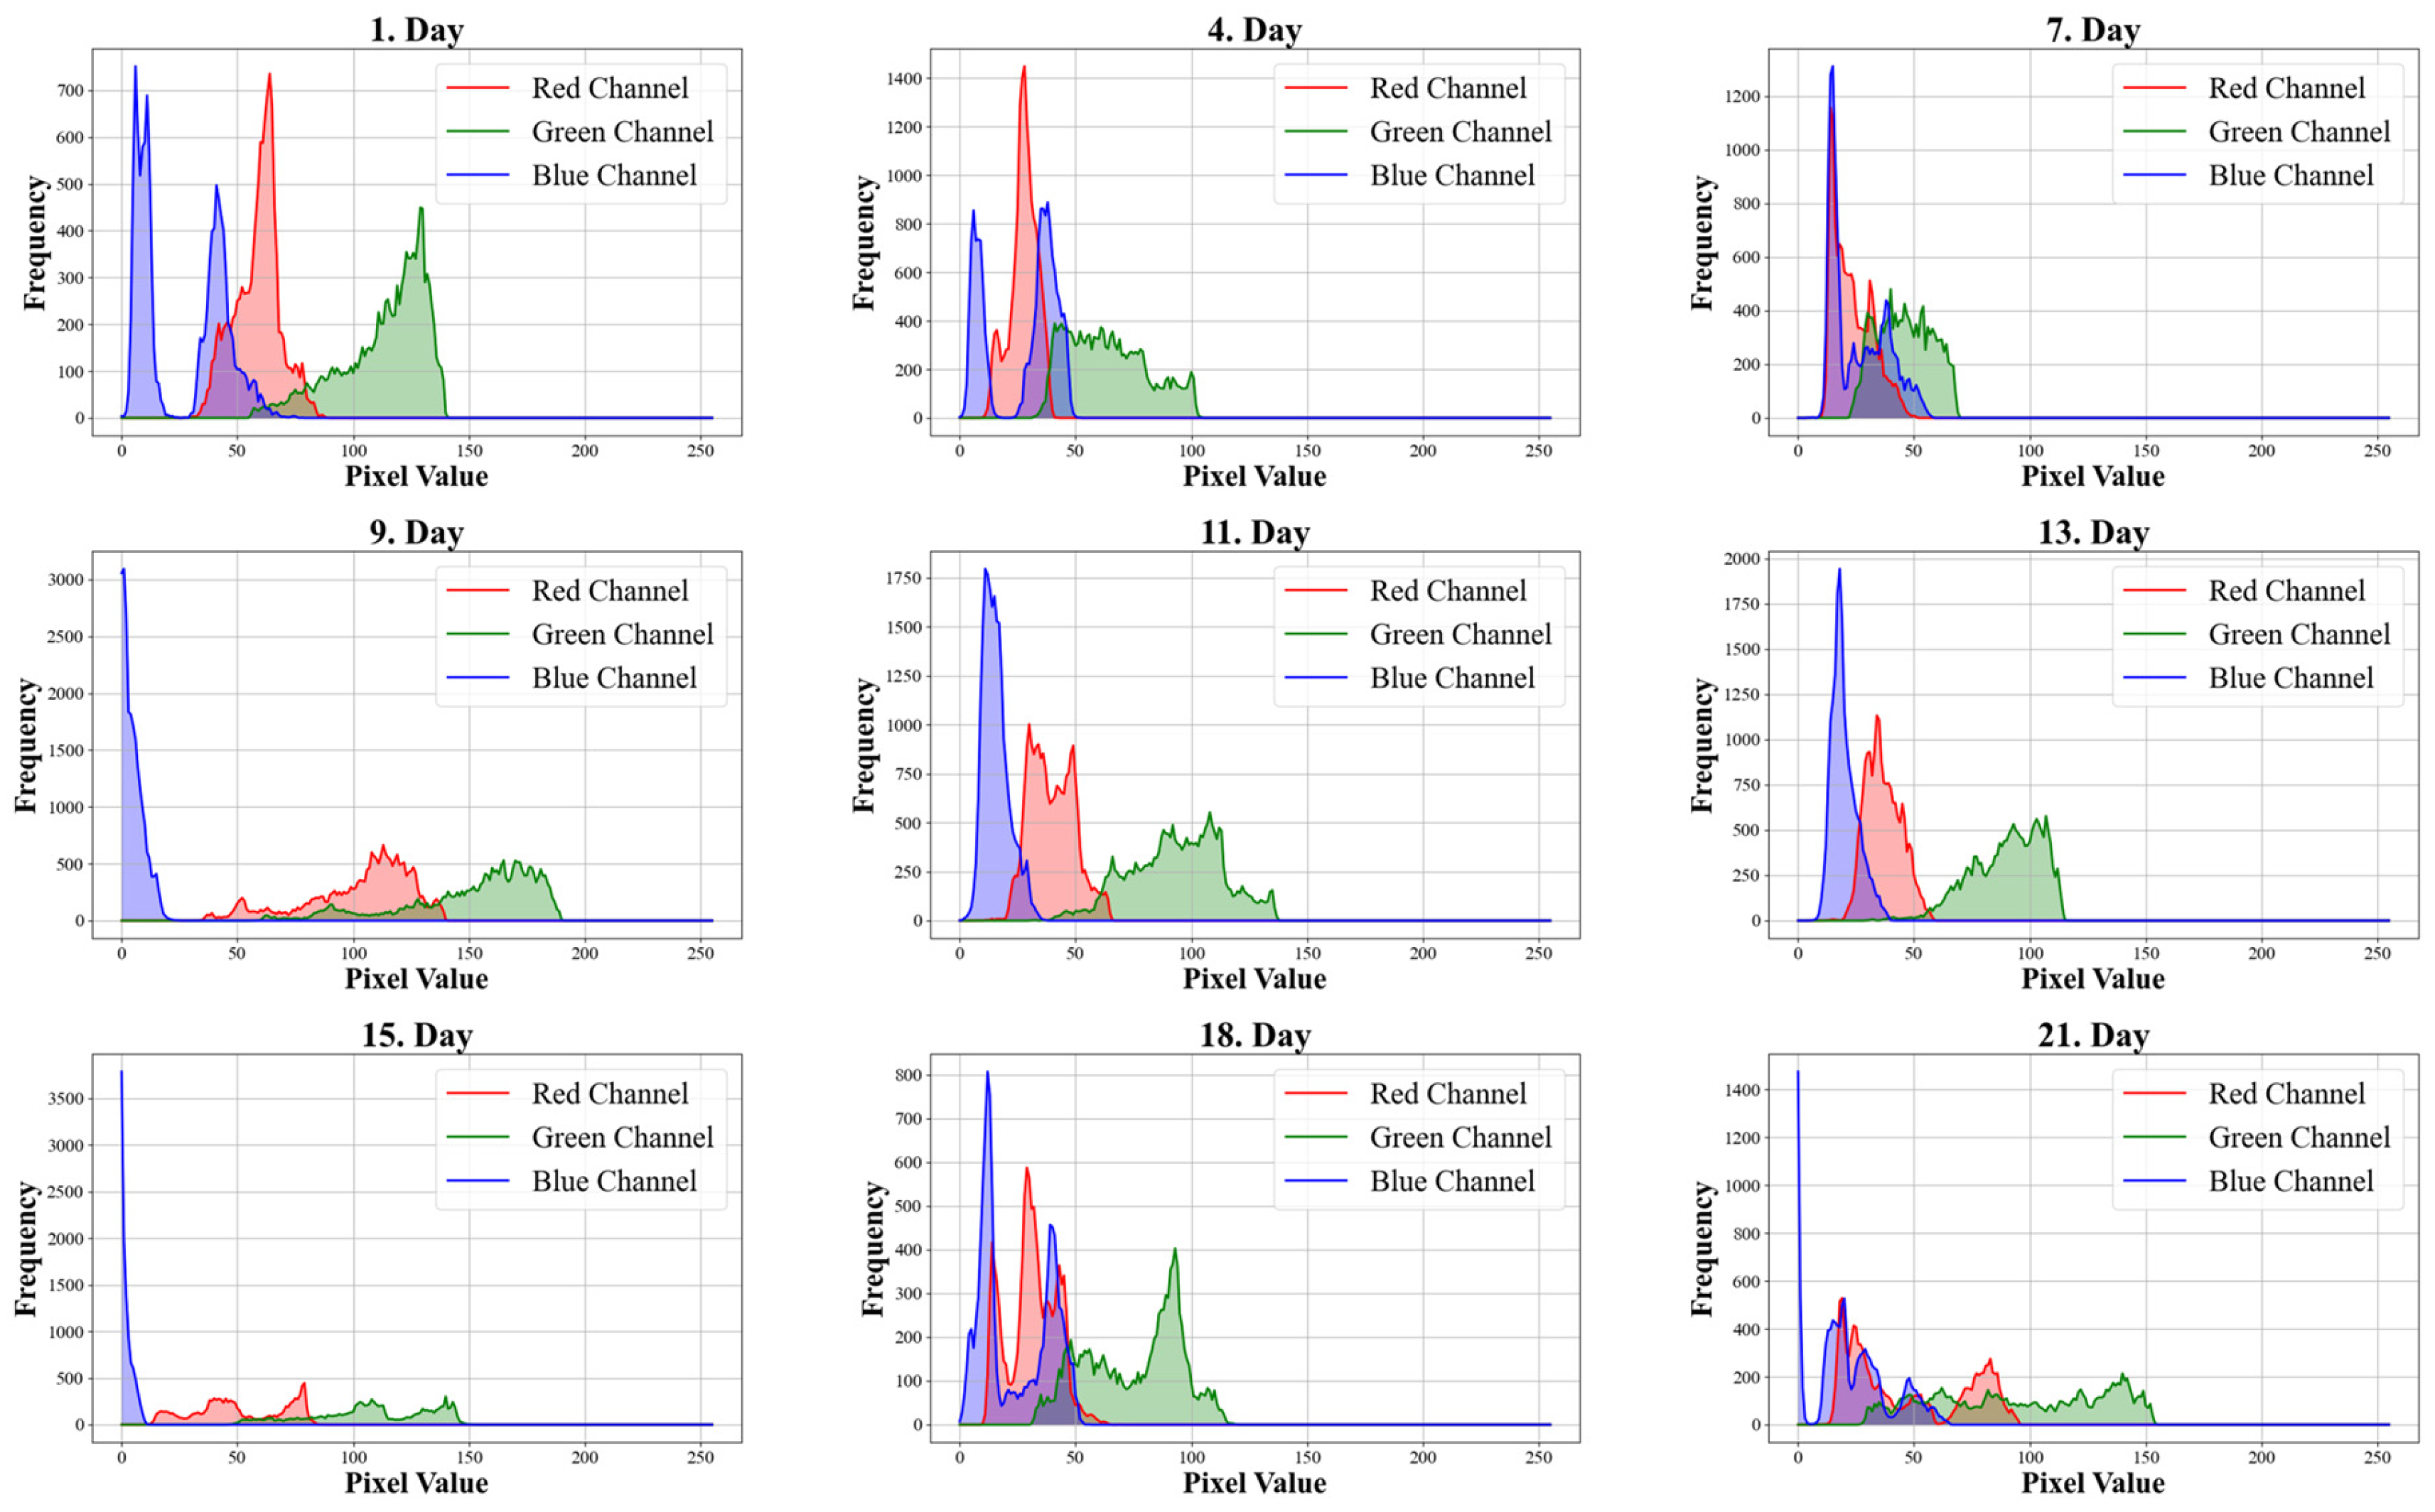
Our results show that the mean values of the red and green components in image decompositions decrease, indicating a darkening of the microalgae as algal cell density increases in the photobioreactors (PBRs). This trend was also reported by Winata et al. [
24], who observed a linear relationship between these color values and microalgae concentration. Sarrafzadeh et al. [
8] also obtained similar results in the relationship between dry biomass and RGB values for three different algae species. These findings show the potential of image analysis techniques for biomass quantification of different algae species [
7]. Comparable evidence has been reported elsewhere: Salgueiro et al. [
7] found that mean RGB values decreased linearly with
Chlorella vulgaris dry weight, explaining up to 97% of the variance under controlled illumination; Jiang and Nakano [
25] achieved similarly strong fits (R
2 ≥ 0.97) by relating an HSI-derived intensity index to biomass in
C. vulgaris and
Aulacoseira granulata cultures; and Miguel et al. [
4] used bulk color intensity to estimate
Isochrysis galbana cell numbers to within 10% of Coulter-counter counts across 1.5–8 × 10
6 cells mL
−1. Collectively, these results reinforce our conclusion that the progressive darkening of red and green channels constitutes a reliable, low-cost proxy for microalgal biomass across species and imaging conditions.
Figure 3 shows the average color histogram channels over the 21 days for the entire dataset concerning cell count. Each day’s data includes the average of all color channels from the dataset for that specific day.
3.1. Performance of ML Models
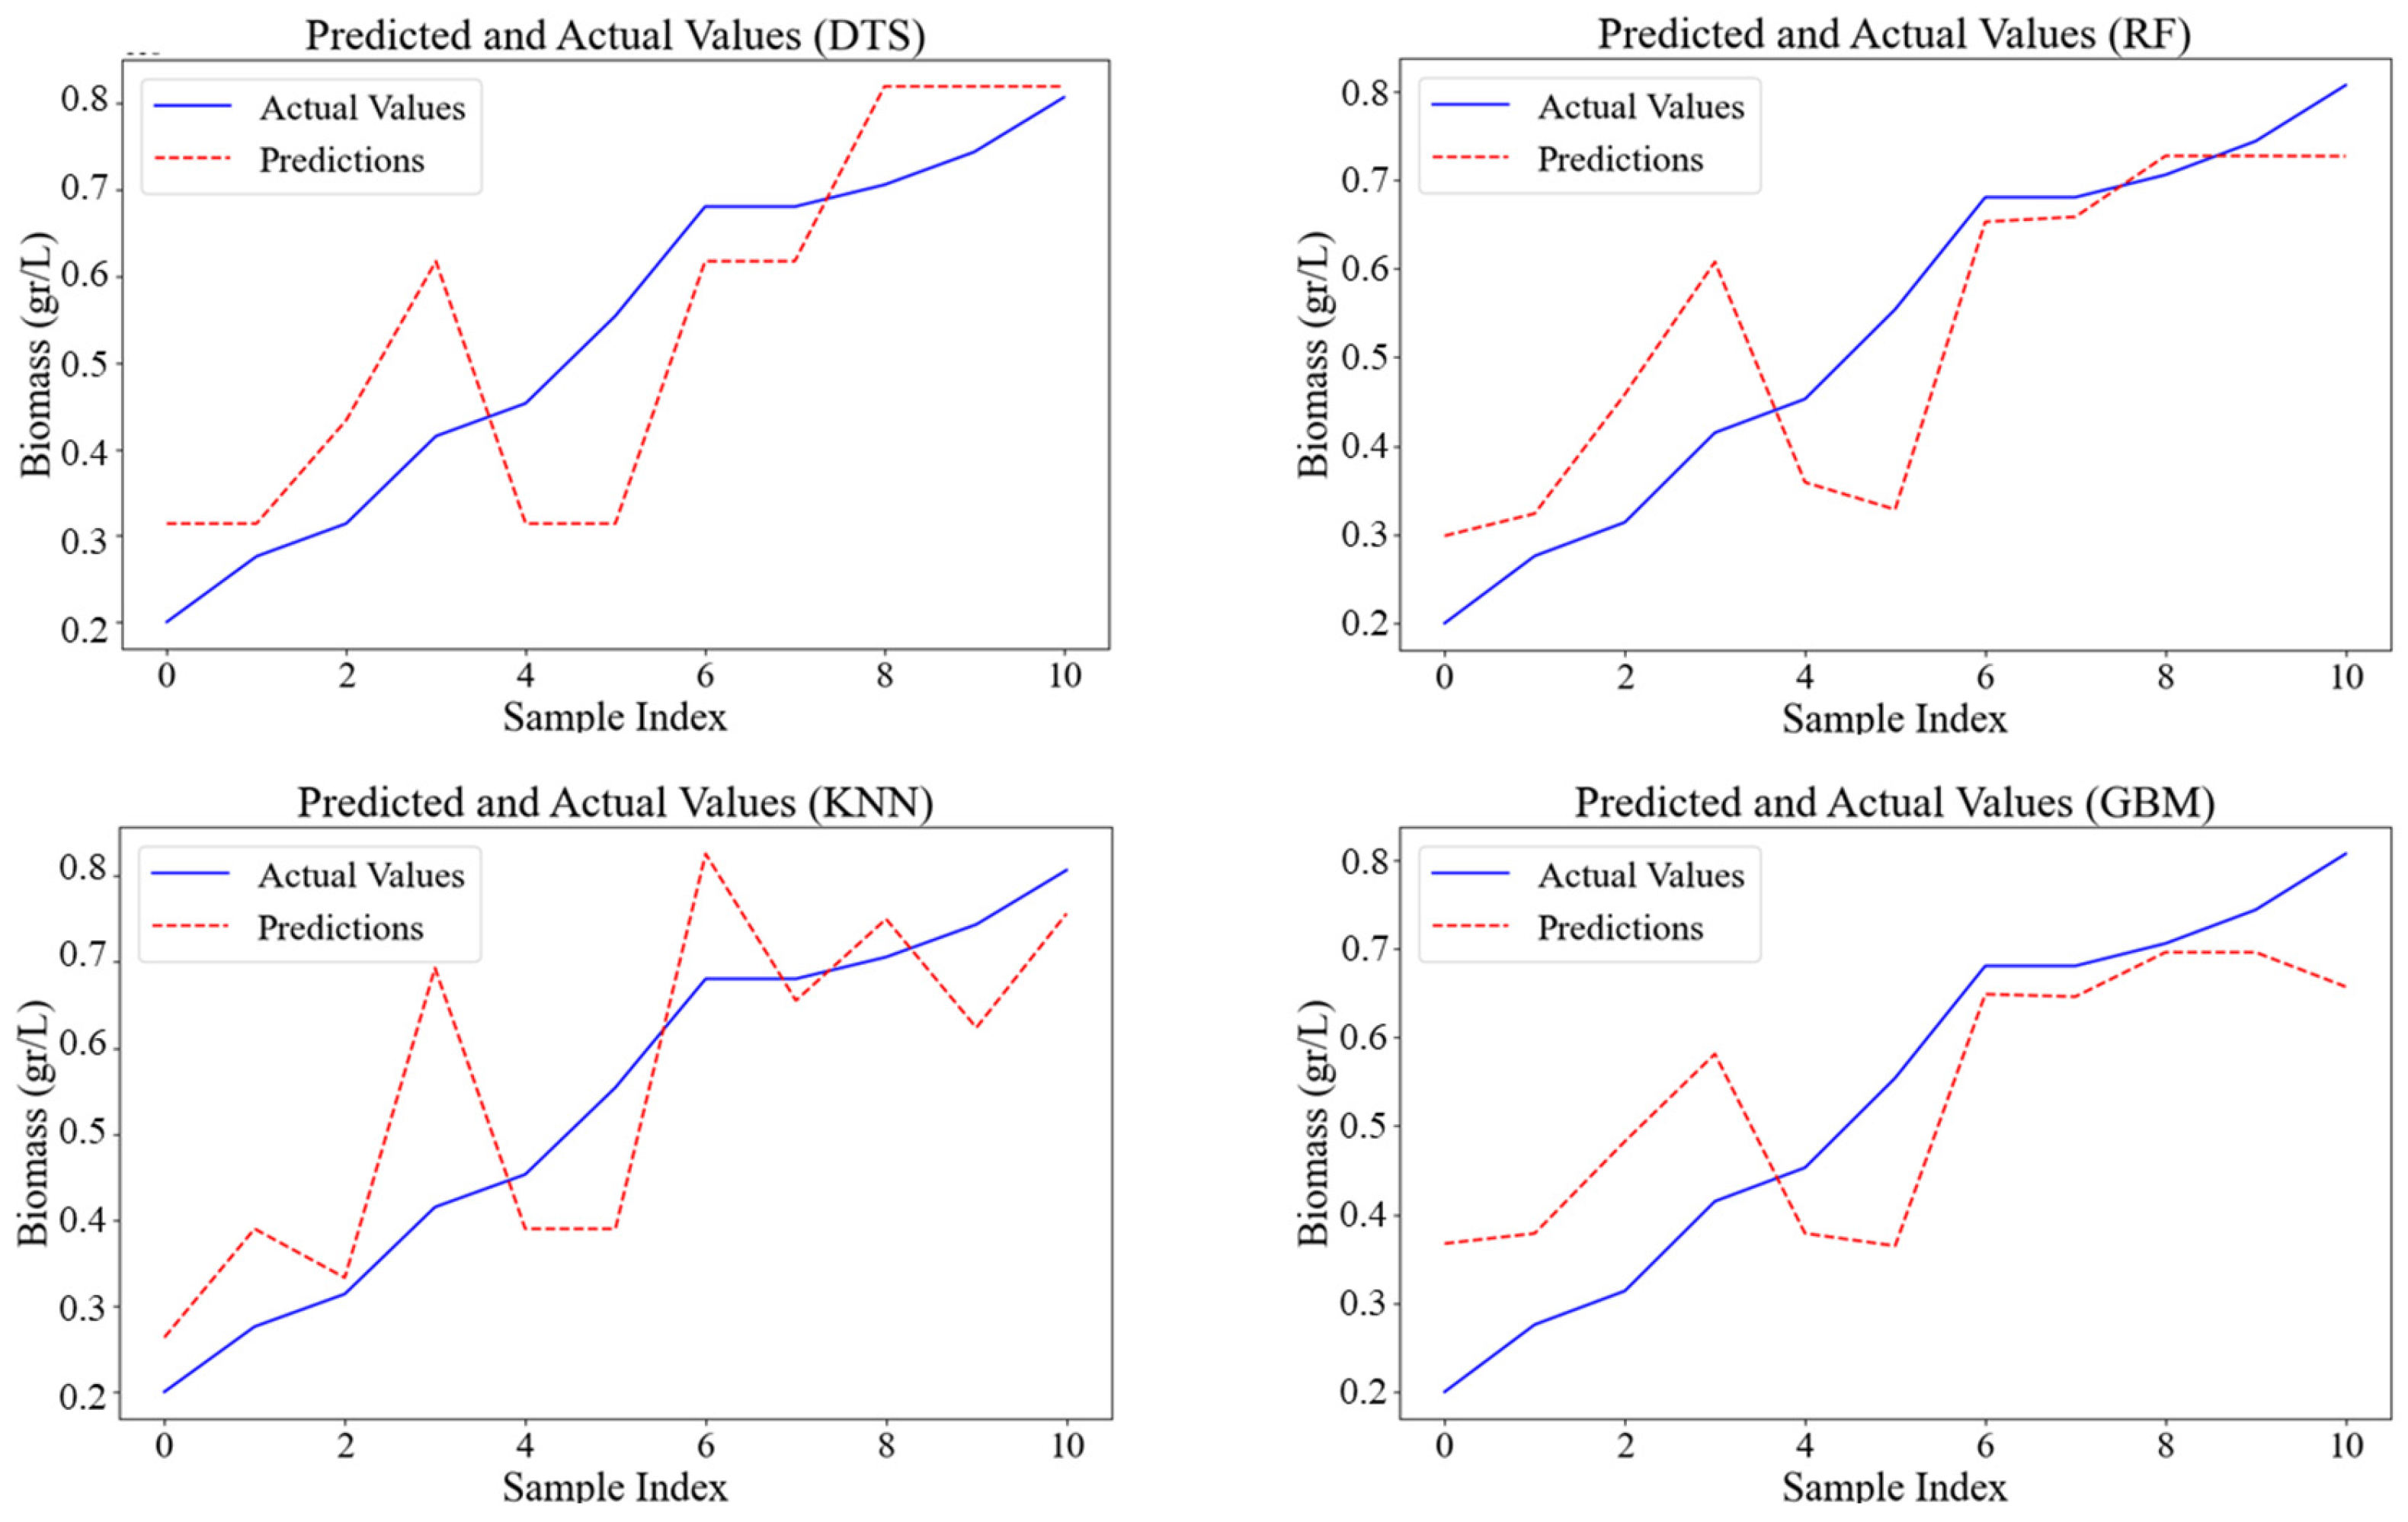
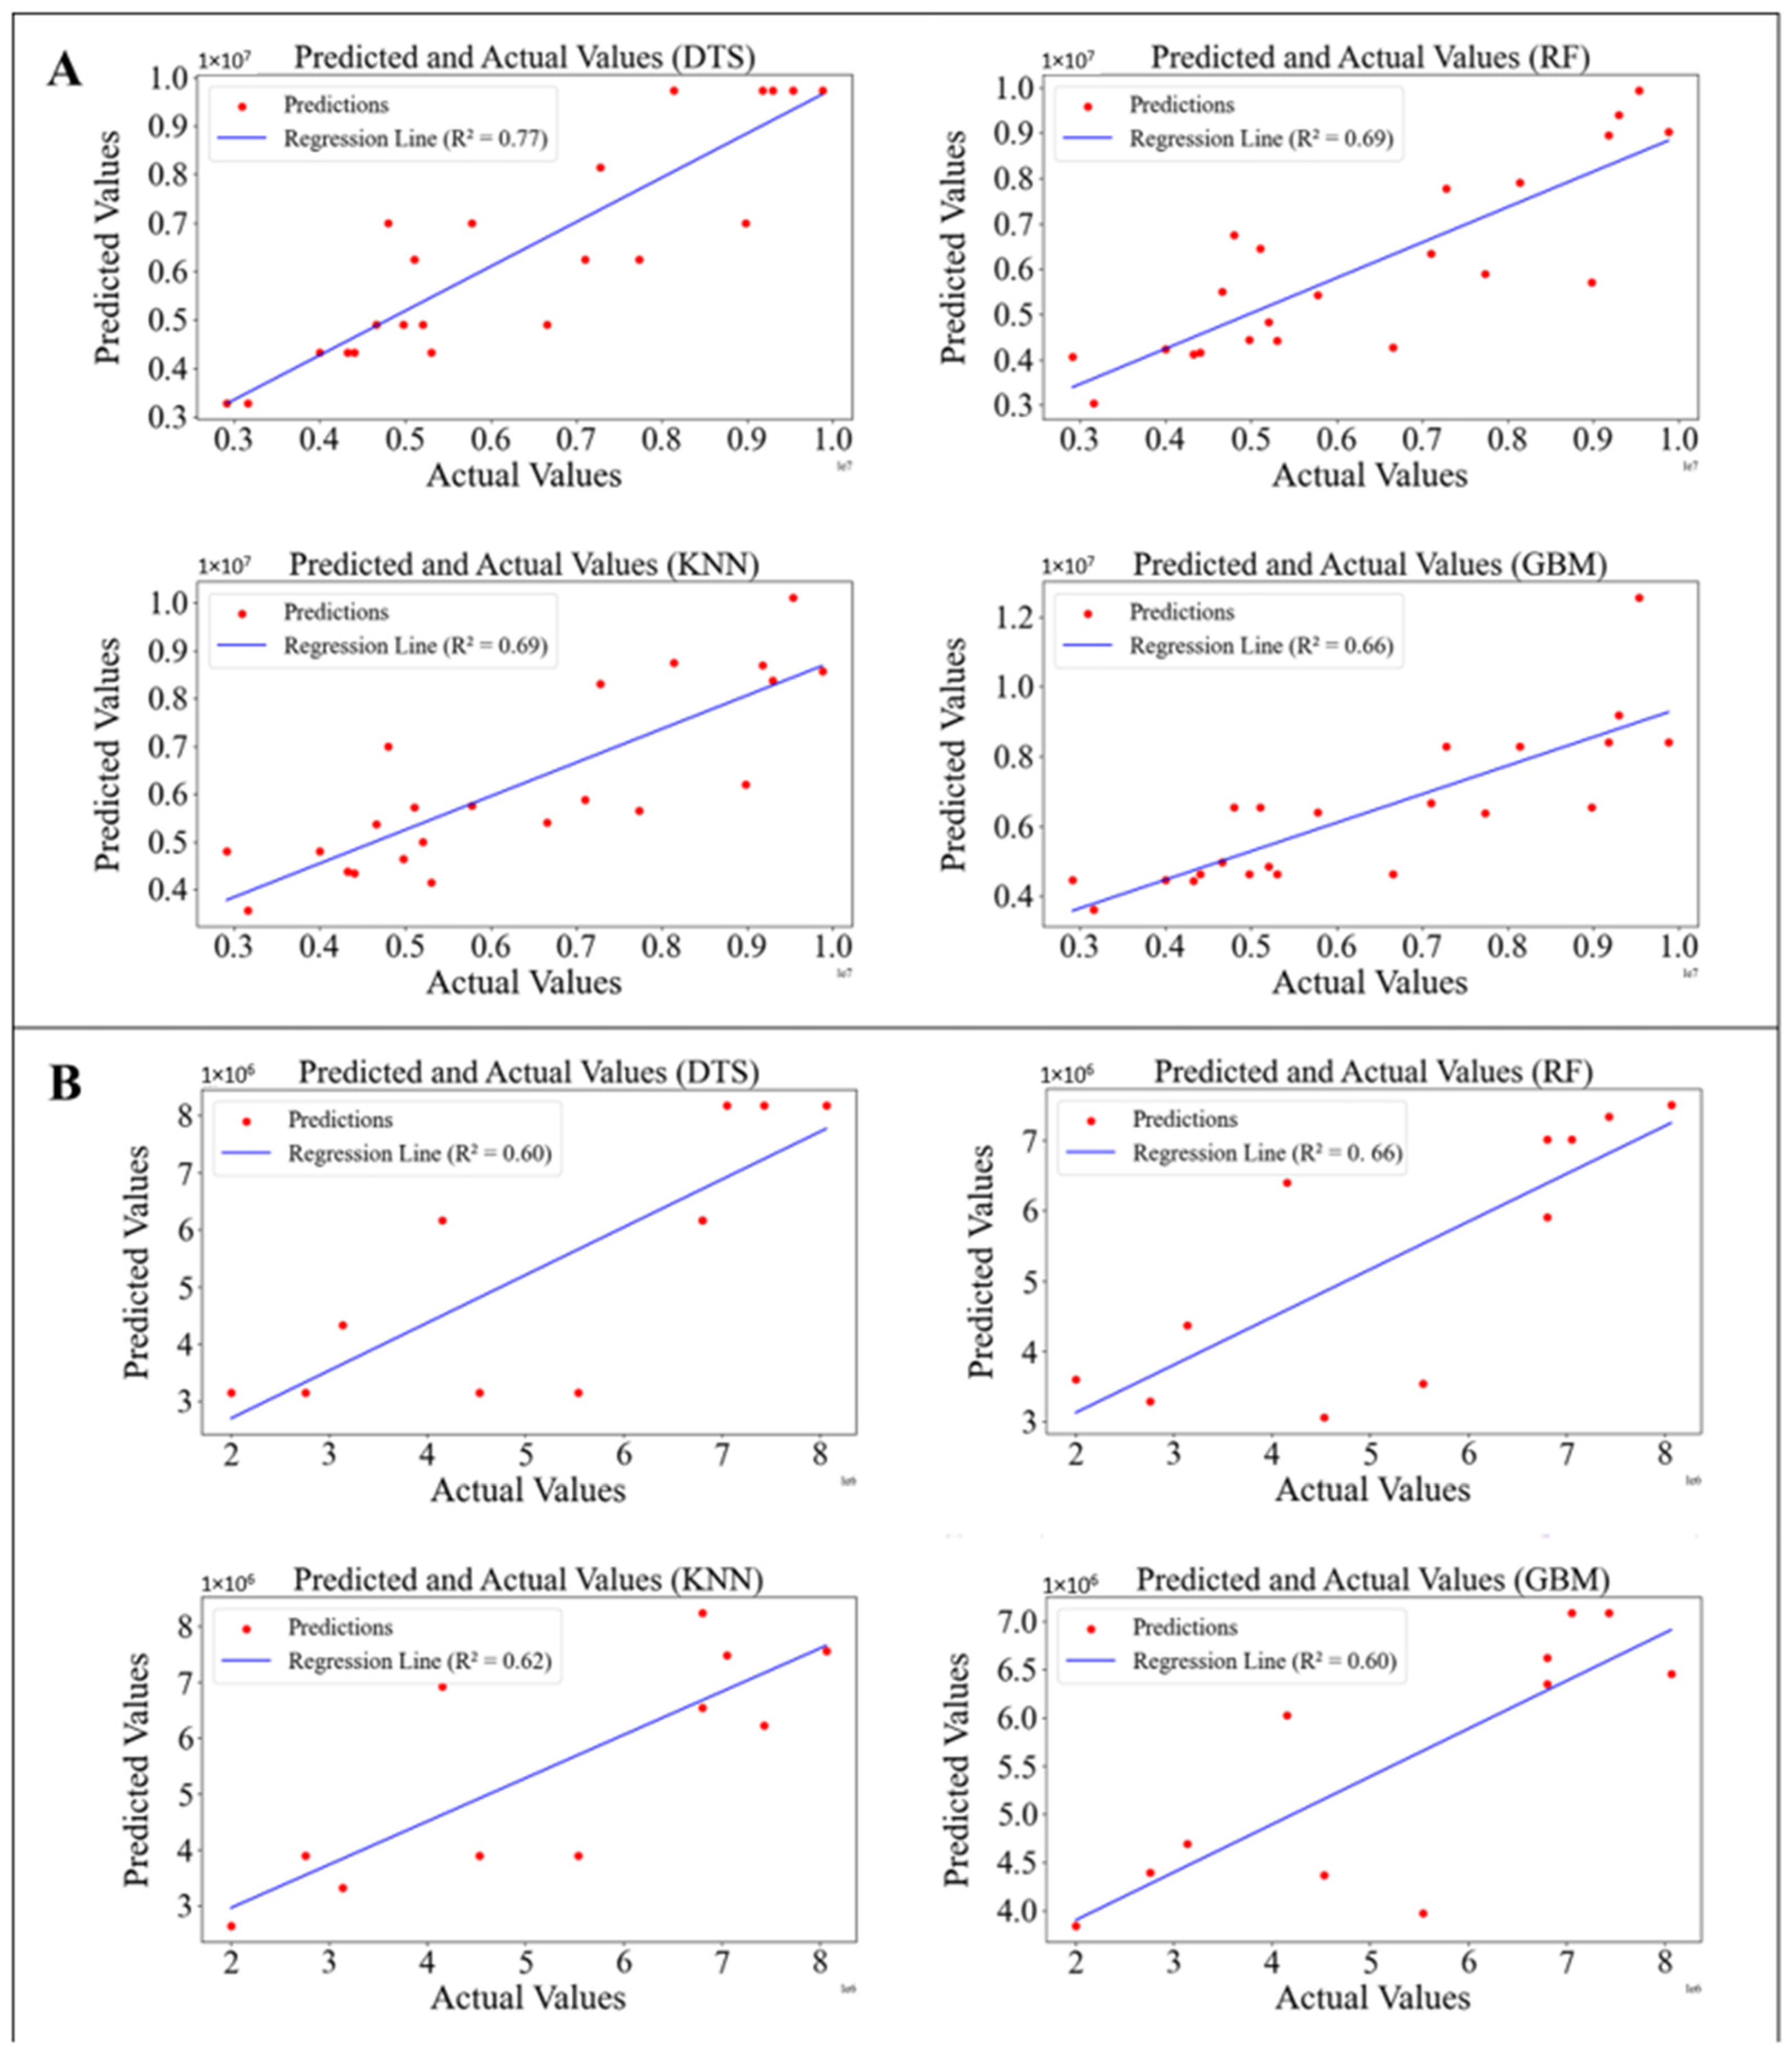
The performance of models trained on the dataset was determined using test datasets. The image depicts the comparison between predicted and actual algal cell counts using four different ML models: Decision Trees (DTS), Random Forests (RF), K-Nearest Neighbors (k-NN), and Gradient Boosting Machines (GBM) (
Figure 3). The coefficients of determination (R
2) for the DTS, RF, k-NN, and GBM models in predicting cell counts were 0.77, 0.69, 0.69, and 0.66, respectively. Among these, the DTS model achieved the highest accuracy for cell count prediction (R
2 = 0.77, MAE = 0.1274, MSE = 0.0346), while the RF model excelled in dry biomass prediction (R
2 = 0.66, MAE = 0.1458, MSE = 0.0583). These findings are consistent with Xu et al. [
26] who used four machine learning models—multiple linear regression (MLR), support vector regression (SVR), random forest (RF), and extreme gradient boosting (XGBoost)—to predict algal cell density. Among the models, RF showed the highest prediction accuracy (R
2: 0.64–0.67 for testing dataset) for predicting algal cell density variations. The comparison between predicted and actual algal cell concentrations using these models is visualized in
Figure 4.
3.2. Application of Machine Learning in Algal Growth Prediction
The application of DTS, RF, GBM, and k-NN models alongside Color Histograms (RGB channels) to predict algal biomass concentration of
Scenedesmus dimorphus from water color demonstrated effective estimation of algal metrics, with RF showing notable accuracy. For dry biomass prediction, RF had the highest R
2 (0.66), followed by GBM (0.60), k-NN (0.62), and DTS (0.60).
Figure 5 shows the visualizing actual vs. predicted dry biomass on the test dataset. These findings align with studies using neural networks and other ML techniques for algal bloom prediction, which have also shown promising results in capturing complex environmental dynamics [
27,
28]. This integration of advanced computational methods with traditional ecological studies sets a benchmark for future applications in the field.
The performance of these models was evaluated on the test dataset using Mean Absolute Error (MAE), Mean Squared Error (MSE), and R
2 metrics.
Table 2 shows the performance metrics of four different ML models on the test dataset in predicting cell count and dry biomass. DTS model achieved the highest accuracy for cell count prediction with an R
2 of 0.77, an MAE of 0.1274, and an MSE of 0.0346. RF model showed a slightly lower R
2 of 0.69 for cell count prediction, with an MAE of 0.1745 and an MSE of 0.0543. GBM model showed the lowest R
2 of 0.66 for cell count prediction, with an MAE of 0.1758 and an MSE of 0.0582. For dry biomass prediction, RF achieved an R
2 of 0.66, an MAE of 0.1458, and an MSE of 0.0583, indicating the highest accuracy among the models. Results showed that while the RF model achieved the highest accuracy for dry biomass prediction, the DTS model performed best for cell count prediction (
Table 2).
Because the RF model achieved the highest accuracy for dry biomass prediction and the DTS model performed best for cell count prediction (
Table 2), predictions for cell count and dry biomass were made using the DTS and RF models, respectively, based on the pixel values corresponding to all photos representing six days. The regression plots of predicted versus actual values shown in
Figure 3 and
Figure 4 are further detailed in
Figure 6A,B, corresponding to the test datasets used for cell count and dry biomass predictions, respectively. Summarily, the DTS model outperformed in cell count prediction with an R
2 value of 0.77, while the RF model excelled in dry biomass prediction, achieving an R
2 value of 0.66. Our study demonstrated high accuracy in predicting algal cell and biomass counts using color histograms. The efficacy of ML models in predicting algal blooms and biomass has been demonstrated in various studies. For instance, Pyo et al. [
28] employed a Convolutional Neural Network (CNN) for predicting cyanobacterial blooms, achieving a Nash-Sutcliffe Efficiency (NSE) of 0.87. Similarly, Derot et al. [
29] used Random Forest models coupled with K-means clustering for forecasting harmful algal blooms, achieving robust long-term prediction correlations. Saini et al. [
30] investigated the advantage of a hybrid ML approach for optimization of biomass production in
Nostoc sp., significantly improving both cell biomass and phycobiliproteins production. The innovative integration of image analysis with ML provides a scalable, automated solution for real-time algal biomass monitoring, promising significant advancements in environmental management and biofuel production.
Table 3 shows the comparison of ML models used in previous similar studies.
Today, machine learning algorithms such as MLR, SVR, and RF models have been used in the algal growth prediction in many different watersheds [
31,
32,
33]. Several studies have investigated chlorophyll content in microalgae using models like linear regression (LR), multilayer perceptrons, principal component analysis, and convolutional neural networks (CNNs) [
34,
35,
36,
37]. The accuracy of these methods ranges from 0.58 to 0.96, which varies due to algorithm performance and the presence of other pigments like carotenoids, phycocyanins, and astaxanthin. These additional pigments can interfere with chlorophyll detection, influencing the model’s precision.
Table 3.
Comparison of ML models used in previous similar studies.
Table 3.
Comparison of ML models used in previous similar studies.
| Predicted Parameters | Algae | ML Model | R2 | RMSE | Reference |
|---|
| Biomass concentration | C. vulgaris | k-NN | | 0.1 | Yew et al. [38] |
| Biomass concentration | Chlorella sorokiniana | RF, SVR | 0.81–0.87 | | Exposito et al. [39] |
| Biomass concentration | Rhodophyta
Spirulina | EFF
RES | 0.94–0.99 | | Peng et al. [16] |
| Biomass concentration | C. vulgaris | | 0.74–0.97 | | Salgueiro et al. [7] |
| Real-time monitoring and predicting | - | LSTM | | | Saboe et al. [40] |
| Cell density | - | MLR
XGBoost
RF
SVR | 0.53–0.60
0.59–0.66
0.64–0.67
0.56–0.60 | 180.63–198.81
167.38–191.98
110.37–182.14
186.66–201.27 | Xu et al. [26] |
3.3. Advances in Monitoring and Optimization
Traditional methods for measuring biomass concentration, such as the dry cell weight (DCW) method and instruments like UV spectrophotometers and flow cytometers, are labor-intensive, costly, and unsuitable for large-scale operations. IoT sensors combined with ML models present a low-cost, real-time alternative. These systems enable remote monitoring and optimization of cultivation conditions, reducing chemical use and environmental impact while improving productivity.
For instance, Yew et al. [
38] developed a k-NN model using RGB image data to estimate biomass concentration, nitrogen levels, and pH. This approach allows farmers to use simple photographs for real-time parameter estimation, eliminating the need for manual sampling. Future studies should focus on enhancing ML models for specific applications, including growth prediction and cultivation optimization.
ML models can optimize cultivation conditions to target biomass production or bioactive compound yields. The combined use of IoT and ML technologies enables precision agriculture practices, promoting sustainability while enhancing productivity. These innovations provide scalable, automated solutions for monitoring and optimizing algal biomass production, ensuring efficient resource use and minimal environmental impact.
This study highlights the importance of employing ML techniques to accurately predict algal cell counts and biomass concentration, thereby significantly enhancing the efficiency of monitoring processes. By utilizing Decision Trees, Random Forests, Gradient Boosting Machines, and K-Nearest Neighbors in conjunction with Color Histograms, we demonstrate a scalable and automated approach for monitoring algal production. The innovative use of daily image analysis throughout the entire life cycle of microalgae, from adaptation to death, not only provides a reliable measure of algal growth but also paves the way for future advancements in ecological monitoring and sustainable resource management. This research underscores the unique value of integrating advanced computational methods with traditional ecological studies, providing a benchmark for future applications in the field.
3.4. Real-World Implementation Framework
The proposed ML-based monitoring system can be seamlessly integrated into industrial-scale PBRs or algal cultivation facilities by deploying embedded cameras (e.g., Raspberry Pi with waterproof housings) at strategic points along the PBR to capture real-time images of algal cultures. These images are processed via an edge-computing device or cloud server, where pre-trained ML models (e.g., Decision Trees for cell counts, Random Forests for biomass) analyze color histograms (RGB/HSI) to predict algal density. The results feed into an automated control system that adjusts critical parameters (CO2 injection, nutrient dosing, light intensity) through IoT-connected actuators (e.g., solenoid valves, LED dimmers), thereby optimizing growth conditions without manual intervention. A centralized dashboard visualizes data trends and alerts operators to anomalies (e.g., contamination, nutrient depletion), enabling remote management.
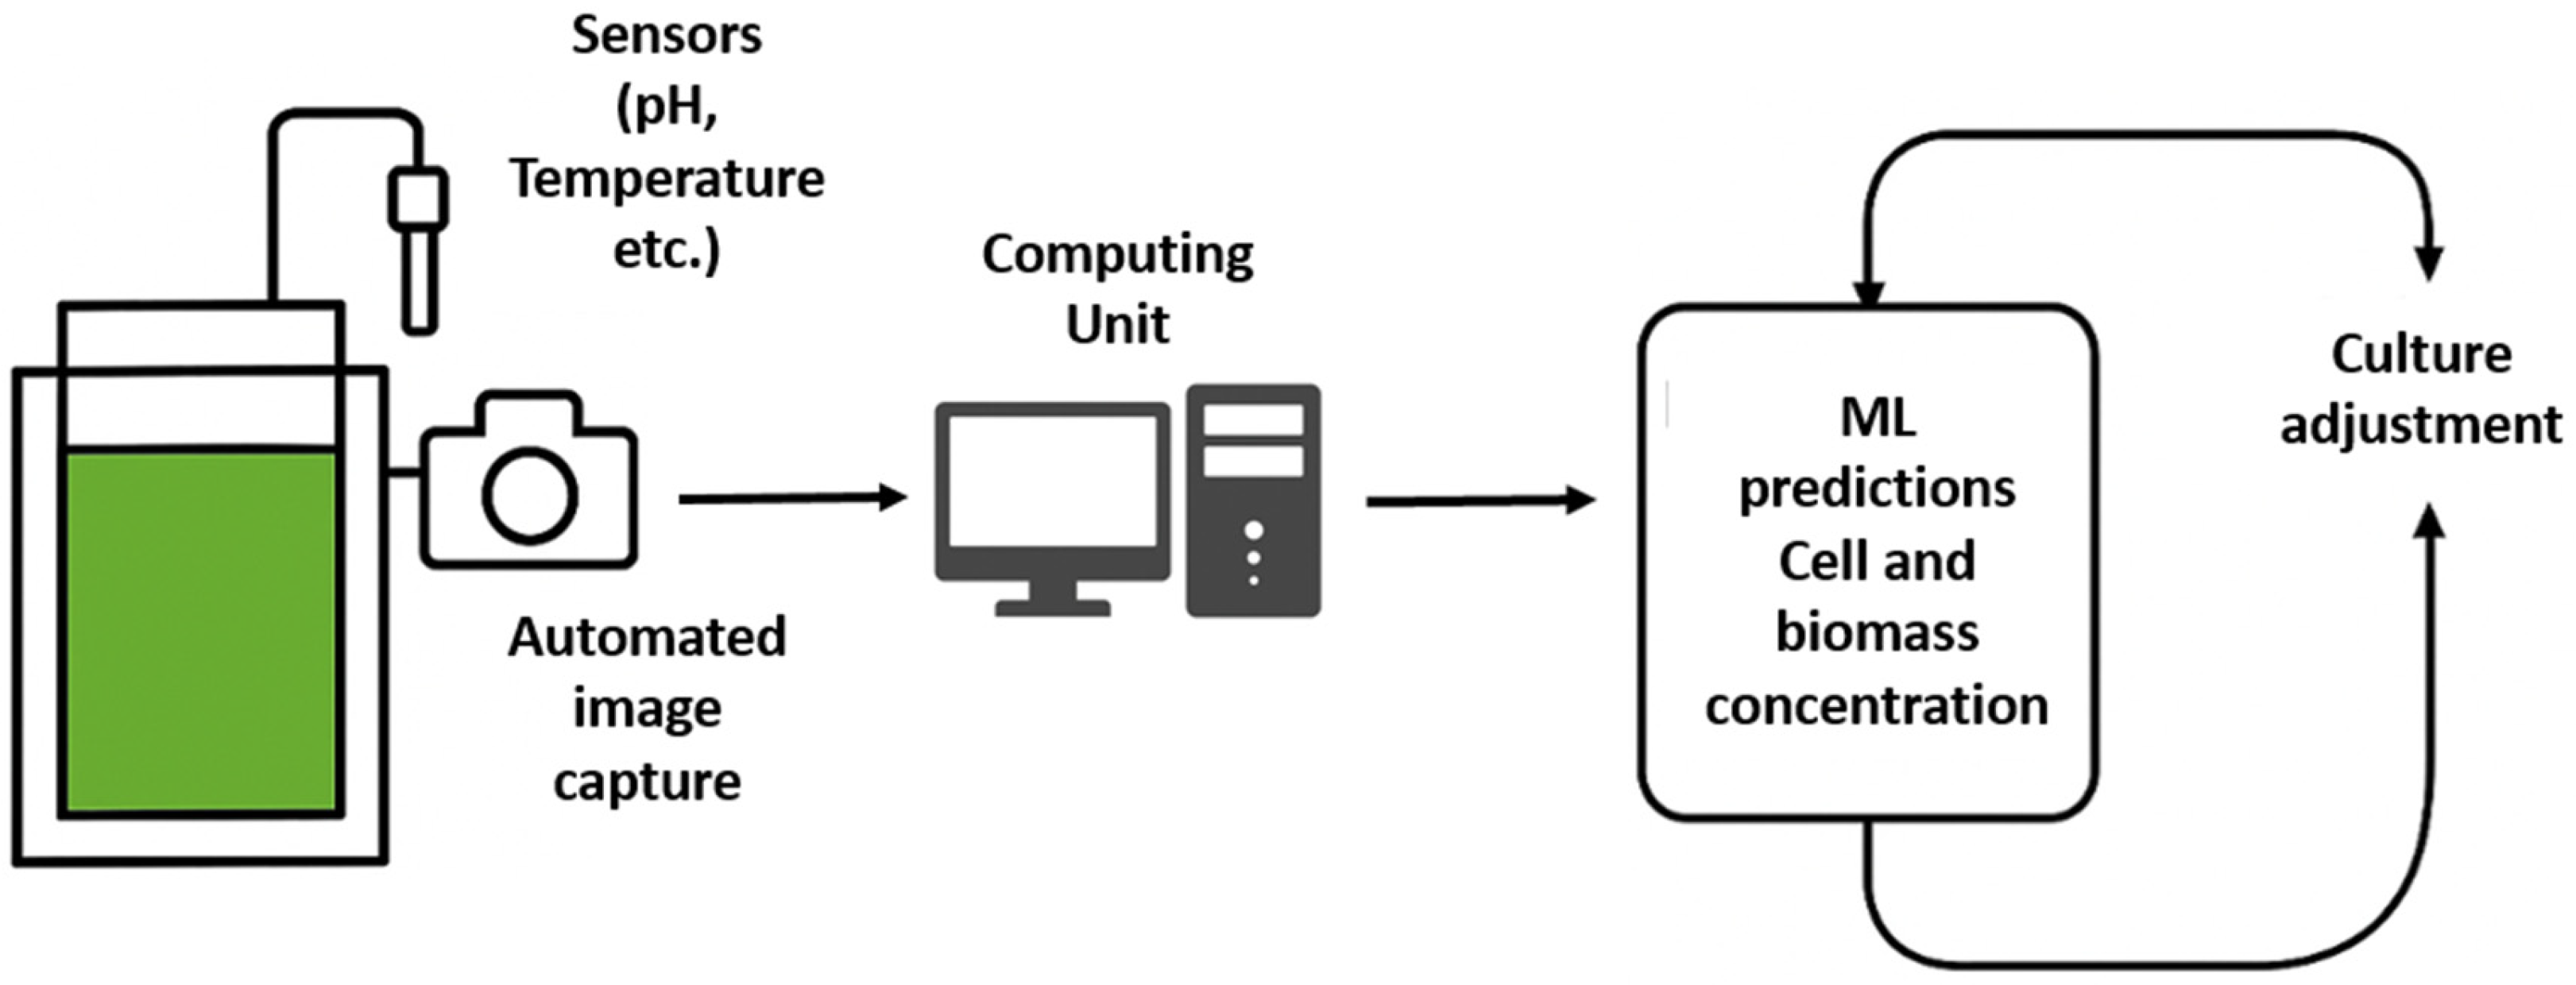
The implementation framework begins with the installation of digital cameras and complementary sensors inside the PBRs. High-resolution cameras capture periodic images of the culture, while additional sensors monitor environmental parameters such as light intensity, temperature, pH, and dissolved CO
2 (
Figure 7). This multi-sensor approach not only facilitates precise color histogram analysis for biomass estimation, as demonstrated in our study, but also enables data fusion to capture broader aspects of the cultivation environment. The integration of imaging with traditional sensor data has been shown to enhance prediction accuracy in dynamic cultivation systems, promoting real-time adjustments that are essential in industrial applications [
41].
Data collected from the cameras and sensors are transmitted via local wireless networks to an edge-computing node or directly to a cloud-based server. Dedicated data processing pipelines perform image preprocessing (including color normalization and segmentation) and real-time ML inference using the pre-trained models (e.g., Decision Trees for cell count and Random Forests for biomass prediction). The processed data are then integrated into a centralized platform that incorporates visualization dashboards and decision-support modules. For instance, a web-based dashboard can provide facility operators with real-time visualizations of algal biomass trends, predicted growth curves, and alerts for deviations from optimal culture conditions. This strategy mirrors similar successful deployments in agricultural IoT systems, where remote monitoring and control have led to significant improvements in yield and resource utilization [
42].
Furthermore, the real-world framework includes automated feedback control systems. If the ML models predict suboptimal growth or potential contamination based on abnormal coloration or sensor readings, the system can trigger alerts or autonomously modify process parameters like nutrient dosing, CO
2 injection, or lighting adjustments. This real-time adaptive control loop is critical for scaling laboratory methods to industrial operations, where maintaining consistent cultivation conditions is essential for maximizing productivity and ensuring biomass quality [
41].
3.5. Integration with Multi-Criteria Decision-Making Insights
This ML-based real-time monitoring sytems can be combined with the control system builds on the findings by Uguz et al. [
43], who demonstrated the use of multi-criteria decision-making (MCDM) methodologies to optimize CO
2 and NH
3 fixation by PBR systems varying gas concentrations. Their results provide practical guidance for producers seeking to configure PBR operating conditions to maximize pollutant mitigation and biomass productivity across various livestock housing systems, including dairy, poultry, and swine barns. For instance, air pollutant concentrations in poultry houses vary across the production cycle, necessitating dynamic adjustments of the CO
2 and NH
3 levels feeding into the PBR. The integration of ML-based real-time monitoring with engineering strategies—such as ventilation adjustments, pre-scrubber installations, or chemical amendments to the culture broth (e.g., carbonate or ammonium salt additions)—would allow for automated and precise control of gas concentrations, thus optimizing algal growth and pollutant removal efficiencies.
While MCDM approaches offer a low-complexity method suitable for manual or semi-automated decision-making tools (e.g., web calculators or Excel-based applications), the proposed ML-based system advances these capabilities by enabling continuous, real-time optimization without requiring producer intervention. This system directly addresses the recommendations made by Uguz et al. [
43] for simplifying and enhancing air pollutant mitigation strategies using PBRs, while also opening pathways for further integrating nutrient profiling (e.g., carbohydrate, protein, lipid contents) into decision-making frameworks. Similar integrated frameworks that combine predictive modeling with optimization techniques have been applied in engineering systems, as shown by Tian et al. [
44], who utilized a social engineering optimizer to enhance product recyclability via modular design. This highlights the broader applicability of such integrated decision-making systems beyond ecological contexts.
In summary, the real-world implementation of the proposed ML-based algal monitoring system involves the synergistic integration of high-resolution imaging, multi-sensor data acquisition, efficient data fusion, automated feedback control, and IoT connectivity. It not only supports continuous, real-time decision-making but also sets the stage for scalable, optimized, and environmentally beneficial algal cultivation in industrial settings. Combined with insights from MCDM analyses, this approach presents a robust foundation for advancing microalgae-based air pollutant mitigation and sustainable biomass production technologies.
3.6. Limitations and Future Directions
Despite the promising advancements in machine learning (ML)- and image analysis-based monitoring systems for photobioreactors (PBRs), several limitations remain that must be addressed to fully realize their potential in real-world scenarios. First, microalgal growth is influenced by dynamic and complex environmental factors—such as light intensity, nutrient availability, and temperature—that can fluctuate widely across cultivation environments. ML models, especially those trained on historical datasets or under simplified assumptions, may struggle to maintain prediction accuracy under these variable real-world conditions.
Although image analysis techniques, such as color histogram analysis, offer a scalable and low-cost method for non-invasive biomass estimation, practical implementation in industrial environments presents challenges. Lighting conditions may vary significantly, and biofouling on camera lenses or reactor walls can distort image quality, leading to unreliable predictions. Additionally, high-resolution cameras and IoT integration require technical maintenance and calibration, which could impose additional operational costs and training requirements for facility operators.
From a systems integration perspective, combining image data with real-time sensor networks and deploying reliable edge-computing or cloud infrastructure can be challenging in remote or resource-limited settings. Network connectivity, data transmission delays, and sensor drift can compromise system reliability. Moreover, installation of waterproof cameras and protective sensor enclosures adds to infrastructure costs, particularly for retrofitting existing PBR systems.
Another practical concern is user acceptance and training. For small-scale algae producers or rural facilities, the lack of technical expertise may hinder adoption of ML-based systems. User-friendly dashboards, automated alerts, and visual interfaces must be developed to lower the barrier for implementation and ensure effective decision-making.
Scalability also remains a significant concern. Models developed and validated on a limited dataset of Scenedesmus dimorphus may not generalize well across other algal strains or photobioreactor designs. Additionally, regulatory concerns related to automated monitoring systems in environmental or food applications may require standardized validation and compliance procedures.
To address these challenges and enhance practical deployment, future research and development efforts should prioritize the following:
Dynamic Model Development: Building ML models capable of adapting to changing environmental inputs by incorporating real-time sensor data streams beyond imaging alone. Multimodal data fusion (e.g., combining image analysis with temperature, pH, CO2, and light sensor data) could enhance prediction accuracy.
Scalability Testing: Conducting extensive validation of the ML-based monitoring systems across various scales, algal strains, and cultivation systems to ensure generalizability and reliability under operational variability.
Robust Image Processing: Improving image preprocessing algorithms to correct for lighting variations, biofouling on camera lenses, and occlusions within dense cultures, thus stabilizing biomass estimation under industrial conditions.
Automated Decision-Making: Expanding integration with automated feedback control systems to enable dynamic adjustment of key parameters such as CO2 injection rates, nutrient dosing, and lighting, ensuring optimal algal growth without manual intervention.
Integration with MCDM Frameworks: Incorporating insights from multi-criteria decision-making (MCDM) approaches, such as those demonstrated by Uguz et al. [
43], into ML control architectures could enhance optimization strategies, allowing for real-time balancing of biomass productivity and pollutant mitigation across dynamic production environments.
In summary, while the proposed ML-based system provides a promising, scalable approach to real-time algal monitoring, several practical limitations—including environmental variability, infrastructure requirements, user training, and system maintenance—must be addressed for successful real-world implementation. By combining robust algorithm development with thoughtful engineering design and user-centric deployment strategies, this technology can be transformed from a research prototype into a practical solution for sustainable biomass monitoring in industrial algal cultivation.


