Article

An Enhanced Genetic Algorithm for Optimized Educational Assessment Test Generation Through Population Variation

by
Doru-Anastasiu Popescu
Pitesti University Center, National University of Science and Technology POLITEHNICA Bucharest, 110040 Pitesti, Romania
Big Data Cogn. Comput. 2025, 9(4), 98; https://doi.org/10.3390/bdcc9040098
Submission received: 13 March 2025 / Revised: 26 March 2025 / Accepted: 9 April 2025 / Published: 11 April 2025

Abstract

:
The most important aspect of a genetic algorithm (GA) lies in the optimal solution found. The result obtained by a genetic algorithm can be evaluated according to the quality of this solution. It is important that this solution is optimal or close to optimal in relation to the defined performance criteria, usually the fitness value. This study addresses the problem of automated generation of assessment tests in education. In this paper, we present the design of a model of assessment test generation used in education using genetic algorithms. The assessment covers a series of courses taught over a period of time. The genetic algorithm presents an improvement or development, which consists of the initial population variation, obtained by the selection of a large fixed number of individuals from various populations, which are ordered by the fitness value using merge sort, chosen for the reason of the high number of individuals. The initial population variation can be seen as a specific modality for increasing the diversity and number of the initial population of a genetic algorithm, which influences the algorithm performance. This process increases the diversity and quality of the initial population, improving the algorithm’s overall performance. The development/novelty brought about by this paper is related to its application to a specific issue (educational assessment test generation) and the specific methodology used for population variation. This development can be applied for large sets of individuals, the variety, and the large number of generated individuals leading to higher odds to increase the performance of the algorithm. Experimental results demonstrate that the proposed method outperforms traditional GA implementations in terms of solution quality and convergence speed, showing its effectiveness for large-scale test generation tasks.

1. Introduction

An effective assessment involves the optimal selection of items (questions) that reflect both learning objectives and appropriate difficulty levels. The central problem addressed in this paper is to automate this process through a method that ensures the quality and balance of the generated tests, with an increase in the performance of the algorithm that automates this process. In this matter, the paper presents a model of educational assessment based on the generation of assessment tests with items that originated from a set of courses taught over a period of time (e.g., the generation of a multiple-choice test from a series of courses during a semester). This generation is made based on the selection of items from a dataset of items using a genetic algorithm. The choice of the items is made using algorithms from the meta-heuristic category because this selection is made based on specific requirements (e.g., degree of difficulty, topic etc.). The presence of requirements transforms the generational issue into a complex non-linear task. Thus, the usage of genetic algorithms is motivated in this context.
The design of the model includes an optimisational approach of the genetic algorithm. This leads to the increase of a genetic algorithm (GA) performance. The approach is based on using a population variation method based on large sets of individuals obtained sequentially after a defined number of runs of the genetic algorithm. As known, genetic algorithms can sometimes converge slowly to the optimal solution, especially for problems with large or complex search spaces. In addition, situations where genetic algorithms can tend to local minima may appear, failing to find global optimal solutions. The approach presented in the paper is based on several theoretical hypotheses whose validity will be tested using an implementation of the algorithm in the final part of the paper. These hypotheses consist shortly in the potential increase in diversity of the population (A) and the increase in the fitness value of the best chromosome (B). In this matter, the paper is structured on sections that present the main state-of-the-art results related to genetic populations variation approaches, as well as the description of the genetic algorithm and research methodology. In the final sections, an analysis and several conclusions of results obtained after the implementation of the model will be detailed.
The main purpose of the paper is the presentation of a design of a model used in educational assessment. A second purpose of the paper is the development of the performance of an instance of a genetic algorithm used within the specific context of education. The performance of the genetic algorithm can be improved by applying specific optimisation techniques to the genetic population. Thus, this paper shows that the variation of the genetic population, described shortly as the selection of best individuals of this population, combined with an efficient sorting technique of the mixed individuals, can form a good method of optimisation. The paper also aims to establish a potential of application of the described method in various optimisation problems.
The approach of population variation is not a novel approach for the optimisation of genetic algorithms. However, the innovative aspect of the approach described in this paper is based on several key points, such as the mix between the initial diversification and the chosen sorting method, which is designed for a scalable educational instrument. The sorting method is also a different approach, the majority of research in this area using other specific methods such as tournament selection. Besides taking into account the scalability, another main innovative key point is the flexibility in the genetic generation of educational assessment tests, based on the fitness function design and genetic data preprocessing (sorting and selection).
The main contribution of the paper lies in the application of this innovative method to the educational field, demonstrating how the selection and sorting of individuals from multiple populations can significantly improve the test generation process. The study provides a practical approach that can be extended to other types of optimization problems using genetic algorithms (GAs).
Genetic Algorithms (GAs) were selected for their ability to handle complex combinatorial optimization problems, such as test generation with multiple constraints (e.g., topic coverage, difficulty levels, time limits). Also, they allow the exploration of diverse solution spaces and to encode domain-specific constraints.

2. Literature Review

2.1. Qualitative Literature Analysis

The given issue related to the generation of test assessment used in education can be included in the general category of optimisation problems, due to the maxima/minima search of a solution and the requirements/restrictions existence based on existing resources. As known, several methods can be used to model the general issue of optimisation and the specific issue of generating assessment test based on specific restrictions. Among the most common techniques depicted in the literature, we can enumerate Linear Programming (LP) [1,2], Expert Systems [3,4], Recommender Systems [5,6], Supervised Learning [7,8], Particle Swarm Optimisation (PSO) [9,10], Simulated Annealing [11,12], Tabu Search, Evolutionary Algorithms for Multi-Criterion Optimization (MOEA) [13,14], Genetic Algorithms (GA) [15,16] or Ant Colony Optimisation (ACO) [17,18].
In order to determine the optimal choice of a given method, several criteria must be taken into consideration. Among the most important criteria, we can enumerate the complexity of the requirements, the performance related to computation costs, the accuracy of the solution and its scalability. The criteria was chosen related to the main expected outcomes for the results. Based on the literature specifications and theoretical principles, a comparative analysis was determined between the mentioned techniques. The analysis is presented in Table 1.
The most efficient algorithms based on the given criteria are determined as the supervised learning (Machine Learning—ML—in general), MOEA, genetic algorithms and Ant Colony Optimisation. In this matter, due to the simplicity in usage, their potential integration with other methods such as ML, the particular nature of the input data and its volume and based on previous research data and results of the authors, genetic algorithms tend to be the optimal solution related to the specific issue. This choice is also established as for their advantages in terms of flexibility, global exploration and ability to handle multi-objective problems.
The classical genetic algorithm approach can be improved based on several directions, increasing the advantages on the selected criteria shown in Table 1, mostly on scalability and accuracy, as well as the global convergence. This paper presents the development of a type of genetic algorithm used in the issue described briefly in the introduction, reinforcing the choice of GA in order to optimize in specific contexts.
The genetic algorithms are widely used in various fields (e.g., education, [19,20], agriculture [21], economics [22,23] etc.). The optimisation of the genetic algorithms and genetic programming in general has benefited from a wide research focus in the literature. The main components of genetic algorithms that can be used to improve their final results are identified [24] as being:
  • encoding techniques (e.g., binary-coded, real-coded);
  • genetic operators approach, for the crossover (e.g., single-point crossover, two-point crossover), mutation (e.g., swap mutation) or selection (e.g., sort, roulette wheel, tournament selection) operators, with variate configurations for each operator;
  • fitness function type, either being single or multiobjective type.
Thus, the main challenges that literature research shows are related mainly to:
  • algorithm convergence; the main risk related to the convergence is that the GA may concentrate on a local optimal point [25], due to the regeneration process which can lead to genetic drift, resulting in a large part of the space being left unexplored [26];
  • difficulty in large or complex dimensions of data;
  • the determination of the optimal genetic algorithm parameters;
  • search space challenges, where the solution space is massive and the searching process of the best chromosome is difficult.
In the literature, several strategies have been proposed to address optimization challenges in genetic algorithms:
  • Genetic operator enhancements, including response surface-based parameter tuning [27], advanced mutation [28], crossover techniques [13,29], and operator replacements such as simulated annealing [30] or simplex crossover [31,32];
  • Dynamic parameter adaptation, using fuzzy logic [33] or parameter-less strategies [34];
  • Hybrid algorithms, such as memetic algorithms [35], genetic-local search hybrids [36], hill climbing [37], gradient-based methods [38], or Lamarckian models [39];
  • Parallel and distributed GAs, which distribute computation across nodes or cores [40,41];
  • Elitism strategies, where top-performing individuals are preserved across generations [42,43,44].
The approach proposed in this paper aligns with elitism strategies and contributes to research on population variation. Key related directions include:
  • Population size adjustments, enhancing diversity and search space coverage [45,46];
  • Genetic operator optimization, such as adaptive parent selection and parameter tuning [47,48];
  • Chromosome selection methods, including sorting, randomness, scaling, or clustering techniques [49,50,51];
  • Hybrid diversity approaches, combining operator adaptability with inter-individual distance measures [52].
All these approaches show that a continuous search for the improvement of genetic algorithms is made. In this matter, the appliance of genetic algorithms for this specific issue is a legitimate choice related to the overall context of the generation.

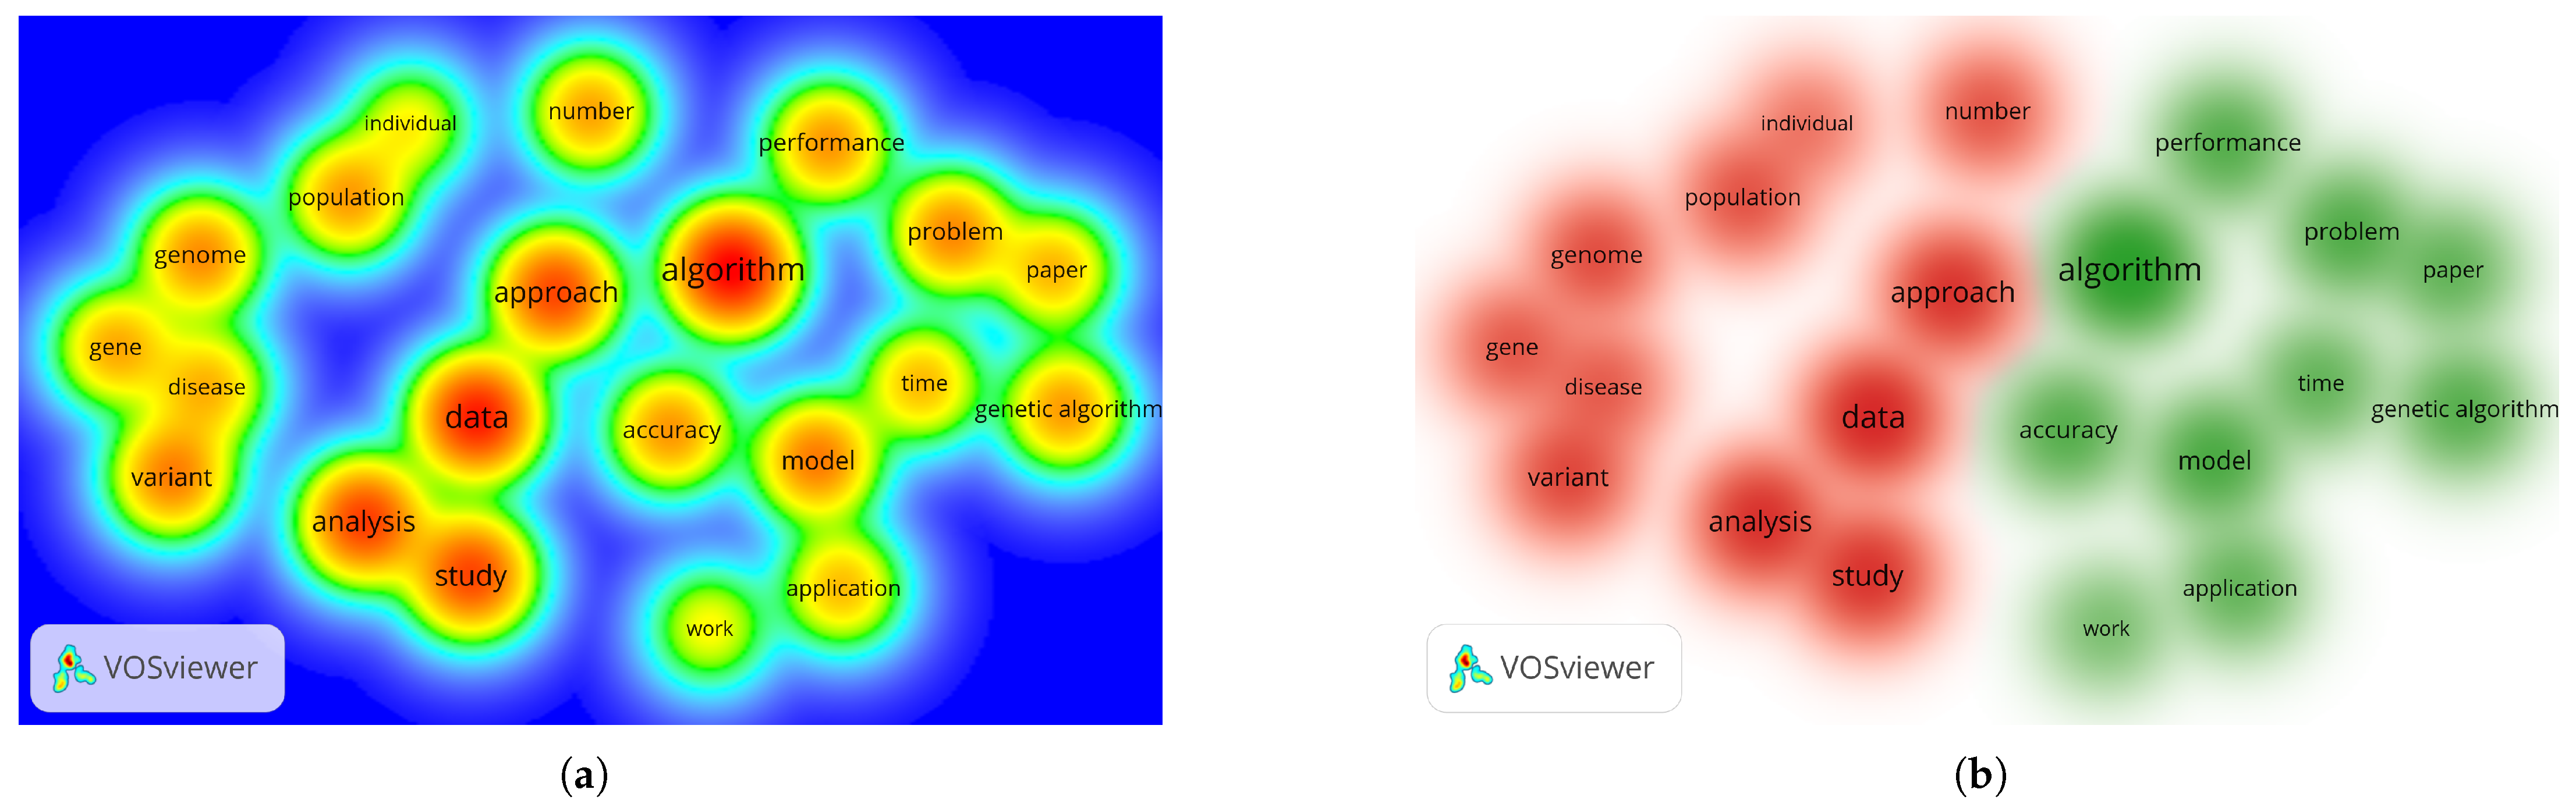
2.2. Quantitative Literature Analysis

A quantitative bibliographic analysis was conducted on a dataset of 2500 papers from the Dimensions.ai scientific database [53], aiming to identify the most relevant and frequently occurring terms related to genetic algorithm (GA) improvements. The goal was to highlight research trends and key areas of interest in GA population variation strategies.
The analysis steps were as follows:
Step 1: 
Keyword search: performed in Dimensions.ai using “genetic algorithm population variation”;
Step 2: 
Data export: via platform options;
Step 3: 
Term mapping: using VOSViewer 1.6.20 [54], with a minimum threshold of 50 occurrences, resulting in 21 terms.
The results include a term occurrence map (Figure 1) and a relevance-based term ranking (Table 2). The term maps highlight two major clusters delimited by two colours: one related to GA components (e.g., “gene”, “genome”), shown in red, and another emphasizing methodological aspects (“analysis”, “performance”, “time”), shown in green.
In summary, the analysis confirms a strong research focus on GA components and performance metrics. These findings support the relevance of population variation and operator optimization strategies, as summarized in Table 3.
Thus, the approach presented in this paper can be considered an elitism strategy, by selecting the most suited chromosomes in the final population.
While learning-based models excel in environments with large amounts of labeled data and well-defined reward signals, GAs remain advantageous in problems characterized by complex constraints, limited data availability, or when solution interpretability and customization are critical. In scenarios like assessment test generation—where domain rules, structural constraints, and expert-defined criteria play a central role—GAs offer a flexible and controllable optimization framework. Their ability to incorporate domain knowledge directly into the fitness function and operate effectively without extensive training data supports their continued relevance in such contexts.

3. Model Description

3.1. Purpose

The proposed method improves the initial stage of the genetic algorithm. Instead of generating a single random initial population, we build several parallel populations. From each, we select individuals based on their fitness value. Then, we combine all the selected individuals into an extended population. This is sorted using the merge sort algorithm, which is efficient for a large number of elements. From this sorted population, we choose the best individuals that will form the new initial population for the GA. With this approach, we increase the genetic diversity and the initial quality of the individuals. The result is a more efficient exploration of the solution space and a higher probability of reaching an optimal solution.
The model consists in the ensemble of the components/elements, structures and methodologies used to describe formally the described topic. The structures are classified into two main groups: one related to assessment test generation and the other related to genetic structures used in the generation mechanism. The main purpose of the model is to improve the overall performance of the genetic algorithm that generates the assessment tests. In this context, the performance is translated as a higher value of the fitness function value of the best chromosome than the highest value of the best chromosome of a usual GA instance, using the mentioned methodology.

3.2. Mathematical Formulation

The main objective of the model is to generate the optimal test from a question bank. This objective is translated as follows: the problem involves generating an optimal test S I from a large question bank D B = { q 1 , q 2 , , q N } such that:
max S I D B , | S I | = N f ( S I )
The f ( S I ) form is detailed in the paper. The obtained test must comply with the next restriction:
| D ( C ) u D | 0
where:
  • D ( S I ) is the average difficulty of the items in the test S I ;
  • u D is the user-defined target difficulty.
In order to generate the optimal test, an enhanced genetic algorithm is applied. The S I is codified in a genetic algorithm as a chromosome C. To obtain the best chromosome, the following procedure is applied:
  • Generate k independent sub-populations:
    P 1 , P 2 , , P k , where P i = { C i 1 , C i 2 , , C i m }
  • From each P i , select the top F chromosomes according to fitness:
    P O P i P i , | P O P i | = F
  • Merge all selected sets:
    P O P = i = 1 N G A P O P i
  • Sort P O P in descending order of f ( C ) using merge sort:
    P O P sorted = MergeSort ( P O P , f )
  • Select the top chromosome.
    C o p t i m a l = { C 1 } P O P sorted
This is a mathematical formulation of the problem related to the research.

3.3. Elements

The main elements are related to the description of the assessment test structures (the item, the sequence of items and the course), the genetic structures (the gene and the chromosome), the genetic operators (mutation, crossover and selection) and the methodology of the GA, presented as a usual implementation, as done in previous research work, and the current improved methodology.

3.3.1. Assessment Test Structures

The assessment test structures are the usual elements of an educational assessment based on quizzes or tests: assessment tests formed of items. The other two additional components are the set of courses for which the assessment is made (C) and the set of user requirements (R), as follows:
  • q: the item, a tuple i d , n k w , k w , d , t y p e , generated and stored in a database, where the elements of the tuple are:
    id, i d N : the unique identification particle of the item;
    nkw, n k w N : the number of keywords that define an item;
    kw, k w = { k w i | i { 1 , n k w } } : the set of keywords that define an item. A keyword k w i is a word or expression that describes the topic of the item. The set of keywords can be obtained manually by a human operator or automatically using Machine Learning (ML) based NLP (Natural Language Processing) techniques;
    d, d [ 0 , 1 ] : the degree of difficulty of the item, calculated using specific metrics (usually statistical, as the ratio between the correct number of responses to the item and the total number of answers to the item);
    type, t y p e { m , e , s } : the item type, where m has the meaning of multiple-choice item, e essay item and s short-answer item.
  • SI: the sequence of items, a tuple i d , m , Q , D , k w S I which codifies an educational assessment test generated based on requirements using genetic algorithms. The elements of the tuple are:
    id, i d N is the unique identification particle of the test;
    m N is the test size (number of questions);
    Q = { q i i m } is the set of items that form the test;
    k w S I = i = 1 m k w i : the reunion of the sets of keywords of all the items q within the sequence;
    D [ 0 , 1 ] is the degree of difficulty of the item, calculated as an average of the degrees of difficulty of all the items that form a test, as follows:
    D = 1 m i = 1 m q i ( d )
  • C: the set of courses, { C 1 , C 2 , . . . , C n } , where C i is a course taught in a series of courses over a period of time. The item formation is made from the content of these courses, either manually or using automated methods. The number of courses in the assessment can be represented equally (the number of items associated with a course C i equal with n m ) or weights given to courses can be considered w C = { w C i | w C i [ 0 , 1 ] } related to m.
  • R: the set of requirements { R 1 , R 2 R k }, where R i , i k is a requirement for the test generation and k the total number of requirements. A requirement is a rule set by the user for the final result of the assessment test (e.g., the degree of difficulty of the test). For this paper, k = 3 and the requirements are as follows:
    R 1 is the requirement related to the topic of the items needed in the sequence. This requirement is related to the u K W set of keywords desired by the user, where u K W = { u K W i i { 1 , n K W } } is the list of user-defined keywords and n K W their number;
    R 2 is the requirement related to the degree of difficulty. R 2 is related to the desired u D degree of difficulty. u D [ 0 , 1 ] ;
    R 3 is the requirement related to the predominant item type, which can take values from the t y p e set, thus u T { m , e , s } .

3.3.2. Genetic Structures

Genetic Structures and Fitness Function

The genetic structures encode the configuration of assessment tests for implementation within the genetic algorithm. The main elements are defined as follows:
  • g N : a gene representing an individual test item q i , where i { 1 , m } ;
  • C = { g i i m } : a chromosome encoding a sequence of items S I ;
  • P S I = ( N P , N G , r m , r c ) : a quadruple representing the genetic algorithm parameters:
    N P N —initial population size,
    N G N —number of generations,
    r m [ 0 , 1 ] —mutation rate,
    r c [ 0 , 1 ] —crossover rate.
  • f : C [ 0 , 1 ] : the fitness function, computed as an average of r = 5 weighted sigmoid functions:
    f ( C j ) = 1 r i = 1 r g ( r i ) , where g ( r i ) = 1 1 + e w i · r i ,
    with user-defined weights w i [ 0 , 1 ] , satisfying i = 1 r w i = 1 , and j { 1 , N G } .
Each r i represents a specific component of test quality:
  • r 1 = card ( u K W k w S I j ) : number of overlapping keywords between the user-defined set u K W and the test keywords k w S I j .
  • r 2 = 1 n K W k = 1 n K W f r k : average frequency of user-defined keywords u K W k in the sequence k w S I j . If any u K W k k w S I j , then r 2 = 0 .
  • r 3 = 1 1 n K W k = 1 n K W | f r k f r ¯ | : measures the uniformity of keyword usage; f r ¯ is the average frequency.
  • r 4 = 1 | D u D | : inverse of the absolute difference between the desired difficulty u D and actual test difficulty D.
  • r 5 = f r t u T m : proportion of user-preferred item type u T in the sequence of m items.
    The total area under the fitness curve over the interval [ 0 , 1 ] can be expressed as:
    0 1 f ( C j ) d x = 0 1 1 r i = 1 r g ( r i ) d x ,
    ensuring normalization and boundedness of the fitness function.

3.3.3. Genetic Operators

Genetic operators are actions applied to the chromosomes in order to modify chromosomes from a generation to another, for the increase of the performance. Genetic operators are mutation, crossover and selection, described as follows:
  • mutation operator Mut, defined as the replacement of a randomly-selected gene within a randomly-selected chromosome with a randomly-selected gene;
  • crossover operator Csv, where two parent chromosomes combine related to a randomly-selected position in a manner that two new child chromosomes are obtained;
  • selection operator Sel, which selects the chromosomes with the best fitness function values.

3.4. Usual and Improved GA Algorithm

The generation of the assessment tests can be made using a traditional GA algorithm (described in Section 3.4.1) and implemented in previous research papers. This paper presents a development of this genetic algorithm (described in Section 3.4.2). The two algorithms presented in the next subsections are related to:
  • the initial (usual) algorithm, that was used to generate assessment test in previous papers;
  • the improved algorithm, developed based on the methodology currently presented in this paper.

3.4.1. Usual GA Algorithm

For the usual GA methodology, the next steps are applied (Algorithm 1):
Step 1:
The input data (Q set, P S I , u D , u K W and u T ) is read.
Step 2:
The genetic algorithm is applied, as follows:
(a)
the generation of the initial population of items is made;
(b)
the mutation operation is applied;
(c)
the crossover operation is applied;
(d)
the resulted chromosomes are selected;
(e)
after N G generations, the best chromosome is selected.
Step 3:
The best chromosome is input.
Algorithm 1 Usual GA algorithm
1:
Input: Question set Q, parameters P S I = ( N P , N G , r m , r c ) , user preferences u D , u K W , u T
2:
Output: Best chromosome C * representing the optimal test
3:
g 0
4:
P O P 0 from D B
5:
while  g < N G  do
6:
       M u t on P g with rate r m
7:
       C r s on P g with rate r c
8:
       f ( C ) for each chromosome C P O P g
9:
      Select chromosomes to form next population P O P g + 1
10:
     g g + 1
11:
end while
12:
C * P O P 0
13:
return  C *

3.4.2. Improved GA Algorithm

For the usual GA methodology, the next steps are applied (Algorithm 2):
Step 1:
The input data (Q set, P S I , u D , u K W , u T , N G A and F) is read. N G A is the number of runs of genetic algorithm and F is the number of chromosomes taken into account at each run.
Step 2:
The genetic algorithm is applied, as follows:
(a)
the generation of the initial population of items is made;
(b)
the mutation operation is applied;
(c)
the crossover operation is applied;
(d)
the resulted chromosomes are selected;
(e)
after N G generations, the best F chromosomes are selected and added to the P O P set, where P O P retains the best F chromosomes from each GA run.
Step 3:
After N G A runs, the P O P set is established.
Step 4:
Merge sort is applied in P O P set depending on the fitness values.
Step 5:
The best chromosome is input.
Algorithm 2 Improved GA algorithm
1:
Input: Question set Q, parameters P S I = ( N P , N G , r m , r c ) , user preferences u D , u K W , u T
2:
Output: Best chromosome C * representing the optimal test
3:
Generate N G A sub-populations P O P 1 , P O P 2 , , P O P N G A
4:
for each P O P i  do
5:
       M u t on P g with rate r m
6:
       C r s on P g with rate r c
7:
      Evaluate fitness of all chromosomes in P O P i
8:
      Select top F chromosomes S E L i
9:
end for
10:
P O P i = 1 N G A S E L i
11:
Sort P O P using merge sort in descending order by fitness
12:
C * P O P 0
13:
return  C *

4. Research Methodology

In order to determine the increase in performance of the algorithm, we have established a methodology of the analysis of this performance, based on the comparison between the performances of the two algorithms (usual and improved). The current research methodology section presents the established set of steps used to validate the hypotheses A and B presented in Section 1. The methodology comprises the next steps:
Step RM1.
Purpose: the main purpose of the methodology was to validate the hypotheses A and B referred as improvements for the usual GA algorithm.
Step RM2.
Design: the design step included the research type used in the study, the used variables (the fitness value and the population diversity) and the study group of individuals, delimited by the chosen GA algorithm. These elements are described as follows:
  • research type: the research was made using the observational study method. This method was chosen as the results related to diversity and performance can be compared directly;
  • variables: new operations were applied to the usual GA algorithm that were presented in previous sections. The two variables computed for the hypotheses were:
    f b e s t , the fitness value of the best chromosome;
    v a r , the population diversity, calculated as the average value of all the Euclidean distances between the chromosomes in the final population:
    v a r = 1 N ( N 1 ) i = 1 N j = 1 , j i N D ( i , j )
    where
    D ( i , j ) = k = 1 m ( g i k g j k ) 2
  • study groups: two main comparison groups were determined:
    G 1 , the control group, consisting in the best chromosome and its calculated fitness value, as well as the representative population, for the usual GA algorithm;
    G 2 , the experimental group, consisting in the best chromosome and its calculated fitness value, as well as the representative population, for the improved GA algorithm.
The main purpose of this step was to establish a research context which would include performance analysis (by fitness values and variation) and comparative observations between the two described approaches (initial and improved GA).
Step RM3.
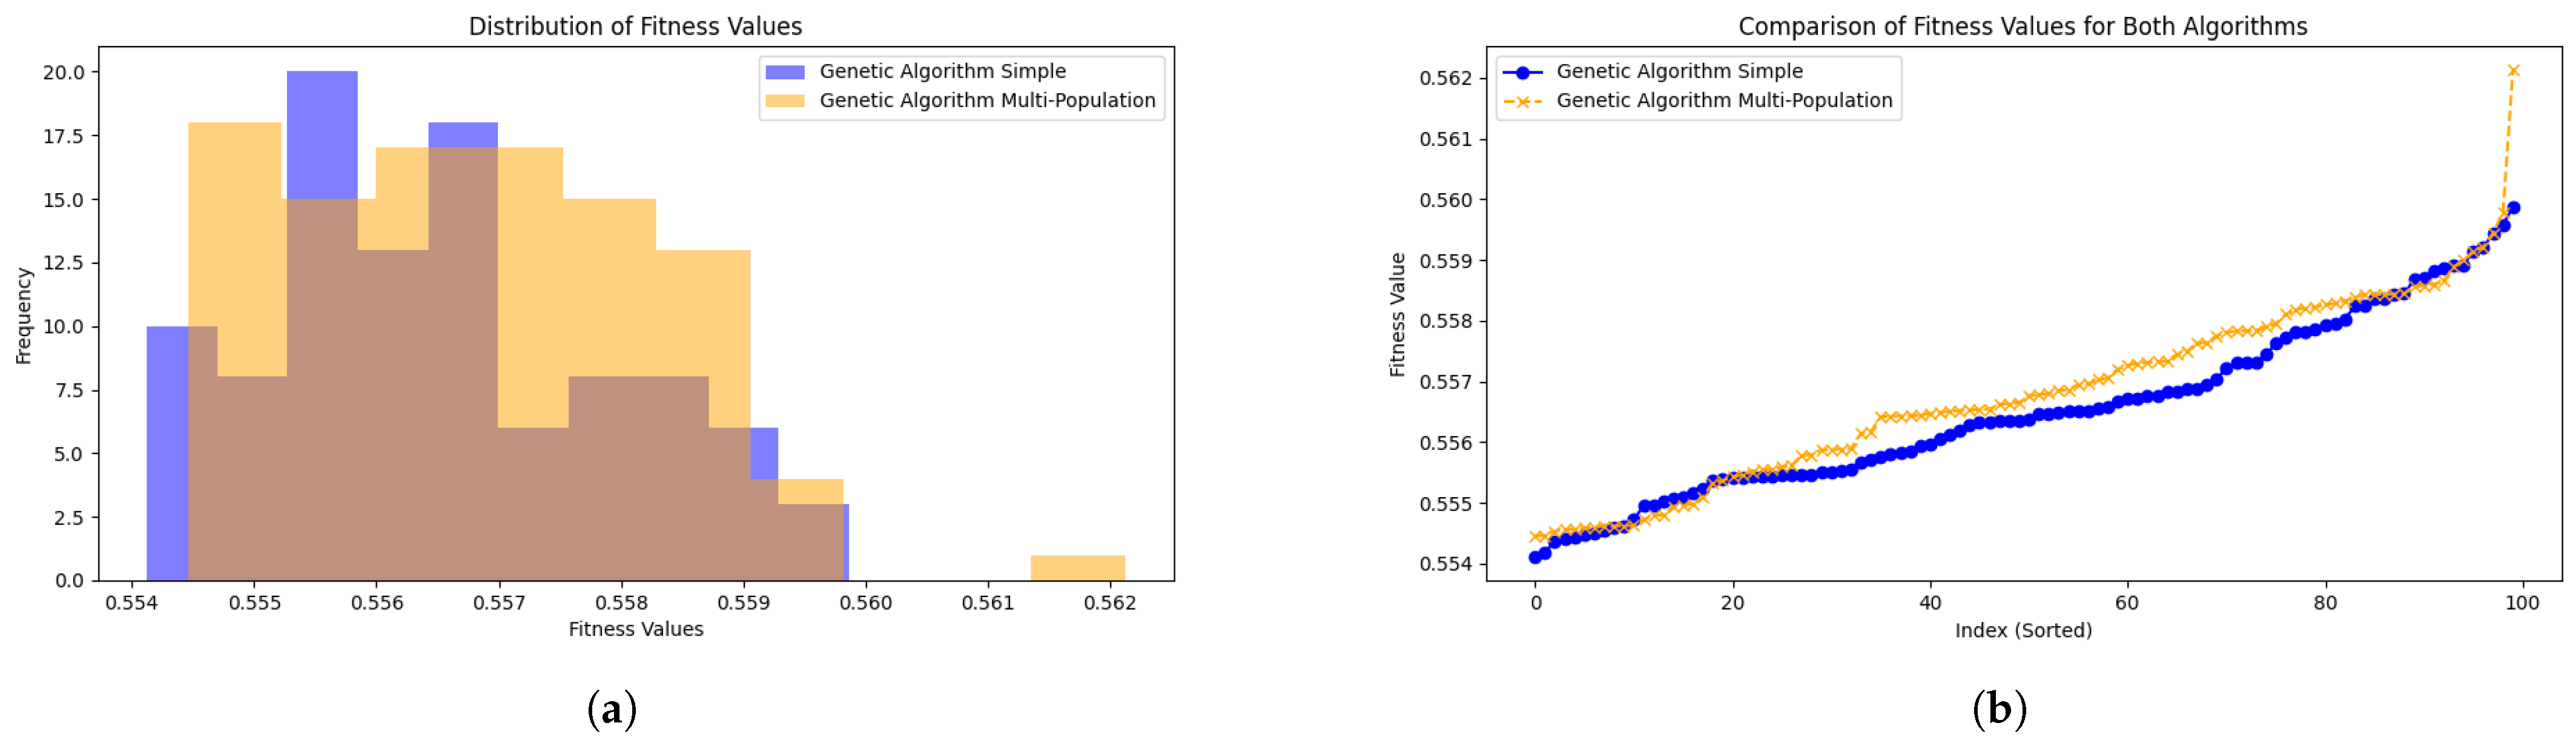
Hypotheses formulation: Two main hypotheses were formulated:
  • hypothesis A: The population diversity v a r G 2 for the G 2 group is higher than the population diversity v a r G 1 for the G 1 group.
  • hypothesis B: The fitness value f b e s t G 2 for the G 2 group is higher than the fitness value f b e s t G 1 for the G 1 group.
These hypotheses were determined in order to establish the scientific approach related to the improvements brought by the novel GA in connection to population diversity and performance.
Step RM4.
Data collection: item data was randomly generated using implementation-based techniques. The usage of randomly-generated data created an unbiased context related to human influence on the selection of initial items. Also, the experimental nature of the approach is a preliminary step for the implementation of the described method using real-time context data.
Step RM5.
Data analysis: the direct comparison method was used. The comparison was made between the mean values of the fitness and variation variables for rounds of runs (each round was a mean of five runs). This approach ensured that extreme values or exceptional cases were not used to determine the performance. After the computation of the values, these were directly compared in order to establish the differences in performance.
Step RM6.
Limitations: obviously, the approach has several in-built limitations, referring to the next facts:
  • Euclidean distance may not always reflect semantic or functional differences between individuals in the population.
  • Using the fitness function value of the best chromosome to measure diversity may not be representative of the entire population.
  • The calculation methods of Euclidean distance and fitness function value are influenced by specific parameters of the genetic algorithm, such as coding, selection method, crossover and mutation rates, etc. Changing these parameters can affect the diversity measures and lead to different interpretations of the results.
  • A single measure (Euclidean distance) may not be sufficient to fully understand population diversity. Other approaches, such as entropy, may be used.

5. Results and Discussions

The first observation related to results is related to algorithm complexity. Although the improved (multi-population) algorithm may have higher complexity ( O ( N G A × N P × m + N G A × N × l o g N ) ) then the usual (simple) algorithm ( O ( N G × m × N )) due to population sorting, the difference is not significant when N G A is small, and the population size is not extremely large. However, the improved (multi-population) algorithm could offer advantages in terms of solution diversity and long-term stability, compensating for the additional complexity.
The proposed model uses standard GA hyperparameters: size of the database of items (N), number of items within the test (m), and number of generations ( N G ). Experimental results in previous research show that increasing m or N G has a direct impact on runtime. For instance, increasing m from 20 to 100 (with fixed N = 2000 , N G = 500 ) increases runtime from 6.68 s to 8.62 s. Similarly, higher N G values (e.g., N G = 1200 ) lead to longer runtimes, as expected.
Despite this, the improved algorithm consistently outperforms the baseline in efficiency. However, the method remains sensitive to parameter tuning and shows increased computational cost with very large N or deep evolutionary runs.
The second part of results is related to experiments. In order to determine the effectiveness of the improved algorithm, two experiments were run. The first one was established on randomly-generated data, the second one being run in a close to real environment.
The first experiment was detailed based on a randomly-generated data using Python 3.12. The parameters were determined as follows:
  • the number of items in the database (N) was 1000;
  • the number of courses was set to 5 (n = 5)
  • the number of desired items in the sequence (m) was 10;
  • three keywords were chosen ( u K W = 4 ) ;
  • a degree of difficulty of 0.4 was chosen ( u D = 0.4 ) ;
  • the desired type of question was chosen as multiple-choice ( u T = m ) ;
  • the mutation rate was established at 0.8 ( r m = 0.1 ) ;
  • the crossover rate was established at 0.5 ( r c = 0.5 ) ;
  • the population size was established at 50 ( N P = 50 ) ;
  • the number of generations was established at 50 ( N G = 50 ) ;
  • the proportion of best chromosomes for each population was established at 10 ( F = 10 ) ;
  • the number of obtained generation was set to 50 ( N G A = 50 ) .
The environment was set to generate the best chromosome from each method. The algorithm was then run for 100 times for each algorithm, in order to obtain the best chromosome for each time. The results are shown in Table 4.
The resulted tests were obtained accordingly to the requirements established in the previous list (the degree of difficulty, the distribution related to courses, the predominant question type and the topics). The visual representations of the obtained fitness values from the 100 best chromosomes for each algorithm are presented in Figure 2.
Analysis of the results shows that the two genetic algorithms provide fitness values with a higher amount towards the improved genetic algorithm. The usual (simple) algorithm has a maximum fitness of 0.559866, a minimum of 0.554124 and an average of 0.556522, and the improved (multi-population) algorithm achieves a maximum fitness of 0.562122, a minimum of 0.554461 and an average of 0.556801. Although the improved (multi-population) algorithm has a higher complexity due to population sorting, the performance differences are minimal, and its advantages in solution diversity and long-term stability can compensate for this additional cost.
The second implementation was built as a web application using Laravel framework was used for the obtaining of the results. The screenshot of the input form is shown in Figure 3a.
The determination of the given groups was made and a number of 10 runs was made. The initial GA parameters were established as follows:
  • the number of items in the database (N) was 400;
  • the number of desired items in the sequence (m) was 10;
  • three keywords were chosen ( u K W = 3 ) ;
  • a degree of difficulty of 0.4 was chosen ( u D = 0.4 ) ;
  • the desired type of question was chosen as multiple-choice ( u T = m ) ;
  • the mutation rate was established at 0.1 ( r m = 0.1 ) ;
  • the crossover rate was established at 0.5 ( r c = 0.5 ) ;
  • the population size was established at 50 ( N P = 10 ) ;
  • the number of generations was established at 50 ( N G = 50 ) ;
  • the proportion of best chromosomes for each population was established at 10 ( F = 10 ) ;
  • the number of obtained generation was set to 100 ( N G A = 100 ) .
The choice of the values of the genetic algorithm that were described above was made based on experimental trials during the previous research instances on the topic. Also, a method of determination of the best configuration of parameter values using a distributed system for a genetic algorithm was developed in [55] and the current choice of the values was based on the principles presented in the mentioned research paper. The findings in this paper and the experimental trials during previous research determined that the parameters of the genetic algorithm greatly influence the performance of an algorithm in terms of speed and accuracy. Based on these findings, several aspects were determined:
  • the initial population size and the database size influences greatly the diversity of the final population;
  • higher mutation and crossover rates lead to finer and more accurate results, with moderately higher values of fitness function as the rates increase, but with a mild increase in runtime;
  • the number of generations influences greatly the accuracy of the results, increasing the fitness values with higher rates, but also having an great impact on the runtime.
Thus, there can be established that the genetic algorithm parameters have a significant impact on the performance in terms of obtained fitness values and on the runtime. Also, the datasets used in the process, especially on a quantitative side, and its configuration lead to changes in the final results.
In this matter, the experimental data was established in the form of a dataset of questions which has specific characteristics, as shown in Figure 3b. The main characteristics were defined as:
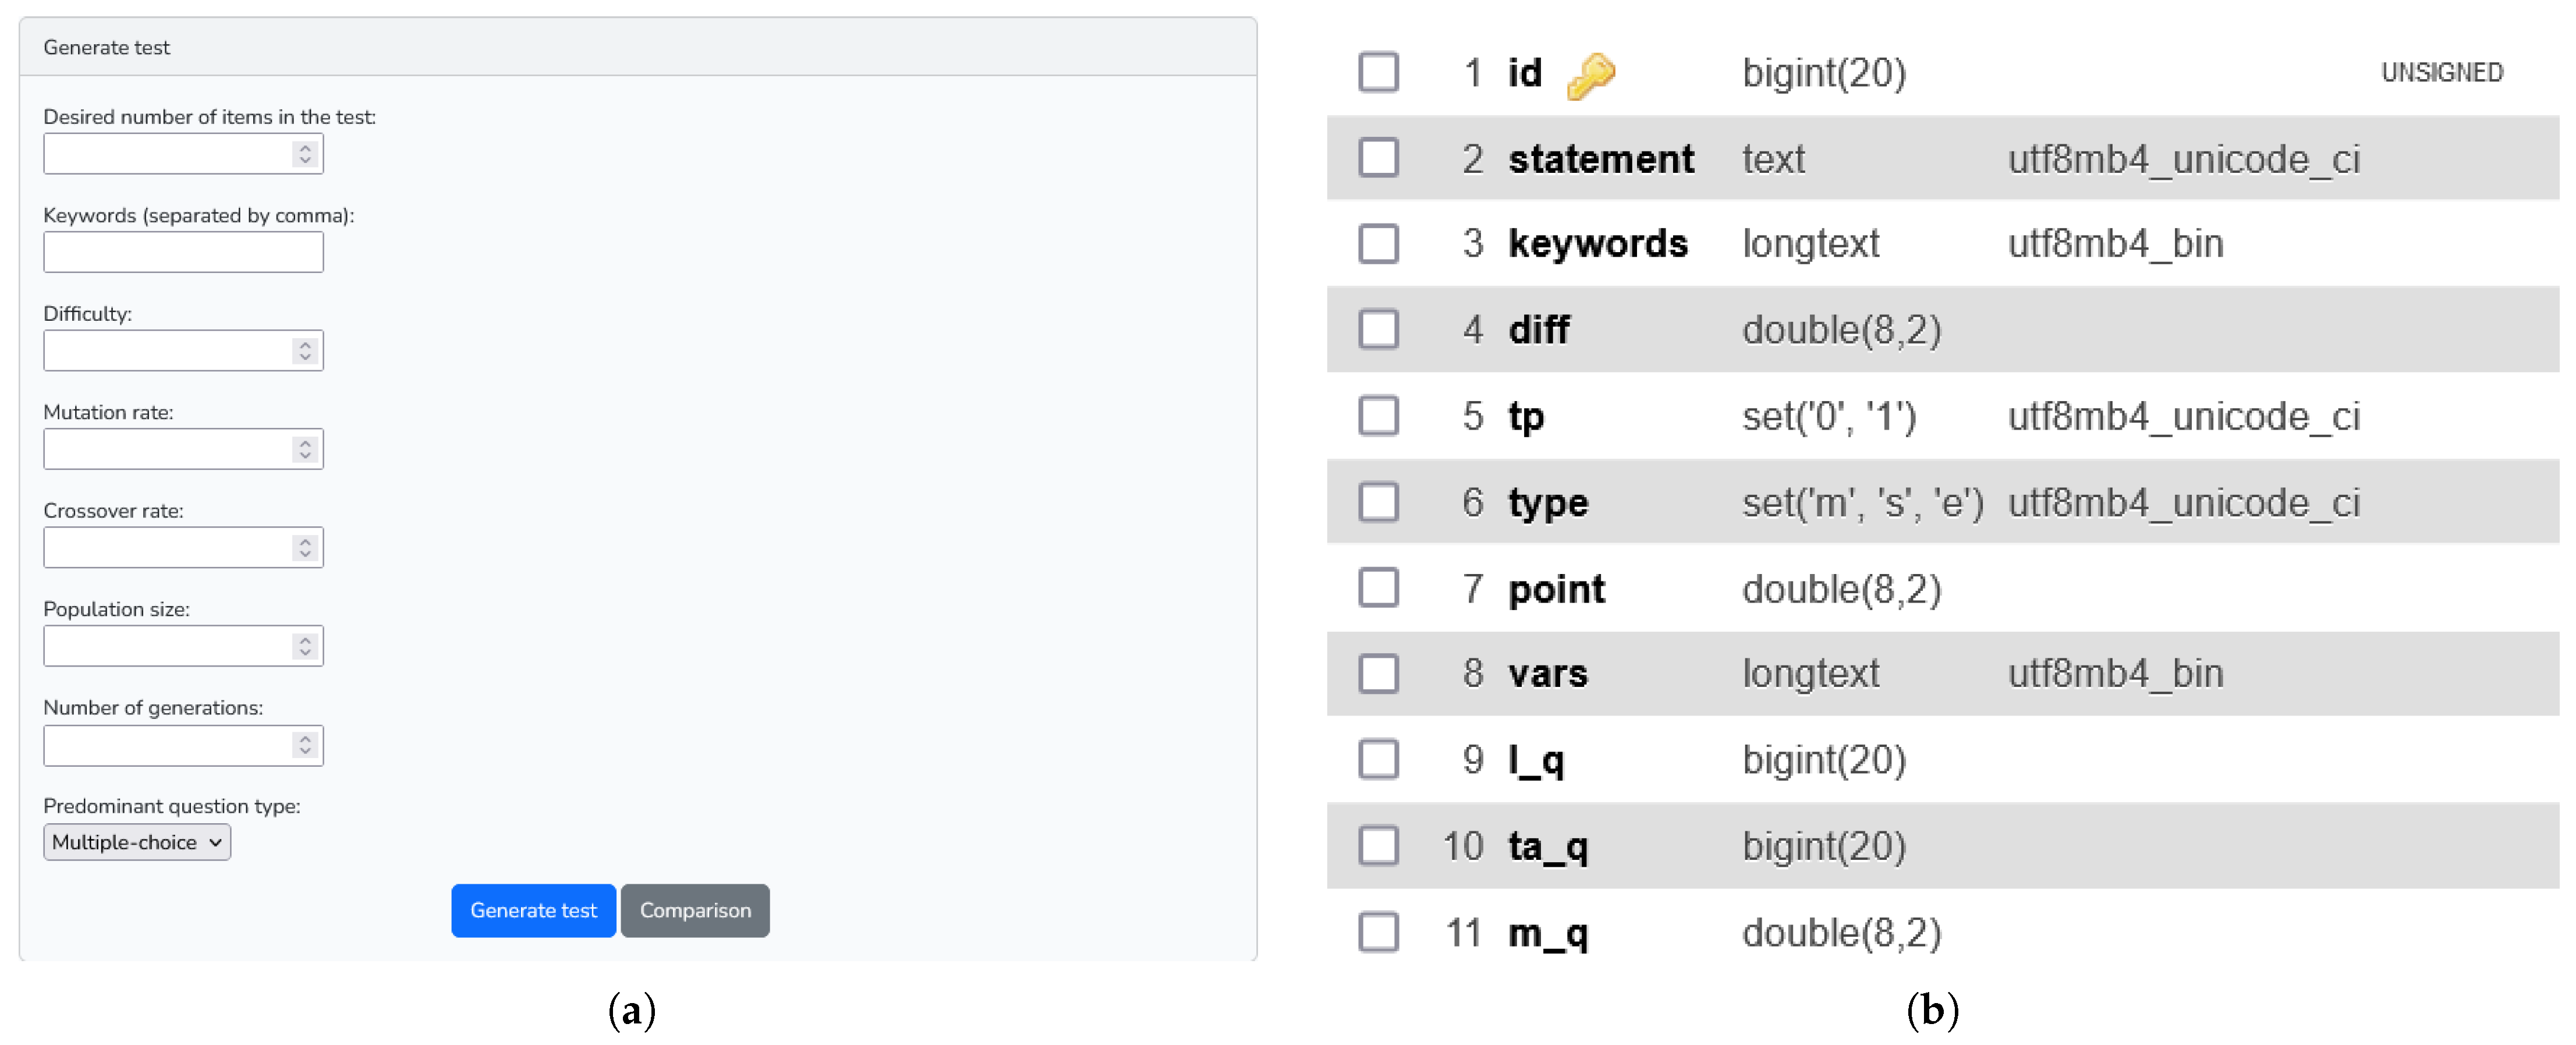
  • the item identification number (id);
  • the statement (statement);
  • the set of keywords defining the item (keywords);
  • the degree of difficulty (diff);
  • the type (multiple choice, short or essay) (type);
  • the choices statement (whether the case) (vars);
  • the theoretical or practical nature of the item (tp);
  • the score of the item (point).
The item database also contains several statistical indicators related to the answers:
  • the average score of the item (m_q);
  • the number of correct answers to the item (l_q);
  • the number of students that answered the item (ma_q).
The experimental setup was establish within the web application developed as the main data generator. Thus, computational aspects are also connected to the server performance. Related to this aspect, the technical parameters ensured that the hardware-based performance is reached (server load at 7.03, indicating a sub-usage, a high number of cores, approximately 20% usage of RAM memory and 0% swap memory usage).
Regarding data structure, randomly generating data in the initial population can increase the diversity of solutions at the beginning of the evolutionary process. A drawback would be excessive, uncontrolled variability that can lead to a population of very different individuals with reduced fitness, requiring several generations for the algorithm to converge to an optimal solution. In this matter, this drawback was attenuated by the improved GA method. Also, the randomly-generated data was established as a solid solution until a massive well structured database of question is compiled.
The results are obtained in Table 5. The presented table gives the results obtained from 10 runs of an experiment, in which the values of fitness and variation (as an indicator of diversity) were measured for two groups: the control group (G1) and the experimental group (G2).
Firstly, we can observe a slight improvement on the values of the fitnesses in the second experiment, showing that organized real-life data has impact on the final results, with better results than the randomly-generated data. The improvement is observed in the higher values of all fitness values and in the difference between the G1 and G2 groups.
Then, the fitness values for the control group (G1) range between 0.557 and 0.573, with a mean of 0.566. These values show a relatively constant performance within the group, without major fluctuations. In contrast, the fitness values for the experimental group (G2) are very close to each other, ranging between 0.576 and 0.580, with an average of 0.578. This indicates a very good stability of performance in the G2 group.
The variation (var), which represents the diversity indicator of the chromosome population, shows considerable variation in the control group (G1), with values between 214.318 and 292.030 and a mean of 252.494. This indicates significant variation in chromosome diversity within the G1 group. Comparatively, the variation for the experimental group (G2) is narrower, with values between 279.087 and 286.446 and a mean of 282.668. This suggests greater and more consistent diversity in the G2 group.
The observations show that the fitness values for both groups (G1 and G2) are relatively stable, but the G2 group demonstrates greater stability, having very close fitness values and a smaller variation. Group G1 shows greater variability in fitness values, indicating less constant individual performance compared to G2. In addition, group G2 has slightly higher mean fitness values (0.578) than group G1 (0.566), suggesting better overall performance.
In conclusion, the results indicate that the G2 group not only has a higher average performance, but also a greater and more consistent diversity compared to the G1 group. These results suggest a clear advantage of the G2 group in the specific context of this experiment, with higher values of fitness and diversity indicators, which is beneficial according to the metrics used.
Related to computational complexity, the large number of individuals generated during the methodology is a step that generates a lot of cost in terms of technical resources, but this cost is compensated related to complexity by the usage of an efficient selection and sort method. As previously known, the complexity of the merge sort algorithm is O ( n   log   n ) , which reflects in the overall algorithm.
The implementation example is run within an educational context, but the improved method can be applied in various contexts which uses similar encoding or have a specific form of the fitness function that permits the sorting process. Also, the method can be extended to other methods inspired from nature. For example, the proposed initialization strategy can be effectively adapted to Particle Swarm Optimization (PSO). Instead of generating a single swarm, multiple sub-swarms can be created, each evaluated based on particle fitness. The best particles from each group can then be merged and ranked—e.g., using merge sort—to form a high-quality, diverse initial swarm. This approach may enhance exploration and reduce the risk of premature convergence, particularly in high-dimensional or complex search spaces.
Main limitations include increased computational cost due to multi-population processing and sorting, sensitivity to parameter tuning, and reduced performance on poorly annotated data. Like most GAs, the method does not guarantee global optimality and may require adjustments for scalability on large datasets.
As a conclusion, population variation inference in a genetic algorithm using multiple merge-sorted populations shows promising results, as shown in the previous table.

6. Conclusions

Population variation inference in a genetic algorithm using multiple merge-sorted populations shows promising results in terms of population diversity and fitness function value related to:
  • Population diversity: using multiple nested sorted populations resulted in greater diversity in the total population;
  • Exploration of the solution space: multiple populations allow for a wider exploration of the solution space;
  • Convergence to higher-quality solutions: the combination of population diversity and exploration of the solution space can contribute to convergence to higher-quality solutions;
  • Need to adjust parameters: to get the best results, it may be necessary to adjust the parameters of the genetic algorithm.
By merging populations from different sources, the genetic material introduced into the algorithm is inherently more diverse. This diversity is crucial for avoiding premature convergence, where the population becomes too similar and stops exploring new solutions.
Thus, population variation inference in a genetic algorithm using multiple merge-sorted populations offers a novel approach to enhancing the effectiveness of evolutionary search strategies. By leveraging the strengths of various populations that are sorted based on their fitness values, this method can significantly improve both population diversity and the fitness function value.
Future work would consist in the development of the item dataset used in the process, including the structural, configurational and ethical aspects, by incorporating an ethical framework into the development and deployment of automated test generation is essential to ensure fairness, transparency, and accountability. Also, more experiments designed to establish a performance comparison with classical approaches of genetic algorithms or other techniques such the ones described in Table 1 will be made, in order to further emphasize the increase in performance of the currently described research.
By enhancing population diversity and improving fitness function values, this method not only increases the chances of finding optimal solutions but also makes the search process more efficient and adaptable to a wide range of complex problems.

Funding

This research received no external funding.

Institutional Review Board Statement

Not applicable.

Informed Consent Statement

Not applicable.

Data Availability Statement

Dataset available on request from the author.

Conflicts of Interest

The author declares no conflicts of interest.

Abbreviations

The following abbreviations are used in this manuscript:
GAGenetic Algorithm
LPLinear Programming
PSOParticle Swarm Optimisation
MOEAEvolutionary Algorithms for Multi-Criterion Optimization
ACOAnt Colony Optimisation
MLMachine-Learning
NLPNatural Language Processing

References

  1. Bertsimas, D.; Tsitsiklis, J.N. Introduction to Linear Optimization; Athena Scientific: Belmon, MA, USA, 1997; pp. 479–530. [Google Scholar]
  2. Nemhauser, G.L.; Wolsey, L.A. Integer and Combinatorial Optimization; Wiley-Interscience: New York, NY, USA, 1999. [Google Scholar]
  3. Jackson, P. Introduction to Expert Systems, 3rd ed.; Addison-Wesley Longman Publishing Co., Inc.: Boston, MA, USA, 1998. [Google Scholar]
  4. Giarratano, J.C.; Riley, G.D. Expert Systems: Principles and Programming; Brooks/Cole Publishing Co.: Pacific Grove, CA, USA, 2005. [Google Scholar]
  5. Ricci, F.; Rokach, L.; Shapira, B. (Eds.) Recommender Systems Handbook, 3rd ed.; Springer: New York, NY, USA, 2022. [Google Scholar]
  6. Adomavicius, G.; Tuzhilin, A. Toward the Next Generation of Recommender Systems: A Survey of the State-of-the-Art and Future Directions. IEEE Trans. Knowl. Data Eng. 2005, 17, 734–749. [Google Scholar] [CrossRef]
  7. Mitchell, T.M. Machine Learning; McGraw-Hill: New York, NY, USA, 1997. [Google Scholar]
  8. Bishop, C.M. Pattern Recognition and Machine Learning; Springer: Berlin/Heidelberg, Germany, 2006. [Google Scholar]
  9. Kennedy, J.; Eberhart, R. Particle Swarm Optimization. In Proceedings of the IEEE International Conference on Neural Networks, Perth, Australia, 27 November–1 December 1995; pp. 1942–1948. [Google Scholar]
  10. Clerc, M.; Kennedy, J. The Particle Swarm—Explosion, Stability, and Convergence in a Multidimensional Complex Space. IEEE Trans. Evol. Comput. 2002, 6, 58–73. [Google Scholar] [CrossRef]
  11. Aarts, E.H.L.; Lenstra, J.K. Local Search in Combinatorial Optimization; John Wiley & Sons: Hoboken, NJ, USA, 1997. [Google Scholar]
  12. Kirkpatrick, S.; Gelatt, C.D.; Vecchi, M.P. Optimization by Simulated Annealing. Science 1983, 220, 671–680. [Google Scholar] [CrossRef]
  13. Deb, K.; Agrawal, R.B. Simulated binary crossover for continuous search space. Complex Syst. 1995, 9, 115–148. [Google Scholar]
  14. Zitzler, E.; Thiele, L. Multiobjective Evolutionary Algorithms: A Comparative Case Study and the Strength Pareto Approach. IEEE Trans. Evol. Comput. 1999, 3, 257–271. [Google Scholar] [CrossRef]
  15. Holland, J.H. Adaptation in Natural and Artificial Systems; University of Michigan Press: Ann Arbor, MI, USA, 1975. [Google Scholar]
  16. Goldberg, D.E. Genetic Algorithms in Search, Optimization, and Machine Learning; Addison-Wesley: New York, NY, USA, 1989. [Google Scholar]
  17. Dorigo, M.; Stützle, T. Ant Colony Optimization; MIT Press: Cambridge, MA, USA, 2004. [Google Scholar]
  18. Blumer, A.; Karp, R.M. Ant Algorithms for Network Routing. In Proceedings of the International Conference on Networking and Services, Las Vegas, NV, USA, 23–26 June 2003. [Google Scholar]
  19. Popescu, D.A.; Stanciu, G.C.; Nijloveanu, D. Evaluation Test Generator Using a List of Keywords. In Proceedings of the Intelligent Tutoring Systems: 17th International Conference, ITS 2021, Virtual Event, 7–11 June 2021; Proceedings 17. Springer: Berlin/Heidelberg, Germany, 2021; pp. 481–489. [Google Scholar]
  20. Victor, T.; Daniel, N.; Popescu, D.A.; Bold, N. Study on the efficiency of the design of the drip irrigation management system using plastics. J. Intell. Fuzzy Syst. 2022, 43, 1697–1705. [Google Scholar] [CrossRef]
  21. Nijloveanu, D.; Tita, V. Elaboration of some models to reduce the hydric erosion in Olt county. Econ. Eng. Agric. Rural Dev. 2012, 12, 169–282. [Google Scholar]
  22. Thakkar, A.; Chaudhari, K. Applicability of genetic algorithms for stock market prediction: A systematic survey of the last decade. Comput. Sci. Rev. 2024, 53, 100652. [Google Scholar] [CrossRef]
  23. Smedescu, D.; Tudor, V.; Micu, M.M.; Mărcuță, L.; Mărcuță, A.; Smedescu, C. Comparative insights into labour productivity trends in the european union’s agri-food sector. Sci. Pap. Ser. Manag. Econ. Eng. Agric. Rural Dev. 2024, 24, 899–908. [Google Scholar]
  24. Chahar, V.; Katoch, S.; Chauhan, S. A Review on Genetic Algorithm: Past, Present, and Future. Multimed. Tools Appl. 2021, 80, 8091–8126. [Google Scholar]
  25. Angelova, M.; Pencheva, T. Tuning Genetic Algorithm Parameters to Improve Convergence Time. Int. J. Chem. Eng. 2011, 2011, 646917. [Google Scholar] [CrossRef]
  26. Pandey, H.M.; Chaudhary, A.; Mehrotra, D. A comparative review of approaches to prevent premature convergence in GA. Appl. Soft Comput. 2014, 24, 1047–1077. [Google Scholar] [CrossRef]
  27. Ibrahim Kucukkoc, A.D.K.; Yaman, R. Using response surface design to determine the optimal parameters of genetic algorithm and a case study. Int. J. Prod. Res. 2013, 51, 5039–5054. [Google Scholar] [CrossRef]
  28. Deep, K.; Thakur, M. A new mutation operator for real coded genetic algorithms. Appl. Math. Comput. 2007, 193, 211–230. [Google Scholar] [CrossRef]
  29. Ono, I. A real-coded genetic algorithms for function optimization using unimodal normal distribution crossover. In Proceedings of the Seventh International Conference on Genetic Algorithms: Michigan State University, East Lansing, MI, USA, 19–23 July 1997; pp. 246–253. [Google Scholar]
  30. Tan, K.; Li, Y.; Murray-Smith, D.; Sharman, K. System Identification And Linearisation Using Genetic Algorithms With Simulated Annealing. In Proceedings of the First International Conference on Genetic Algorithms in Engineering Systems: Innovations and Applications, Sheffield, UK, 12–14 September 1995. [Google Scholar]
  31. Hedar, A.R.; Fukushima, M. Simplex Coding Genetic Algorithm for the Global Optimization of Nonlinear Functions; Springer: Berlin/Heidelberg, Germany, 2003. [Google Scholar]
  32. Da Ronco, C.C.; Benini, E. A simplex crossover based evolutionary algorithm including the genetic diversity as objective. Appl. Soft Comput. 2013, 13, 2104–2123. [Google Scholar] [CrossRef]
  33. Richter, J.N.; Peak, D. Fuzzy evolutionary cellular automata. In Proceedings of the International Conference on Artificial Neural Networks In Engineering, Honolulu, HI, USA, 12–17 May 2002; Volume 24, p. 185. [Google Scholar]
  34. Harik, G.R.; Lobo, F.G. A parameter-less genetic algorithm. In Proceedings of the GECCO, Orlando, FL, USA, 13–17 July 1999; Volume 99, pp. 258–267. [Google Scholar]
  35. Feng, L.; Ong, Y.S.; Gupta, A. Genetic algorithm and its advances in embracing memetics. In Evolutionary and Swarm Intelligence Algorithms; Springer: Berlin/Heidelberg, Germany, 2019; pp. 61–84. [Google Scholar]
  36. Wan, W.; Birch, J.B. An improved hybrid genetic algorithm with a new local search procedure. J. Appl. Math. 2013, 2013, 103591. [Google Scholar] [CrossRef]
  37. Yusoff, M.; Roslan, N. Evaluation of genetic algorithm and hybrid genetic algorithm-hill climbing with elitist for lecturer university timetabling problem. In Proceedings of the Advances in Swarm Intelligence: 10th International Conference, ICSI 2019, Chiang Mai, Thailand, 26–30 July 2019; Proceedings, Part I 10. Springer: Berlin/Heidelberg, Germany, 2019; pp. 363–373. [Google Scholar]
  38. D’Angelo, G.; Palmieri, F. GGA: A modified genetic algorithm with gradient-based local search for solving constrained optimization problems. Inf. Sci. 2021, 547, 136–162. [Google Scholar] [CrossRef]
  39. Ross, B.J. A Lamarckian evolution strategy for genetic algorithms. In Practical Handbook of Genetic Algorithms; CRC Press: Boca Raton, FL, USA, 2019; pp. 1–16. [Google Scholar]
  40. Akopov, A.S.; Beklaryan, L.A. Traffic Improvement in Manhattan Road Networks With the Use of Parallel Hybrid Biobjective Genetic Algorithm. IEEE Access 2024, 12, 19532–19552. [Google Scholar] [CrossRef]
  41. Whitley, D.; Starkweather, T. Genitor II: A distributed genetic algorithm. J. Exp. Theor. Artif. Intell. 1990, 2, 189–214. [Google Scholar] [CrossRef]
  42. Bhandari, D.; Murthy, C.A.; Pal, S.K. Genetic algorithm with elitist model and its convergence. Int. J. Pattern Recognit. Artif. Intell. 1996, 10, 731–747. [Google Scholar] [CrossRef]
  43. Ahn, C.W.; Ramakrishna, R.S. Elitism-based compact genetic algorithms. IEEE Trans. Evol. Comput. 2003, 7, 367–385. [Google Scholar]
  44. Du, H.; Wang, Z.; Zhan, W.; Guo, J. Elitism and distance strategy for selection of evolutionary algorithms. IEEE Access 2018, 6, 44531–44541. [Google Scholar] [CrossRef]
  45. Kouchakpour, P.; Zaknich, A.; Bräunl, T. Population variation in genetic programming. Inf. Sci. 2007, 177, 3438–3452. [Google Scholar] [CrossRef]
  46. Gibbs, M.S.; Maier, H.R.; Dandy, G.C. Using characteristics of the optimisation problem to determine the genetic algorithm population size when the number of evaluations is limited. Environ. Model. Softw. 2015, 69, 226–239. [Google Scholar] [CrossRef]
  47. Kouchakpour, P.; Zaknich, A.; Bräunl, T. Dynamic population variation in genetic programming. Inf. Sci. 2009, 179, 1078–1091. [Google Scholar] [CrossRef]
  48. Shapiro, B.A.; Wu, J.C.; Bengali, D.; Potts, M.J. The massively parallel genetic algorithm for RNA folding: MIMD implementation and population variation. Bioinformatics 2001, 17, 137–148. [Google Scholar] [CrossRef]
  49. Razali, N.M.; Geraghty, J. Genetic algorithm performance with different selection strategies in solving TSP. In Proceedings of the World Congress on Engineering, London, UK, 6–8 July 2011; International Association of Engineers: Hong Kong, China, 2011; Volume 2, pp. 1–6. [Google Scholar]
  50. Kreinovich, V.; Quintana, C.; Fuentes, O. Genetic algorithms: What fitness scaling is optimal? Cybern. Syst. 1993, 24, 9–26. [Google Scholar] [CrossRef]
  51. Chehouri, A.; Younes, R.; Khoder, J.; Perron, J.; Ilinca, A. A selection process for genetic algorithm using clustering analysis. Algorithms 2017, 10, 123. [Google Scholar] [CrossRef]
  52. Xinping, L.; Ying, L. Adaptive Genetic Algorithm Based on Population Diversity. In Proceedings of the 2009 International Forum on Information Technology and Applications, Chengdu, China, 15–17 May 2009; Volume 2. [Google Scholar]
  53. Hook, D.W.; Porter, S.J.; Herzog, C. Dimensions: Building Context for Search and Evaluation. Front. Res. Metrics Anal. 2018, 3, 23. [Google Scholar] [CrossRef]
  54. Wong, D. VOSviewer. Tech. Serv. Q. 2018, 35, 219–220. [Google Scholar] [CrossRef]
  55. Popescu, D.A.; Ileana, M.; Bold, N. Analyzing the Performance of Distributed Web Systems Within an Educational Assessment Framework. In Breaking Barriers with Generative Intelligence; Using GI to Improve Human Education and Well-Being; Basiouni, A., Frasson, C., Eds.; Springer: Berlin/Heidelberg, Germany, 2024; pp. 102–115. [Google Scholar]
Figure 1. Term occurrence map: (a) term density; (b) cluster organization.
Bdcc 09 00098 g001
Figure 2. The obtained values of fitness for the two algorithms: (a) The frequency of the obtained fitness values. (b) The variation of the fitness values.
Bdcc 09 00098 g002
Figure 3. Implementation aspects: (a) The form in the implementation page. (b) The dataset characteristics.
Bdcc 09 00098 g003
Table 1. Analysis of optimisation techniques that can be potentially used for the assessment test generation.
MethodComplexityCompute CostAccuracyScalabilityMain Disadvantage
LPModerateHighHighModerateDiversity of item types
Expert systemsLowLowModerateLowAdaptability
Recommender systemsModerateModerateModerateModeratePartial optimisation
Supervised learningHighVariableHighHighBig Data for training
PSOModerateModerateHighHighPremature convergence
Simulated AnnealingModerateModerateModerateModerateGlobal exploration
MOEAHighHighHighHigh-
GAHighModerateHighHigh-
ACOModerateModerateHighHigh-
Table 2. Top 11 terms by relevance score.
No.TermRelevance ScoreOccurrences
14paper24.47798
20variant19.765139
17problem18.002131
7disease16.69797
10genome16.482128
19time12.33296
9genetic algorithm2.651117
8gene2.082106
15performance0.7211121
3analysis0.6668202
16population0.6054116
Table 3. Strategies used to optimise GAs found in the literature.
No.ChallengeStrategies
1Algorithm convergenceLamarckian genetic algorithms
Parallel and distributed GAs
2Large dimensions of dataGenetic-local search methods
3GA parameterFuzzy logic
Parameter-less
Variation in genetic operators
Genetic operator replacement
Hybrid algorithms
4Search spaceResponse surface-dependent
parameter
Elitism strategies
Table 4. Comparative table between algorithms.
MetricUsual GAImproved GA
Max Fitness0.5598660.562122
Min Fitness0.5541240.554461
Avg Fitness0.5565220.556801
Table 5. The research implementation results.
No.RunFitness G1Fitness G2var G1var G2
1Run 10.5730.576274.155283.806
2Run 20.5680.579250.249279.087
3Run 30.5570.576214.318283.185
4Run 40.5700.579292.030285.178
5Run 50.5670.579223.110281.297
6Run 60.5620.579238.708281.993
7Run 70.5640.579288.253281.107
8Run 80.5680.580275.557283.338
9Run 90.5670.580232.573286.446
10Run 100.5620.576235.989281.244
Average0.5660.578252.494282.668
Disclaimer/Publisher’s Note: The statements, opinions and data contained in all publications are solely those of the individual author(s) and contributor(s) and not of MDPI and/or the editor(s). MDPI and/or the editor(s) disclaim responsibility for any injury to people or property resulting from any ideas, methods, instructions or products referred to in the content.

