


Optimized Resource Allocation Algorithm for a Deadline-Aware IoT Healthcare Model


Abstract
1. Introduction
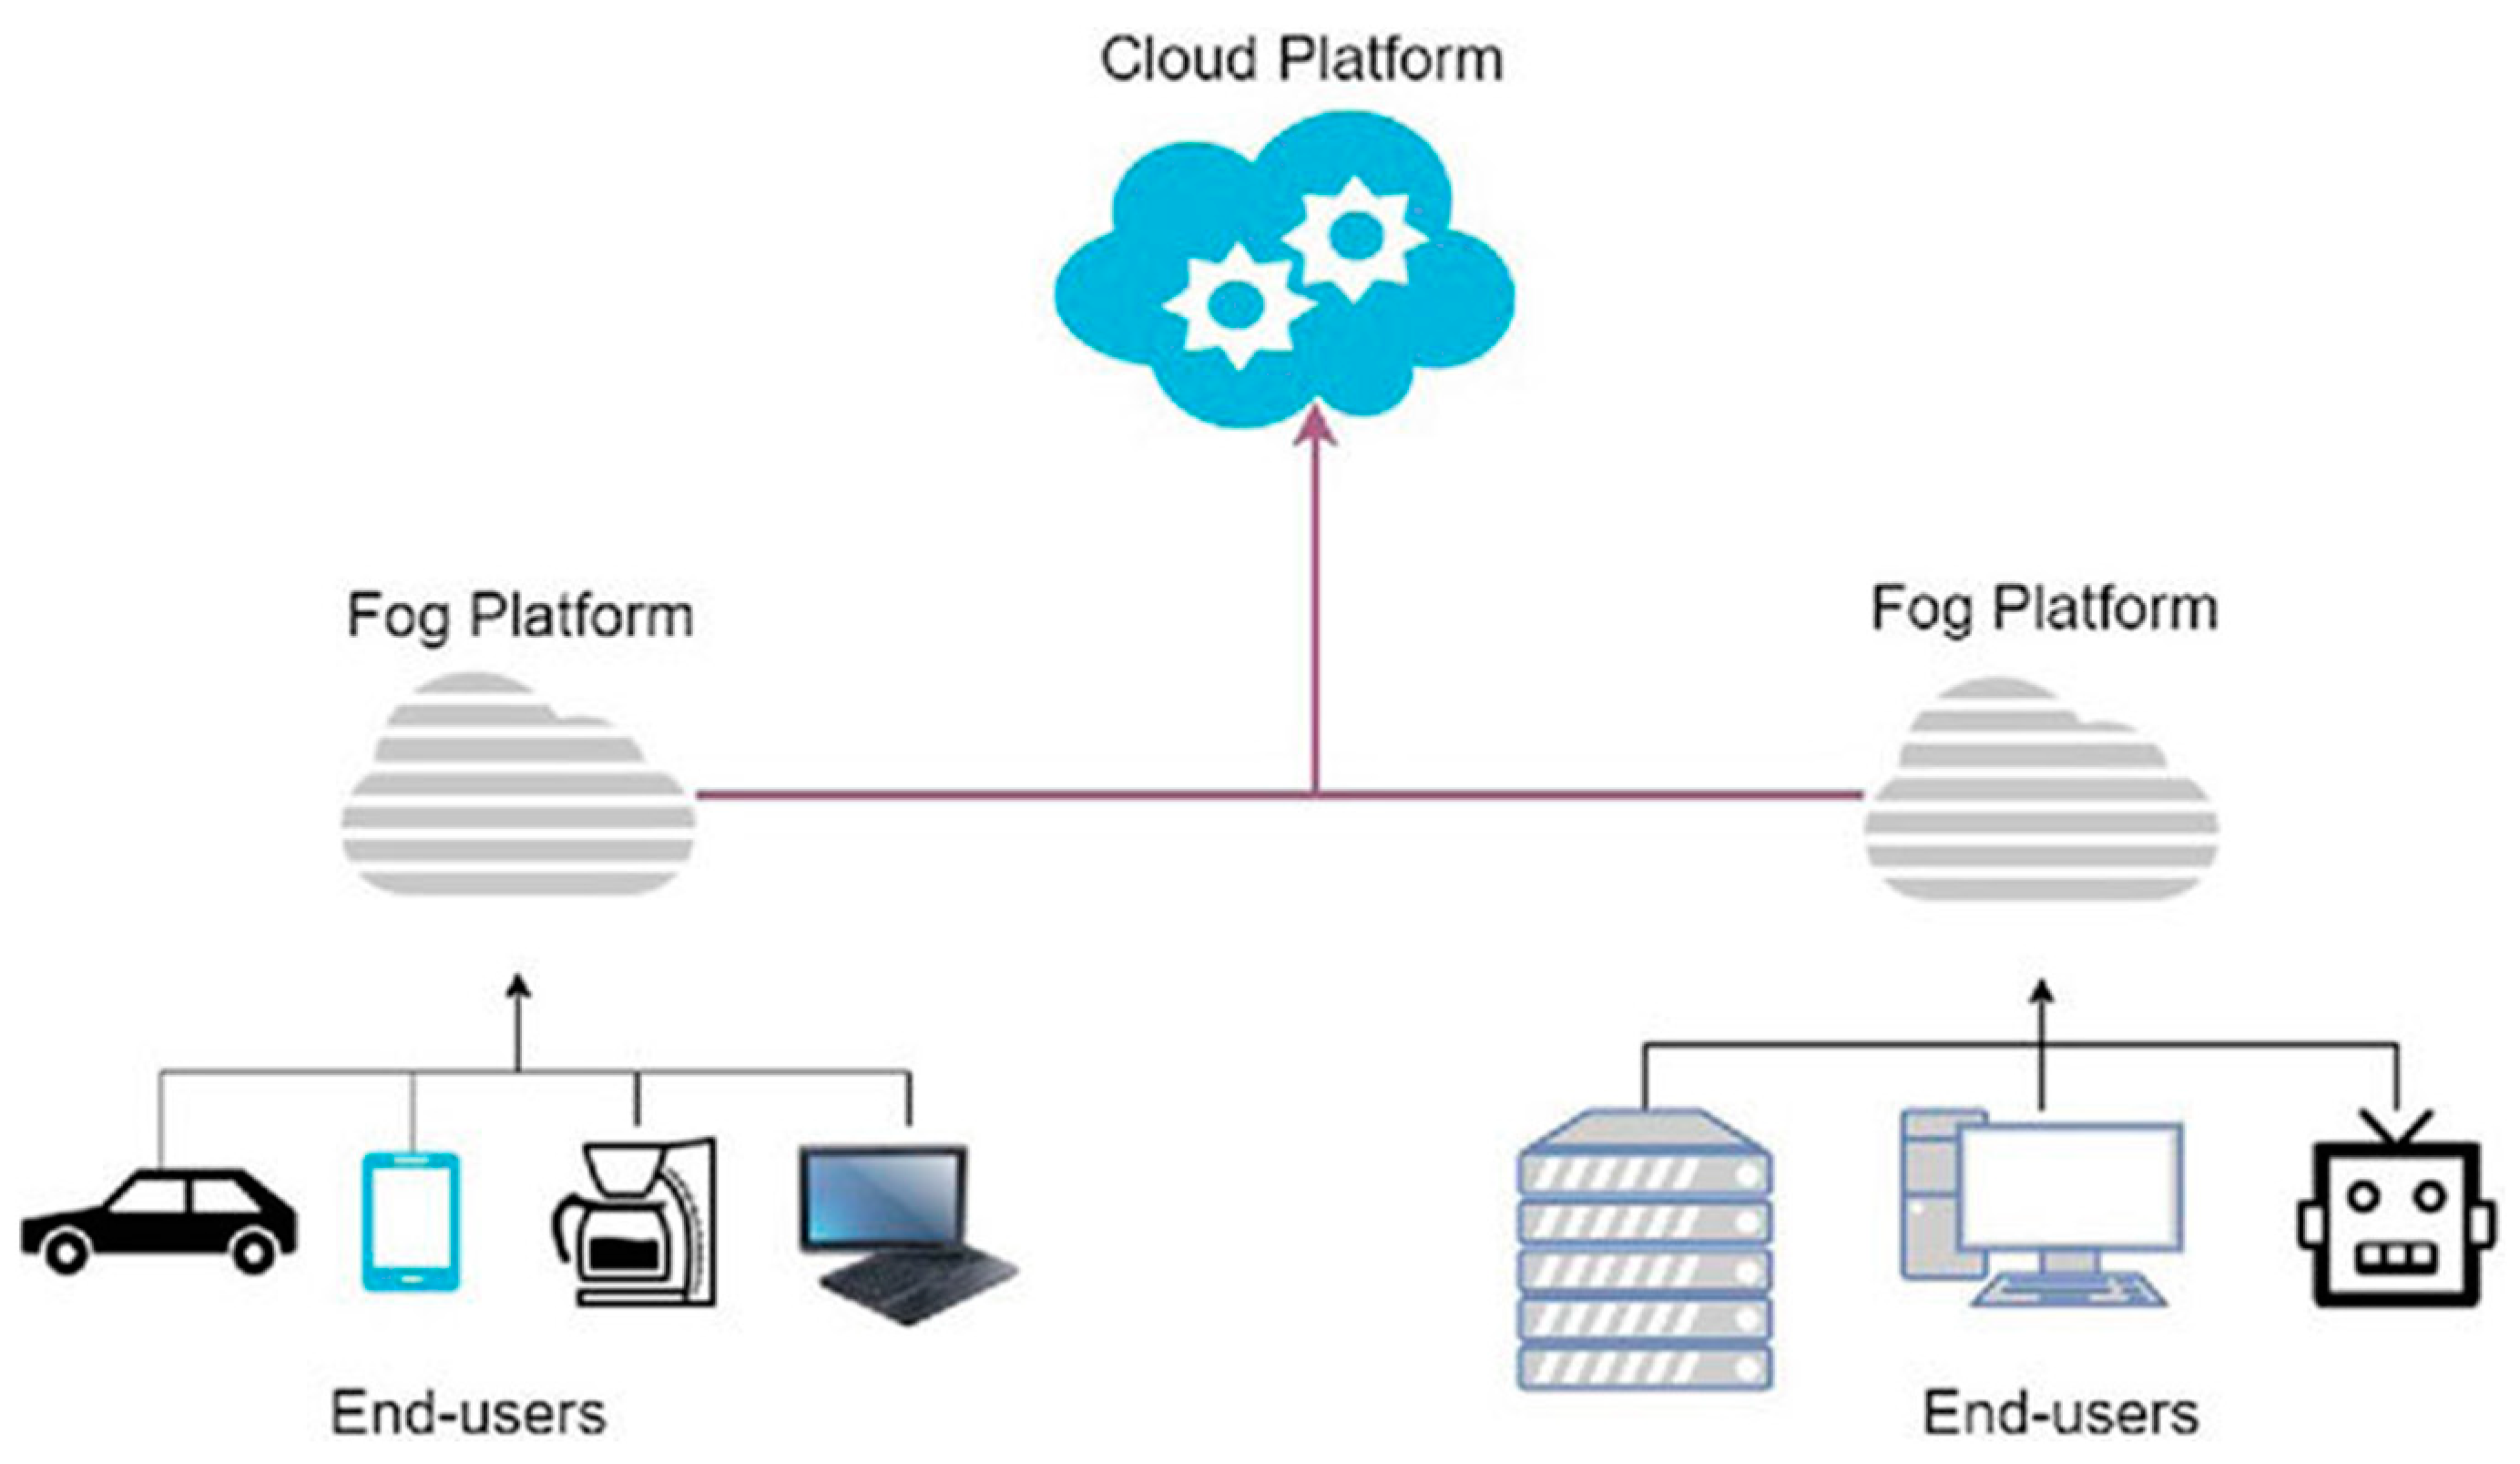
1.1. Fog Computing
- (a)
- Privacy: FC reduces data transmission by processing sensitive information at local gateways instead of centralized data centers, thereby protecting user privacy.
- (b)
- Reduced latency: By situating processing devices nearer to user devices, FC decreases latency due to shorter physical distances, leading to much quicker response times than traditional data centers.
- (c)
- Energy efficiency: Gateways can act as communication intermediaries instead of keeping sensors constantly active. When sensors are not in use, they can handle incoming requests, which can be processed later, enhancing the energy efficiency of the sensor devices.
- (d)
- Bandwidth: By handling large amounts of raw data at fog nodes, the volume of data sent to the data center is minimized.
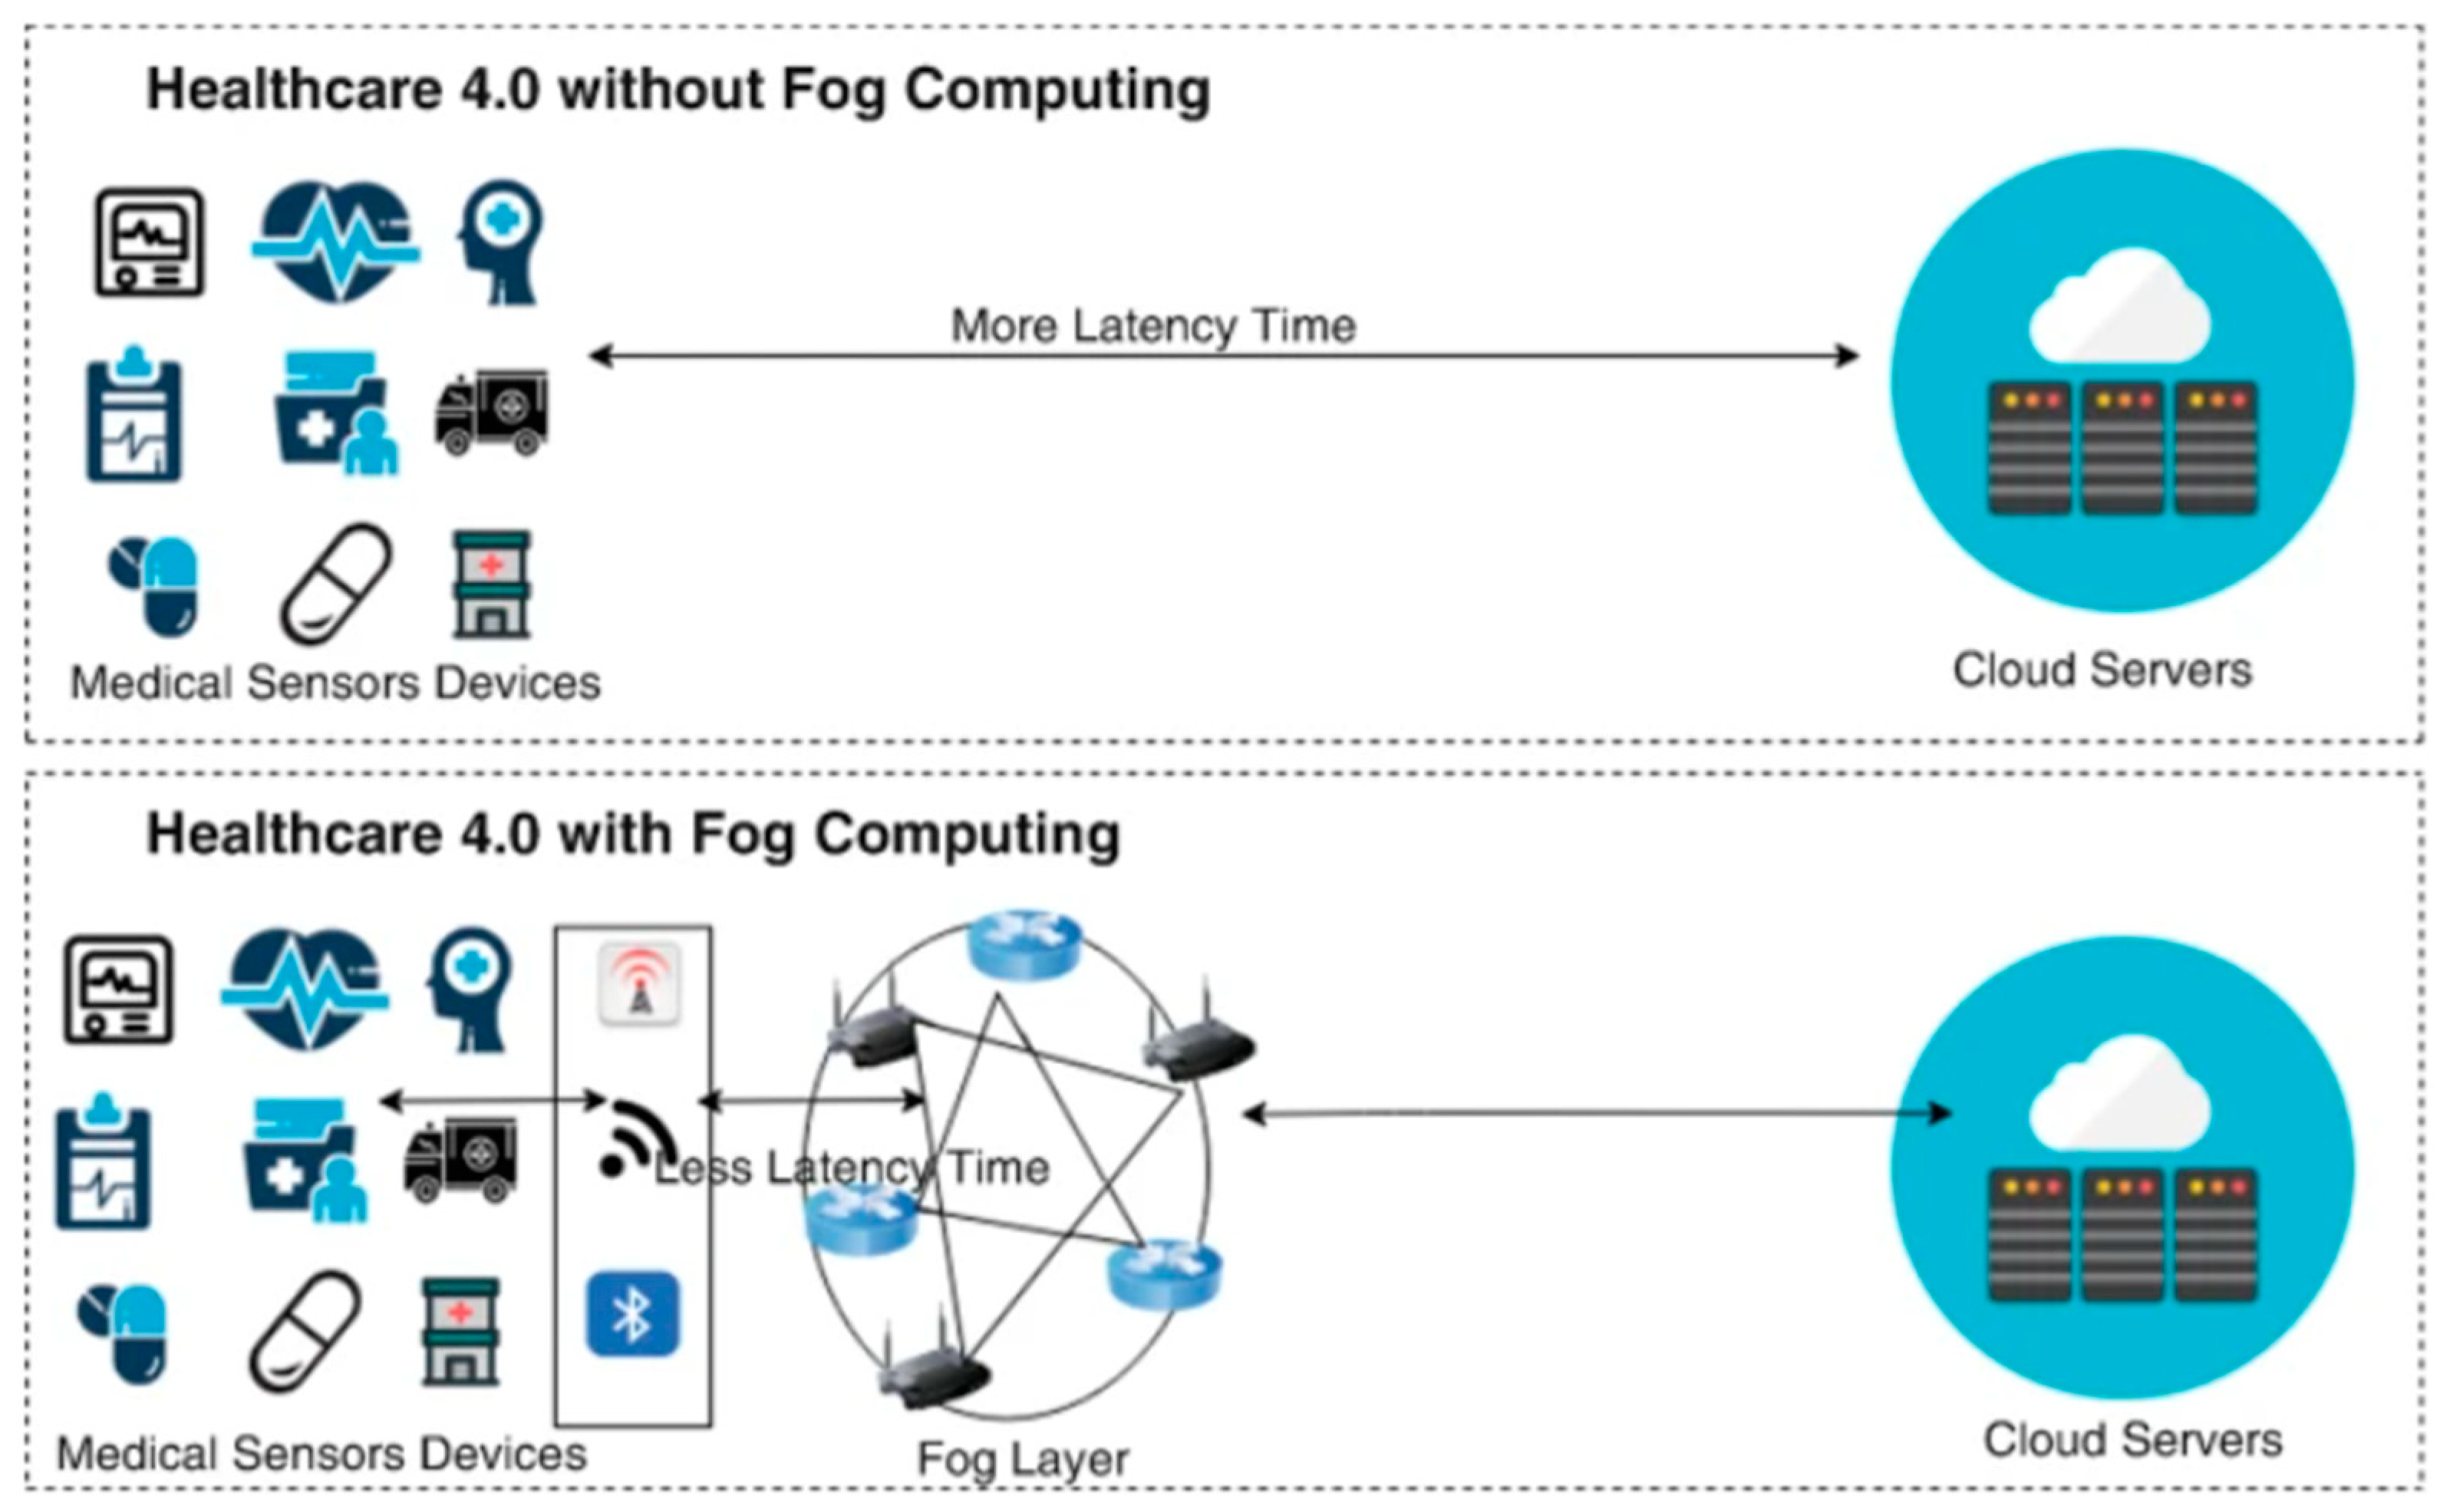
1.2. Importance of FC in Healthcare System
1.3. IoT in Healthcare
1.4. Hierarchical Architecture of Fog Computing in Healthcare
- Fog Layer: This layer is responsible for processing healthcare data that are received from a variety of IoT medical devices. This layer also sends real-time alerts to users regarding the state of their health [21].
- Overcoming latency problems that are related to critical tasks in the healthcare system.
- Applying a prioritized fashion for distributing tasks to fog resources that are available so that critical tasks have the highest priority.
- Improving the QoS parameters by taking into consideration the deadline of tasks to meet the user’s requirement.
- Improving system scalability by handling a growing number of tasks while maintaining scheduling efficiency.
- Preventing system overload and maintaining stability by ensuring even task distribution across VMs.
2. Related Work
3. Problem Definition
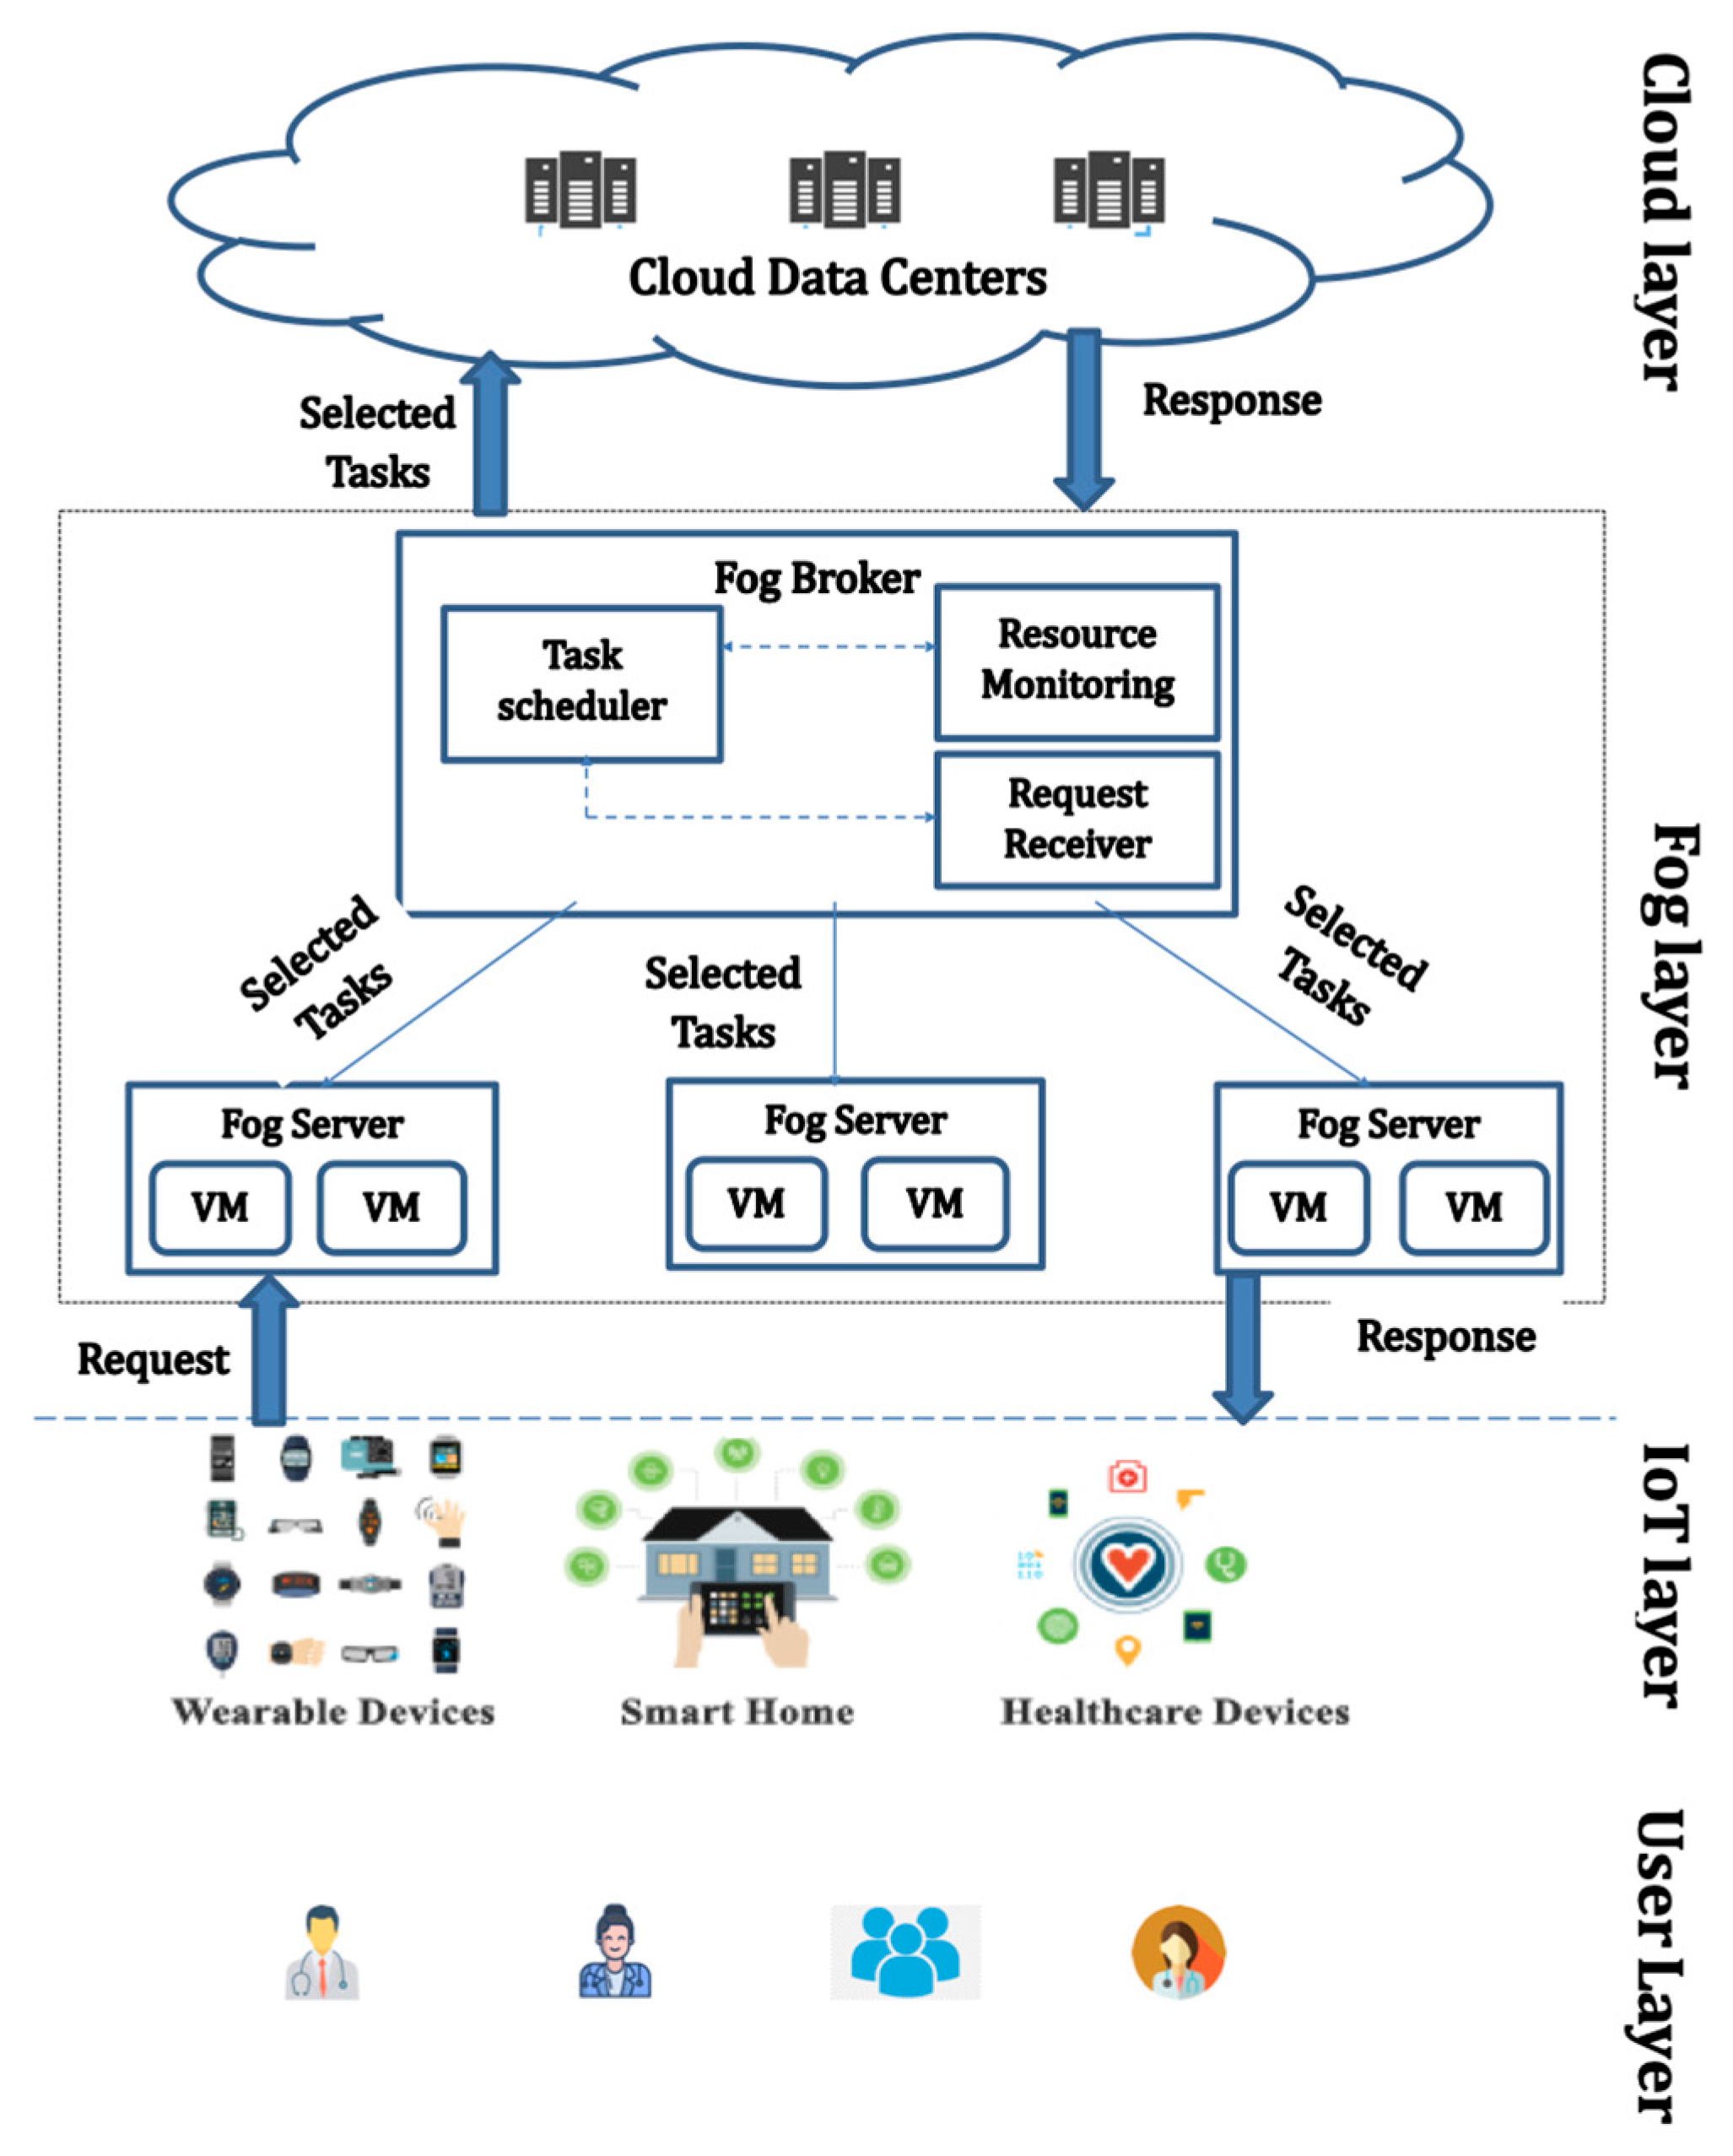
3.1. System Model
- User layer: represents the individuals who use the system.
- IoT Interface layer: consists of a variety of IoT devices.
- Fog layer: comprises a number of fog servers to process tasks coming from the IoT layer.
- Cloud layer features large datacenters that can hold the patient’s records for long-term analysis.
3.2. Functionalities of Fog Layer in Healthcare
- Healthcare data require real time response with minimal latency. Fog layer can handle this type of data.
- Huge amount of medical data are transmitted to the fog layer for compression and formatting of data.
- The fog layer also deals with privacy and security matters that are related to patient’s private information included in healthcare data.
- The fog layer decreases network traffic to the Cloud layer.
3.3. Problem Statement
4. Proposed Algorithm
- Start
- ○
- The process begins.
- 2.
- Receive Tasks from Users
- ○
- The system (Fog Broker) receives tasks from users. Each task comes with a specified deadline.
- 3.
- Classify Tasks by Priority Groups
- ○
- The Fog Broker classifies tasks into three priority levels based on task importance (critical level):
- ▪
- Level 1 (Highest Priority)
- ▪
- Level 2 (Medium Priority)
- ▪
- Level 3 (Lowest Priority)
- 4.
- Classify Groups into Subgroups
- ○
- Each priority group is further divided into subgroups based on the task’s specific resource requirements (e.g., memory needs, storage, etc.).
- 5.
- Estimate Expected Execution Time (EET)
- ○
- The expected processing time (EET) for each task on each VM is calculated using Equation (1):where r is the task length and spi is the VM’s speed.
- 6.
- Compare EET with Deadline
- ○
- The broker compares the estimated processing time (EET) of each task on various VMs with the task’s deadline.
- 7.
- Is the VM Valid?
- ○
- Decision 1: Does the VM meet the deadline constraint (?
- ▪
- If YES, the VM is labeled as Valid.
- ▪
- If NO, the VM is labeled as Invalid.
- 8.
- Allocate VM for Task
- ○
- The broker allocates a valid VM to the task, following these conditions:
- ▪
- The VM provides the least and enough task’s resource requirements.
- ▪
- The VM was not previously allocated to another task.
- 9.
- Check Task Deadline Violation (DIV)
- ○
- Decision 2: Check if the task’s deadline is violated:
- ▪
- If DIV(T) = 1, the task deadline is violated, and the task is migrated to another fog server.
- ▪
- If DIV(T) = 0, the task is scheduled on the allocated VM.
- 10.
- Remove Task from Ready Queue
- ○
- Once the task is scheduled, it is removed from the ready queue.
- 11.
- End
- ○
- The process ends.
TCDC Algorithm
| Algorithm 1: TCDC Algorithm |
| Input: A set of independent real-time tasks with a deadline. Output: minimize the makespan, response time, and the total cost based on deadline constraints. 1- Classify tasks according to the task’s critical level. 2- For each group, categorize tasks into subgroups according to the task type (cat1: RAM, cat2: Storage). 3- In each subgroup, sort tasks in descending order based on the task’s requirement. 4- Last VM = 0 5- For j = 1 to n //n is the number of tasks in each group 6-//check VM state: For i = 1 to m Calculate EETj If EETj ≤ dj VMi state = valid Count ++ Else VMi state = invalid End if End for 7- If count > 0 DIV = 0 If cat = cat1& RAMj ≤ min {RAMi} & VMi != last VM ∀ i ϵ VM, j ϵ T Map task j to VMi, last VM = VMi If cat= cat2 & Sj ≤ min {Si} & VMi != last VM ∀ i ϵ VM, j ϵ T Map task j to Vmi, last VM = VMi Else DIV = 1 Migrate task to another fog server End if End for//all tasks are mapped. |
5. Simulation and Experimental Results
5.1. Simulation Environment
5.2. Performance Evaluation Parameters
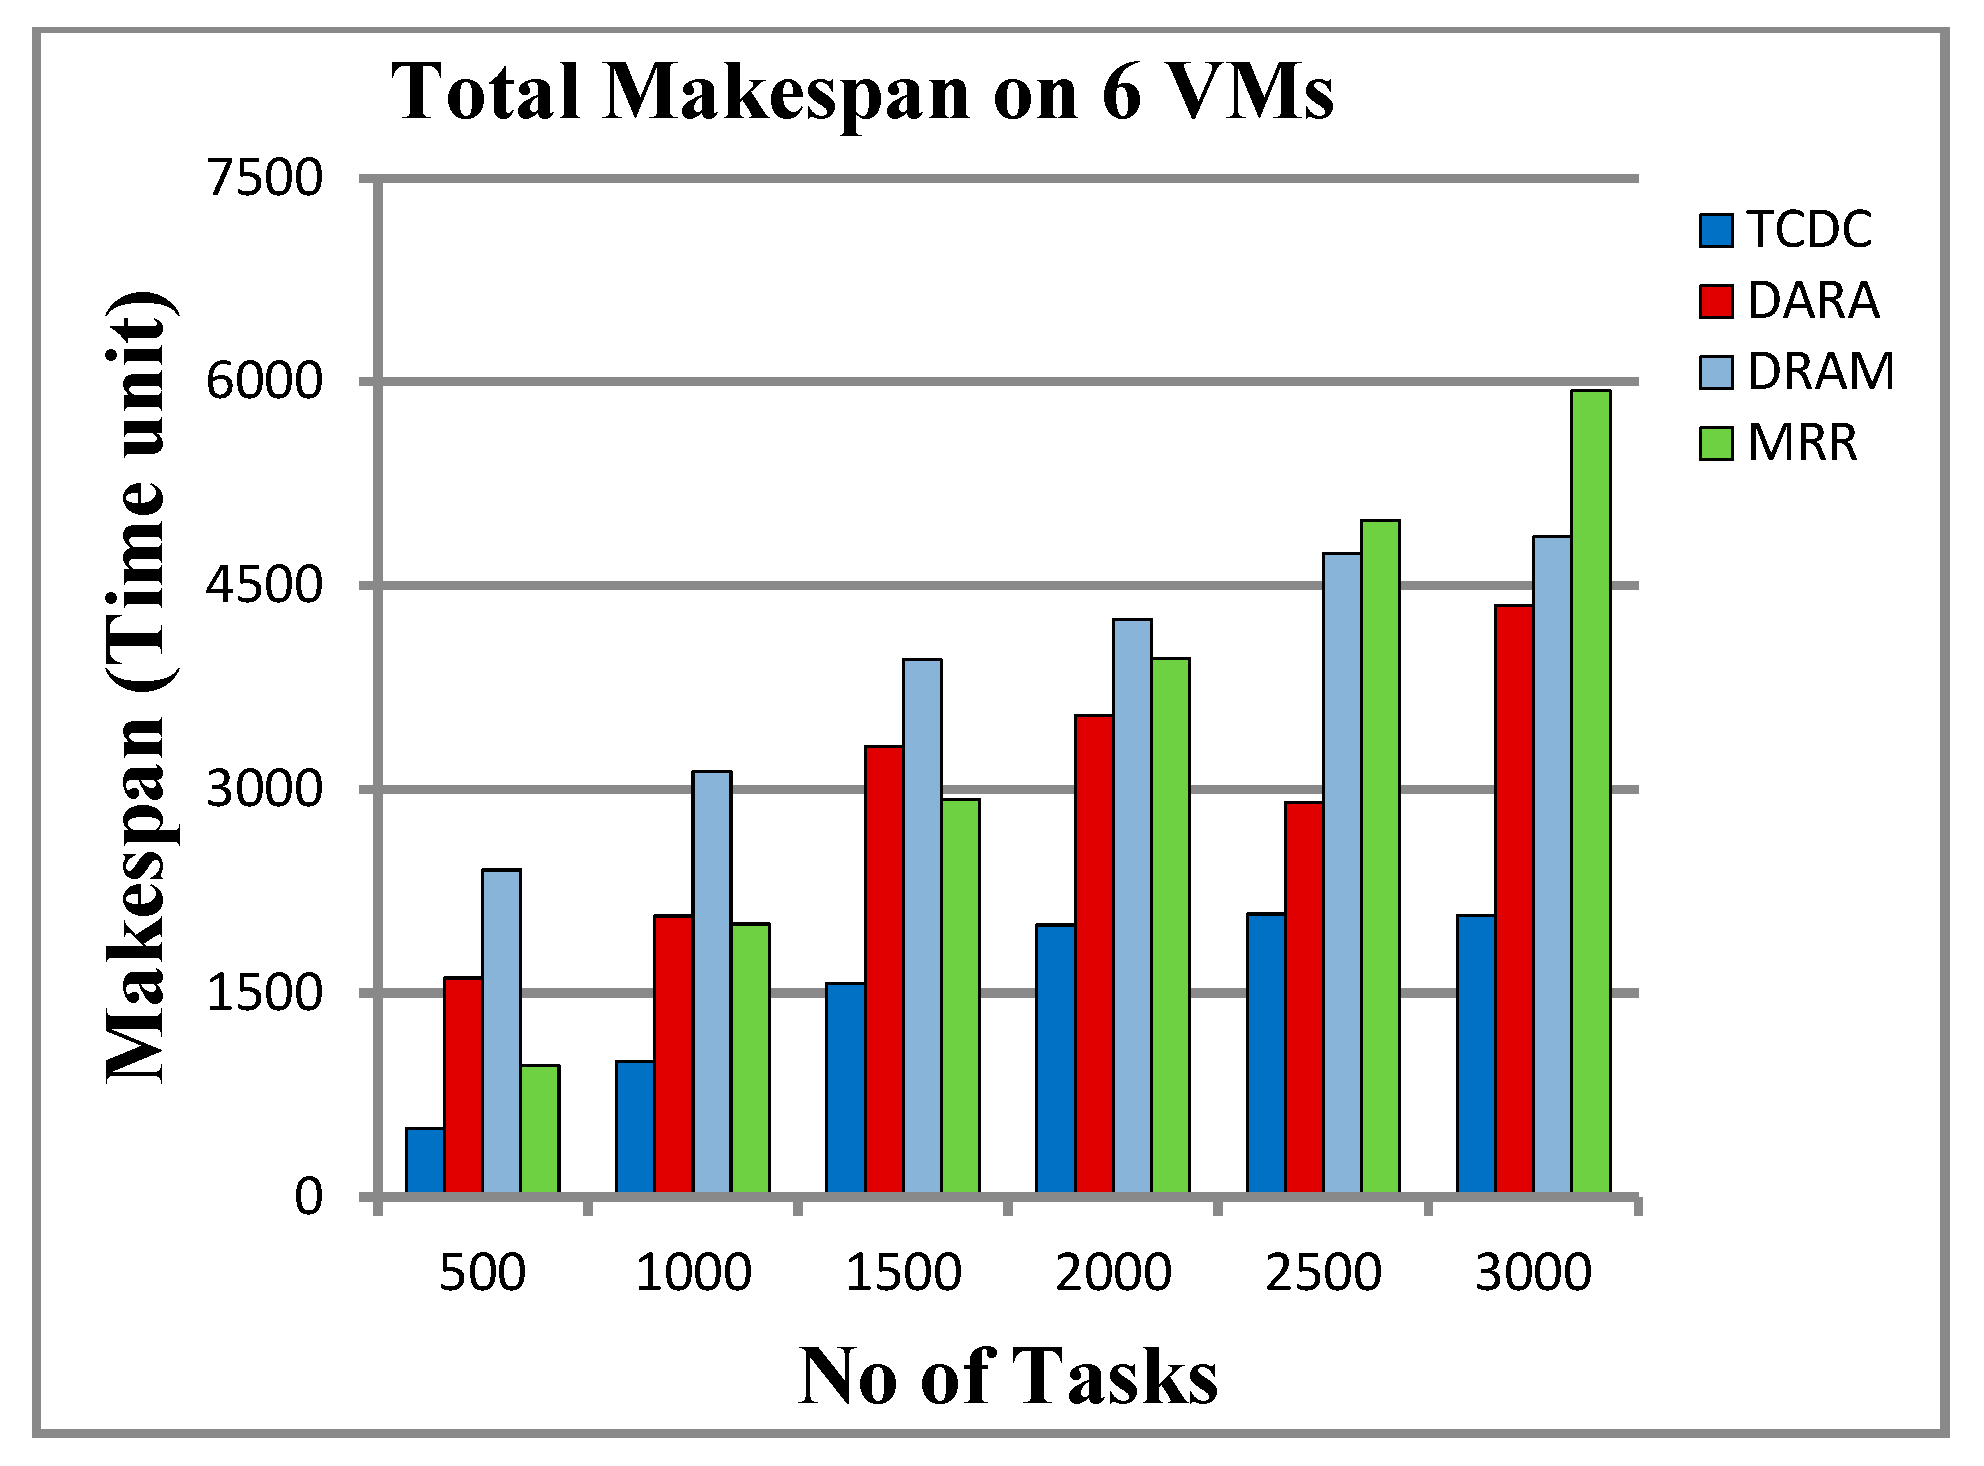
5.2.1. Makespan
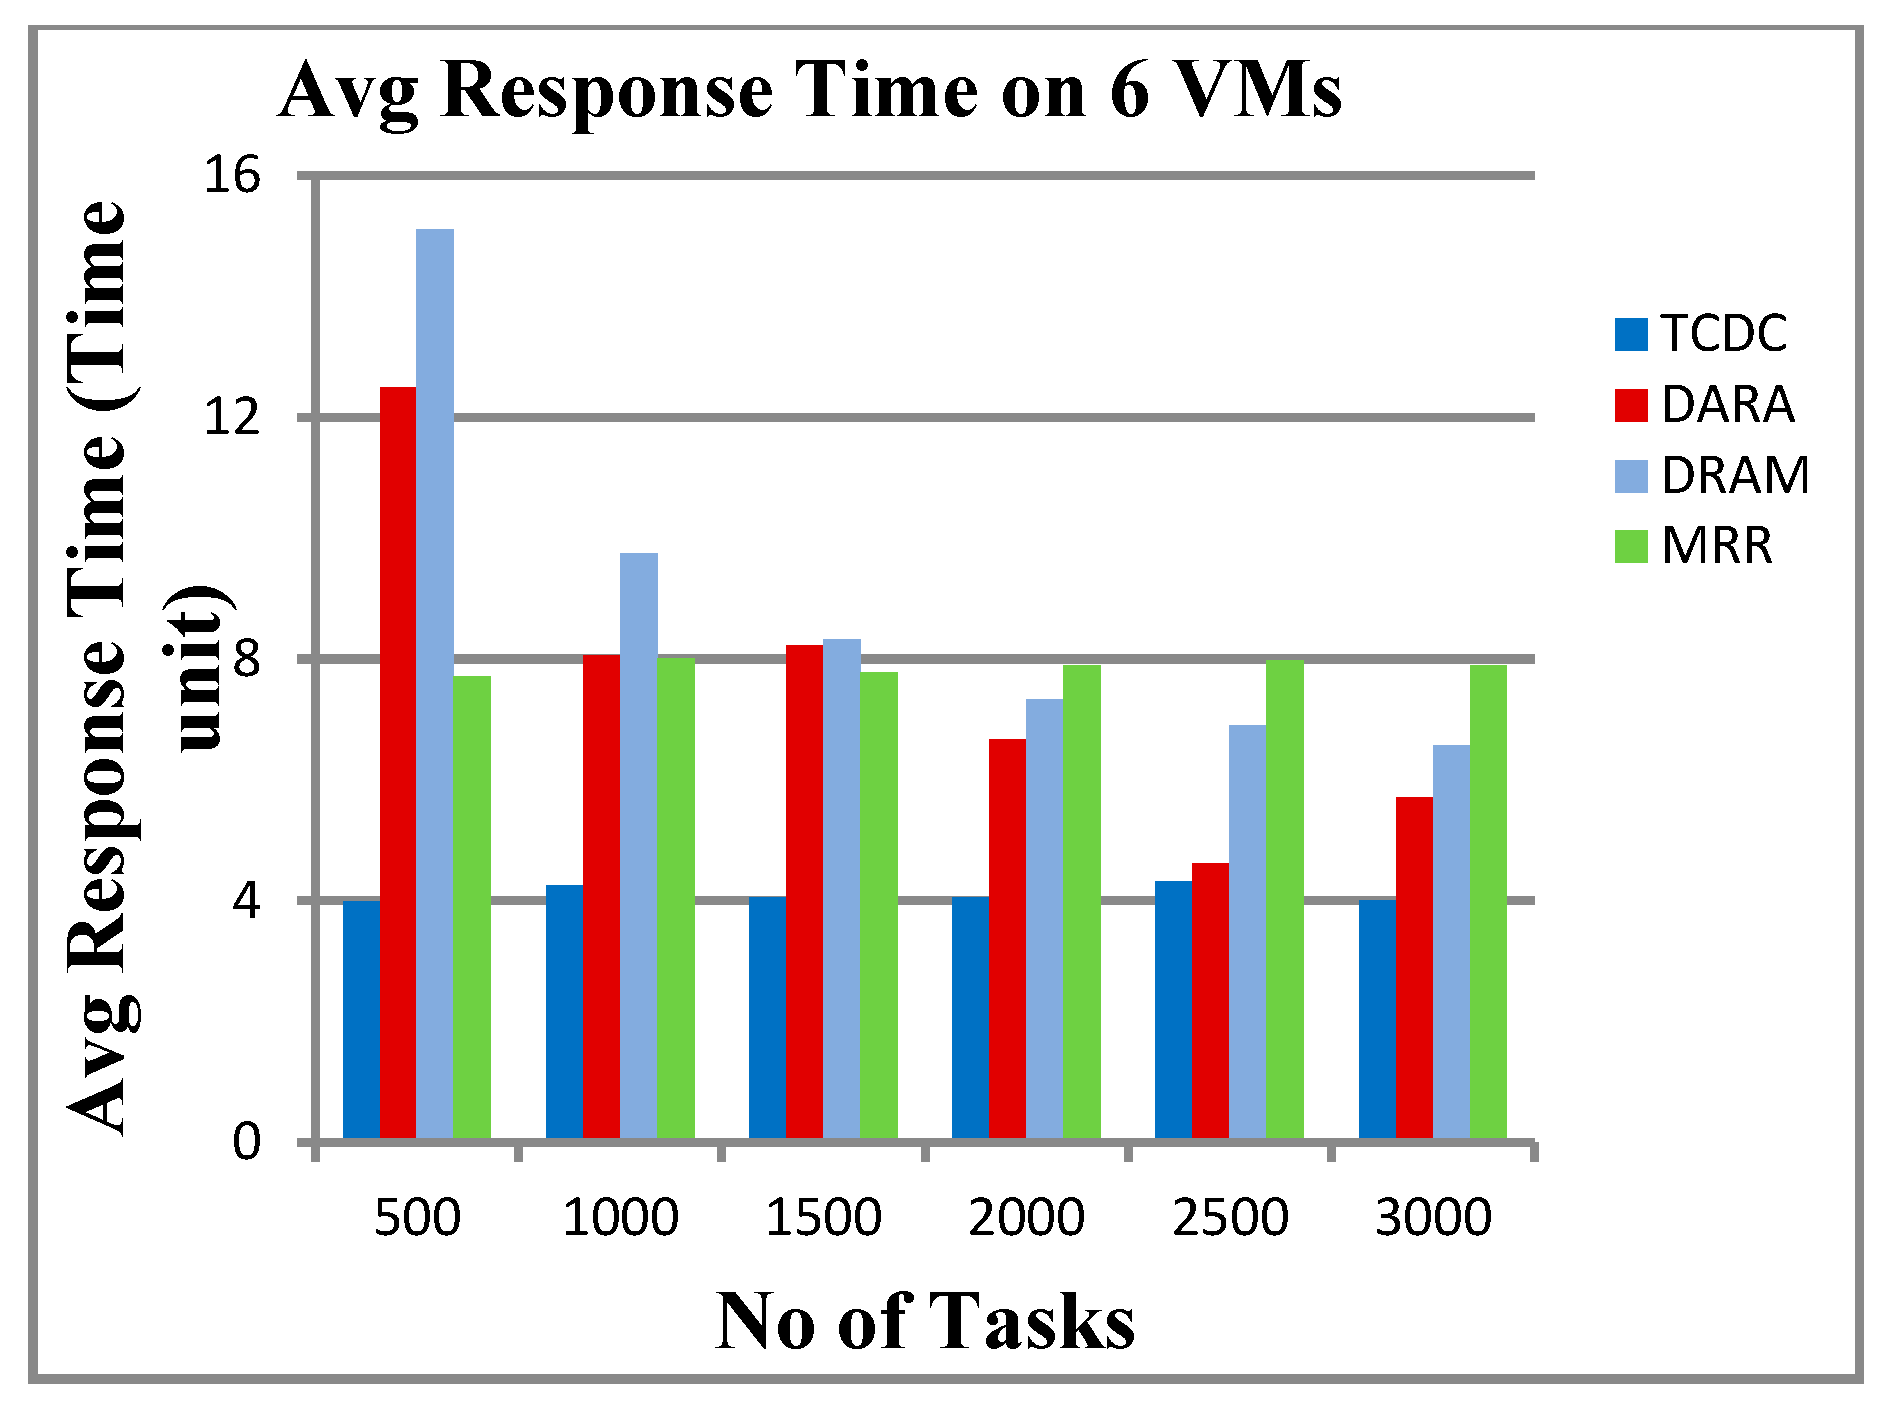
5.2.2. Response Time
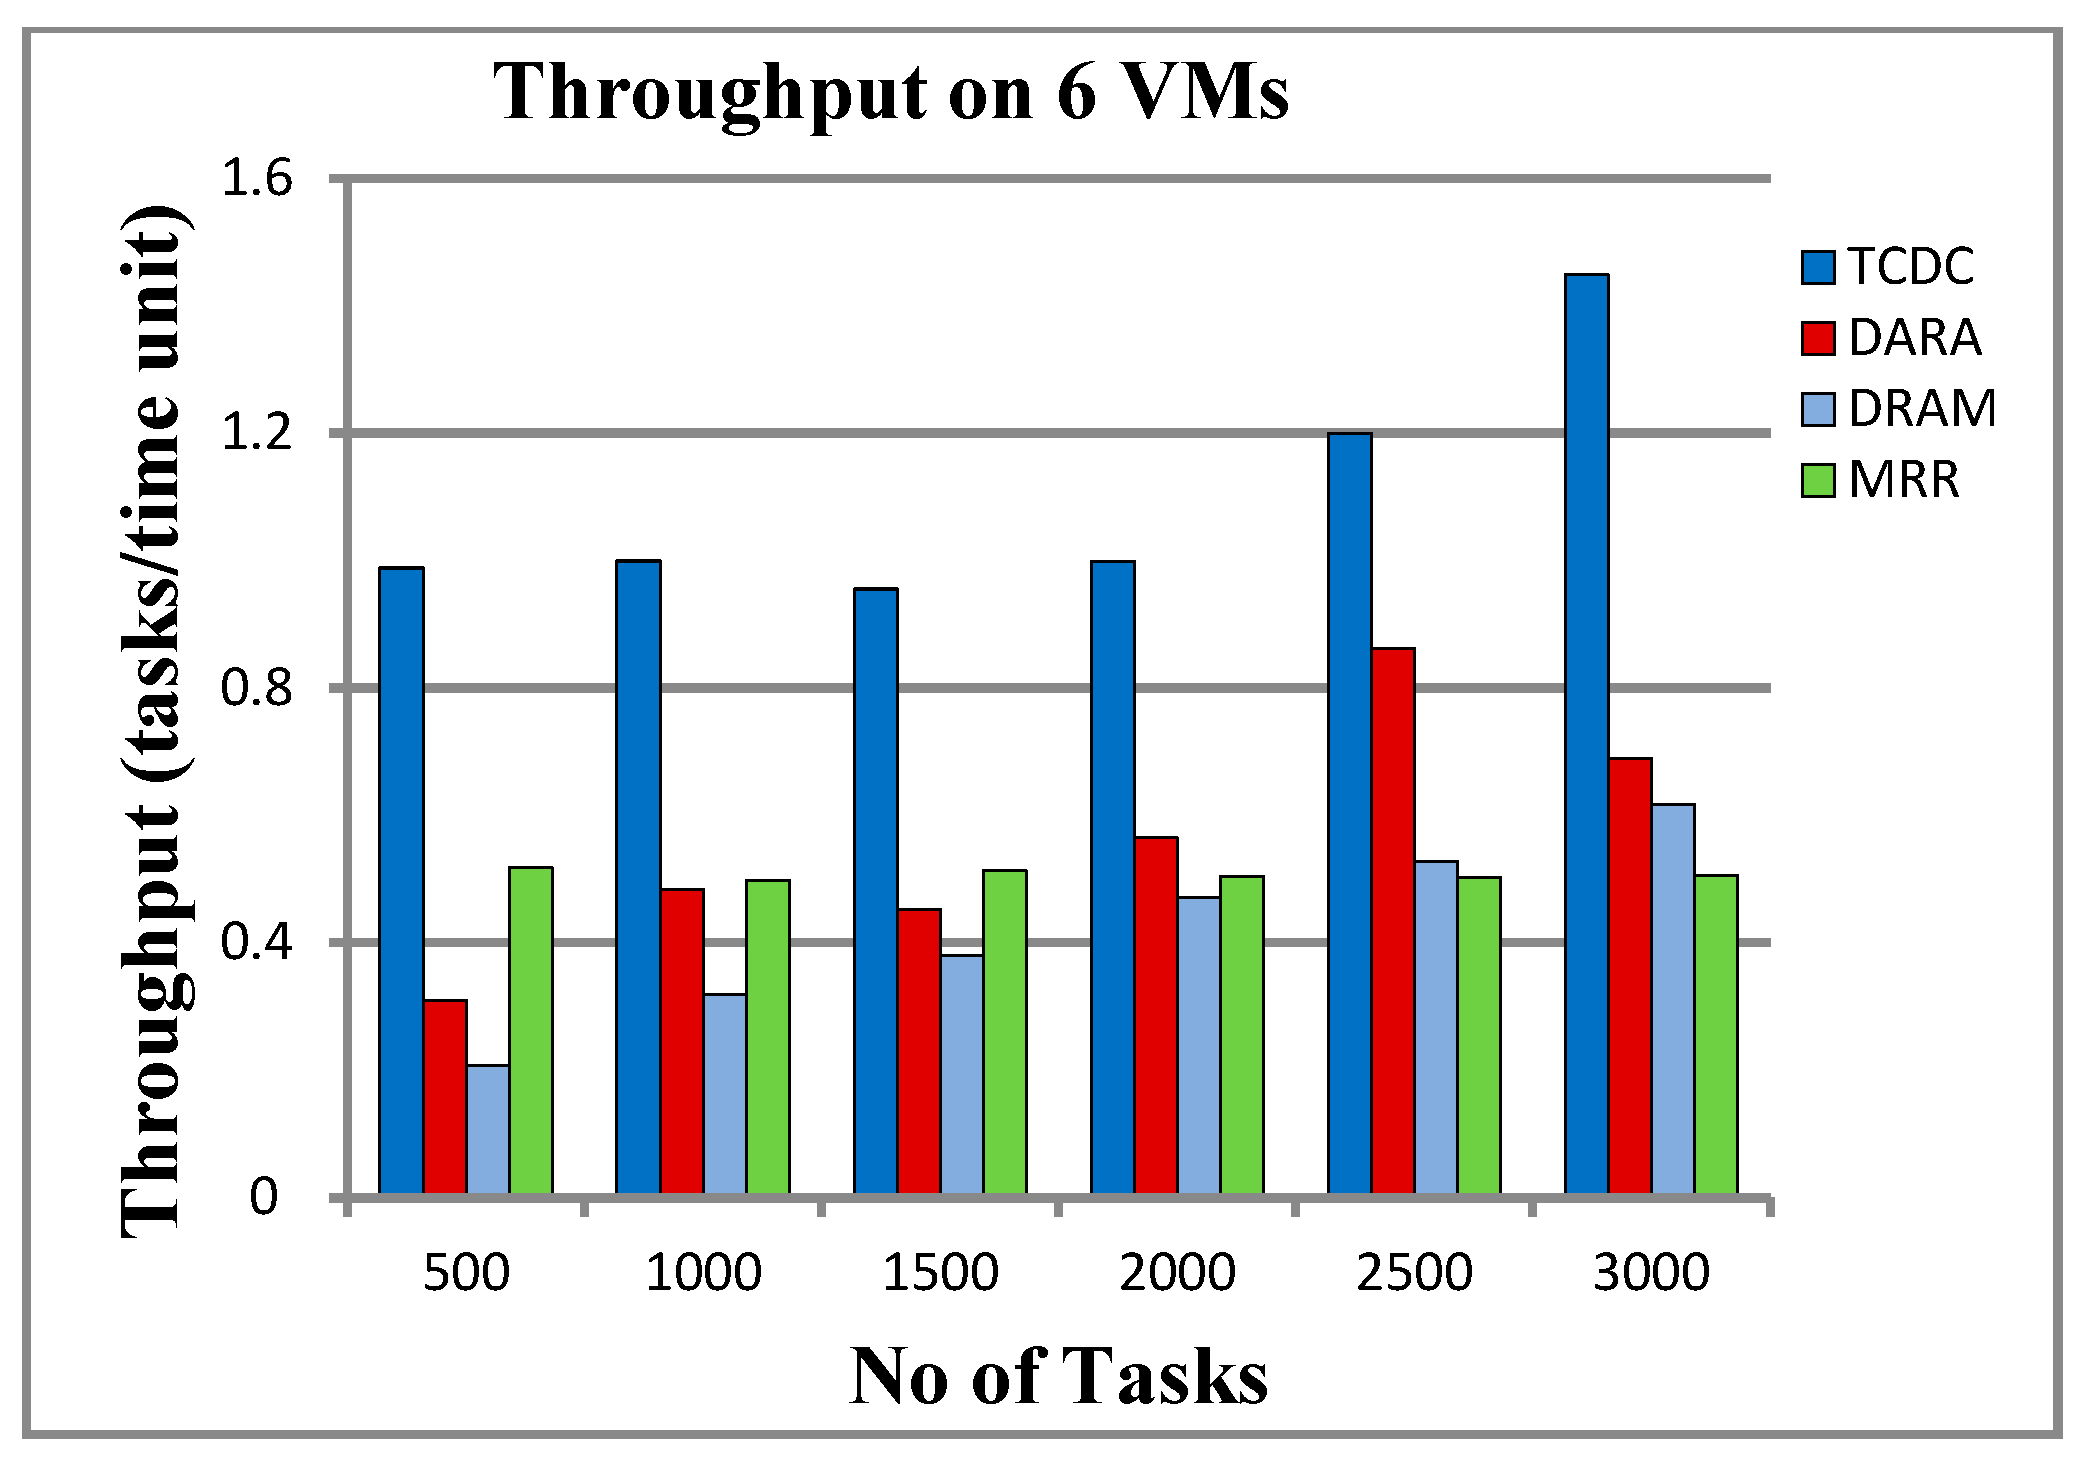
5.2.3. Throughput
5.2.4. Resource Utilization (RU)
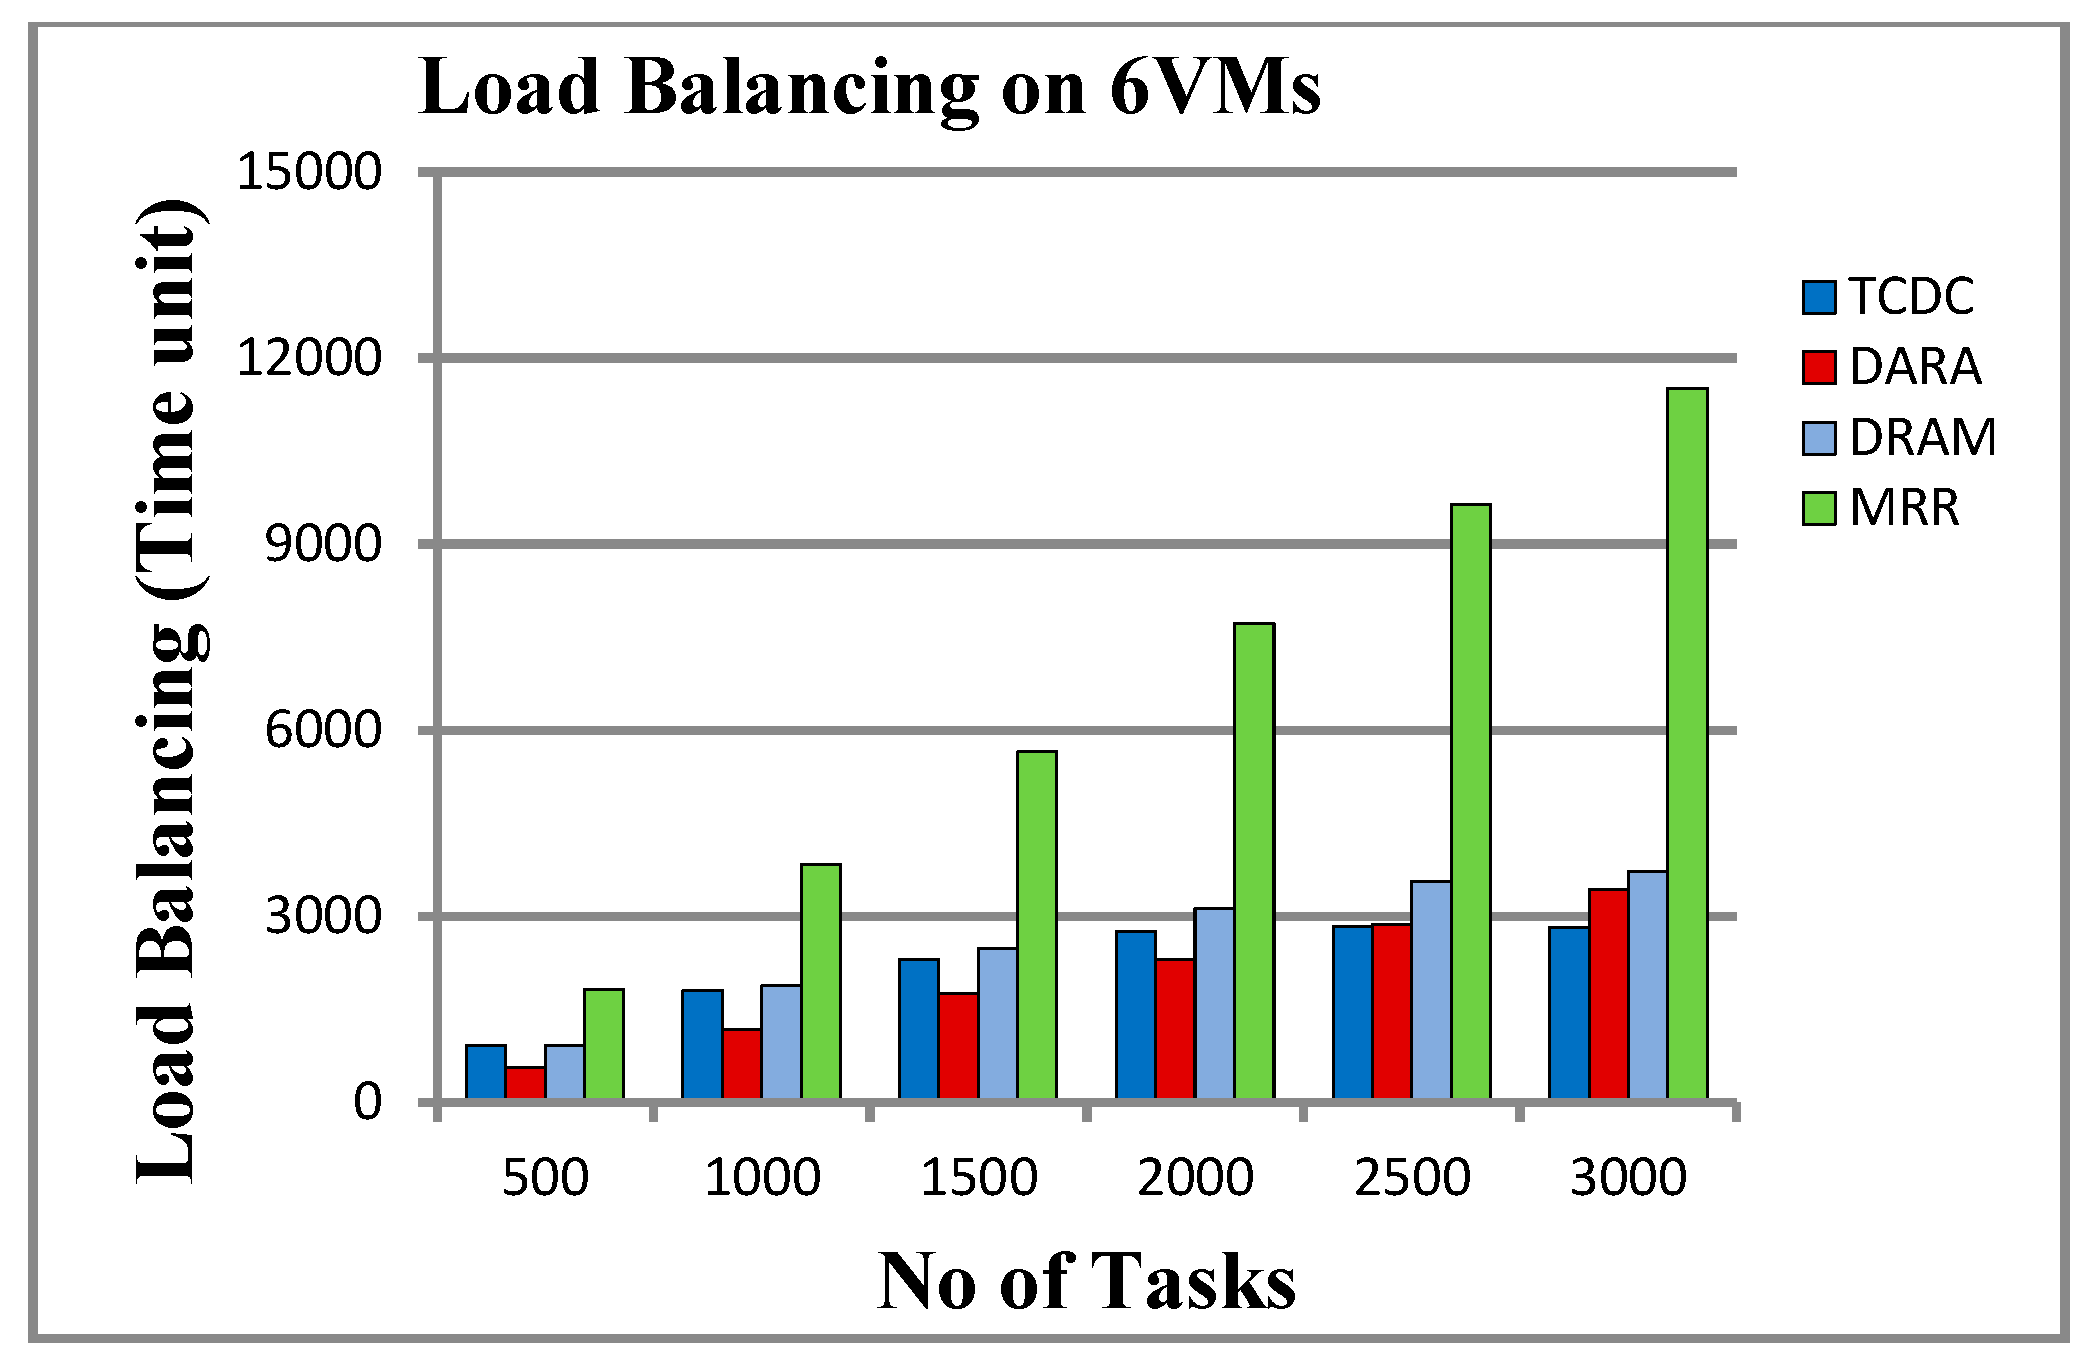
5.2.5. Load Balancing
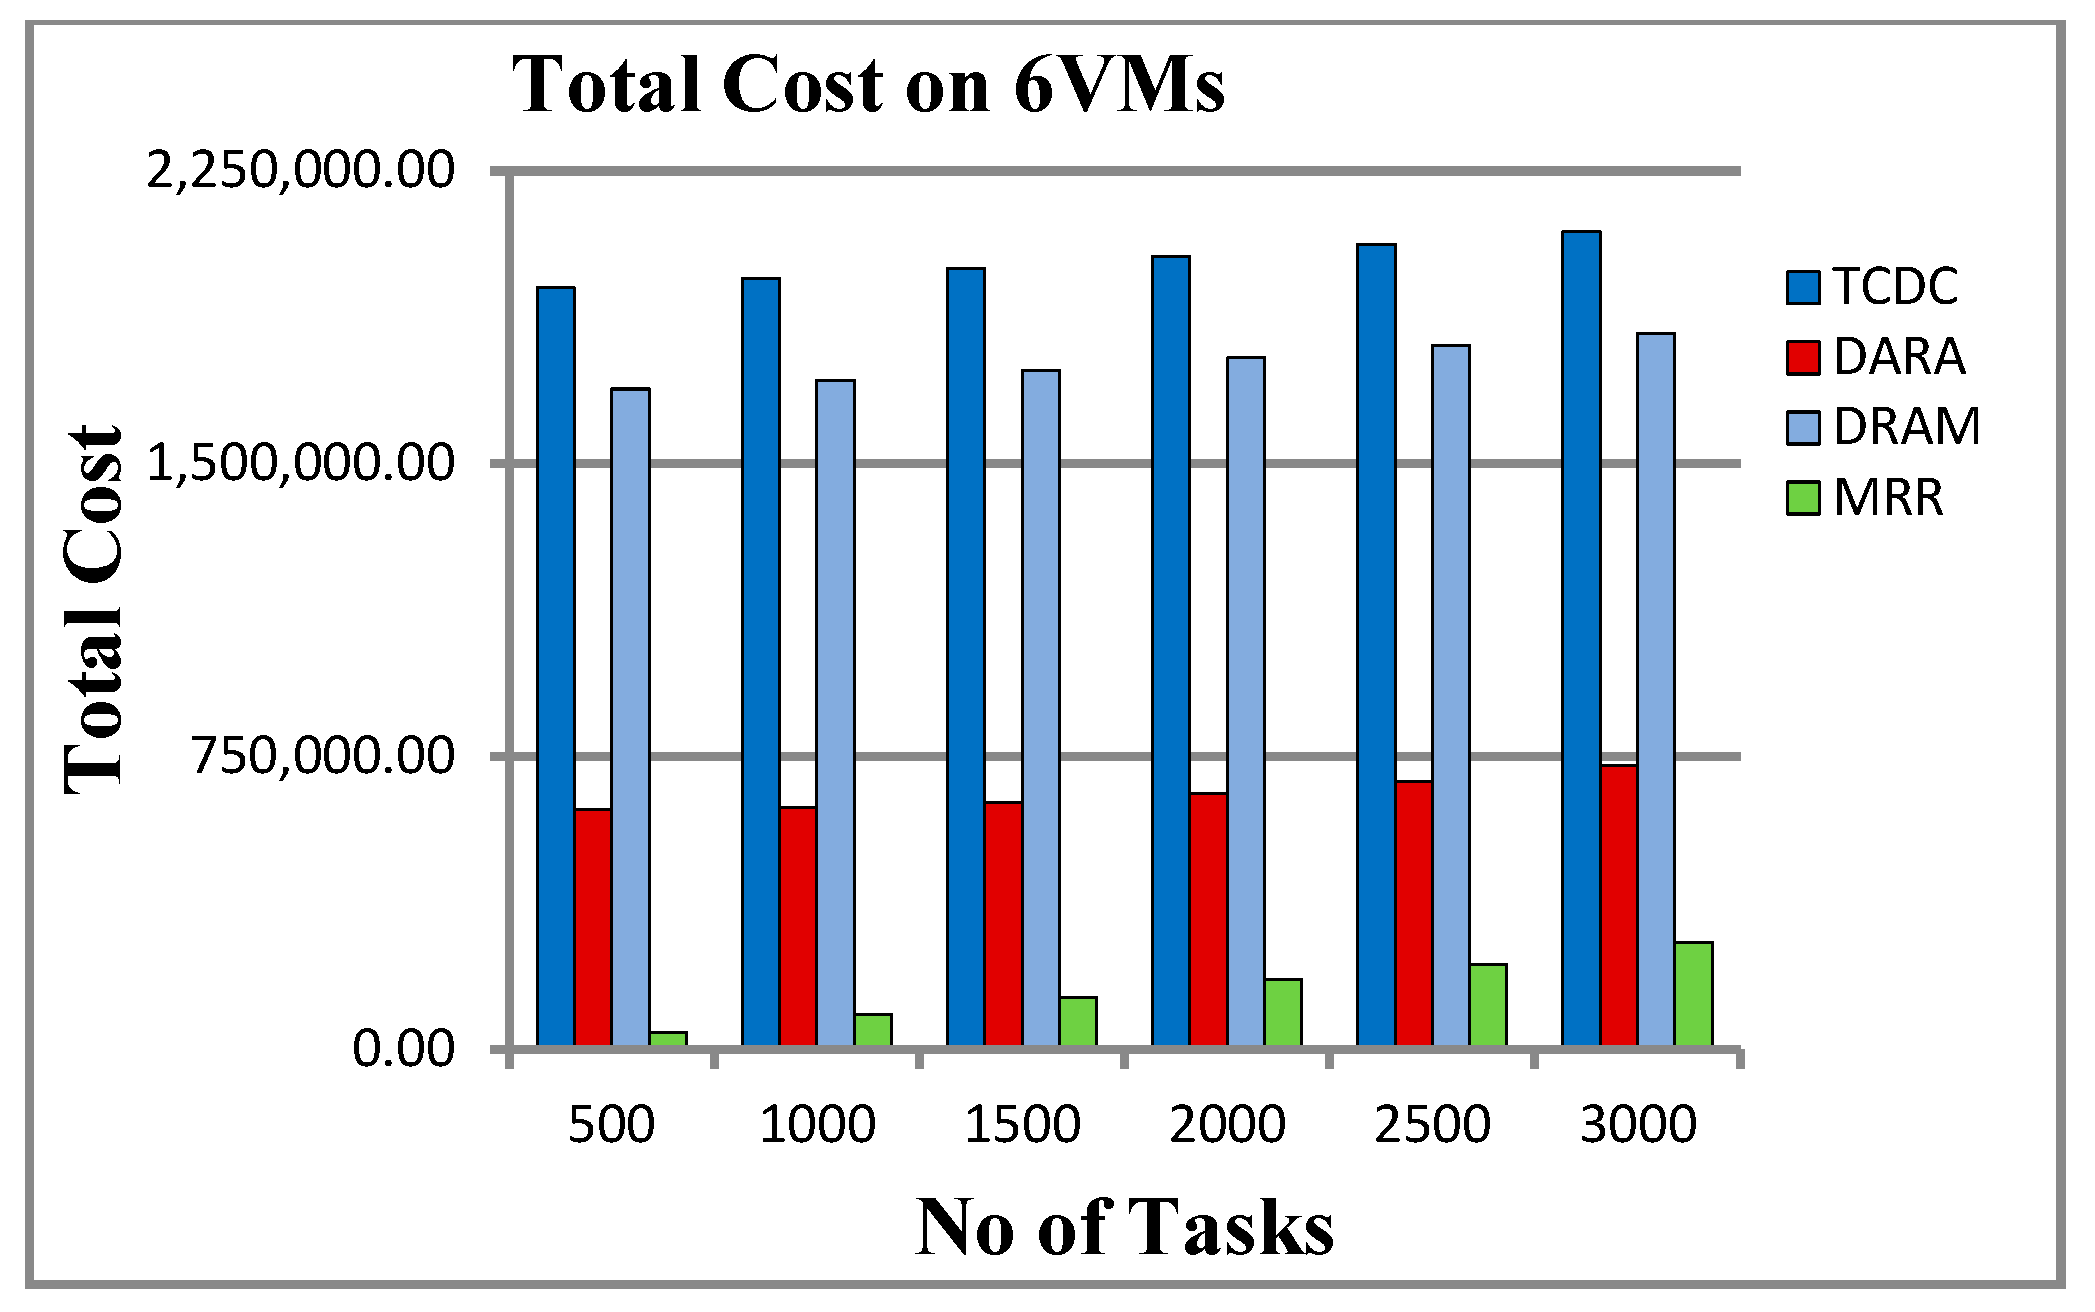
5.2.6. Total Cost
5.3. Experimental Results
5.3.1. Results on 6 VMs
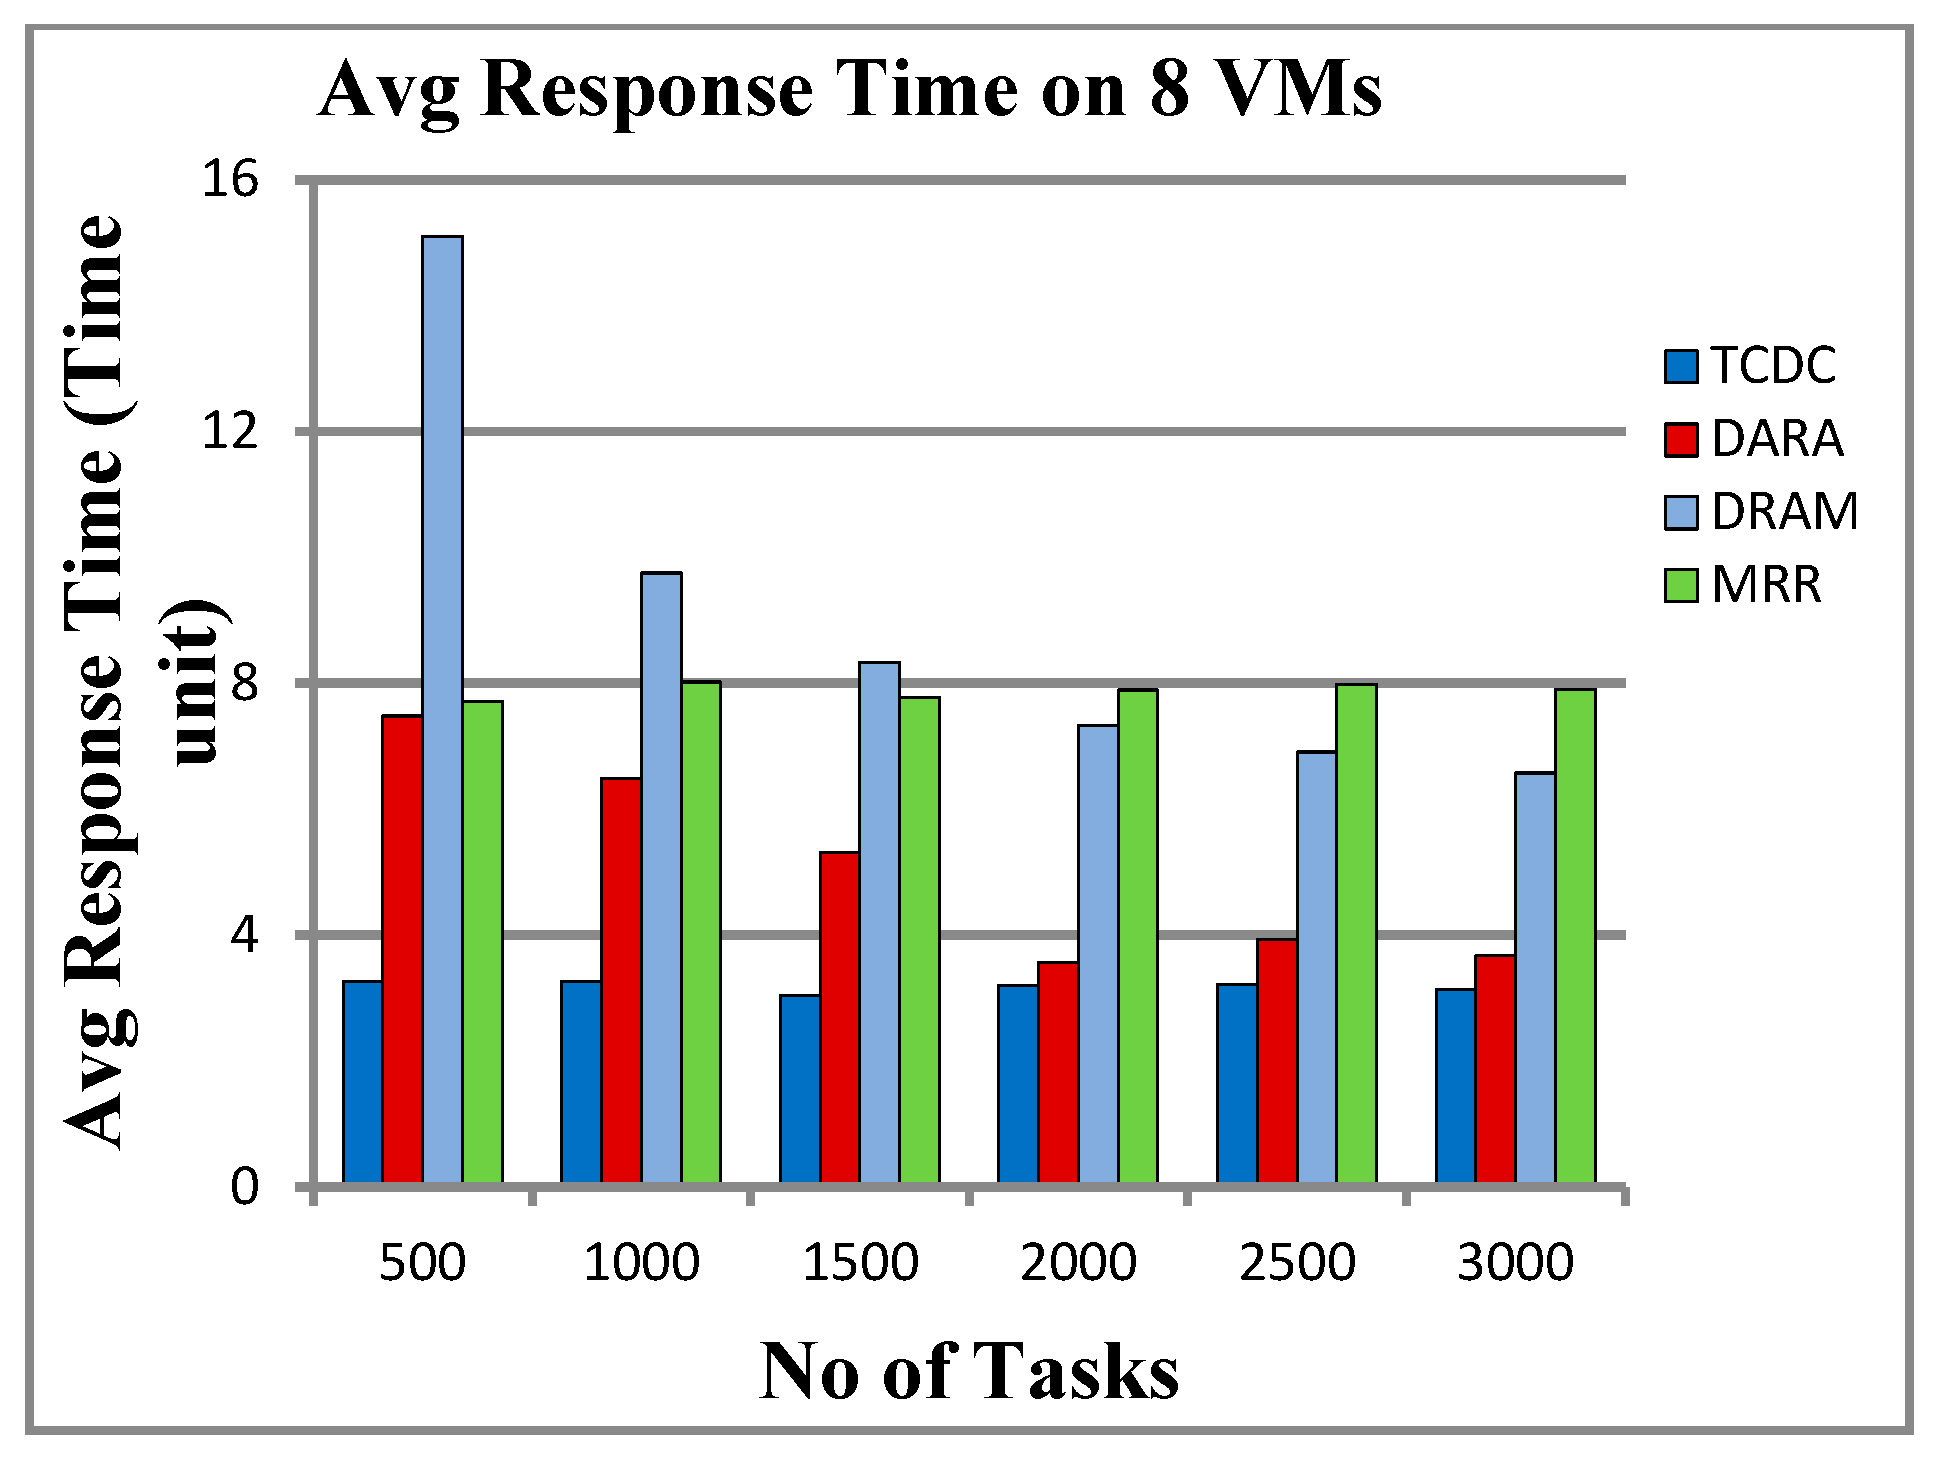
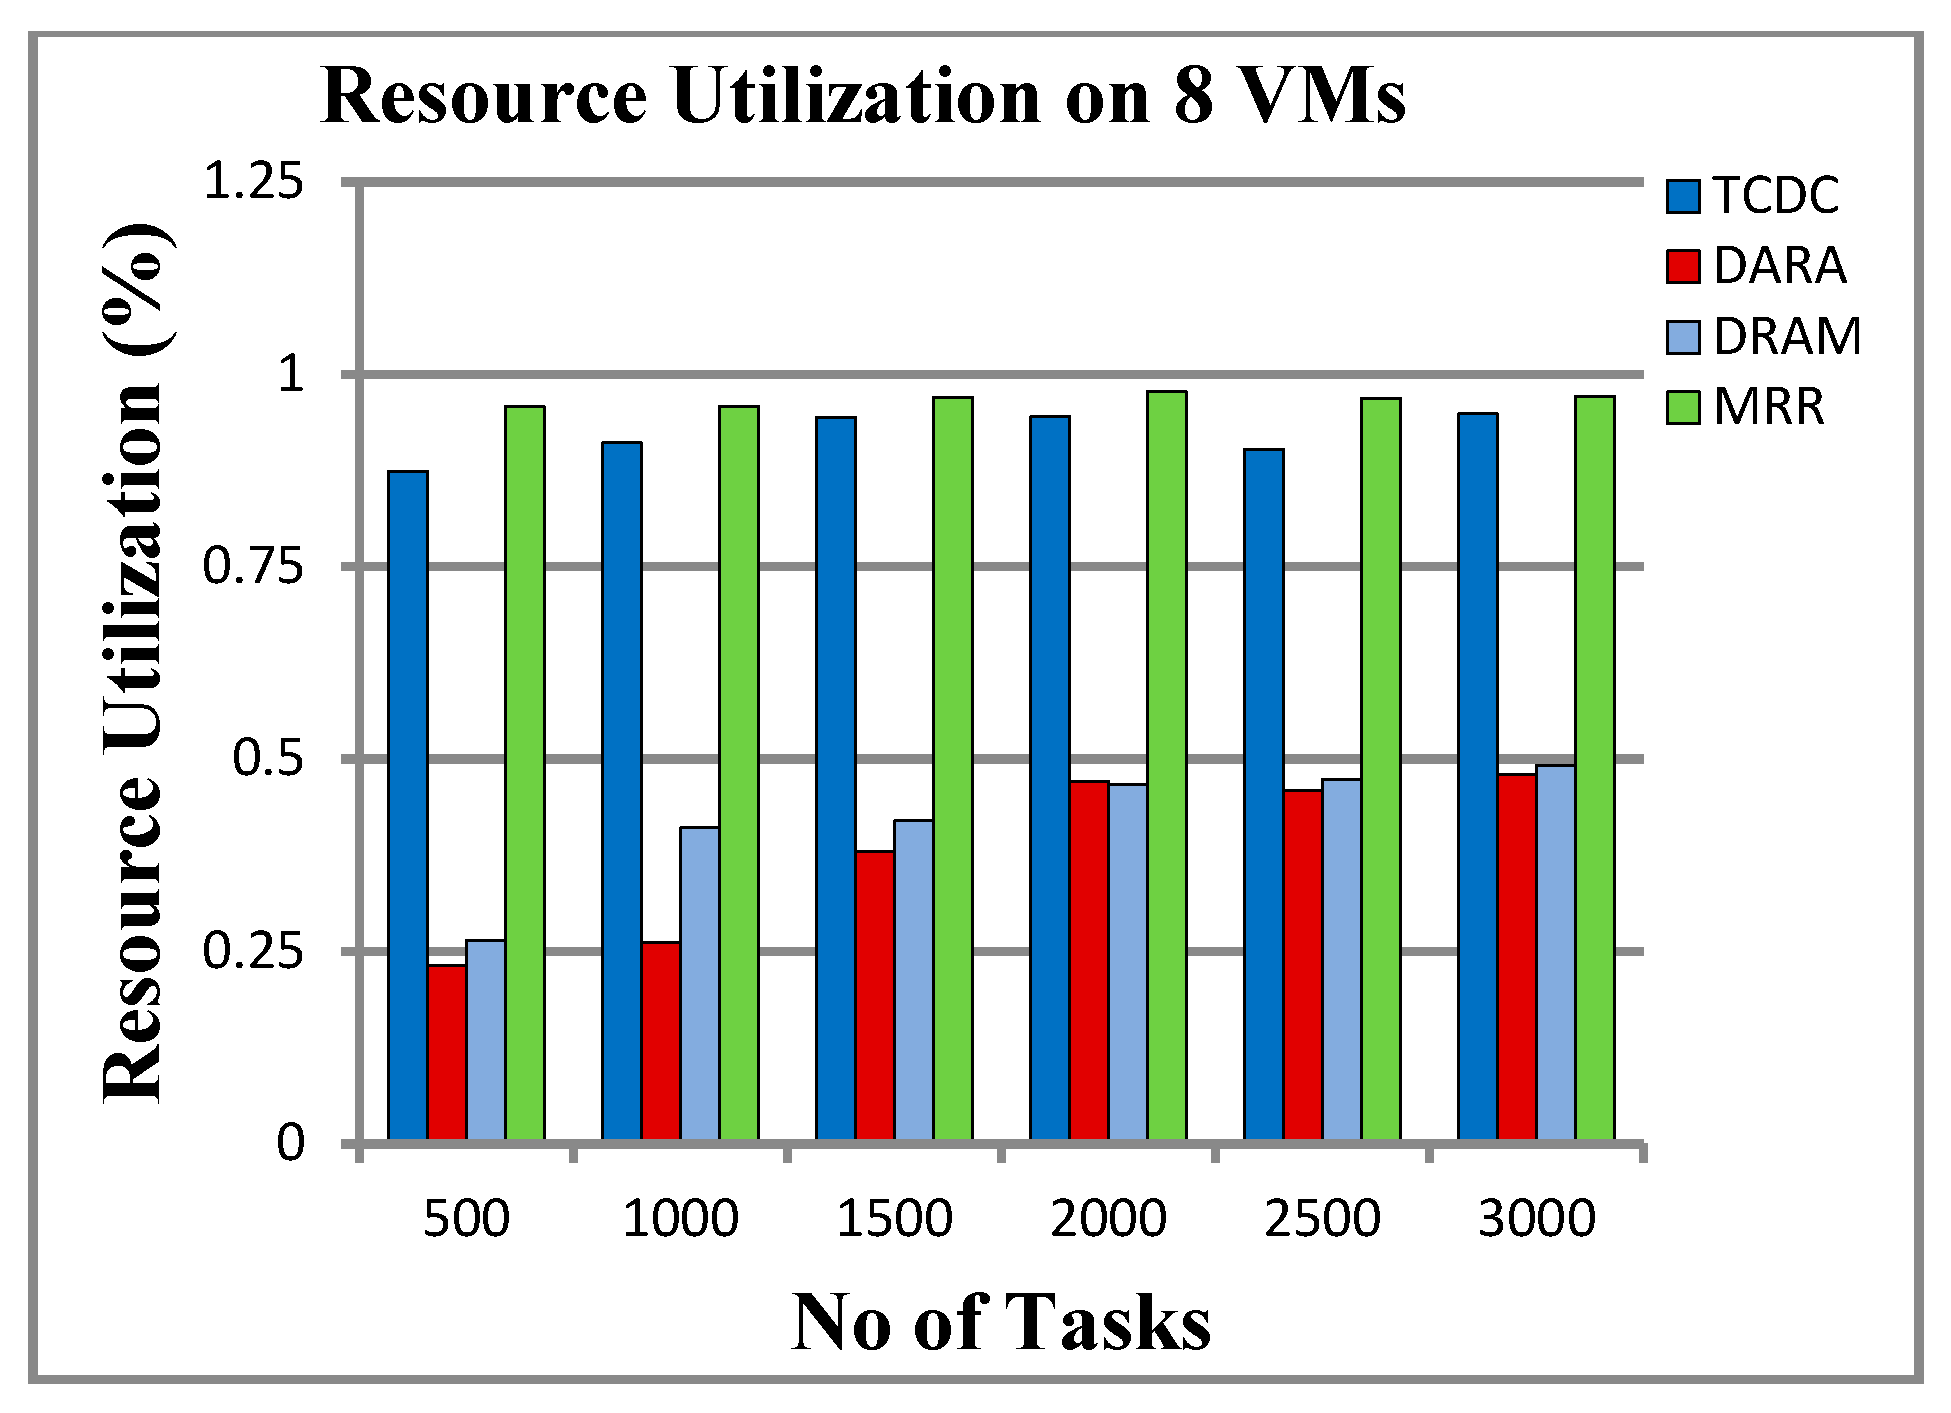
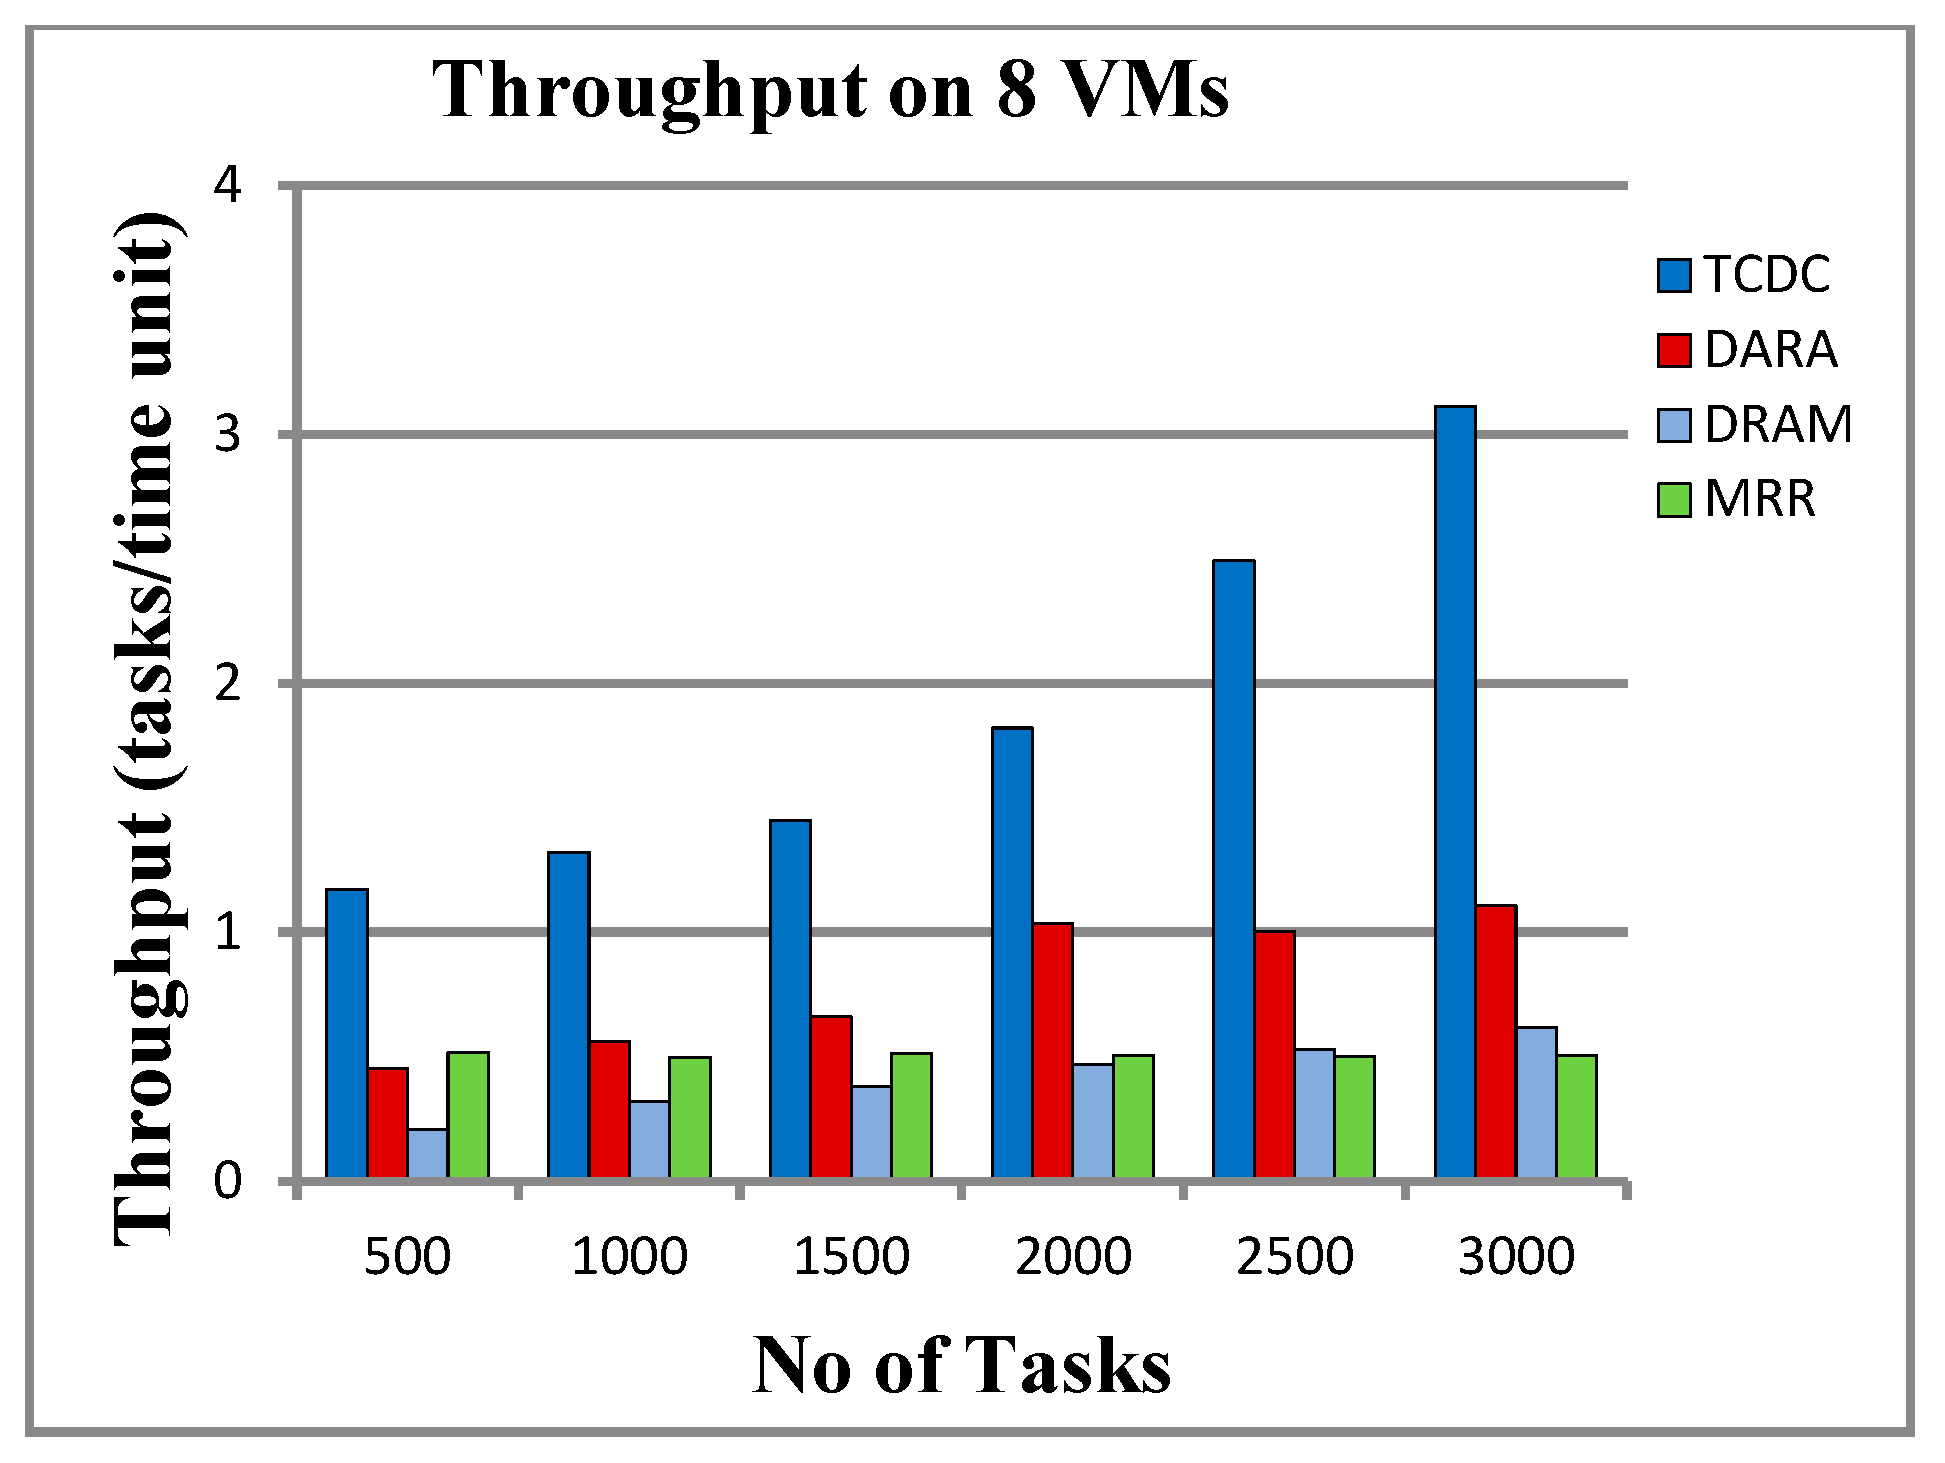
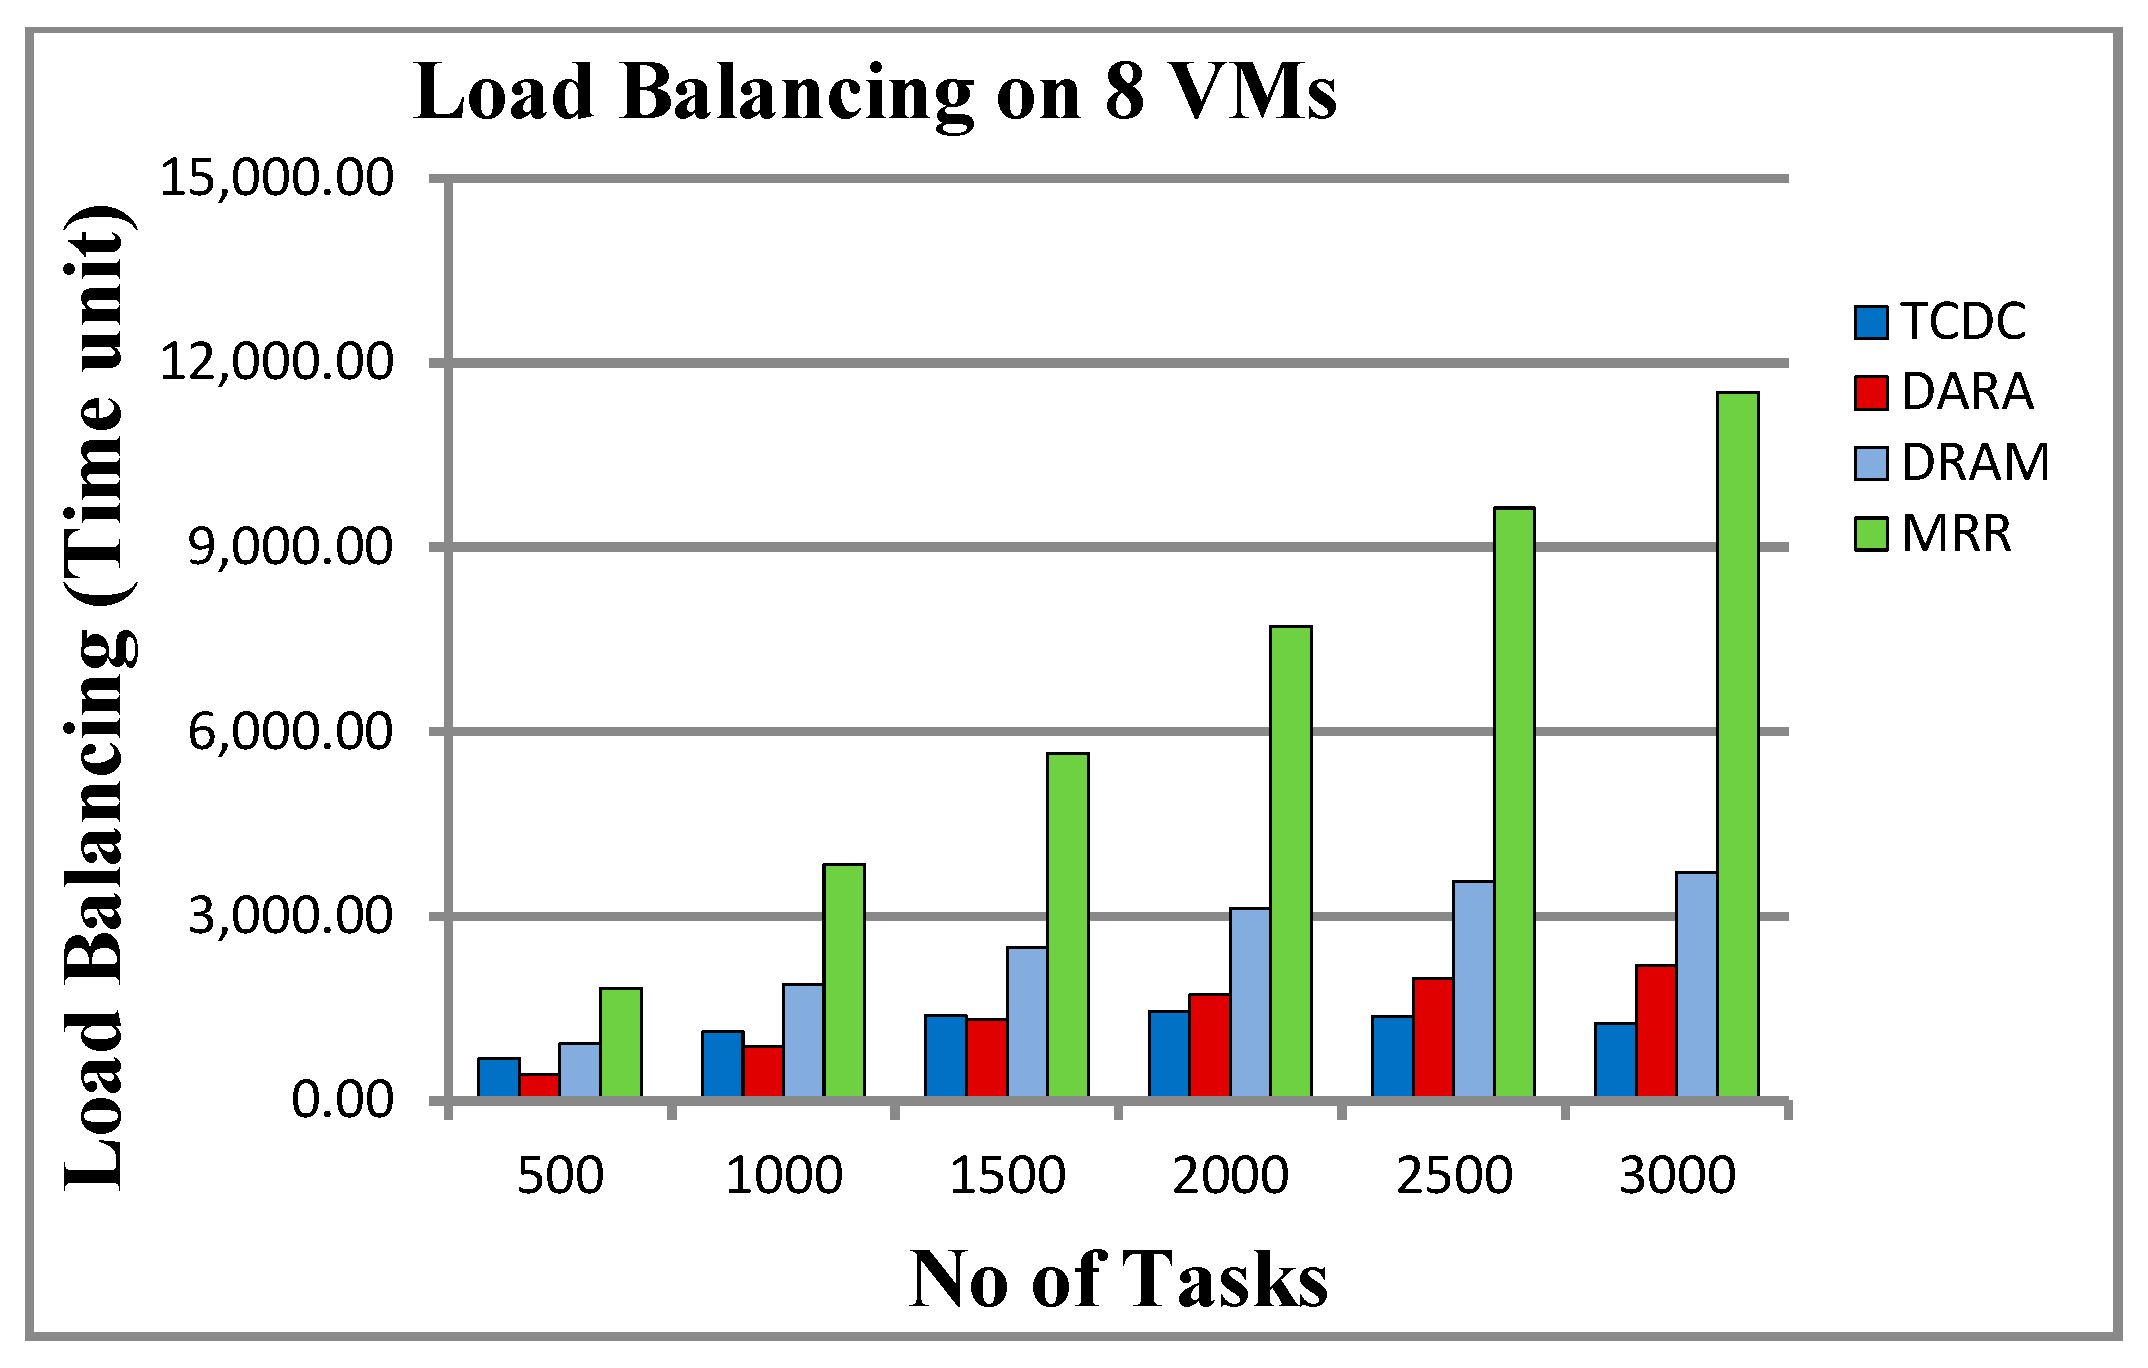
5.3.2. Results on 8 VMs
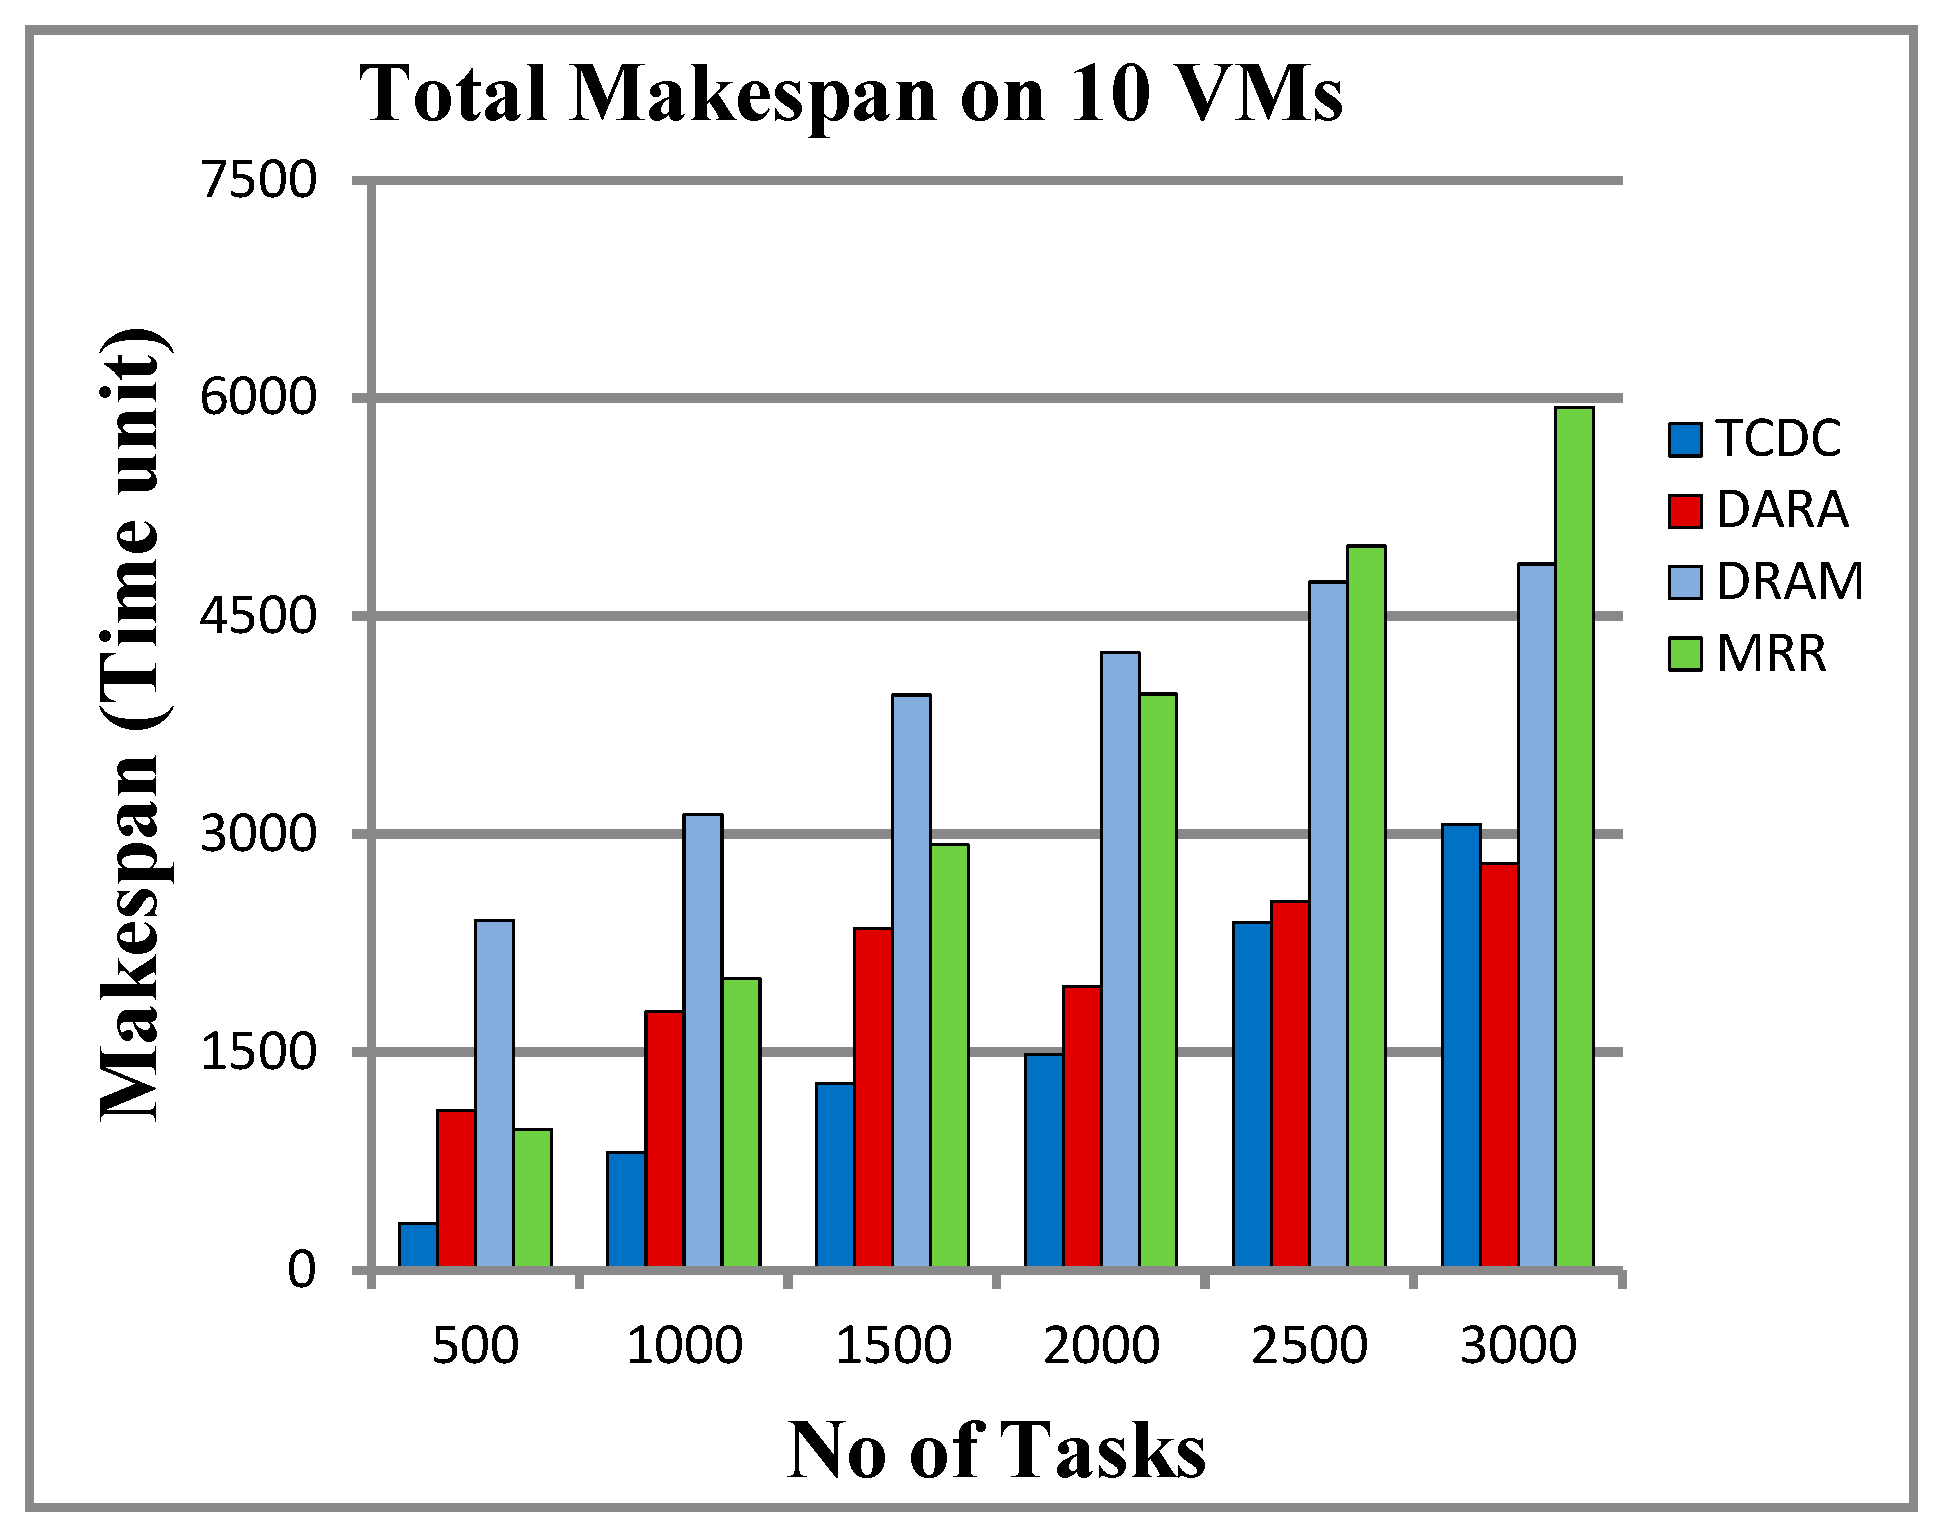
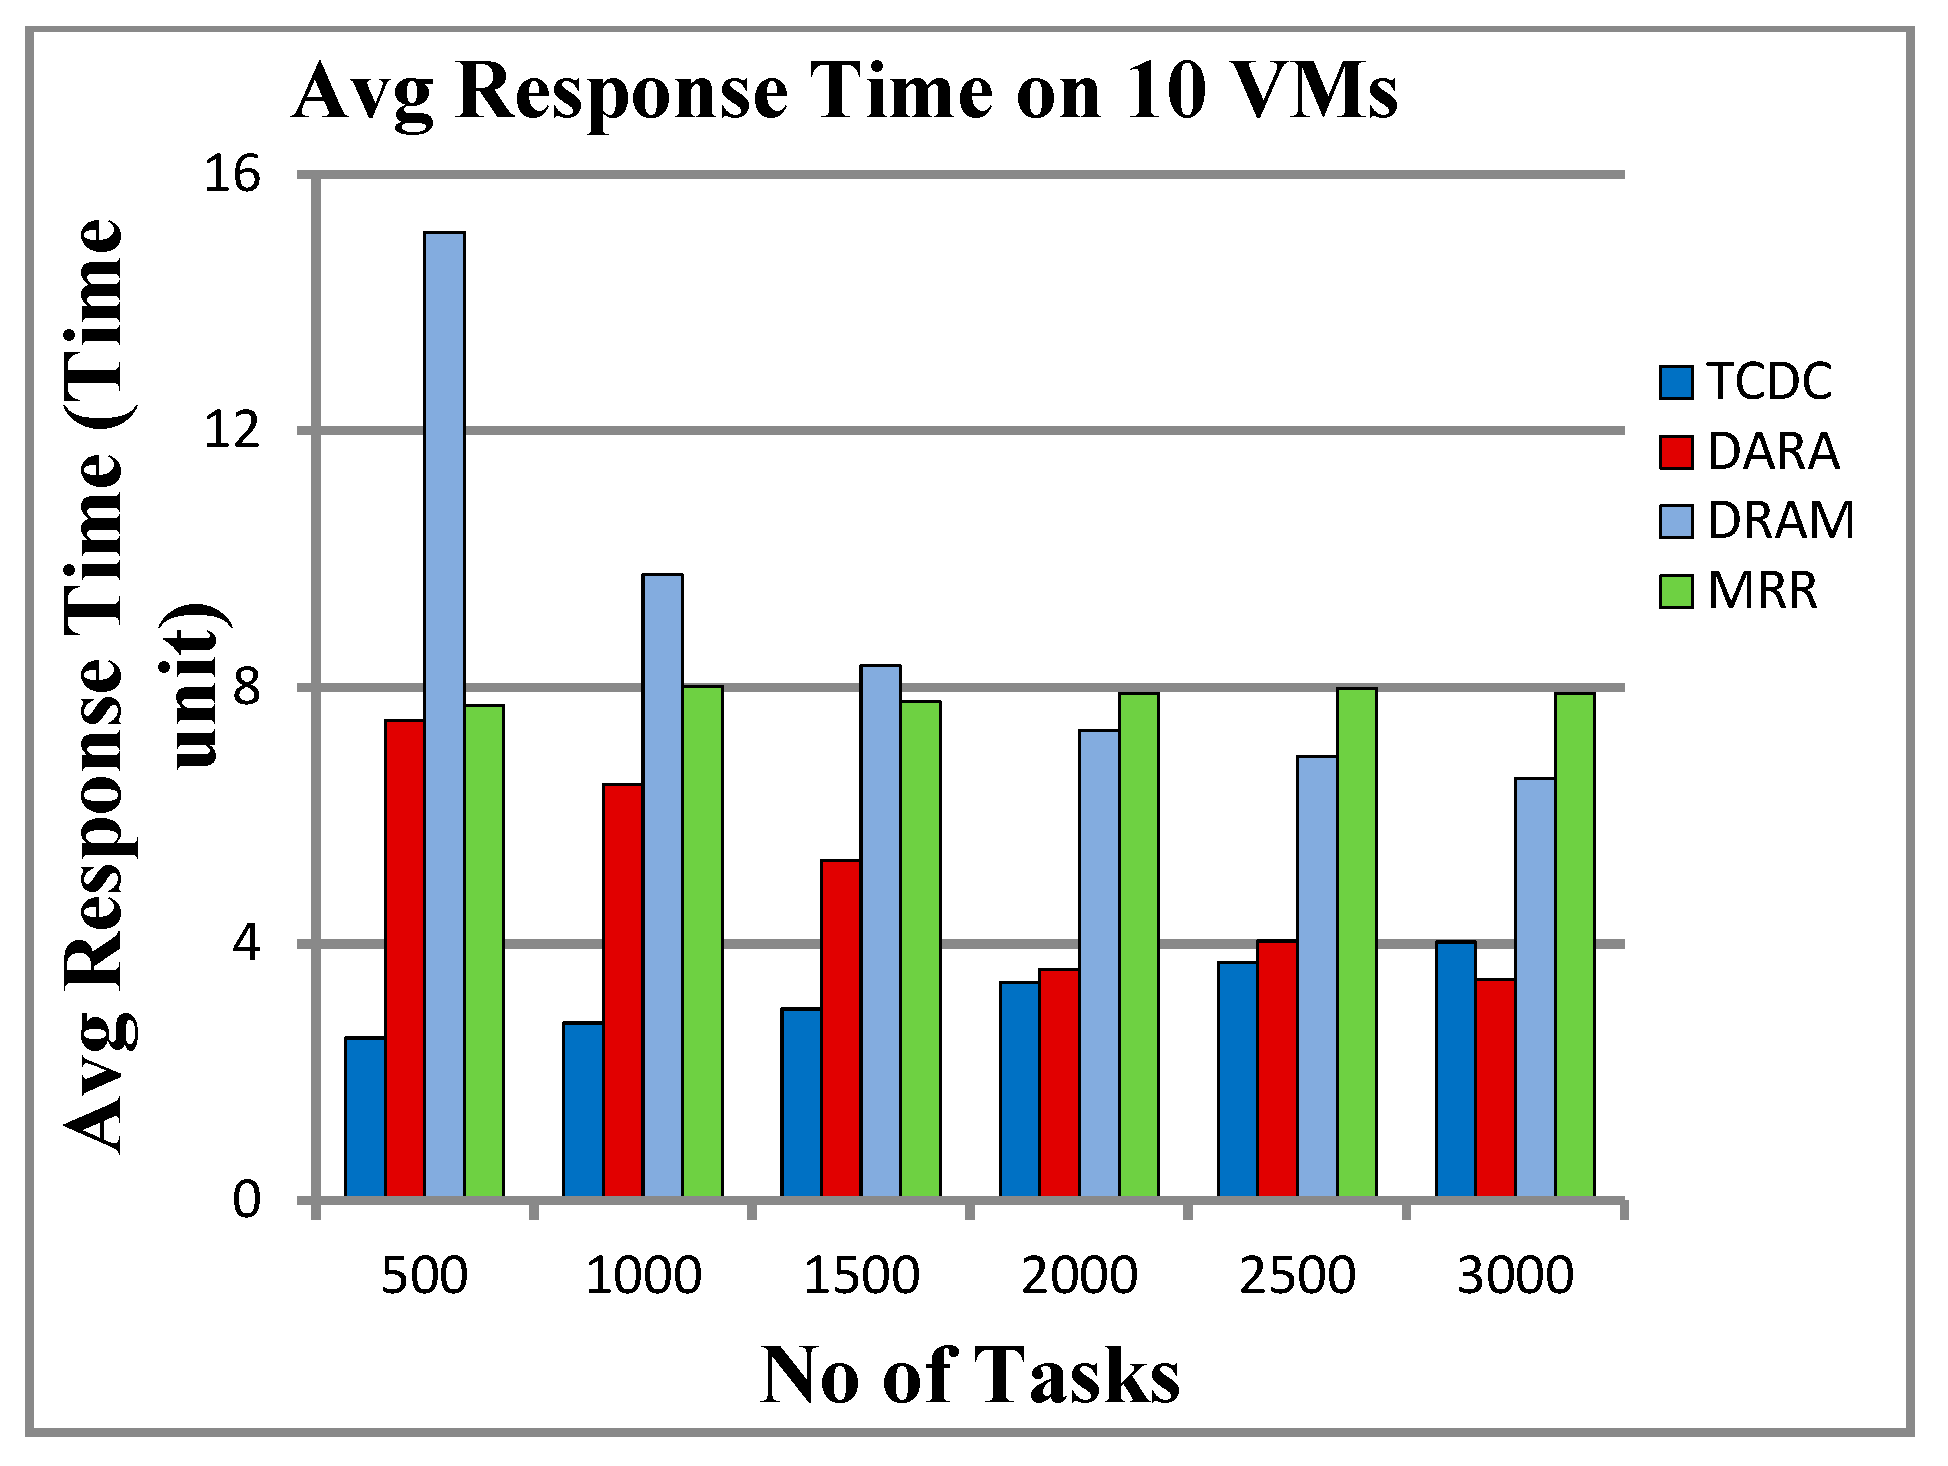
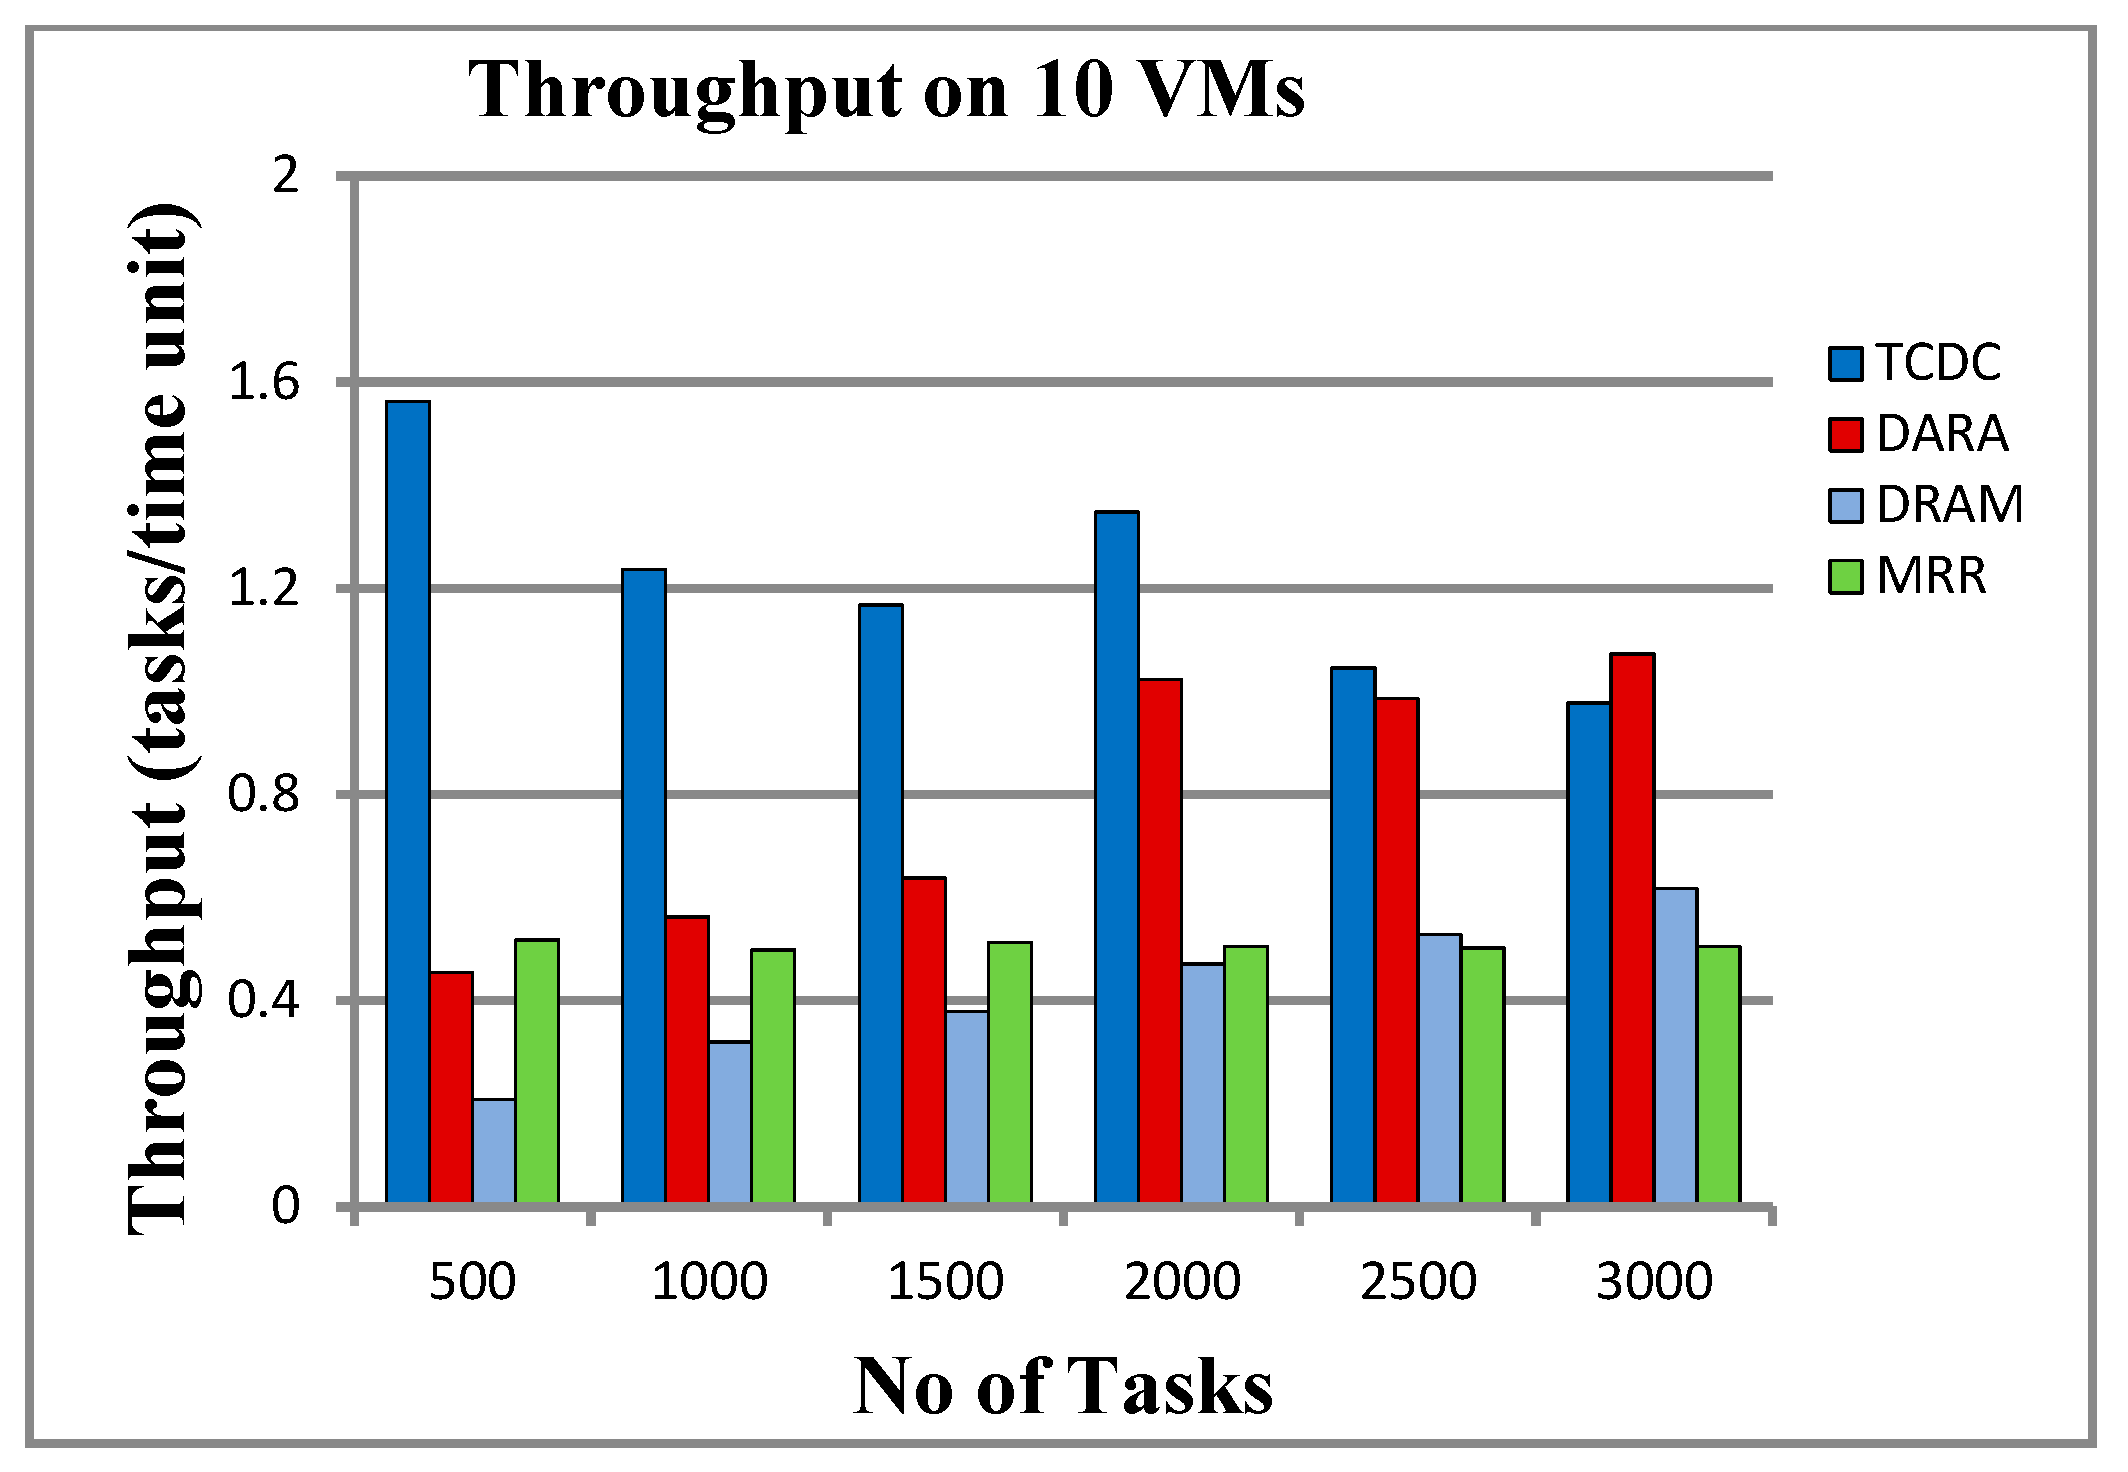
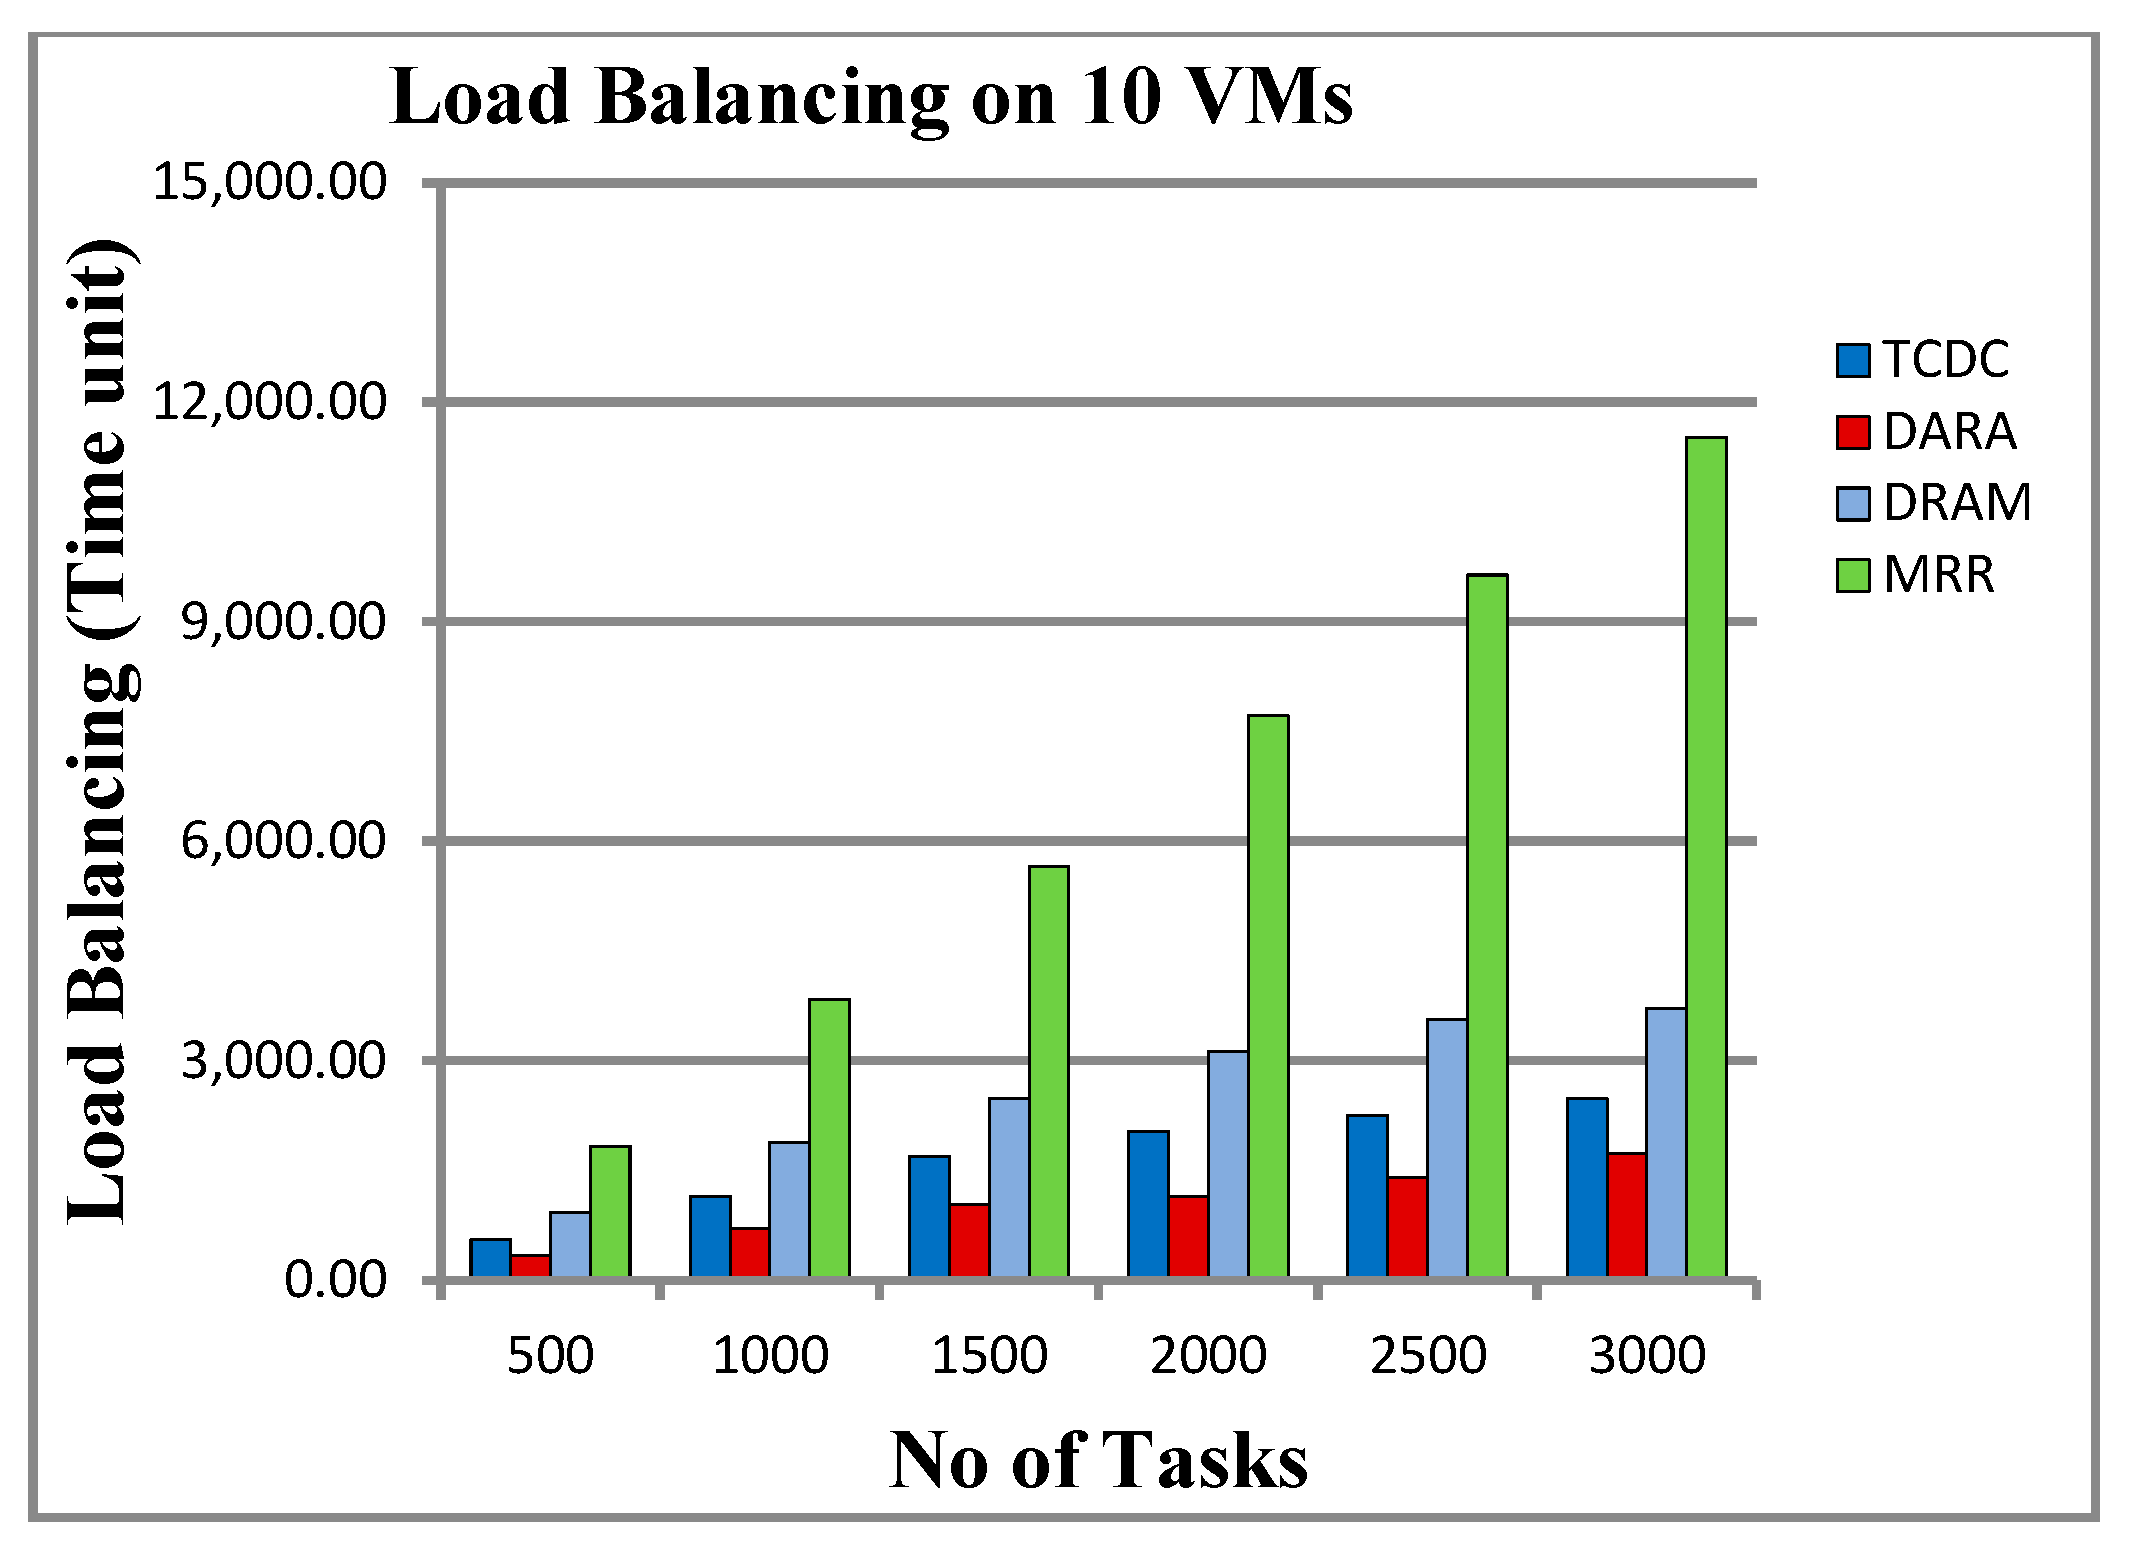
5.3.3. Results on 10 VMs
6. Results and Performance Discussion
6.1. Makespan and Response Time
6.2. Throughput and Resource Utilization
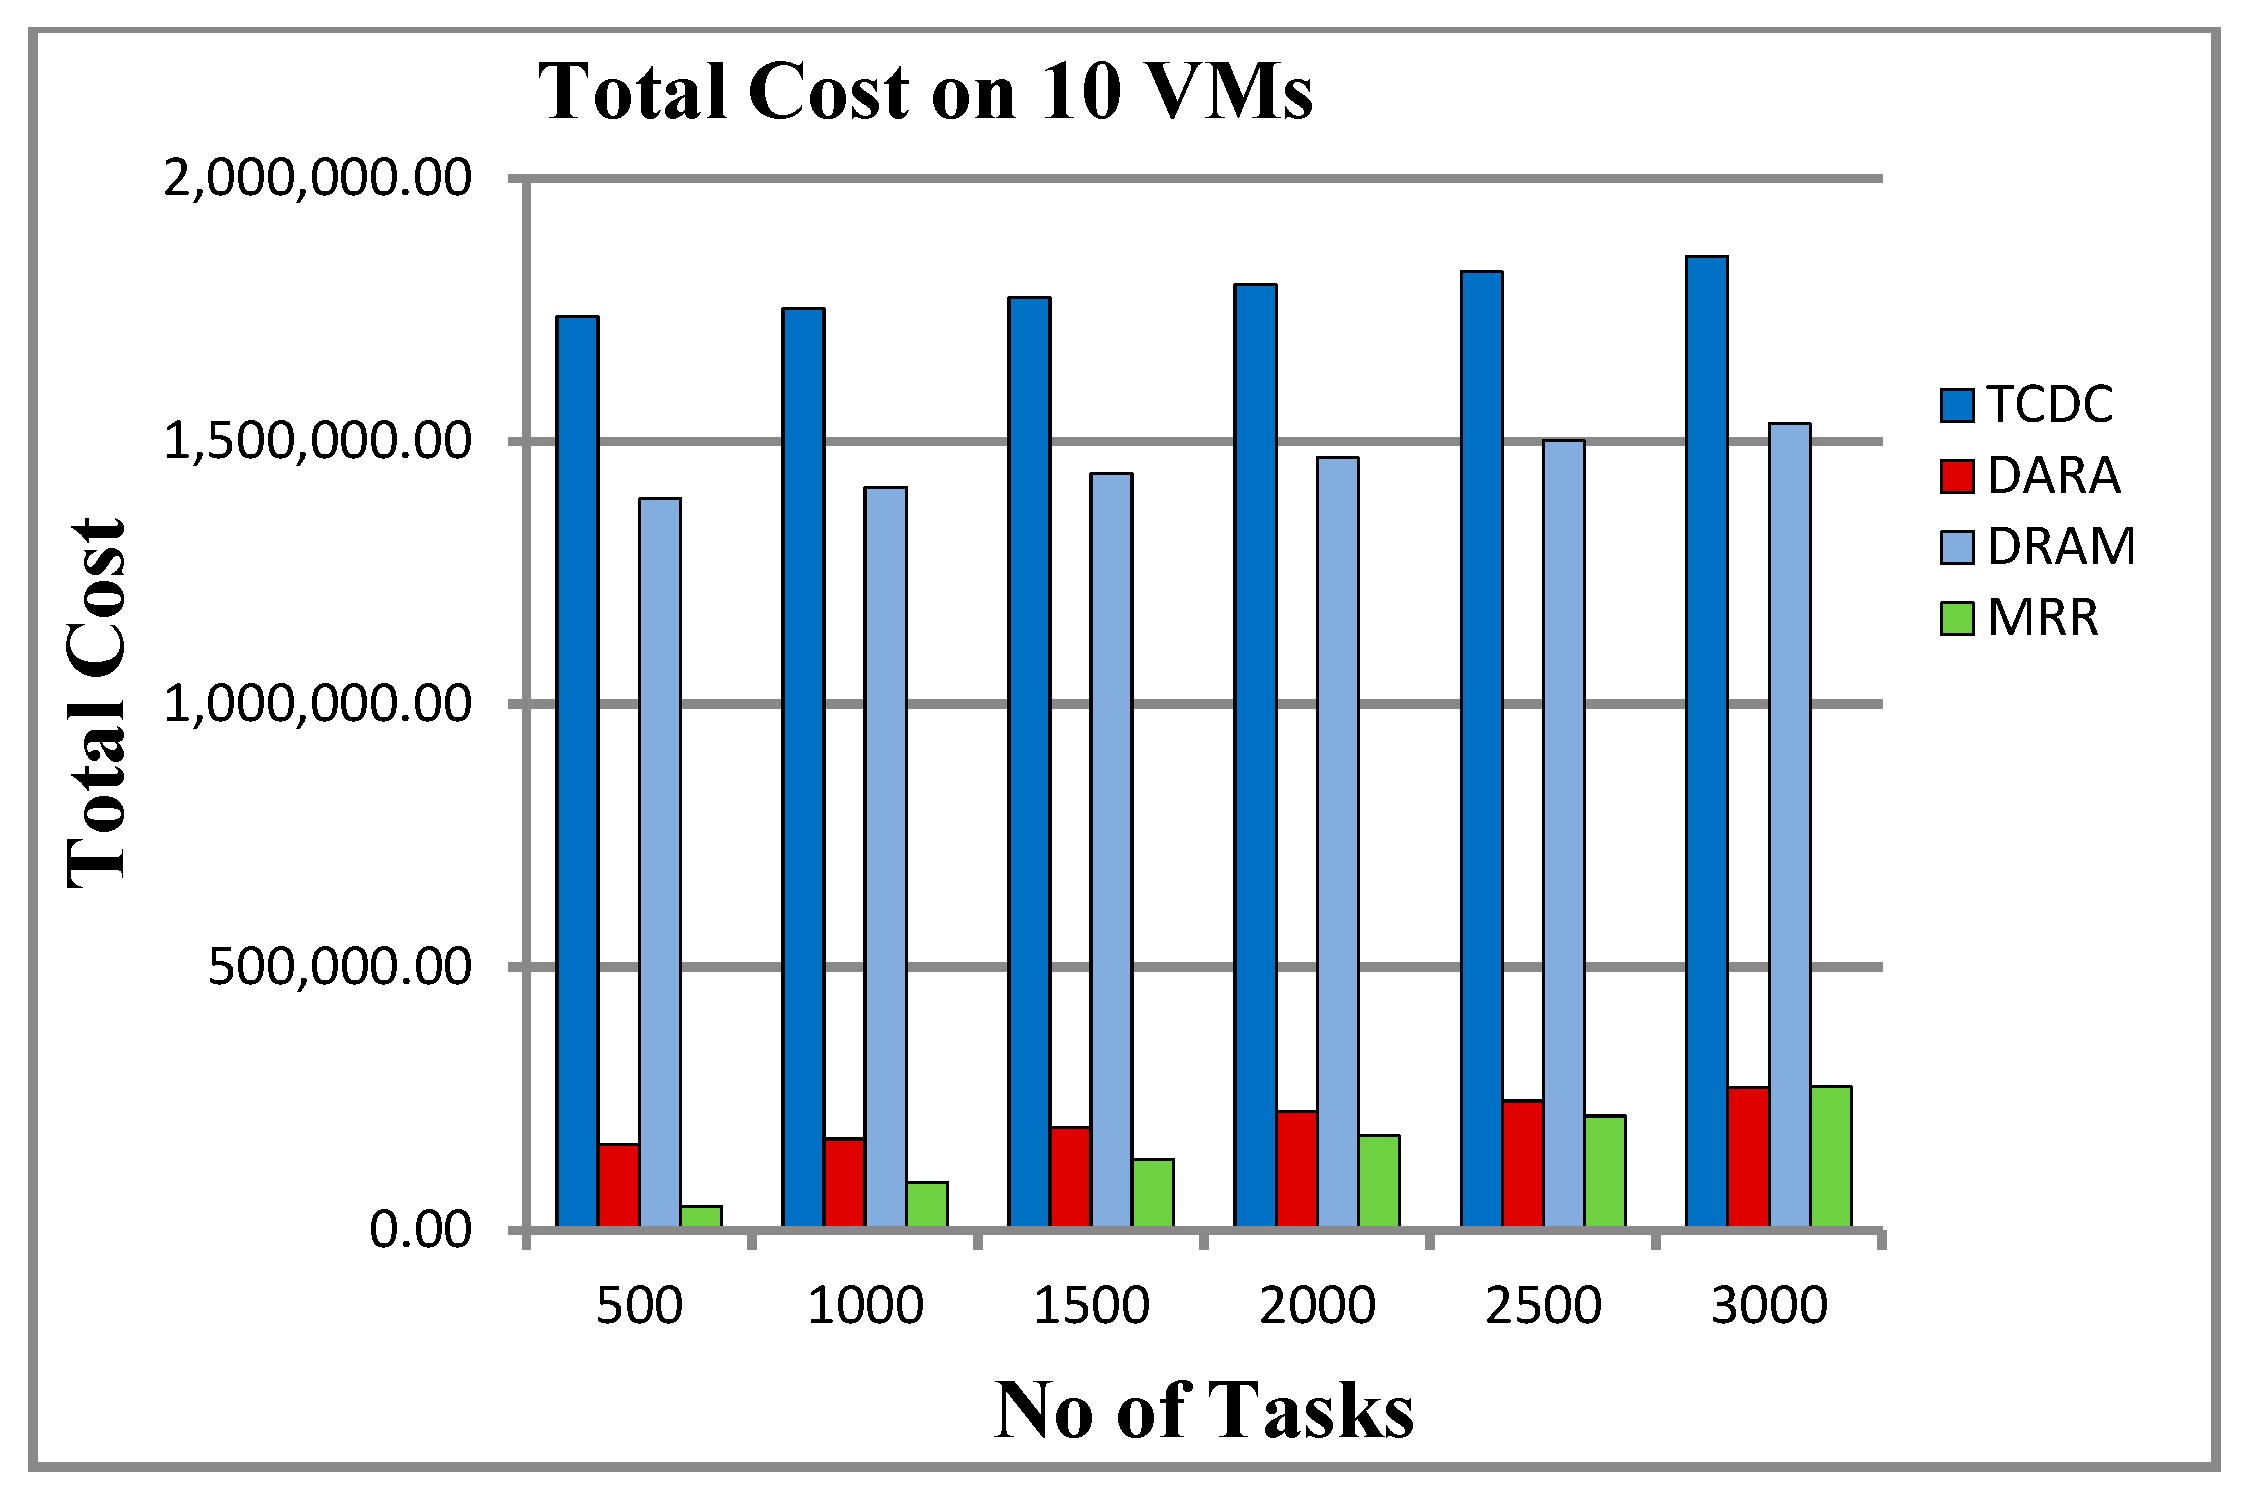
6.3. Load Balancing and Total Cost
6.4. Overall QoS Analysis
- Effective Resource Use: TCDC consistently achieves high resource utilization (over 90%), ensuring that resources are used efficiently with minimal idle time, leading to quicker task completion and increased throughput.
- Reduced Makespan: TCDC is adept at minimizing the total time needed to finish all tasks (makespan) by strategically scheduling tasks to cut down on idle time and overlapping computations, which enhances system efficiency.
- Quick Response Time: TCDC processes tasks rapidly after they are submitted, resulting in the lowest average response time across various task loads. This efficiency is likely due to its effective task prioritization and avoidance of bottlenecks.
- High Throughput: By managing task execution and resource allocation effectively, TCDC achieves the highest throughput, completing more tasks per time unit than its competitors. This scalability makes it ideal for systems facing increasing workloads.
- Task Prioritization and Scheduling Techniques: TCDC likely utilizes advanced scheduling methods (such as deadline-aware or priority-based scheduling) that ensure tasks are executed in a manner that minimizes delays and maximizes resource efficiency. This gives it an advantage over algorithms like DARA and DRAM, which struggle with uneven task distribution and inefficient resource use.
- Scalability: TCDC performs well as task counts increase, maintaining low makespan and response times even with growing workloads. This indicates a robust design capable of managing larger and more complex tasks without a drop in performance.
7. Conclusions and Future Work
Author Contributions
Funding
Data Availability Statement
Conflicts of Interest
Nomenclature
| Symbol | Description |
| S | Total number of fog servers. |
| S1, S2,..., Ss | Set of fog servers. |
| M | Total number of virtual machines per server. |
| p1, p2,..., pm | Set of virtual machines per server. |
| si | Processing speed of virtual machine i (MIPS). |
| N | Total number of tasks to be executed. |
| T1, T2,..., Tn | Set of tasks to be assigned for execution. |
| d | Task deadline (max allowed completion time). |
References
- Gia, T.N.; Jiang, M.; Rahmani, A.-M.; Westerlund, T.; Liljeberg, P.; Tenhunen, H. Fog computing in healthcare Internet of Things: A case study on ECG feature extraction. In Proceedings of the 2015 IEEE International Conference on Computer and Information Technology; Ubiquitous Computing and Communications; Dependable, Autonomic and Secure Computing; Pervasive Intelligence and Computing, Washington, DC, USA, 17–21 March 2015. [Google Scholar]
- Tanwar, S.; Tyagi, S.; Kumar, N. (Eds.) Security and Privacy of Electronics Healthcare Records (IET Book Series on E-Health Technologies); The Institution of Engineering and Technology: London, UK, 2019; pp. 1–450. [Google Scholar]
- Subbaraj, S.; Thiyagarajan, R. Performance oriented task-resource mapping and scheduling in fog computing environment. Cogn. Syst. 2021, 70, 40–50. [Google Scholar]
- Singh, S.P.; Nayyar, A.; Kaur, H.; Singla, A. Dynamic task scheduling using balanced VM allocation policy for fog computing platforms. Scalable Comput. Pract. Exp. 2019, 20, 433–456. [Google Scholar] [CrossRef]
- Wadhwa, H.; Aron, R. Optimized task scheduling and preemption for distributed resource management in fog-assisted IoT environment. J. Supercomput. 2023, 79, 2212–2250. [Google Scholar]
- Jamil, B.; Ijaz, H.; Shojafar, M.; Buyya, R. Resource Allocation and Task Scheduling in Fog Computing and Internet of Everything Environments: A Taxonomy, Review, and Future Directions. ACM Comput. Surv. 2022, 54, 1–38. [Google Scholar] [CrossRef]
- Khan, S.; Shah, I.A.; Nadeem, M.F.; Jan, S.; Whangbo, T.; Ahmad, S. Optimal Resource Allocation and Task Scheduling in Fog Computing for Internet of Medical Things Application. Hum. -Centric Comput. Inf. Sci. 2023, 13, 56. [Google Scholar]
- Thilakarathne, N.N.; Muneeswari, G.; Parthasarathy, V.; Alassery, F.; Hamam, H.; Mahendran, R.K.; Shafiq, M. Federated learning for privacy preserved medical Internet of Things. Intell. Autom. Soft Comput. 2022, 33, 157–172. [Google Scholar]
- Almaiah, M.A.; Hajjej, F.; Ali, A.; Pasha, M.F.; Almomani, O. A novel hybrid trustworthy decentralized authentication and data preservation model for digital healthcare IoT based CPS. Sensors 2022, 22, 1448. [Google Scholar] [CrossRef]
- Hu, P.; Dhelim, S.; Ning, H.; Qiu, T. Survey on fog computing: Architecture, key technologies, applications and open issues. J. Netw. Comput. Appl. 2017, 98, 27–42. [Google Scholar]
- Atlam, H.F.; Walters, R.J.; Wills, G.B. Fog computing and the internet of things: A review. Big Data Cogn. Comput. 2018, 2, 10. [Google Scholar] [CrossRef]
- Gupta, M.; Singla, N. Learner to Advanced: Big Data Journey. In Handbook of IoT and Big Data; CRC Press: Boca Raton, FL, USA, 2019; p. 187. [Google Scholar]
- Farahani, B.; Firouzi, F.; Chang, V.; Badaroglu, M.; Constant, N.; Mankodiya, K. Towards fog-driven IoT eHealth: Promises and challenges of IoT in medicine and healthcare. Future Gener. Comput. Syst. 2018, 78, 659–676. [Google Scholar]
- Khan, A.; Abbas, A.; Khattak, H.A.; Rehman, F.; Din, I.U.; Ali, S. Effective Task Scheduling in Critical Fog Applications. Sci. Program. 2022, 2022, 9208066. [Google Scholar] [CrossRef]
- Rghioui, A.; Lloret, J.; Harane, M.; Oumnad, A. A smart glucose monitoring system for diabetic patient. Electronics 2020, 9, 678. [Google Scholar] [CrossRef]
- Guevara, J.C.; da Fonseca, N.L.S. Task scheduling in cloud-fog computing systems. Peer-to-Peer Netw. Appl. 2021, 14, 962–977. [Google Scholar] [CrossRef]
- Tanwar, S.; Obaidat, M.S.; Tyagi, S.; Kumar, N. Online Signature-Based Biometric Recognition. In Biometric-Based Physical and Cybersecurity Systems; Springer: Cham, Switzerland, 2019; pp. 255–285. [Google Scholar]
- Tanwar, S.; Tyagi, S.; Kumar, N.; Obaidat, M.S. Ethical, Legal, and Social Implications of Biometric Technologies. In Biometric-Based Physical and Cybersecurity Systems; Springer: Cham, Switzerland, 2019; pp. 535–569. [Google Scholar]
- Aladwani, T. Scheduling IoT Healthcare Tasks in Fog Computing Based on their Importance. Procedia Comput. Sci. 2019, 163, 560–569. [Google Scholar]
- Stavrinides, G.L.; Karatza, H.D. A Hybrid Approach to Scheduling Real-Time Iot Workflows in Fog and Cloud Environments. Multimed. Tools Appl. 2019, 78, 24639–24655. [Google Scholar]
- Kopras, B.; Bossy, B.; Idzikowski, F.; Kryszkiewicz, P.; Bogucka, H. Task allocation for energy optimization in fog computing networks with latency constraints. IEEE Trans. Commun. 2022, 70, 8229–8243. [Google Scholar]
- Bansal, S.; Aggarwal, H.; Aggarwal, M. A systematic review of task scheduling approaches in fog computing. Trans. Emerg. Telecommun. Technol. 2022, 33, e4523. [Google Scholar]
- Agarwal, S.; Yadav, S.; Yadav, A. An Efficient Architecture and Algorithm for Resource Provisioning in Fog Computing. Int. J. Inf. Eng. Electron. Bus. 2016, 8, 48. [Google Scholar] [CrossRef]
- EL-Nattat, A.; El-Bahnasawy, N.A.; El-Sayed, A.; Elkazzaz, S. Performance Enhancement of Fog Environment with Deadline Aware Resource Allocation Algorithm. Menoufia. J. Electron. Eng. Res. 2022, 31, 107–119. [Google Scholar]
- Xu, X.; Fu, S.; Cai, Q.; Tian, W.; Liu, W.; Sun, X.; Liu, A.X. Dynamic Resource Allocation for Load Balancing in Fog Environment. Wirel. Commun. Mob. Comput. 2018, 2018, 6421607. [Google Scholar] [CrossRef]
- Behera, R.K. An Efficient Fog Layer Task Scheduling Algorithm for Multi- Tiered IoT Healthcare Systems. Int. J. Reliab. Qual. E-Healthc. 2022, 11, 1–11. [Google Scholar]
- Sun, Y.; Lin, F.; Xu, H. Multi-objective Optimization of Resource Scheduling in Fog Computing Using an Improved NSGA-II. Wirel. Pers. Commun. 2018, 102, 1369–1385. [Google Scholar] [CrossRef]
- Jamil, B.; Shojafar, M.; Ahmed, I.; Ullah, A.; Munir, K.; Ijaz, H. A job scheduling algorithm for delay and performance optimization in fog computing. Concurr. Comput. Pract. Exp. 2020, 32, e5581. [Google Scholar] [CrossRef]
- Khattak, H.A.; Arshad, H.; Ahmed, G.; Jabbar, S.; Sharif, A.M.; Khalid, S. Utilization and load balancing in fog servers for health applications. EURASIP J. Wirel. Commun. Netw. 2019, 2019, 91. [Google Scholar] [CrossRef]
- Tang, W.; Zhang, K.; Zhang, D.; Ren, J.; Zhang, Y.; Shen, X. Fog-enabled smart health: Toward cooperative and secure healthcare service provision. IEEE Commun. Mag. 2019, 57, 42–48. [Google Scholar] [CrossRef]
- Li, L.; Guan, Q.; Jin, L.; Guo, M. Resource allocation and task offloading for heterogeneous real-time tasks with uncertain duration time in a fog queueing system. IEEE Access 2019, 7, 9912–9925. [Google Scholar] [CrossRef]
- Mahmud, R.; Buyya, R. Modeling and simulation of fog and edge computing environments using ifogsim toolkit. In Fog and Edge Computing: Principles and Paradigms; Wiley Telecom: Hoboken, NJ, USA, 2019; pp. 433–465. [Google Scholar]
- Kim, S. Novel resource allocation algorithms for the social internet of things based fog computing paradigm. Wirel. Commun. Mob. Comput. 2019, 2019, 3065438. [Google Scholar] [CrossRef]
- Zhou, Z.; Liu, P.; Feng, J.; Zhang, Y.; Mumtaz, S.; Rodriguez, J. Computation resource allocation and task assignment optimization in vehicular fog computing: A contract-matching approach. IEEE Trans. Veh. Technol. 2019, 68, 3113–3125. [Google Scholar] [CrossRef]
- Wu, C.-G.; Wang, L. A Deadline-Aware Estimation of Distribution Algorithm for Resource Scheduling in Fog Computing Systems. In Proceedings of the 2019 IEEE Congress on Evolutionary Computation (CEC), Wellington, New Zealand, 10–13 June 2019. [Google Scholar]
- Thota, C.; Manogaran, G.; Sundarasekar, R.; Varatharajan, R.; Priyan, M.K. Centralized Fog Computing Security Platform for IoT and Cloud in Healthcare System; IGI Global: Hershey, PA, USA, 2018. [Google Scholar]
- Balamurugan, S.; Jeevitha, L.; Anupriya, A.; Shanker, G.K. Fog Computing: Synergizing Cloud, Big Data and IoT-Strengths, Weaknesses, Opportunities and Threats (SWOT) Analysis. Int. Res. J. Eng. Technol. 2016, 3, 726–731. [Google Scholar]
- Khurma, R.A.; Al Harahsheh, H.; Sharieh, A. Task Scheduling Algorithm in Cloud Computing Based on Modified Round Robin Algorithm. J. Theor. Appl. Inf. Technol. 2018, 96, 5869–5888. [Google Scholar]
- Madni, S.H.H.; Muhammad, S.A.L.; Coulibaly, Y.; Abdulhamid, S.M. An appraisal of meta-heuristic resource allocation techniques for IaaS cloud. Indian J. Sci. Technol. 2016, 9, 1–14. [Google Scholar] [CrossRef]
- Panda, S.K.; Gupta, I.; Jana, P.K. Task scheduling algorithms for multi-cloud systems: Allocation-aware approach. Inf. Syst. Front. 2019, 21, 241–259. [Google Scholar]
- Alworafi, M.A.; Dhari, A.; Al-Hashmi, A.A.; Suresha; Darem, A.B. Cost-Aware Task Scheduling in Cloud Computing Environment. Int. J. Comput. Netw. Inf. Secur. 2017, 9, 52–59. [Google Scholar] [CrossRef]


| Parameter | Value |
|---|---|
| Number of fog nodes | 3,4,5 |
| Number of VMs in each node | 2 |
| Computation power of VM (MIPS) | [10, 200] |
| Storage capacity of VM (GB) | 5000–15,000 |
| Memory of VM (MB) | 5000–15,000 |
| Memory Usage Cost ($/MB) | 0.1–0.5 |
| Storage Usage Cost ($/MB) | 0.1–0.5 |
| Attribute | Value |
|---|---|
| Number of tasks | {500, 1000, 1500, 2000, 2500, 3000} |
| Critical level | [1, 3] |
| Arrival Time (Time Unit) | [0, 20] |
| Deadline (Time Unit) | [2, 10] |
| Length (Instruction) | [5, 50] |
| Required Capacity (GB) | [5, 50] |
| Required Memory (MB) | [5, 50] |
| No. of Tasks | Total Makespan (Time Unit) | Average Response Time (Time Unit) | ||||||
|---|---|---|---|---|---|---|---|---|
| TCDC | DARA | DRAM | MRR | TCDC | DARA | DRAM | MRR | |
| 500 | 506 | 1613 | 2405 | 966 | 3.989 | 12.50 | 15.095 | 7.706 |
| 1000 | 1001 | 2066 | 3132 | 2007 | 4.262 | 8.067 | 9.753 | 8.015 |
| 1500 | 1570 | 3315 | 3955 | 2926 | 4.060 | 8.221 | 8.331 | 7.774 |
| 2000 | 2003 | 3542 | 4250 | 3963 | 4.064 | 6.667 | 7.327 | 7.894 |
| 2500 | 2084 | 2902 | 4733 | 4981 | 4.316 | 4.62 | 6.909 | 7.975 |
| 3000 | 2071 | 4351 | 4857 | 5935 | 4.002 | 5.707 | 6.575 | 7.902 |
| No. of Tasks | Resource Utilization (%) | Throughput (Tasks/Time Unit) | ||||||
|---|---|---|---|---|---|---|---|---|
| TCDC | DARA | DRAM | MRR | TCDC | DARA | DRAM | MRR | |
| 500 | 0.941 | 0.326 | 0.264 | 0.958 | 0.988 | 0.309 | 0.207 | 0.517 |
| 1000 | 0.933 | 0.302 | 0.410 | 0.958 | 0.999 | 0.484 | 0.319 | 0.498 |
| 1500 | 0.914 | 0.294 | 0.419 | 0.969 | 0.955 | 0.452 | 0.379 | 0.512 |
| 2000 | 0.958 | 0.337 | 0.466 | 0.976 | 0.998 | 0.564 | 0.470 | 0.504 |
| 2500 | 0.935 | 0.577 | 0.473 | 0.968 | 1.199 | 0.861 | 0.528 | 0.501 |
| 3000 | 0.965 | 0.479 | 0.491 | 0.971 | 1.448 | 0.689 | 0.617 | 0.505 |
| No. of Tasks | Load Balancing (Time Unit) | Total Cost | ||||||
|---|---|---|---|---|---|---|---|---|
| TCDC | DARA | DRAM | MRR | TCDC | DARA | DRAM | MRR | |
| 500 | 923.833 | 567.5 | 925.833 | 1830.833 | 1,950,047.25 | 613,302.85 | 1,691,217.28 | 44,466 |
| 1000 | 1803.666 | 1171.833 | 1883.5 | 3834.5 | 1,972,928.75 | 620,397.45 | 1,712,019.98 | 90,132 |
| 1500 | 2302.166 | 1753 | 2486.5 | 5653.333 | 1,999,602.55 | 633,209.45 | 1,738,439.78 | 134,268 |
| 2000 | 2753.333 | 2301.5 | 3123 | 7719.5 | 2,029,980.95 | 654,435.05 | 1,769,740.88 | 180,306 |
| 2500 | 2846.333 | 2878.666 | 3567.833 | 9639.333 | 2,061,332.85 | 686,209.65 | 1,801,603.48 | 217,089 |
| 3000 | 2820 | 3444 | 3719.666 | 11,515.166 | 2,093,075.35 | 728,197.05 | 1,833,458.28 | 273,289 |
| No. of Tasks | Total Makespan (Time Unit) | Average Response Time (Time Unit) | ||||||
|---|---|---|---|---|---|---|---|---|
| TCDC | DARA | DRAM | MRR | TCDC | DARA | DRAM | MRR | |
| 500 | 426 | 1100 | 2405 | 966 | 3.258 | 7.482 | 15.095 | 7.706 |
| 1000 | 756 | 1778 | 3132 | 2007 | 3.262 | 6.482 | 9.753 | 8.015 |
| 1500 | 1035 | 2270 | 3955 | 2926 | 3.040 | 5.317 | 8.331 | 7.774 |
| 2000 | 1098 | 1931 | 4250 | 3963 | 3.205 | 3.572 | 7.327 | 7.894 |
| 2500 | 1003 | 2488 | 4733 | 4981 | 3.222 | 3.931 | 6.909 | 7.975 |
| 3000 | 964 | 2703 | 4857 | 5935 | 3.136 | 3.675 | 6.575 | 7.902 |
| No. of Tasks | Throughput (Tasks/Time Unit) | Resource Utilization (%) | ||||||
|---|---|---|---|---|---|---|---|---|
| TCDC | DARA | DRAM | MRR | TCDC | DARA | DRAM | MRR | |
| 500 | 1.173 | 0.454 | 0.207 | 0.517 | 0.873 | 0.231 | 0.264 | 0.958 |
| 1000 | 1.322 | 0.562 | 0.319 | 0.498 | 0.910 | 0.260 | 0.410 | 0.958 |
| 1500 | 1.449 | 0.660 | 0.379 | 0.512 | 0.943 | 0.379 | 0.419 | 0.969 |
| 2000 | 1.821 | 1.035 | 0.470 | 0.504 | 0.944 | 0.471 | 0.466 | 0.976 |
| 2500 | 2.492 | 1.004 | 0.528 | 0.501 | 0.902 | 0.458 | 0.473 | 0.968 |
| 3000 | 3.112 | 1.109 | 0.617 | 0.505 | 0.948 | 0.479 | 0.491 | 0.971 |
| No. of Tasks | Load Balancing (Time Unit) | Total Cost | ||||||
|---|---|---|---|---|---|---|---|---|
| TCDC | DARA | DRAM | MRR | TCDC | DARA | DRAM | MRR | |
| 500 | 691.875 | 425.125 | 925.833 | 1830.833 | 1,860,783.75 | 268,582.35 | 1,540,802.18 | 44,466 |
| 1000 | 1125.25 | 878.375 | 1883.5 | 3834.5 | 1,874,113.85 | 279,034.95 | 1,561,604.88 | 90,132 |
| 1500 | 1389.375 | 1313.75 | 2486.5 | 5653.333 | 1,889,980.65 | 300,243.95 | 1,588,024.68 | 134,268 |
| 2000 | 1454.375 | 1724.625 | 3123 | 7719.5 | 1,906,143.55 | 315,780.75 | 1,619,325.78 | 180,306 |
| 2500 | 1363.25 | 1984.25 | 3567.833 | 9639.333 | 1,922,333.85 | 335,729.95 | 1,651,188.38 | 217,089 |
| 3000 | 1258.375 | 2201.25 | 3719.666 | 11,515.166 | 1,938,212.75 | 360,727.65 | 1,683,043.18 | 273,289 |
| No. of Tasks | Total Makespan (Time Unit) | Average Response Time (Time Unit) | ||||||
|---|---|---|---|---|---|---|---|---|
| TCDC | DARA | DRAM | MRR | TCDC | DARA | DRAM | MRR | |
| 500 | 320 | 1100 | 2405 | 966 | 2.529 | 7.482 | 15.095 | 7.7063 |
| 1000 | 809 | 1778 | 3132 | 2007 | 2.769 | 6.482 | 9.753 | 8.015 |
| 1500 | 1285 | 2351 | 3955 | 2926 | 2.987 | 5.299 | 8.331 | 7.774 |
| 2000 | 1484 | 1954 | 4250 | 3963 | 3.394 | 3.597 | 7.327 | 7.894 |
| 2500 | 2391 | 2536 | 4733 | 4981 | 3.711 | 4.043 | 6.909 | 7.975 |
| 3000 | 3068 | 2796 | 4857 | 5935 | 4.028 | 3.445 | 6.575 | 7.902 |
| No. of Tasks | Throughput (Tasks/Time Unit) | Resource Utilization (%) | ||||||
|---|---|---|---|---|---|---|---|---|
| TCDC | DARA | DRAM | MRR | TCDC | DARA | DRAM | MRR | |
| 500 | 1.562 | 0.454 | 0.207 | 0.517 | 0.916 | 0.185 | 0.264 | 0.958 |
| 1000 | 1.236 | 0.562 | 0.319 | 0.498 | 0.766 | 0.208 | 0.410 | 0.958 |
| 1500 | 1.167 | 0.638 | 0.379 | 0.512 | 0.740 | 0.264 | 0.419 | 0.969 |
| 2000 | 1.347 | 1.023 | 0.470 | 0.504 | 0.782 | 0.371 | 0.466 | 0.976 |
| 2500 | 1.045 | 0.985 | 0.528 | 0.501 | 0.623 | 0.358 | 0.473 | 0.968 |
| 3000 | 0.977 | 1.072 | 0.617 | 0.505 | 0.543 | 0.395 | 0.491 | 0.971 |
| No. of Tasks | Load Balancing (Time Unit) | Total Cost | ||||||
|---|---|---|---|---|---|---|---|---|
| TCDC | DARA | DRAM | MRR | TCDC | DARA | DRAM | MRR | |
| 500 | 552.7 | 340.1 | 925.833 | 1830.833 | 1,737,064.85 | 163,129.27 | 1,390,387.08 | 44,466 |
| 1000 | 1151 | 702.7 | 1883.5 | 3834.5 | 1,751,487.95 | 173,581.87 | 1,411,189.78 | 90,132 |
| 1500 | 1699.5 | 1030.1 | 2486.5 | 5653.333 | 1,773,106.75 | 194,790.87 | 1,437,609.58 | 134,268 |
| 2000 | 2035.4 | 1151.8 | 3123 | 7719.5 | 1,797,640.25 | 225,864.47 | 1,468,910.68 | 180,306 |
| 2500 | 2246.9 | 1403 | 3567.833 | 9639.333 | 1,822,535.35 | 245,786.97 | 1,500,773.28 | 217,089 |
| 3000 | 2479.2 | 1737.7 | 3719.666 | 11,515.166 | 1,851,791.75 | 271,110.27 | 1,532,628.08 | 273,289 |
| Algorithm | Load Balancing | Total Cost | Resource Utilization | Throughput | Makespan | Response Time |
|---|---|---|---|---|---|---|
| TCDC | Moderate | High | High | High | Low | Low |
| DARA | Best | Low | Low | Moderate | Moderate | Moderate |
| DRAM | Poor | Moderate | Low | Low | High | High |
| MRR | Worst | Low | High | Moderate | High | Moderate |
Disclaimer/Publisher’s Note: The statements, opinions and data contained in all publications are solely those of the individual author(s) and contributor(s) and not of MDPI and/or the editor(s). MDPI and/or the editor(s) disclaim responsibility for any injury to people or property resulting from any ideas, methods, instructions or products referred to in the content. |
© 2025 by the authors. Licensee MDPI, Basel, Switzerland. This article is an open access article distributed under the terms and conditions of the Creative Commons Attribution (CC BY) license (https://creativecommons.org/licenses/by/4.0/).
Share and Cite
EL-Natat, A.; El-Bahnasawy, N.A.; El-Sayed, A.; Elkazzaz, S. Optimized Resource Allocation Algorithm for a Deadline-Aware IoT Healthcare Model. Big Data Cogn. Comput. 2025, 9, 80. https://doi.org/10.3390/bdcc9040080
EL-Natat A, El-Bahnasawy NA, El-Sayed A, Elkazzaz S. Optimized Resource Allocation Algorithm for a Deadline-Aware IoT Healthcare Model. Big Data and Cognitive Computing. 2025; 9(4):80. https://doi.org/10.3390/bdcc9040080
Chicago/Turabian StyleEL-Natat, Amal, Nirmeen A. El-Bahnasawy, Ayman El-Sayed, and Sahar Elkazzaz. 2025. "Optimized Resource Allocation Algorithm for a Deadline-Aware IoT Healthcare Model" Big Data and Cognitive Computing 9, no. 4: 80. https://doi.org/10.3390/bdcc9040080
APA StyleEL-Natat, A., El-Bahnasawy, N. A., El-Sayed, A., & Elkazzaz, S. (2025). Optimized Resource Allocation Algorithm for a Deadline-Aware IoT Healthcare Model. Big Data and Cognitive Computing, 9(4), 80. https://doi.org/10.3390/bdcc9040080