Article

A Novel Multimodal Data Fusion Framework: Enhancing Prediction and Understanding of Inter-State Cyberattacks

1
Institute of Geographic Sciences and Natural Resources Research, Chinese Academy of Sciences, Beijing 100101, China
2
Laboratory of Cyberspace Geography, Chinese Academy of Sciences, The Ministry of Public Security of the People’s Republic of China, Beijing 100101, China
3
College of Resources and Environment, University of Chinese Academy of Sciences, Beijing 101408, China
*
Authors to whom correspondence should be addressed.
Big Data Cogn. Comput. 2025, 9(3), 63; https://doi.org/10.3390/bdcc9030063
Submission received: 21 January 2025 / Revised: 24 February 2025 / Accepted: 2 March 2025 / Published: 7 March 2025

Abstract

Inter-state cyberattacks are increasingly becoming a major hidden threat to national security and global order. However, current prediction models are often constrained by single-source data due to insufficient consideration of complex influencing factors, resulting in limitations in understanding and predicting cyberattacks. To address this issue, we comprehensively consider multiple data sources including cyberattacks, bilateral interactions, armed conflicts, international trade, and national attributes, and propose an interpretable multimodal data fusion framework for predicting cyberattacks among countries. On one hand, we design a dynamic multi-view graph neural network model incorporating temporal interaction attention and multi-view attention, which effectively captures time-varying dynamic features and the importance of node representations from various modalities. Our proposed model exhibits greater performance in comparison to many cutting-edge models, achieving an F1 score of 0.838. On the other hand, our interpretability analysis reveals unique characteristics of national cyberattack behavior. For example, countries with different income levels show varying preferences for data sources, reflecting their different strategic focuses in cyberspace. This unveils the factors and regional differences that affect cyberattack prediction, enhancing the transparency and credibility of the proposed model.

1. Introduction

Currently, cyberspace, as an emerging geopolitical arena, is reshaping the geopolitical landscape and the global balance of power [1,2]. In this turbulent environment, some state and non-state actors are weaponizing cyber capabilities, increasingly using cyber operations as the preferred means for building geopolitical competitive advantages, whether to support their economies or to challenge the sovereignty of other nations [3]. In this context, given the high frequency and significant threats of cyberattacks, it is crucial to predict potential cyberattacks.
At present, research on cybersecurity at the national level can be broadly divided into two distinct fields: macro-level research and micro-level research. Macro-level research focuses on larger regions and uses aggregated data or indicators (e.g., fixed broadband subscriptions) to understand the driving factors of cyberattacks. Researchers in this field believe that national-level cyberattack activities are complex phenomena related to political motivations, military strategies, social culture, national sentiments, etc. [4,5,6,7]. These studies provide valuable insights into the overall trends and motivations behind cyberattacks. Meanwhile, micro-level research concentrates on specific attackers or attack methods and uses fine-grained data (e.g., network traffic) to analyze cyber threats. Machine learning, data mining and other techniques are often employed to detect anomalies or forecast potential cybersecurity incidents [8,9,10,11,12]. These approaches have achieved significant success in identifying specific attack patterns and making short-term prediction.
Despite the valuable contributions made by the aforementioned studies, there exists a disconnect between the two areas of research. In fact, the essence of inter-state cyberattacks is a concrete manifestation of international relations in specific practical activities. These malicious cyber actions do not occur in isolation, but are inevitably influenced by a series of relationships, including political, economic, military, diplomatic, and cultural factors, with the aim of achieving deterrence effects or altering the information balance with adversaries [13]. Therefore, these observable or monitorable features at the macro level can serve as effective early predictive indicators of abnormal activities or hostile actions in cyberspace [14]. Unfortunately, there is a lack of a connective bridge between the two areas of research, which leads to the following key issues. First, predictive capability is limited. On one hand, while macro-level factors can help understand cyber attack behaviors at the national level, they are often insufficient to make accurate and timely prediction for specific cyberattacks due to their large spatiotemporal scale. On the other hand, without integrating macro-level factors, micro-level predictive models fail to account for the broader context that influences the likelihood of cyberattacks, which may impact their prediction effectiveness. Second, the predictive results lack interpretability. Models focusing solely on micro-level data often provide limited insights into the root causes and motivations behind cyberattacks, making it difficult for decision-makers to formulate informed strategies.
To address these limitations, a more systematic approach is required to bridge the gap between macro-level factor analysis and micro-level prediction. To this end, we propose a multimodal data fusion framework for predicting cyberattacks, aimed to effectively predict and explain malicious cyber behaviors among countries. Specifically, the framework integrates multiple data sources, including historical cyberattack records, inter-state interaction events, armed conflict incidents, international trade data, and national attribute information. This comprehensive integration of data not only enables us to capture direct technical indicators of cyberattacks, but also incorporates broader geopolitical and economic factors that influence inter-state cyberattacks. Furthermore, an interpretability module is incorporated into the framework. By leveraging explainable boosting machine and attention weight analysis, we can gain deeper insights into the decision-making process of the model and reveal the relative importance of different features and datasets in predicting cyberattacks.
Based on the aforementioned considerations, we propose a dynamic multi-view graph neural network to model the time-varying relationships between countries while capturing the interdependencies among different data modalities. First, static graph neural networks (e.g., GCN and GAT) are designed for fixed graphs, making them inadequate for capturing the temporal evolution of inter-state relationships, where nodes (i.e., countries), edges (i.e., bilateral relations), and attributes (i.e., national characteristics) change continuously over time [15,16]. Second, dynamic graph neural networks typically rely on sequential models such as LSTM or GRU to process temporal dependencies, but they fail to fully account for cross-modal interactions among different data modalities (e.g., cyberattacks and armed conflicts) [17,18]. Lastly, although multi-view graph neural networks can handle multiple interaction types, existing methods are usually limited to static snapshots, overlooking the temporal dynamics within each view [19,20]. These limitations motivate our proposed dynamic multi-view graph neural network, which integrates temporal interaction attention mechanism and multi-view attention mechanism to simultaneously model the time-varying dynamics of country relations and the cross-modal dependencies among different data sources.
The contributions of this paper are mainly reflected in the following aspects:
  • Unlike previous studies that focus solely on either macro-level geopolitical analysis or micro-level technical research, we innovatively apply the concept of multimodal data fusion to the scenario of inter-state cyberattack prediction, overcoming the limitations of traditional single-source data approaches.
  • We propose a novel multimodal fusion model based on GNN that can captures temporal dependencies and multi-view interactions simultaneously. That is, the temporal interaction attention mechanism captures the evolving dependencies among various data modalities over time, while the multi-view attention mechanism adaptively weights different modalities to achieve effective integration of heterogeneous data sources.
  • To ensure transparency and credibility, we integrate explainable boosting machine and attention-based weight analysis. Through this approach, we identify key geopolitical and economic factors underlying cyberattacks and highlight regional disparities, providing valuable insights for policymakers and cybersecurity professionals.
The rest of this paper is organized as follows. Section 4 describes the research data and their selection criteria. Section 5 introduces the architecture and core components of the interpretable multimodal data fusion method. In Section 6, we present the results through comparative experiments and ablation experiments. In Section 7, we discuss the results in depth, uncover the complex factors that influence cyberattack activities, and highlight the limitations of our study. Finally, we conclude this paper in Section 8.

2. Research Objectives

This study aims to develop a multimodal fusion framework that provides advanced prediction tools and explains the complex factors influencing inter-state cyberattacks. The research objectives are as follows:
  • RO1: To construct a comprehensive multimodal dataset (Section 4). By integrating data from multiple sources—cyberattack records, geopolitical news events, armed conflicts, international trade, and national attributes—we aim to provide a holistic view of cyberattack behaviors and their underlying factors. The rationale behind choosing these data sources is to incorporate diverse perspectives that offer richer context than any single data source could provide.
  • RO2: To design an advanced multimodal data fusion architecture (Section 5.1). Due to the complexity (e.g., interactivity and dynamics) of bilateral relations between nations, we need to design a novel dynamic multi-view graph neural network architecture to capture both interaction features and temporal characteristics among national networks in different domains (i.e., different datasets). This model structure is intended to optimize information integration from different modalities to improve the predictive ability of inter-state cyberattacks (Section 6.2 and Section 7.2).
  • RO3: To conduct interpretable analysis of inter-state cyberattacks (Section 5.2). Another primary focus of this study is to enhance the interpretability of cyberattack predictions and bridge the gap between computational methods and geopolitical analysis. We need to leverage some interpretability techniques to provide insights into key characteristics and regional patterns that influence cyberattack activities, thereby offering actionable information for decision-makers (Section 6.3 and Section 7.1).

3. Related Work

This section reviews related research work from the following three aspects. First, we introduce the quantitative analysis of inter-state cyberattacks, clarifying the multidimensional factors influencing national cyber behaviors. Second, we review prediction methods for cyberattacks based on digital media data. Third, we summarize the technical developments of graph neural networks in static graphs, dynamic graphs, and multi-view graphs. Additionally, in the final subsection, we provide a summary that clarifies the starting point of this study, as well as its relationship with the above three areas of research.

3.1. Quantitative Analysis of Inter-State Cyberattacks

Existing research shows that cyberattacks at the national level are a complex social phenomenon influenced by various factors. From the perspective of national characteristics, Hunter et al. [21] studied the relationship between regime type, military power, economic power, and cyberattacks. Kumar and Carley [22] employed network analysis to reveal the correlations between cyberattacks and various factors like the corruption index, GDP, and internet bandwidth. Chen et al. [6] constructed a theoretical framework integrating social, economic, political, and technological factors, revealing the causal relationships between cybercrime and diverse contextual factors. From the standpoint of state interactions, Kumar and Carley [7] analyzed the impact of inter-state sentiment on cyberattacks using social media data. Akoto [23] investigated the nonlinear dynamic effects of international trade composition on cyberattacks. Manzano [24] uncovered the connections between APT (Advanced Persistent Threat) and geopolitical and economic factors by analyzing numerous geopolitical events. These studies explored the driving factors of inter-state cyberattacks from different angles, which provides a theoretical foundation for introducing multiple datasets in our modeling.

3.2. Cyberattack Prediction Based on Digital Media Data

Digital media data, such as news reports, social media, and online blogs, have become important sources of information for mining and predicting social events [25], with typical applications including civil unrest detection [26], conflict prediction [27], and epidemic tracking [28]. In cybersecurity research, researchers have constructed deep learning-based models by collecting relevant information from digital media, aiming to predict cyberattacks before they occur. Wang and Zhang [29] proposed a hierarchical model based on Twitter text streams to capture both tweet-level and stream-level information, achieving early predictions of DDoS attacks. Deb et al. [30] utilized data from hacker forums to conduct sentiment analysis, validating the predictive power of sentiment signals for cyber events. Pechi [31] used news data to predict politically motivated cyberattacks, and compared various machine learning and natural language processing models in representing complex socio-political events. Lakha et al. [32] generated political event graphs using ICEWS news event data and proposed a prediction model based on graph embeddings and novelty detection algorithms, highlighting the importance of inter-state interactions in predictions. These studies demonstrate the potential of digital media data in capturing precursors to cyberattacks. But due to their reliance on single data sources, these models have limited predictive capabilities and cannot fully capture the diverse motivations behind cyberattacks.

3.3. Advancements in Graph Neural Networks

Graph neural networks (GNNs) are deep learning models designed to solve graph-related tasks in an end-to-end manner, widely applied in areas like social network analysis and recommendation systems [33,34]. Several classic GNN models, such as Graph Convolutional Networks (GCN) [35], GraphSAGE [36], and Graph Attention Networks (GAT) [37], perform well on static graphs but fall short in handling time-varying graph (i.e., nodes, attributes, and edges change over time) [15,16]. To address this challenge, researchers developed dynamic graph models that integrate sequence models with GNNs to capture temporal dependencies. For example, architectures based on recurrent neural networks (RNNs), including long short-term memory (LSTM) and gated recurrent units (GRU), utilize a series of graphs or their representations to learn time-aware embeddings embeddings [17,18]. The incorporation of attention mechanisms further improve the understanding of the most relevant time points for each representation [38,39]. Additionally, real-world networks often exhibit multi-view characteristics, where each view describes a type of interaction among a common set of nodes [40]. In multi-view learning, existing work has developed multi-relational learning, multi-attribute learning, and hybrid learning based on the input forms to achieve effective fusion of multi-dimensional information [41]. Despite the rapid development of GNNs, there is a scarcity of studies that model dynamic graphs and multi-view graphs simultaneously [19,20,42].

3.4. Multimodal Data Fusion

Multimodal data fusion techniques integrate heterogeneous information from different modalities (e.g., text, images, audio, and sensor data) to explore the complementarity and interconnections among data, thereby enhancing a model’s ability to understand complex phenomena [43,44]. Current multimodal fusion approaches can be broadly categorized into data-driven and model-driven methods. Data-driven methods are based on matrix and tensor decomposition techniques, which reduce dimensionality of complex multimodal data or decompose it into multiple low-dimensional factors, thereby revealing intrinsic correlations between different modalities. Examples include independent component analysis, parallel factor analysis, and coupled tensor decomposition [45]. Model-driven methods focus on designing end-to-end deep learning architectures, including early fusion, late fusion, hybrid fusion and other methods. Early fusion (feature-level fusion) integrates all features from different modalities into a single feature vector, which is suitable for scenarios where modalities are interdependent but requires strict data alignment. Late fusion (decision-level fusion) allows each modality to be modeled independently, making it preferable when one modality dominates the decision-making process. Hybrid fusion combines feature-level and decision-level fusion strategies, leveraging the benefits of both while mitigating their respective limitations [46,47]. In terms of applications, multimodal fusion techniques have demonstrated significant value in multiple domains. For example, in social networks, the integration of text, images, and user behavior data can substantially improve the accuracy of tasks such as sentiment analysis, social media popularity prediction, and event detection [48,49,50,51]. In environmental monitoring, the fusion of spatiotemporal data from satellite remote sensing, meteorological radar, and ground-based sensors facilitates disaster event detection, damage assessment, and early warning systems [52,53,54]. In the field of security, integrating social media data, historical event records, and geographic information, combined with social network analysis and spatiotemporal graph convolution, enables the dynamic prediction of terrorist attack risks [55,56]. Building on these studies, we propose a GNN-based dynamic multimodal data fusion method and employ explainability techniques to analyze the impact of multimodal data on cyberattack prediction, thereby enhancing the model’s predictive accuracy and decision-making transparency.

3.5. Motivation and Methods

In light of the above research findings, this study introduces a new approach to enhance both the predictive capability and interpretability of inter-state cyberattacks. Our approach builds upon insights from these four primary research areas. Specifically, quantitative research in international relations has identified a series of factors influencing inter-state cyberattacks, such as economic connections, political relations, and military activities. However, these studies often focus on statistical analysis rather than predictive modeling, missing an opportunity to directly utilize these indicators to forecast prediction. On the contrary, in the field of computer science, efforts to predict state-level cyberattacks using digital media data, such as news reports or social media, are often limited by relying on a single data source, which may fall short in predictive power. Therefore, we attempt to bridge this gap by constructing a multimodal dataset specifically designed for inter-state cyberattack prediction, where each data modality is represented as a dynamic interaction network between nations. Consequently, the inherent graph structure of these network relations (where nations serve as nodes and interactive events serve as edges) naturally aligns with the functionality of GNNs.
Following this line of thinking, we want to integrate advanced GNN techniques into a multimodal data fusion framework. However, existing methods remain suboptimal for inter-state cyberattack prediction due to several limitations. Classical GNNs (e.g., GCN and GAT) excel at learning node representations in static graphs, which is incompatible with the dynamic nature of inter-state relations. While dynamic GNNs can capture temporal patterns, they treat all interactions as homogeneous, ignoring the distinct semantics of multimodal data. In contrast, multi-view GNNs can effectively handle different types of node interactions but typically treat them as static entities, rendering them unsuitable for time-sensitive prediction tasks. These limitations hinder their applicability in cyberattack prediction, where both dynamic and multimodal characteristics are crucial. To address these challenges, we propose a novel architecture that combines temporal interaction attention (to learn time-aware dependencies within and across views) and multi-view attention (to adaptively weight the importance of each modality). This design enables our model to process dynamic multi-view graphs, that is, to capture complex and time-varying dependencies across modalities, and to achieve feature fusion, thereby improving the predictive capability of inter-state cyberattacks.
Furthermore, by incorporating interpretability techniques, we hope to validate and extend insights derived from quantitative research. Through explainable boosting machine and attention-based weight analysis, our approach not only verifies the importance of previously identified factors but also uncovers new patterns in inter-state cyberattacks. This deeper and more subtle understanding of cyberattack behaviors at the national level can strengthen the theoretical foundation of our method while providing valuable insights for policymakers.

4. Dataset Creation

In order to thoroughly describe the multifaceted factors influencing inter-state cyberattacks, we construct a dataset that considers data from multiple aspects, including the technical characteristics of cyberattacks, geopolitical context, trade exchanges, and national attributes. This section will elaborate on each data sources and their selection rationale. Table 1 provides statistical information for each data.
Cyber attack data is central to the prediction, as it directly records historical cyberattack incidents among countries. Previous studies have shown that past attack patterns are important indicators for predicting future attacks [8,9]. In this study, we use the DAM (Digital Attack Map) dataset [57], which collects DDoS attacks occurring between pairs of countries. We use this dataset to construct 366 temporal snapshot graphs, with an average of 220 nodes and 1681 edges per graph. Nodes represent different countries, while edges represent attack incidents between two countries, with attributes including attack type, attack duration, and maximum traffic flow.
News event data provides rich contextual information, reflecting geopolitical relations between countries. Some studies have indicated that geopolitical events and changes in international relations often serve as precursors or triggers for cyberattacks [24,58]. This study use the ICEWS (Integrated Crisis Early Warning System) dataset [59], which collects news events occurring globally that often signal potential conflict or cooperation. We use this dataset to construct 360 temporal snapshot graphs, with an average of 179 nodes and 495 edges per graph. Edges indicate the daily interaction between two countries. And their attributes consist of CAMEO (Conflict and Mediation Event Observations) codes corresponding to a specific type of events or behaviors, as well as intensity scores reflecting the degree of hostility or cooperation of the events.
Armed conflict data mirrors tensions and violent conflicts between countries. Past history has shown that in today’s information age, cyberattacks are often integrated with other conventional military forces [60,61]. We chose the UCDP (Uppsala Conflict Data Program) dataset [62], which provides statistical data on global violence and war events since 1946. Similarly, we construct 366 temporal snapshot graphs, with an average of 66 nodes and 201 edges per graph. Edges mean armed conflict between two countries, with attributes including type of conflict and number of fatalities.
International trade data presents the economic connections and cooperation between countries, which may influence the motivations and target selection for cyberattacks [23,63]. In this study, we utilize the Gravity [64] dataset, a widely used international trade database develop by the French research institution CEPII. Different from the previous datasets, this dataset collects annual trade data of countries and regions worldwide. So we only construct a graph on a one-year scale, including 210 nodes and 29,488 edges. Edges denote trade relationships between two countries, with attributes including product categories and export/import amounts.
National attribute data provides multidimensional national characteristics that help assess a country’s tendency and ability to launch or defend against cyberattacks. Research suggests that factors such as regime type, technological level, and military strength, directly influence a country’s behavior in cyberspace [5,6,21]. As a result, we use data from theGlobalEconomy [65], which offers over 500 indicators for more than 200 countries and regions from 1960 to the present. Referring to previous studies [4,5,6,21,66,67], we select a broad range of 54 indicators to describe national attribute characteristics in the fields of economic, military, political, technological, etc. Furthermore, we calculate the degree of similarity between each pair of countries, and obtain an annual scale graph with 222 nodes and 49,062 edges, where each edge represents the similarity of attributes between two countries.
Based on the above data, we create a multimodal dataset for predicting inter-state cyberattacks. First, our experiments consider cyberattack events over 366 days from 1 January to 31 December 2020. Specifically, we employ a sliding window algorithm with a window size of 1 week (7 days) and a shift interval of 1 day. For each window, we generate a static graph for each day. We then use 7 consecutive graphs to predict the likelihood of an attack occurring between any pair of countries in the next day. That is, each dynamic graph used in the experiments contains a sequence of 8 static graphs. As we predict, for each graph, regardless of whether there will be one attack or multiple attacks in the next day, we treat the problem as a binary classification task. Then, in the same way, we construct graph structure for the other 4 modal data as background information to jointly participate in the prediction of inter-state cyberattacks. It should be noted that since the international trade data and national similarity data only have one annual scale graph, we duplicate them seven times to construct a graph sequence for subsequent unified modeling. Finally, after removing graph sequences with too few nodes or edges in their static graphs, we construct a total of 327 dynamic graphs for our experiments.

5. Methodology

The architecture of the proposed method is shown in Figure 1, which mainly includes two parts. (1) Multimodal data fusion model. This model adopts the dynamic graph neural networks and utilizes attention mechanism to fuse features extracted from different data to predict whether a cyberattack will occur between two countries in the next time step. (2) Interpretable framework. This section explores the complex relationships between input data and output results from both ante-hoc (using explainable boosting machine) and post-hoc (using attention weights analysis) perspectives, quantifying the impact of different features and data sources on cyberattacks.

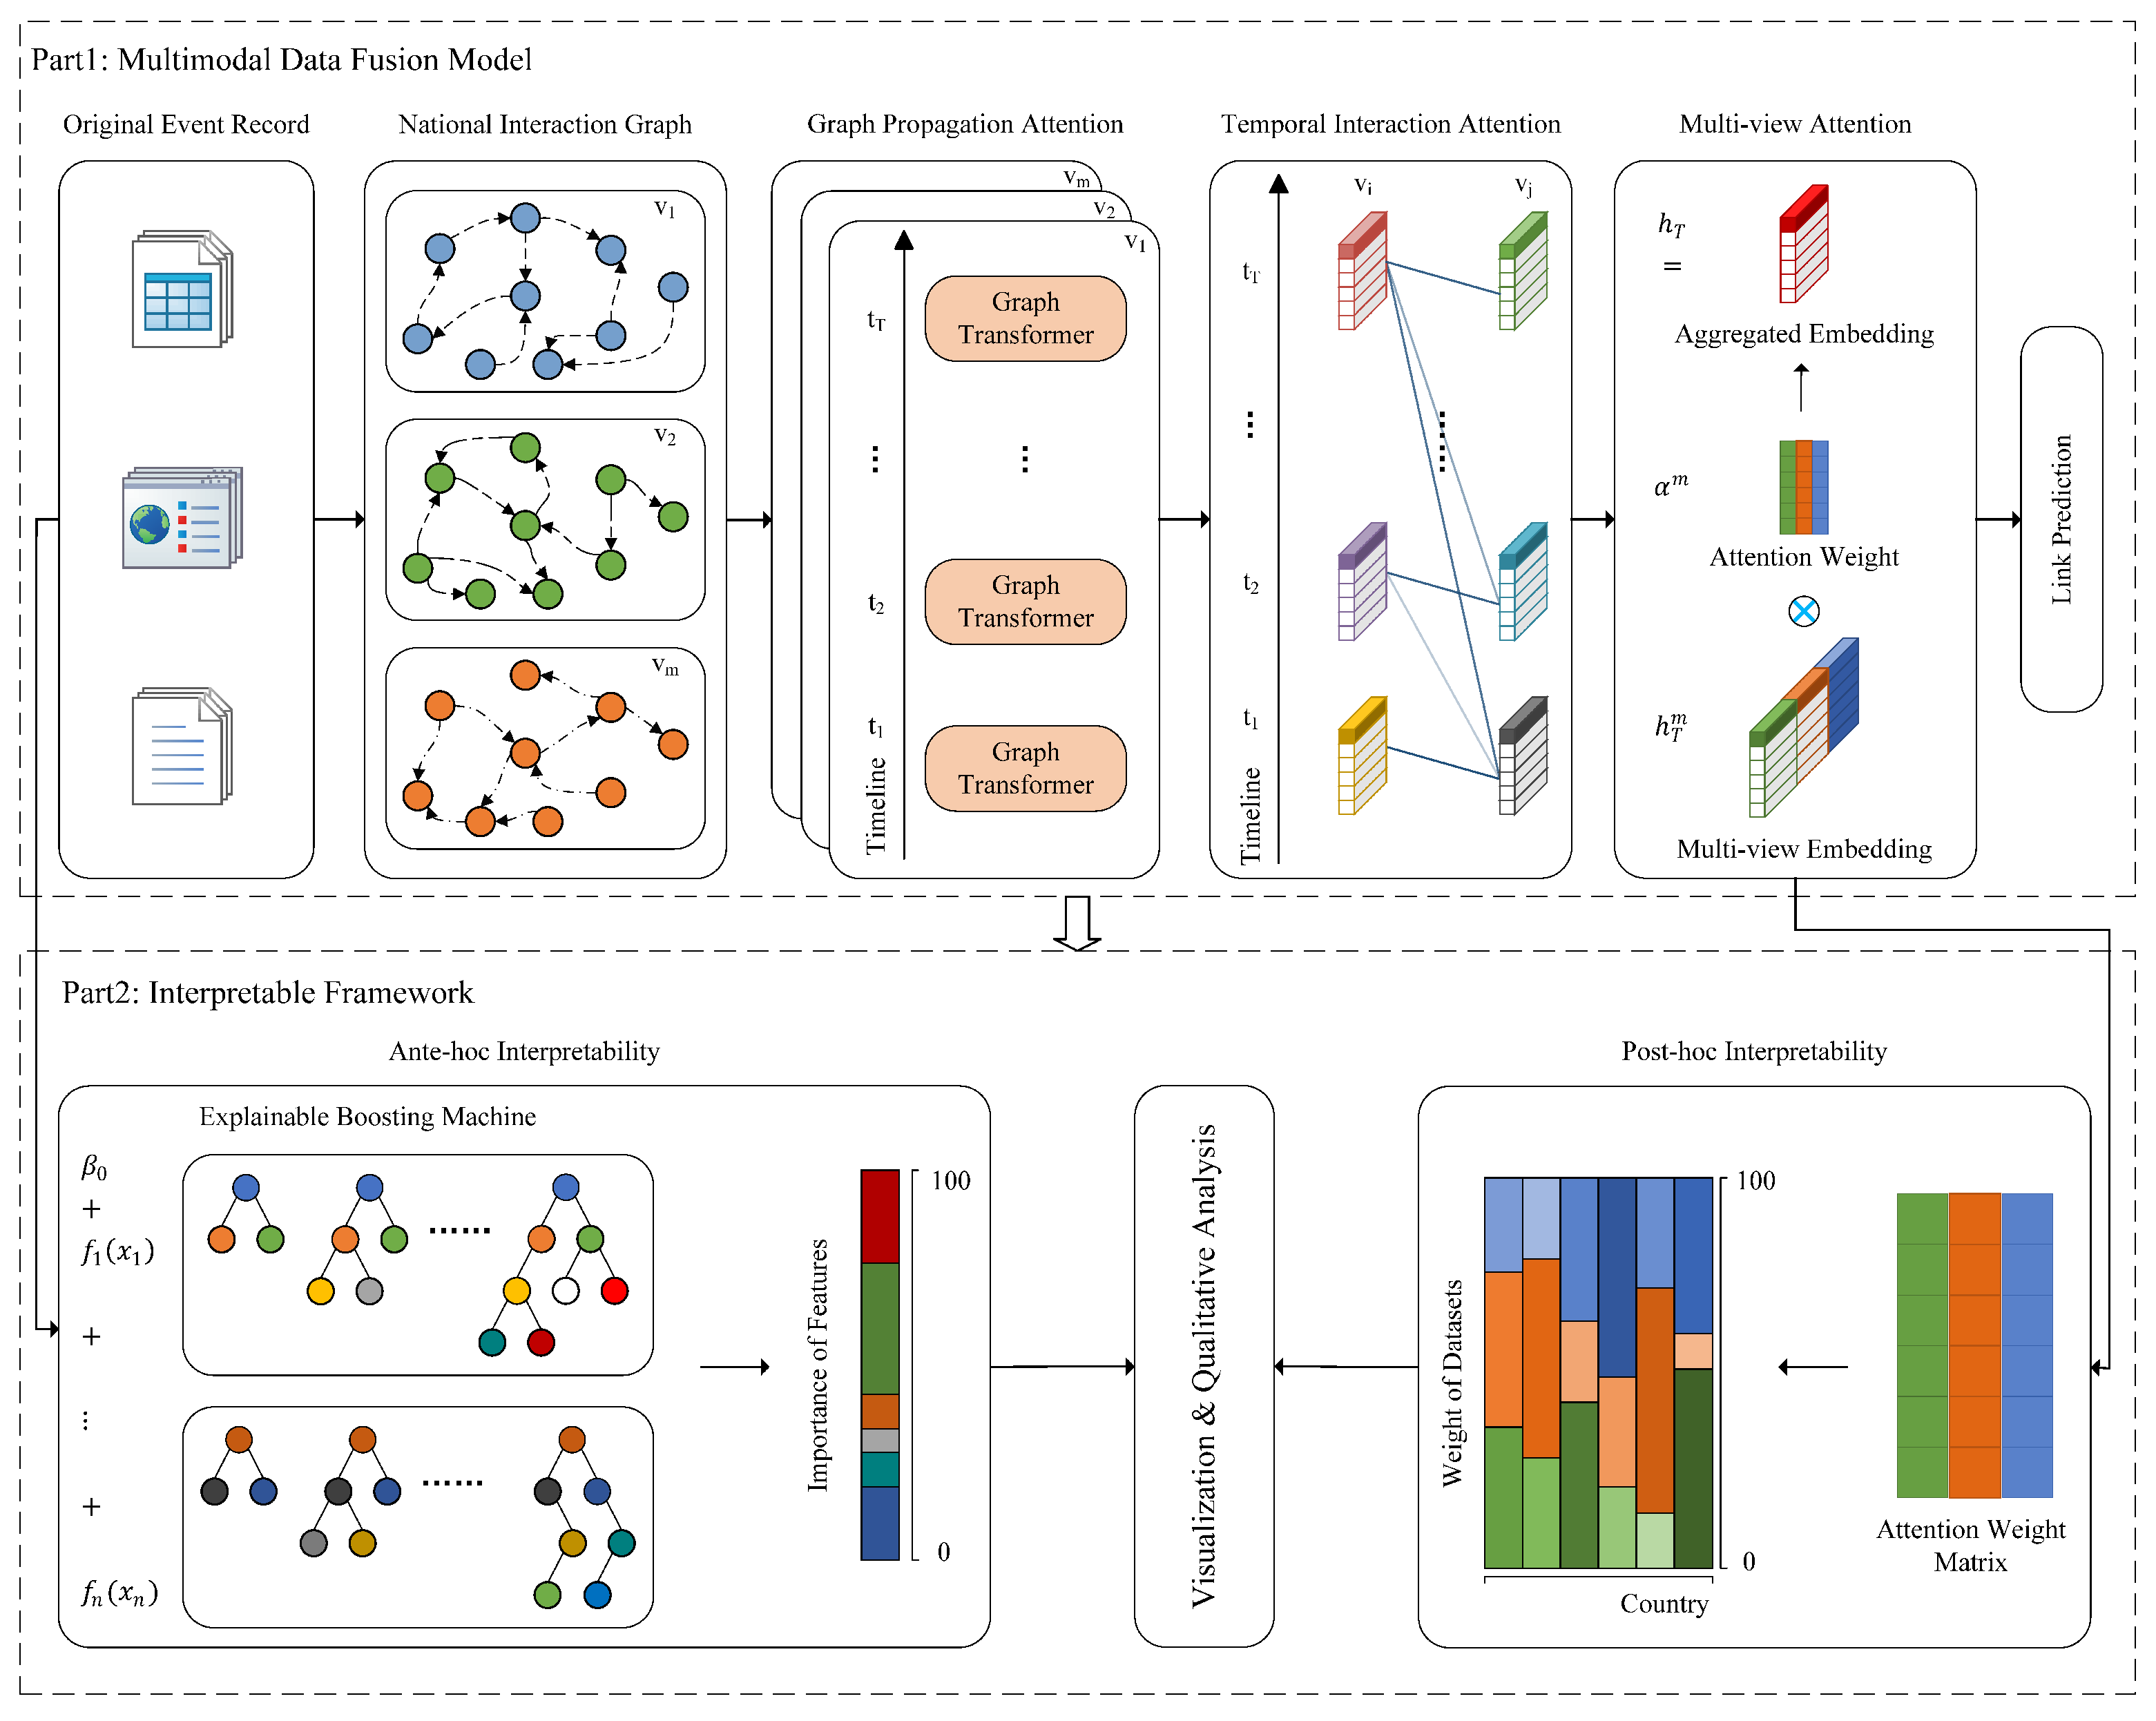
5.1. Multimodal Data Fusion Model

The main task of dynamic multi-view graph neural networks is to simultaneously capture heterogeneous information and temporal evolution patterns on multiple dynamic graphs. To this end, we propose a novel network architecture, as shown in part 1 of Figure 1. Firstly, a graph propagation attention module is used to encode each snapshot of each view, combining graph structure, node features, and edge features at the same time. Next, a temporal interaction attention module is used to learn temporal evolution patterns, which exploits complementary information from different views. Finally, we use multi-view attention module to fuse features from multiple views and obtain the final node representations for downstream link prediction tasks.

5.1.1. Problem Definition

In a dynamic multi-view graph, each node u U and each edge e E are associated with a view v V and a timestamp t T . Thereby, we formally represent the dynamic multi-view graph as G = { G v , t } v = 1 , t = 1 | V | , | T | = ( U , E ) . Given a view v, G v = { G v , t } t = 1 | T | = ( U v , E v ) is a dynamic graph which can be represented as a series of graph snapshot sequences. Here, each snapshot is a static graph G v , t = { G v , t } = ( U v , t , E v , t ) , with a node set U v , t and its attribute information X u v , t R | U | × f u , as well as a edge set E v , t and its attribute information X e v , t R | E | × f e at view v and time t. Our goal is to predict whether there exists a connecting edge e between each pair of nodes in the graph at the next time step t + 1 , based on the dynamic multi-view graph up to the previous t time steps.

5.1.2. Graph Propagation Attention

Taking into account the structural features, node features, and edge features of each snapshot in each view, the graph propagation attention introduces the multi-head attention mechanism into graph learning, which is called graph transformer [68,69,70]. Specifically, for view v and time step t, given node features X u v , t = { x u 0 v , t , x u 1 v , t , , x u i v , t , } , the attention mechanism calculates the correlation of each node pair ( x u i v , t , x u j v , t ) . And in order to incorporate the edge information that connects these nodes, the edge feature x e i j v , t is encoded and added to the key and value vectors, as shown in Equation (2). Finally, after obtaining the multi-head attention, the information from node j to node i is aggregated to obtain the new representation h i v , t for node i, as shown in Equation (3).
q c , i v , t = W c , q v , t x u i v , t , k ^ c , j v , t = W c , k v , t x u j v , t v ^ c , j v , t = W c , v v , t x u j v , t , e c , i j v , t = W c , e v , t x e i j v , t
k c , j v , t = k ^ c , j v , t + e c , i j v , t , v c , j v , t = v ^ c , j v , t + e c , i j v , t
h i v , t = W i v , t c = 1 C s o f t m a x ( q c , i v , t T k c , j v , t ) v c , j v , t
where, q, k and v represent the query, key, and value vectors in the attention mechanism, W denotes the learnable parameters, c = 1 to C represents the number of attention heads, and ‖ denotes the concatenation operation.

5.1.3. Temporal Interaction Attention

Temporal evolution patterns exhibit the emergence and disappearance of nodes and edges over time. While the graph propagation attention can effectively capture the heterogeneity of static snapshots, it can not model patterns that evolve over time. Recently, temporal self-attention has significantly enhanced the performance to dynamic graph embedding methods. Inspired by Sankar et al. [39] and Wei et al. [71], we extend the existing temporal self-attention models by introducing a cross-attention mechanism and design a temporal interaction attention module. It is used to capture deeper evolutionary patterns across different views and temporal snapshots, enabling simultaneous modeling of both inter-modal and intra-modal relationships. The input comprises node features H v f = { h v f , t 1 , h v f , t 2 , . . . , h v f , t i , . . . } from view v f and node features H v g = { h v g , t 1 , h v g , t 2 , . . . , h v g , t i , . . . } from another view v g . The output is a new node representation H ^ v f = { h ^ v f , t 1 , h ^ v f , t 2 , . . . , h ^ v f , t i , . . . } that fuses the historical information from both its own view v f and another view v g , as shown in Equation (4).
h ^ v f , t i = W 1 v f , t i c = 1 C s o f t m a x ( q c v f , t i T k c v f , t j + M i j ) v c v f , t j + W 2 v f , t i c = 1 C s o f t m a x ( q c v f , t i T k c v g , t j + M i j ) v c v g , t j
In fact, the first part of Equation (4) can be understood as self-attention mechanism, used to capture the temporal changes of the dynamic view v f over time steps. The query q v f , key k v f , and value v v f are all derived from the input node h v f multiplied by the linear projection matrices W q v f , W k v f , W v v f , respectively, as shown in Equation (5). The latter part of Equation (4) can be understood as cross-attention mechanism, used to capture the historical influence of another dynamic view v g on that dynamic view v f . The query remains q v f , while the key k v g and value v v g are derived from the input node h v g multiplied by the linear projection matrices W k v g , W v v g , respectively, as shown in Equation (6).
q c v f , t i = W c , q v f , t i h v f , t i , k c v f , t j = W c , k v f , t j h v f , t j v c v f , t j = W c , v v f , t j h v f , t j
k c v g , t j = W c , k v g , t j h v g , t j , v c v g , t j = W c , v v g , t j h v g , t j
where, q, k and v represent the query, key, and value vectors in the attention mechanism, W represents the learnable parameters, c = 1 to C denotes the number of attention heads, and ‖ denotes concatenation operation. Additionally, to prevent leakage of future information, we use a mask matrix M R T × T . When M i j = , it means that the attention from time i to time j is turned off, corresponding to zero elements in the softmax attention weight matrix, as shown in Equation (7).
M i j = 0 , i j , otherwise

5.1.4. Multi-View Attention

After the temporal interaction attention, we obtain the node representations for all dynamic views at the time step t, denotes as H ^ t = { h ^ v 1 , t , h ^ v 2 , t , . . . , h ^ v i , t , . . . } , which has already incorporated historical information from the previous t time steps. However, not all representations contribute equally to predicting labels. Therefore, we introduce an attention mechanism to adaptively assign different importance weights to node representations from different views, and aggregate the node representations of all views together to form a fully data-driven fused node representation [72]. Specifically, each view’s node representation h ^ v i , t is transformed into corresponding hidden representation z v i , t through a single-layer MLP (Multi-Layer Perceptron), as shown in Equation (8). Then, the importance of each view’s node representation is measured by the similarity between z v i , t and an introduced context query vector U v i . And the attention weight α v i is calculated using the softmax function, as shown in Equation (9). Finally, the fused node representation z t is computed as the weighted sum of H ^ t , as shown in Equation (10).
z v i , t = tanh W v i h ^ v i , t + b v i
α v i , t = exp U v i T z v i , t i = 1 V exp U v i T z v i , t
z t = i = 1 V α v i , t z v i , t
where, W and U represent learnable parameters.

5.1.5. Structure Evolutionary Loss for Link Prediction

Finally, in order to enable the learned representation to capture structural evolution, we define an objective function for link prediction, as shown in Equation (11). This function uses binary cross-entropy loss at time step t to ensure that node i and its nearby nodes j have similar embedding features. Intuitively, this function brings similar nodes closer in the latent space while pushing dissimilar nodes apart.
L z i t = log σ < z i t · z j t > q n · E j P n ( i ) log σ < z i t · z j t >
where, σ is an activation function (e.g., sigmoid function), and < · > represents the inner product operation. Node j is a first-order neighbor of node i, which can be relaxed to nodes j co-occurring with node i in a fixed-length random walk. Node j is a negative sampling node, which is disconnected from i, and obtained according to the negative sampling distribution P n . q n is an adjustable hyperparameter used to balance positive and negative samples.

5.2. Interpretable Framework

As is well known, deep learning models are black-box models that can accurately predict future results based on input data, but do not elucidate the decision-making mechanism. In fact, the deep semantic differences in multimodal data contribute differently to the uncertainty of the results. To this end, we design an interpretable framework that includes two modules: ante-hoc and post-hoc interpretability, as shown in part 2 of Figure 1. The former calculates the contribution of different features using explainable boosting machine before prediction, and the latter extracts attention weights from multi-view attention module to further analyze the importance of various data sources after the prediction.

5.2.1. Ante-Hoc Interpretability

Explainable boosting machine (EBM) is a generalized additive model (GAM) that can quantitatively analyze the impact of input features on the results. Compared to traditional GAM, EBM provides several important improvements by employing bagging, gradient boosting and a set of shallow regression trees. The model uses a very low learning rate and an iterative cyclic gradient boosting algorithm to learn each feature function f i , rendering the order of features non-essential. To mitigate the impact of collinearity, EBM iteratively traverses the attributes to identify the most influential attribute function f i for each attribute. Subsequently, it incorporates the information from each attribute into the prediction process. Finally, EBM can automatically detect pairwise interaction terms, further improving accuracy while maintaining interpretability, as shown in Equation (12) [73,74,75].
g ( E [ y ] ) = β 0 + f i x i + f i , j x i , x j
where g ( · ) is the link function, β 0 is the intercept term, x is the attribute, and f is the feature function.

5.2.2. Post-Hoc Interpretability

Section 5.1.4 proposes a learnable attention module for fusing node representations from multiple views into one representation. By extracting the weights (i.e., α in Equation (9)) from this module, we visualize the weights of each node. This allows for an intuitive analysis of the different contributions of each data source to the representation of each node, thereby revealing the personalized prediction logic for specific nodes (i.e., countries), and enhancing the credibility of the decisions.

6. Results

6.1. System Design and Implementation

This section provides an overview of the overall framework design and experimental setup. The framework consists of two modules: the multimodal data fusion module and the explainability module. By integrating these two components, we achieve effective prediction of inter-state cyberattacks while providing interpretable result analysis.
The multimodal data fusion module serves as the core of the framework, aiming to integrate information from multiple data sources to enhance the model’s predictive capability for cyberattacks. Specifically, this module includes the following key steps.
  • Data preprocessing and integration. Using a time-window approach, we perform temporal processing on cyber attack data, news event data, armed conflict data, international trade data, and national attribute data, to ensure temporal alignment of different modalities along the time axis (Section 4).
  • Multimodal data fusion modeling. We use graph neural networks and attention mechanisms to achieve multimodal data fusion (Section 5.1). First, a static graph neural network is utilized to capture the structural relationships among nodes within each data modality. Then, temporal interaction attention and multi-view attention mechanisms are applied to adaptively weight and integrate information across different modalities.
  • Model training and evaluation. We design comparative experiments to validate the effectiveness of the proposed model (Section 6.2). Specifically, the dataset is divided into training, validation and test sets in a chronological order with a ratio of 7:2:1 to ensure effective generalization of the model on future data. The model adopts a single-layer architecture with 16 attention heads and a hidden layer dimension of 256. We use AdamW as the optimizer, set the learning rate to 0.005 and the dropout rate to 0.5, along with an early stopping strategy to prevent overfitting. We use precision, recall, F1-score, and accuracy to evaluate the prediction effect of the model. All experiments are conducted on an NVIDIA RTX 3090 GPU and implemented using PyTorch 2.5.1.
To interpret the prediction results and model behavior, the framework incorporates an explainability module, which provides model interpretability through two complementary approaches (Section 5.2).
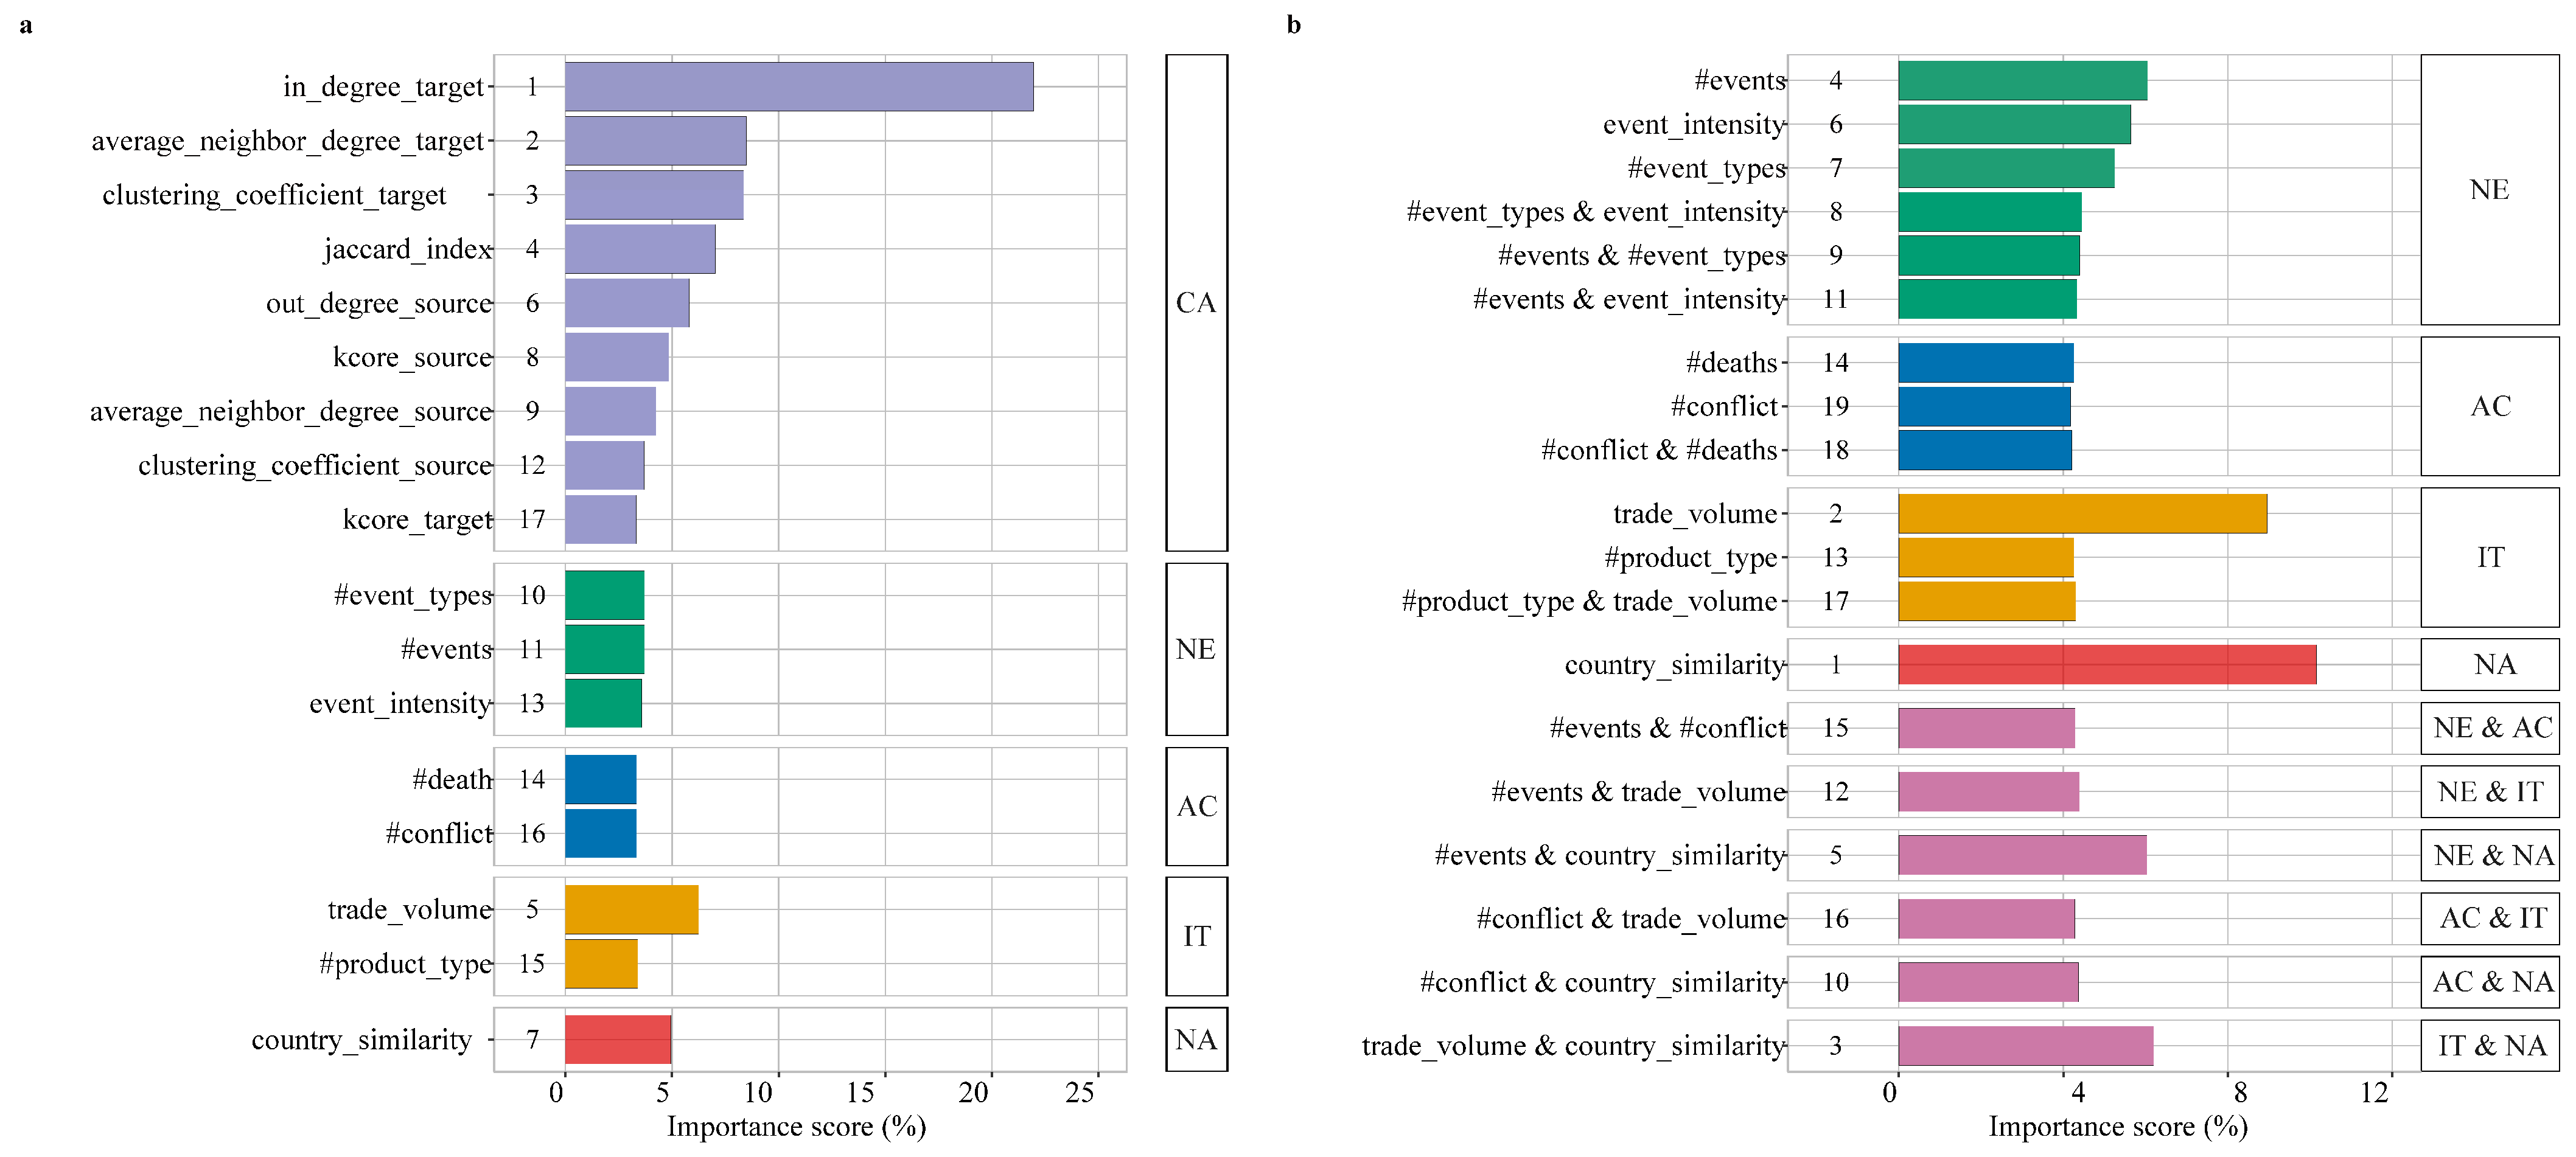
  • Ante-hoc interpretability analysis. We employ the EBM to analyze input data and quantify the contribution of each feature as well as pairwise interaction terms to the model’s predictions (Section 6.3.1).
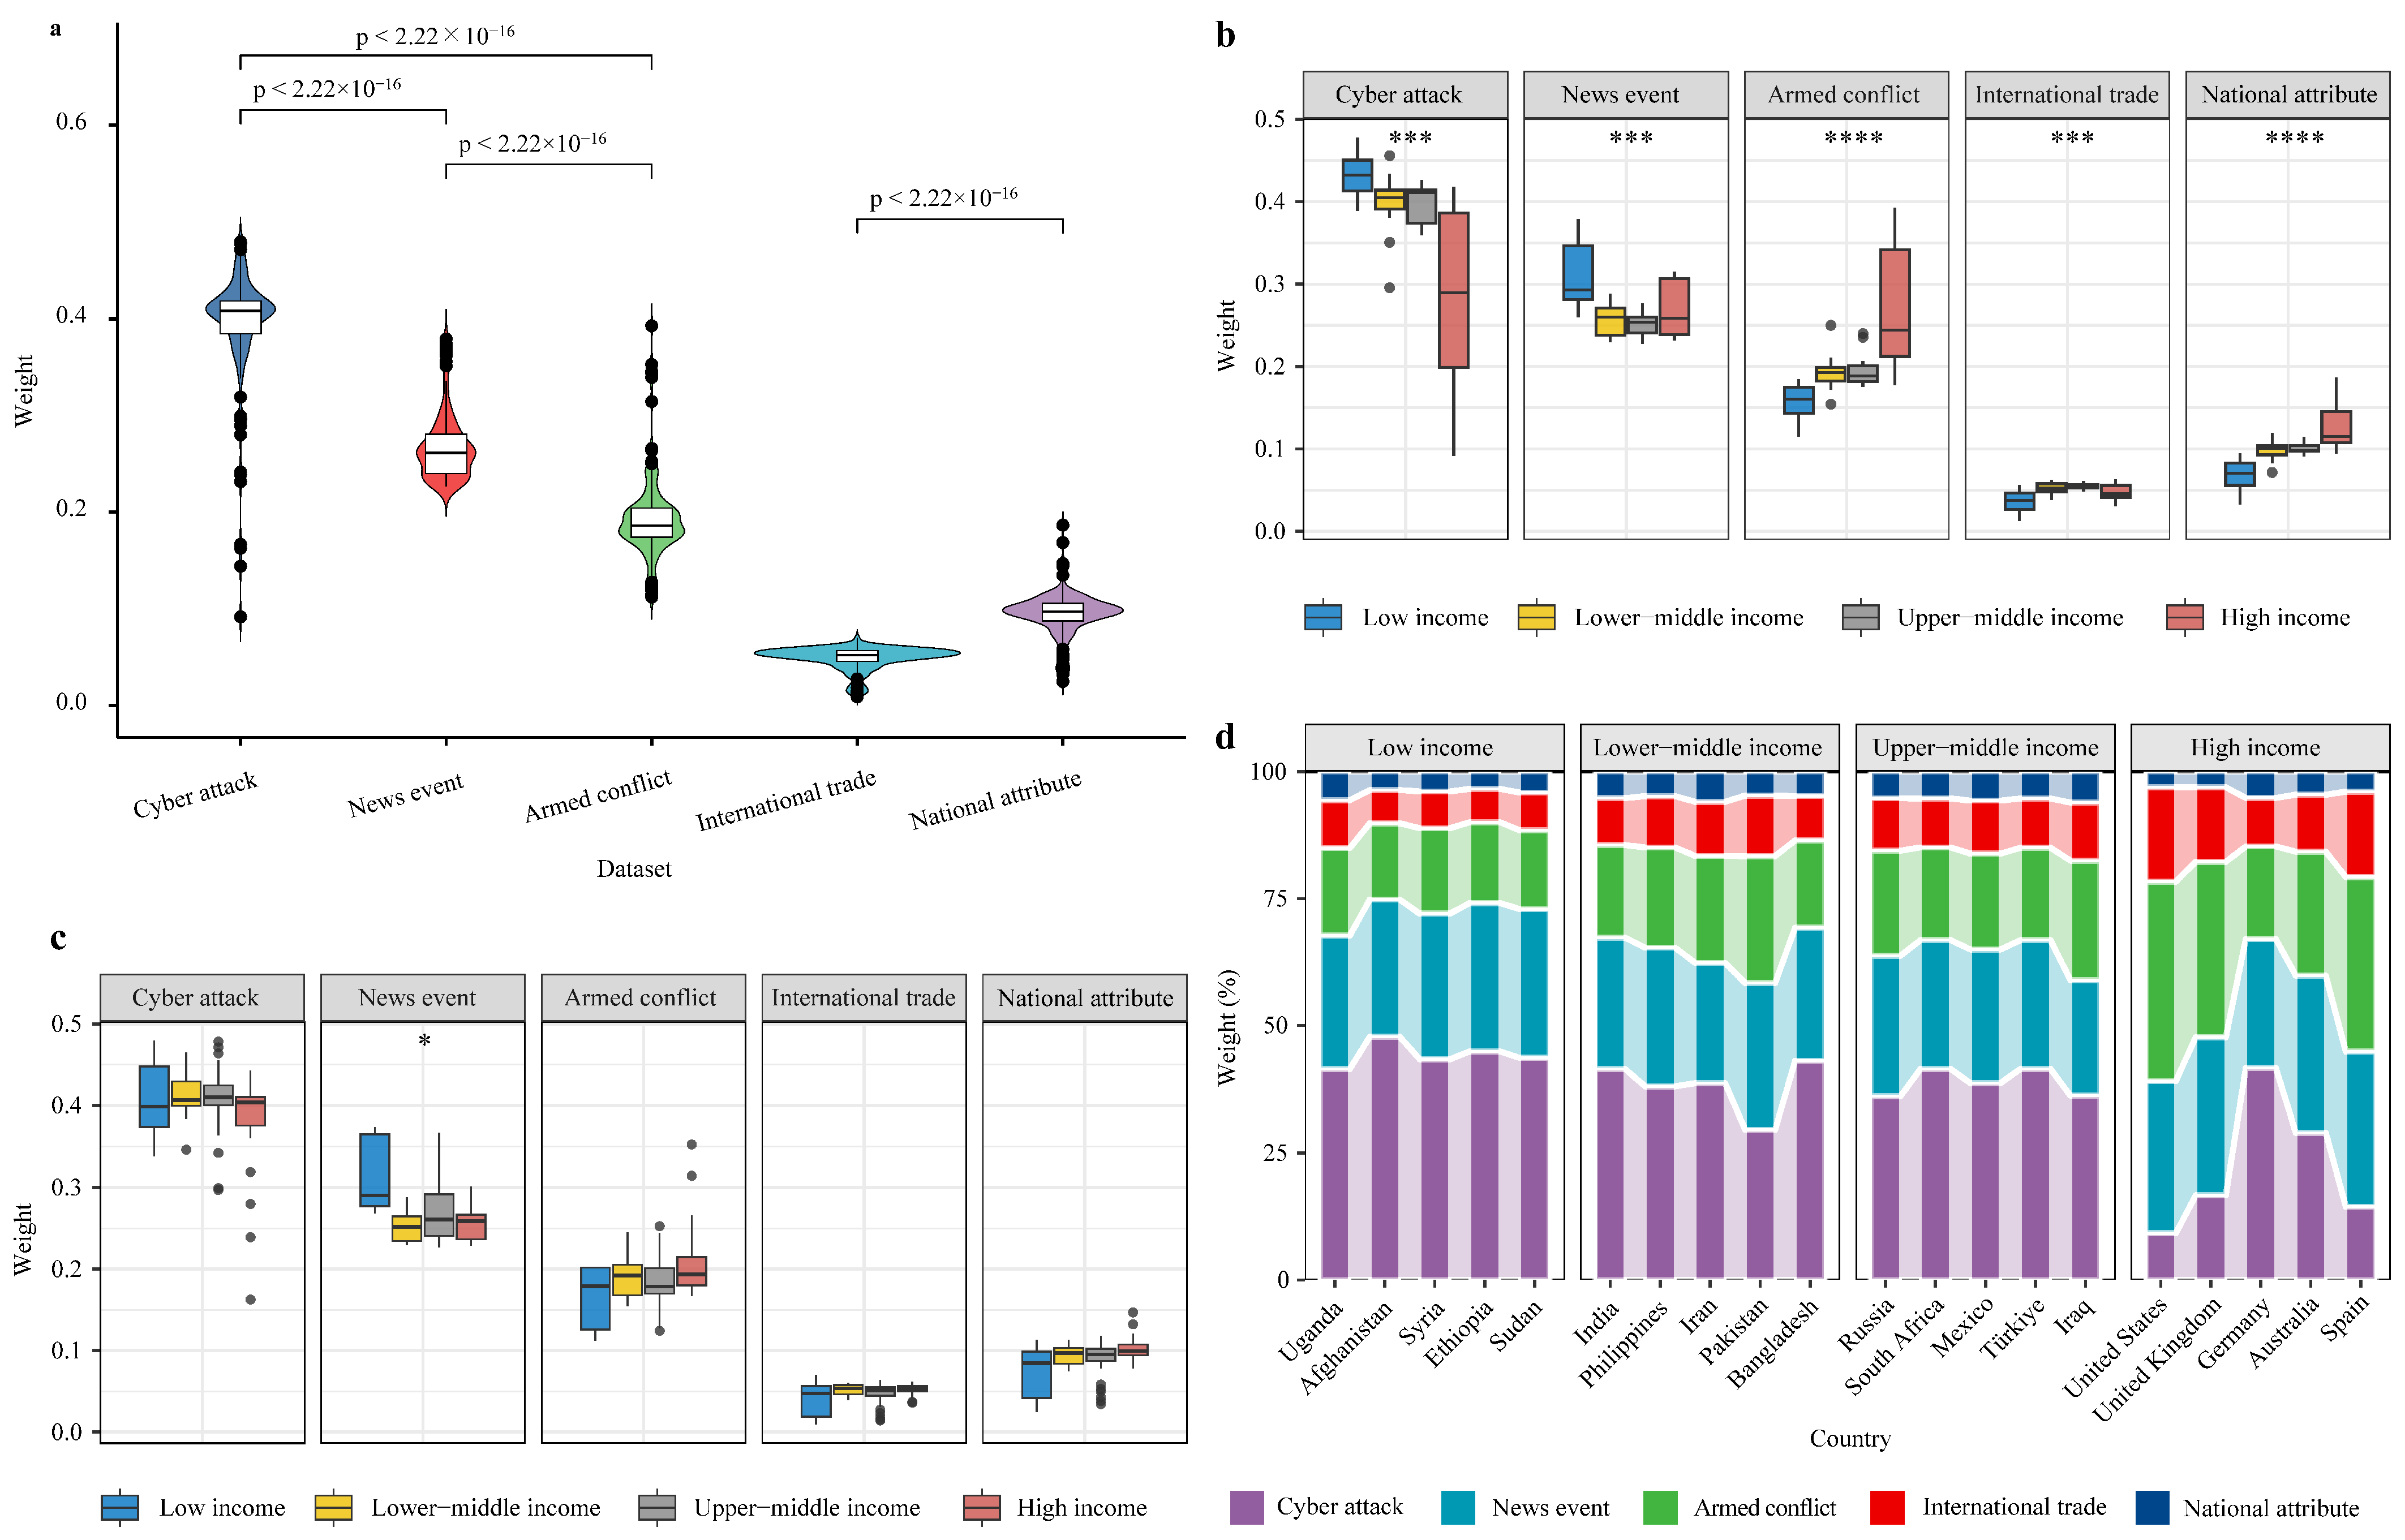
  • Post-hoc interpretability Analysis. We extract the attention weights from the multi-view attention module. This allows us to visually represent the proportion of attention allocated to each data modality when making predictions for a given country (Section 6.3.2).

6.2. Validation of the Proposed Model

6.2.1. Comparison of Benchmark Experimental Results

To evaluate the performance of our proposed model in the task of predicting inter-state cyberattacks, we conduct comparative experiments with various classic and emerging models on our dataset. Table 2 presents the average performance and standard deviation of each model over 10 rounds.
For a start, traditional machine learning models, including logistic regression (LR) [76] and gradient boosting decision tree (GBDT) [77], perform well in precision, with 0.878 and 0.880 respectively. However, due to the deficiency in mining the graph structure information of the data, they fail to fully capture the complex characteristics of each network, resulting in relatively lower recall, F1 score, and accuracy.
The next, random walk-based graph embedding models, including node2vec [78] and struc2vec [79], perform poorly in the prediction task, as they can only learn the topological structure of graphs. The performance of struc2vec is particularly unsatisfactory with an F1 score of 0.750. While node2vec shows some improvement, reaching an F1 score of 0.771, it still could not compete with graph neural network models.
After that, static graph neural networks, including GCN [36], GraphSAGE [36], GPS [80], EGC [81], GATv2 [82] show some advantages in capturing graph structure information. Among them, GCN shows the poorest prediction performance with an F1 score of only 0.768. GATv2 achieves the highest F1 score of 0.829, but the balance between its precision (0.779) and recall (0.887) is relatively poor. As a result, due to the neglect of temporal dynamics, they also suffer from insufficient performance.
In contrast, dynamic graph neural networks, including STGCN [17], DySAT [39], DNNTSP [83], A3T-GCN [84], MPNN+LSTM [85], which can capture the dynamic evolution of graph structures, achieve better performance. These models generally outperform static models, particularly excelling in recall and F1 scores. For example, the F1 scores of DNNTSP and MPNN+LSTM are 0.828 and 0.822 respectively, with better balance among precision, recall, and F1.
Finally, the model we propose for multimodal data fusion, through designing an innovative temporal interaction attention module, can fully explore the intrinsic correlations among different data and capture the temporal characteristics. Compared to other baseline models, our method excels in all evaluation metrics, especially achieving the best performance in the comprehensive indicators of F1 score and accuracy, with 0.838 ± 0.006 and 0.835 ± 0.005 respectively. Moreover, it shows balanced precision (0.821 ± 0.008) and recall (0.856 ± 0.017) with the low standard deviation, indicating stable performance that overall surpasses both static and dynamic graph neural network models.

6.2.2. Benefits of Multimodal Data Fusion

In this section, we design several ablation experiments to emphasize the critical role of multimodal data fusion in improving the performance and stability of inter-state cyberattack prediction. That is, by removing data modalities other than cyberattack data, we observe the changes in model performance. Table 3 lists the specific performance of the model in terms of precision, recall, F1 score, and accuracy under different data combinations.
When only a single cyberattack data is used, the model achieves high recall (0.871) but relatively low precision (0.780), indicating that while the model effectively captures true positives, it lacks sufficient contextual information for precise predictions. By contrast, when additional data modalities such as news event, armed conflict, international trade, and national attribute, are incorporated individually, the model’s performance improve to varying degrees. This indicates that these heterogeneous data provides more contextual information for capturing the multifaceted factors influencing cyberattacks, thereby enhancing overall prediction performance. When all modalities are combined, the model achieves the best overall performance (F1 = 0.838 ± 0.006, accuracy = 0.835 ± 0.005) with the lowest standard deviation, demonstrating superior stability and robustness.
Here, we need to emphasize that although the improvement of model performance by adding a single type of data might appear similar (e.g., F1 is 0.836 after adding news event data, and F1 is 0.834 after adding armed conflict data), this does not diminish the value of multimodal data fusion. This is because each type of data has a unique ability to provide contextual information. For example, news event data introduces background signals related to international geopolitics, while international trade data plays a role in the economic dimension. In fact, each data modality provides different insights for prediction, which we will discuss in detail in Section 6.3 and Section 7.1.

6.3. Interpretability of the Proposed Model

6.3.1. Feature Importance Analysis

We use EBM to quantify the contribution of each feature to cyberattack prediction. The results are shown in Figure 2.
As shown in Figure 2a, features from the cyberattack dataset have the highest importance score, totaling 67.74%. Specifically, the in degree of target nodes contributes the most to the model’s prediction, with an importance score as high as 21.96%. Other crucial features include the average neighbor degree of target nodes, the graph clustering coefficient of target nodes, etc. These features are all related to the structure of the cyberattack network, indicating that graph structure (i.e., network topology) characteristics are key factors in cyberattack prediction. Secondly, the news events dataset ranks second with a total contribution of 11.01%. The main features include the number of event types, the total number of events, and the intensity of each event. These features provide a macro geopolitical context that helps capture the dynamics of national interactions, which are essential external drivers that influence cyberattacks. Lastly, the total contribution of the armed conflict dataset, the international trade dataset, and the national characteristics dataset are 6.68%, 9.63%, and 4.95%, respectively. Concretely, the death toll and the number of conflicts in the armed conflict dataset reveal the severity and frequency of conflicts between countries. The trade volume and the number of product types in the trade dataset provide a perspective on economic activities, which to some extent reflects the economic dependence and interaction between countries. The national attribute dataset presents the comprehensive characteristics of a country in politics, economy, military, etc., reflecting the overall similarity between each pair of countries. These features offer diverse information for the model’s prediction and contribute to the prediction of cyberattacks to varying degrees.
Furthermore, building upon the aforementioned feature analysis, we introduce pairwise feature interaction analysis to explore the interdependencies among features and their impact on predictive performance, as shown in Figure 2b. To this end, we compare the model’s performance with and without interaction terms. The experimental results indicate that, on the complete dataset, incorporating feature interactions improves the model’s R 2 from 0.811 to 0.825, demonstrating that feature interactions can enhance predictive capability. Additionally, when cyberattack graph features are removed, we observe an increase in R 2 from 0.201 to 0.336, suggesting that in the absence of structured cyberattack information, feature interactions can partially compensate for missing information. This result validates the synergistic effect between features, that is, the pairwise interactions play a crucial role in capturing complex relationships that may be overlooked when considering individual features in isolation. For instance, the feature interaction term (event counts & country similarity) exhibits a high contribution rate (6.68%), indicating that the similarity of country attributes may influence patterns of inter-state interactions, while the number of news events reflects the intensity of bilateral relations. The combination of these two factors enables a more effective differentiation between cooperative and conflictual dynamics, thereby enhancing the predictive capability of the model. As a result, by considering both individual features and their interactions, we are able to provide a more nuanced explanation for inter-state cyberattack prediction.

6.3.2. Attention Weight Analysis

The multi-view attention module can adaptively assign the importance weights of each dataset for each countries. In this section, we extract weights from this module, and present and analyze them from multiple dimensions.
Figure 3a shows that there are significant differences in the distribution of attention weights for various countries on the five different datasets, which emphasizes the unique contribution of each data modality to the model’s prediction. Among them, cyberattack data has the highest weight, indicating that historical cyberattack records holds the most important position in prediction. This is followed by news event data and armed conflict data. International trade data and national attribute data have relatively lower weights.
Furthermore, we conduct an analysis based on income levels, illustrated in Figure 3b and Figure 3c, which show the distribution of attention weights for countries with and without armed conflicts, respectively. A clear trend can be observed: in areas with conflict, the weights of cyberattack data decrease as income levels rise; conversely, for armed conflict data, the weights increase with higher income levels. In contrast, non-conflict regions do not exhibit a similar pattern, i.e., the weight distribution of each data modality in each income group show no significant differences. This result indicates that in a stable national environment, income (economic) level has a minimal impact on the preference for different datasets in cyberattack prediction.
Immediately, we make an in-depth study of countries involved in conflicts, and provide the attention weights for the top 5 countries ranked by the number of cyberattacks on 5 datasets, as shown in Figure 3d. For high-income countries such as the United States, the United Kingdom, and Spain, the weight of armed conflict data is the highest, reaching around 0.35, which reflects that armed conflict is the primary drivering force affecting the prediction of cyberattacks in these countries. At the same time, news event data also has a relatively high weight, exceeding 0.30, underscoring the importance of bilateral relations in their cyberattack behavior. Notably, compared to countries at other income levels, the weight of international trade data in this area has increased significantly, reaching about 0.15. In contrast, the weight of cyber attack data is the lowest. The above results suggest that high-income countries focus more on macro-level geopolitical and economic contexts rather than on the cyber attack data itself when predicting cyberattacks. While the low-income and middle-income countries, such as Afghanistan, Syria, and Iran, have the highest weight of cyber attack data, and the vast majority are above 0.40. This indicates that the future cyberattack behaviors of these countries are largely influenced by their past cyberattack patterns.

7. Discussion

7.1. The Main Factors Affecting the Prediction of Cyberattacks

Through ante-hoc and post-hoc interpretability analysis, we reveal the complex factors that affect the prediction of cyberattacks among countries from the perspectives of features and datasets, and gain insights into the intrinsic connections and differences among these factors across different countries and regions. The two complement and corroborate each other, providing a multi-dimensional explanatory path for predicting cyberattacks. In general, the advantage of the interpretability of this method provides a basis for scientific prediction, and offers decision-making support for the formulation of targeted cyber defense strategies, such as monitoring network traffic, guiding public opinion, managing regional conflicts, and adjusting trade policies. This enables more precise measures to be taken to eliminate potential cyberattack threats and safeguard national network security.

7.1.1. Feature Diversity Is Momentous for Prediction

Figure 2 indicates that among all 17 features, the graph features from the cyber attack dataset play a pivotal role in prediction, particularly the in degree of target nodes, which accounts for 21.96% of the importance. However, it is worth noting that the trade volume ranks 5th and country similarity ranks 7th, surpassing many graph topology features. This manifests that in addition to network structure information, macroeconomic and national characteristics also provide important information for model prediction, which illustrates the necessity and advantages of multimodal data fusion from a feature perspective. That is, while single cyberattack data contains valuable information, it still has certain limitations. Capturing features with different semantics from multiple viewpoints and levels can help to fully characterize the complex factors that affect cyberattacks between countries.
Interestingly, the analysis results of EBM also indirectly prove the effectiveness of graph deep learning in mining topological information and complex features from graph structures [86]. The EBM model learns through manually created features, including graph topology features provided by cyberattack data and attribute features provided by other data sources, rather than directly learning from the graph data. These features are crucial for cyberattack prediction, accounting for a total importance of 67.74%. Compared with EBM that combines handcrafted features, the graph deep learning paradigm, due to its end-to-end learning capabilities, can automatically learn node representations directly from original graph data without the need for manual feature engineering. As a result, it can better capture richer graph structural information and provide more valuable feature representations for predictive tasks [87]. This lays the foundation for us to introduce graph neural network models. Meanwhile, combined with the multimodal fusion method, we further enhance the representation ability and prediction performance.

7.1.2. Inter-State Cyberattacks Exhibit Distinct Spatial Differences

Figure 3 shows that different countries have different degrees of dependence on various modal data in cyberattack prediction. These differences are consistent with classical geopolitical theories of cyber conflict, reflecting the complexity of geopolitical landscapes, cultural traditions, and historical origins of each country or region [14]. That is, regional conflicts, strategic confrontations [60,88], religious and ideological differences [89,90], economic interests [91], etc., all influence and propel cyberattack behaviors in different areas.
In areas with frequent armed conflicts, most countries are low-income and middle-income, such as Afghanistan, Syria and Iran. Their cyberattack prediction are more influenced by their own cyberattack history. We speculate this is because these countries’ religious conflicts, territorial disputes, and other historical issues are intricate and complex, leading to political instability, which provides a breeding ground for cyberattack activities. In other words, due to political turmoil, there is already a quantity of cyberattacks in these countries. Therefore, when predicting cyberattacks, they tend to rely on historical cyberattack data rather than other data such as news events or armed conflicts. The essence lies in the fact that the use of cyber tools and the development of cyber capabilities can alter the balance of military power between countries, which prompts countries in the area to regard cyberspace as a new battlefield for gaining strategic advantages [92,93]. This is in line with the concept of asymmetric warfare in geopolitical theory, where weaker forces confront stronger ones through low-cost and high-efficiency means, with cyberattacks serving as a typical example of such tactics [94,95]. For instance, known cases of state-sponsored cyber operations collected by the Council on Foreign Relations suggest that the current cyber arms race is mainly a matter between Iran, Israel and the GCC (Gulf Cooperation Council) states [96].
By comparison, high-income countries, such as the United States and the United Kingdom, are more driven by macro-level geopolitics rather than micro-level historical cyberattacks in the prediction task. This can be seen from the higher weights of armed conflict data, news event data, and national trade data, as these data largely represent their geopolitical and economic tendencies [24]. This is consistent with the theories of cyber deterrence and offensive cyber strategy [97,98,99]. Actually, this is inseparable from the global military strategy and cyber hegemony that the above countries have long dominated [100]. They play important roles in international affairs, widely participate in global violent conflicts and geopolitical events [101,102,103], pursue open cyber deterrence policies, and tend to use cyber means to strike against perceived potential threats [104]. For example, in 2019, the United States launched cyberattacks on Iran’s weapons systems, marking the first time in the history of global cyber warfare that a government publicly announced a cyber war against another sovereign state [105].
Other countries with considerable comprehensive strength, such as Russia and India, show more moderate weights of each dataset when predicting cyberattack activities, ranking between low-income and high-income countries. This pattern can be explained from the perspective of gray zone conflict theory. These countries occupy a unique position in the international system—they are neither hegemonic powers that dominate the international order nor weak states within the global system. As a result, they are more likely to adopt gray zone strategies to safeguard their interests, rather than relying on traditional military confrontation [106,107]. This strategic inclination shapes the complexity of their cyberattack patterns, necessitating a comprehensive consideration of political, economic, military, and social factors in decision-making. For example, as the main successor to the former Soviet Union, Russia has inherited the superpower status and influence from the Cold War era. This historical background endows Russia with a unique position in international politics [108]. Additionally, Russia possesses formidable conventional military forces and nuclear deterrence capabilities, and is also actively developing cyber warfare capabilities [109]. This diversity in foreign relations and military strength may be reflected in the diversification of its cyberattack strategies.
In summary, our explanatory analysis aligns with several geopolitical theories. In low-income countries, cyberattacks are a continuation of historical conflicts rather than isolated incidents, consistent with the theory of asymmetric warfare. The macro-factor-driven pattern observed in high-income countries validates the cyber hegemony theory. And the hybrid pattern for medium-power nations suggests that the motivations for cyberattacks are a dynamic balance of history, geography and capabilities, which can be analyzed in conjunction with gray zone conflict theory. These results indicate that the cyberattack strategies of different countries are not random but are deeply embedded in their international status, military strategies, and geopolitical objectives.

7.2. Advantages of the Proposed Method

7.2.1. Enhanced Prediction and Theoretical Insights into Cyberattack Behaviors

We propose a multimodal data fusion method for predicting inter-state cyberattacks. The results of ablation experiments show that our model enhances the prediction performance to a certain extent by leveraging the advantages of various data sources. For instance, when using all data modalities, the overall performance reach its peak (F1 = 0.838, accuracy = 0.835), higher than the model using only a single data source (F1 = 0.822, accuracy = 0.813). This not only validates the necessity of multi-source heterogeneous data fusion: different modal data have complementarity in describing the complexity and diversity of cyberattack behaviors, collectively providing comprehensive support for predicting cyberattack activities. It also demonstrates the effectiveness of the temporal interaction attention module and the multi-view attention module: our model can effectively explore the intrinsic correlations among different modalities, achieving information interchange and enhancement.
Moreover, it is essential to clarify that, unlike approaches that solely focus on developing state-of-the-art prediction models, our framework emphasizes interpretability and the integration of diverse data sources. This enables it to reveal key factors and patterns of cyberattack behaviors from geopolitical and economic perspectives. Specifically, through explainable boosting machine and attention weight analysis, we validate the critical role of factors such as armed conflicts, geopolitical interactions, and economic dependence in the dynamic prediction of cyberattacks. These findings align with and reinforce insights from quantitative studies on cyber attack behavior (as mentioned in Section 3.1). This interdisciplinary approach goes beyond technical performance metrics and helps deepen the understanding of cyberattacks at the national level.

7.2.2. Broader Applicability to Other State Behaviors

What is more interesting is that the significance of this study extends far beyond cyberattack prediction. Our proposed method has broad generalizability and can be flexibly applied to the prediction of other national-level behaviors. For instance, in the field of armed conflict prediction, this framework can integrate historical conflict data, political event data, military exercise data, etc., to provide a more comprehensive description of inter-state tensions and potential conflict risks. In predicting economic sanctions, this method can fuse historical sanction data, international trade data, bilateral relations data, etc., to capture the complex economic and political relationships between the sanctioning country and its targets. When forecasting changes in diplomatic relations, this approach can synthesize information from political statements, economic interactions, cultural exchanges, and other multifaceted data to paint a more holistic picture of evolving international relationships. Through the interpretable multimodal data fusion framework proposed in this study, each of the above applications benefits from higher prediction accuracy and deeper understanding of the driving factors. In brief, this provides a powerful tool and methodology for international relations and security research.

7.3. Limitations and Future Works

Despite this study has made some progress in integrating multimodal data to predict inter-state cyberattacks, some limitations remain.
Firstly, the dataset used in this research is concentrated in the period from 1 January to 31 December 2020. This fails to encompass recent major events, such as the Russia-Ukraine conflict that erupted in February 2022, which has significantly altered the global geopolitical landscape and potentially leading to new patterns and characteristics in cyberattack behaviors between countries [110]. Although we have strived to integrate heterogeneous data sources, some still have shortcomings in diversity, temporal scale, and coverage. For instance, DDoS attacks are widely used due to their low implementation cost and distributed nature, making them more difficult to attribute [7]. But there are other means of attack, so considering only DDoS attacks can not fully reflect the cyberattack behavior between countries. Therefore, in the future, longer-term and more diverse data sources could be introduced. For example, data from social media platforms like Twitter (i.e., X) could provide additional contextual information to further enhance the prediction ability of the model [111,112].
Secondly, while EBM and attention weights offer intuitive explanations for the model’s decision-making process, each method has certain limitations and potential biases. EBM, which is based on a generalized additive model, assumes that feature contributions to the output are additive. Although it supports feature interactions, it may struggle to fully capture highly complex nonlinear patterns or higher-order interactions. And during training, EBM tends to prioritize features that have the most significant impact on the target variable, which may lead to the omission of weaker yet still meaningful features, thereby affecting the comprehensiveness of the interpretation to some extent [74,75]. Similarly, attention mechanisms explain model decisions by assigning different weights to various data modalities. However, these weights do not necessarily indicate causal relationships; rather, they reflect correlations learned by the model between features and outputs. Studies have shown that attention weights can be influenced by the distribution of training data and model architecture, meaning that when data contains noise or biases, the interpretative results may be affected [113,114]. Therefore, although these explainability techniques serve as valuable tools for understanding model decisions, their outputs should be interpreted cautiously. In real-world applications, it is essential to incorporate domain expertise to validate insights and avoid overinterpreting the model’s causal mechanisms.
Finally, recent advances in large language models (LLMs) have demonstrated remarkable capabilities in natural language understanding and contextual reasoning, enabling the extraction of subtle semantic information from unstructured text [115]. In the context of this study, one promising future direction is to incorporate LLMs to enhance the understanding of geopolitical reports and news events. This would facilitate the capture of real-time, potential triggers of cyberattacks, thereby enriching the predictive information of the model. In addition, by combining LLMs with GNNs, we can bridge the gap between textual and graph-based data, and realize multimodal data modeling [116,117]. For instance, while GNNs effectively capture the dynamic interactions between nations, LLMs can process and contextualize the textual data describing these interactions (e.g., news articles on diplomatic conflicts). The fusion of the two models is expected to further promote the prediction and understanding of inter-state cyberattacks.

8. Conclusions

In response to the increasingly severe situation of inter-state cyberattack activities, this study design a novel dynamic multi-view graph neural network model for processing multimodal data. On one hand, this model utilizes a temporal interaction attention mechanism to simultaneously capture the intrinsic connections between different data modalities and dynamic features that change over time. On the other hand, it employs a multi-view attention mechanism to learn the importance of node representations from different data modalities, forming a fused node representation that ultimately enables accurate prediction of cyberattack activities. Our experimental results show that considering multimodal data including cyberattacks, news events, armed conflicts, international trade, and national characteristics can help improve the predictive performance of the model, with an F1 score of 0.838 and an accuracy of 0.835.
Additionally, another key contribution of this study is the construction of an interpretability module. We use explainable boosting machine to quantify the specific contribution of each feature from multi-source datasets, and use attention weight analysis to reveal multiple influencing factors of cyberattack activities among countries at different income levels. This interpretability enhances the model’s transparency and credibility, and also provides new perspectives for in-depth understanding of the inter-state cyberattacks.

Author Contributions

Conceptualization, D.J. and F.D.; methodology, J.D. and S.C.; software, J.W., J.D. and S.C.; validation, J.D., S.C. and J.Z.; investigation, M.H.; data curation, J.Z. and J.W.; writing—original draft preparation, M.H. and J.D.; writing—review and editing, F.D. and D.J.; project administration, D.J.; funding acquisition, M.H. All authors have read and agreed to the published version of the manuscript.

Funding

This research was funded by the National Key Research and Development Program of China, grant number 2023YFB3107200.

Data Availability Statement

The data presented in this study are available upon request from the corresponding author.

Conflicts of Interest

The authors declare no conflicts of interest.

References

  1. Ramadhan, I. The Implication of Cyberspace Towards State Geopolitics. Politicon J. Ilmu Polit. 2021, 3, 161–184. [Google Scholar] [CrossRef]
  2. Vanberghen, C. Cyberspace and the 21st Century Arms Race. 2023. Available online: https://digitalsociety.eui.eu/publication/cyberspace-and-the-21st-century-arms-race/ (accessed on 3 July 2024).
  3. ASD. ASD Cyber Threat Report 2022–2023. 2023. Available online: https://www.cyber.gov.au/about-us/view-all-content/reports-and-statistics/asd-cyber-threat-report-july-2022-june-2023 (accessed on 3 July 2024).
  4. Asal, V.; Mauslein, J.; Murdie, A.; Young, J.; Cousins, K.; Bronk, C. Repression, Education, and Politically Motivated Cyberattacks. J. Glob. Secur. Stud. 2016, 1, 235–247. [Google Scholar] [CrossRef]
  5. Li, Y.; Zhang, Y.; Lee, C.C.; Li, J.; Hunter, L.Y.; Albert, C.D.; Garrett, E.; Rutland, J. Democracy and Cyberconflict: How Regime Type Affects State-Sponsored Cyberattacks. J. Cyber Policy 2022, 7, 72–94. [Google Scholar]
  6. Chen, S.; Hao, M.; Ding, F.; Jiang, D.; Dong, J.; Zhang, S.; Guo, Q.; Gao, C. Exploring the Global Geography of Cybercrime and Its Driving Forces. Humanit. Soc. Sci. Commun. 2023, 10, 71. [Google Scholar] [CrossRef]
  7. Kumar, S.; Carley, K.M. Understanding DDoS Cyber-Attacks Using Social Media Analytics. In Proceedings of the 2016 IEEE Conference on Intelligence and Security Informatics (ISI), Tucson, AZ, USA, 28–30 September 2016; pp. 231–236. [Google Scholar]
  8. Ben Fredj, O.; Mihoub, A.; Krichen, M.; Cheikhrouhou, O.; Derhab, A. CyberSecurity Attack Prediction: A Deep Learning Approach. In Proceedings of the 13th International Conference on Security of Information and Networks, Istanbul, Turkey, 4–6 November 2020; Association for Computing Machinery: New York, NY, USA, 2020; pp. 1–6. [Google Scholar]
  9. Wu, S.; Wang, B.; Wang, Z.; Fan, S.; Yang, J.; Li, J. Joint Prediction on Security Event and Time Interval through Deep Learning. Comput. Secur. 2022, 117, 102696. [Google Scholar] [CrossRef]
  10. Chen, Y.Z.; Huang, Z.G.; Xu, S.; Lai, Y.C. Spatiotemporal Patterns and Predictability of Cyberattacks. PLoS ONE 2015, 10, e0124472. [Google Scholar] [CrossRef]
  11. Werner, G.; Yang, S.; McConky, K. Time Series Forecasting of Cyber Attack Intensity. In Proceedings of the 12th Annual Conference on Cyber and Information Security Research, Oak Ridge, TN, USA, 4–6 April 2017; Association for Computing Machinery: New York, NY, USA, 2017; pp. 1–3. [Google Scholar]
  12. Xu, M.; Schweitzer, K.M.; Bateman, R.M.; Xu, S. Modeling and Predicting Cyber Hacking Breaches. IEEE Trans. Inf. Forensics Secur. 2017, 13, 2856–2871. [Google Scholar] [CrossRef]
  13. Maness, R.C.; Valeriano, B.; Jensen, B.; Hedgecock, K.; Macias, J. The Dyadic Cyber Incident and Campaign Data (DCID). 2022. Available online: https://drryanmaness.wixsite.com/cyberconflict/cyber-conflict-dataset (accessed on 16 March 2024).
  14. Gandhi, R.; Sharma, A.; Mahoney, W.; Sousan, W.; Zhu, Q.; Laplante, P. Dimensions of Cyber-Attacks: Cultural, Social, Economic, and Political. IEEE Technol. Soc. Mag. 2011, 30, 28–38. [Google Scholar] [CrossRef]
  15. Kazemi, S.M.; Goel, R.; Jain, K.; Kobyzev, I.; Sethi, A.; Forsyth, P.; Poupart, P. Representation Learning for Dynamic Graphs: A Survey. J. Mach. Learn. Res. 2020, 21, 1–73. [Google Scholar]
  16. Barros, C.D.T.; Mendonça, M.R.F.; Vieira, A.B.; Ziviani, A. A Survey on Embedding Dynamic Graphs. ACM Comput. Surv. 2021, 55, 1–37. [Google Scholar] [CrossRef]
  17. Yu, B.; Yin, H.; Zhu, Z. Spatio-temporal graph convolutional networks: A deep learning framework for traffic forecasting. In Proceedings of the 27th International Joint Conference on Artificial Intelligence, Stockholm, Sweden, 13–19 July 2018; AAAI Press: Freiburg, Germany, 2018; pp. 3634–3640. [Google Scholar]
  18. Pareja, A.; Domeniconi, G.; Chen, J.; Ma, T.; Suzumura, T.; Kanezashi, H.; Kaler, T.; Schardl, T.B.; Leiserson, C.E. EvolveGCN: Evolving Graph Convolutional Networks for Dynamic Graphs. Proc. AAAI Conf. Artif. Intell. 2019, 34, 5363–5370. [Google Scholar] [CrossRef]
  19. Behrouz, A.; Seltzer, M. Anomaly Detection in Multiplex Dynamic Networks: From Blockchain Security to Brain Disease Prediction. arXiv 2022, arXiv:2211.08378. [Google Scholar]
  20. Li, L.; Duan, L.; Wang, J.; Xie, G.; He, C.; Chen, Z.; Deng, S. Transformer-Based Representation Learning on Temporal Heterogeneous Graphs. In Proceedings of the Asia-Pacific Web (APWeb) and Web-Age Information Management (WAIM) Joint International Conference on Web and Big Data, Nanjing, China, 11–13 August 2022; pp. 385–400. [Google Scholar]
  21. Hunter, L.Y.; Albert, C.D.; Garrett, E. Factors That Motivate State-Sponsored Cyberattacks. Cyber Def. Rev. 2021, 6, 111–128. [Google Scholar]
  22. Kumar, S.; Carley, K.M. Approaches to Understanding the Motivations behind Cyber Attacks. In Proceedings of the 2016 IEEE Conference on Intelligence and Security Informatics (ISI), Tucson, AZ, USA, 28–30 September 2016; pp. 307–309. [Google Scholar]
  23. Akoto, W. International Trade and Cyber Conflict: Decomposing the Effect of Trade on State-Sponsored Cyber Attacks. J. Peace Res. 2021, 58, 1083–1097. [Google Scholar] [CrossRef]
  24. González-Manzano, L.; de Fuentes, J.M.; Ramos, C.; Sánchez, A.; Quispe, F. Identifying Key Relationships between Nation-State Cyberattacks and Geopolitical and Economic Factors: A Model. Secur. Commun. Netw. 2022, 2022, 5784674. [Google Scholar] [CrossRef]
  25. Deng, S.; Ning, Y. A Survey on Societal Event Forecasting with Deep Learning. arXiv 2021, arXiv:2112.06345. [Google Scholar]
  26. Iyda, J.J.; Geetha, P. An Improved Deep Belief Neural Network Based Civil Unrest Event Forecasting in Twitter. Appl. Intell. 2023, 53, 5714–5731. [Google Scholar] [CrossRef]
  27. Brandt, P.T.; D’Orazio, V.; Khan, L.; Li, Y.F.; Osorio, J.; Sianan, M. Conflict Forecasting with Event Data and Spatio-Temporal Graph Convolutional Networks. Int. Interact. 2022, 48, 800–822. [Google Scholar] [CrossRef]
  28. Gallotti, R.; Valle, F.; Castaldo, N.; Sacco, P.; De Domenico, M. Assessing the Risks of ‘Infodemics’ in Response to COVID-19 Epidemics. Nat. Hum. Behav. 2020, 4, 1285–1293. [Google Scholar] [CrossRef]
  29. Wang, Z.; Zhang, Y. DDoS Event Forecasting Using Twitter Data. In Proceedings of the Twenty-Sixth International Joint Conference on Artificial Intelligence, Melbourne, Australia, 19–25 August 2017; pp. 4151–4157. [Google Scholar]
  30. Deb, A.; Lerman, K.; Ferrara, E. Predicting Cyber-Events by Leveraging Hacker Sentiment. Information 2018, 9, 280. [Google Scholar] [CrossRef]
  31. Pechi, D. Predicting Cyber-Attacks Using Neural Language Models of Sociopolitical Events. 2019. Available online: https://danpechi.github.io/Dan%20Pechi%20Thesis.pdf (accessed on 24 June 2024).
  32. Lakha, B.; Duran, J.; Serra, E.; Spezzano, F. Prediction of Future Nation-initiated Cyberattacks from News-based Political Event Graph. In Proceedings of the 2023 IEEE 10th International Conference on Data Science and Advanced Analytics (DSAA), Thessaloniki, Greece, 9–13 October 2023; IEEE: Piscataway, NJ, USA, 2023; pp. 1–8. [Google Scholar]
  33. Wu, Z.; Pan, S.; Chen, F.; Long, G.; Zhang, C.; Yu, P.S. A Comprehensive Survey on Graph Neural Networks. IEEE Trans. Neural Netw. Learn. Syst. 2021, 32, 4–24. [Google Scholar] [CrossRef]
  34. Wu, S.; Sun, F.; Zhang, W.; Xie, X.; Cui, B. Graph Neural Networks in Recommender Systems: A Survey. ACM Comput. Surv. 2022, 55, 1–37. [Google Scholar] [CrossRef]
  35. Kipf, T.N.; Welling, M. Semi-Supervised Classification with Graph Convolutional Networks. arXiv 2017, arXiv:1609.02907. [Google Scholar]
  36. Hamilton, W.L.; Ying, R.; Leskovec, J. Inductive Representation Learning on Large Graphs. In Proceedings of the 31st International Conference on Neural Information Processing Systems, Long Beach, CA, USA, 4–9 December 2017; Curran Associates Inc.: Red Hook, NY, USA, 2017; pp. 1025–1035. [Google Scholar]
  37. Veličković, P.; Cucurull, G.; Casanova, A.; Romero, A.; Liò, P.; Bengio, Y. Graph Attention Networks. In Proceedings of the International Conference on Learning Representations, Vancouver, BC, Canada, 30 April–3 May 2018. [Google Scholar]
  38. Xu, D.; Ruan, C.; Korpeoglu, E.; Kumar, S.; Achan, K. Inductive Representation Learning on Temporal Graphs. arXiv 2020, arXiv:2002.07962. [Google Scholar]
  39. Sankar, A.; Wu, Y.; Gou, L.; Zhang, W.; Yang, H. Dysat: Deep neural representation learning on dynamic graphs via self-attention networks. In Proceedings of the 13th International Conference on Web Search and Data Mining, Houston, TX, USA, 3–7 February 2020; Volume 35, pp. 519–527. [Google Scholar]
  40. Ata, S.K.; Fang, Y.; Wu, M.; Shi, J.; Kwoh, C.K.; Li, X. Multi-View Collaborative Network Embedding. ACM Trans. Knowl. Discov. Data 2021, 15, 1–18. [Google Scholar] [CrossRef]
  41. Xiao, S.; Li, J.; Lu, J.; Huang, S.; Zeng, B.; Wang, S. Graph Neural Networks for Multi-View Learning: A Taxonomic Review. Artif. Intell. Rev. 2024, 57, 341. [Google Scholar] [CrossRef]
  42. Xue, H.; Yang, L.; Jiang, W.; Wei, Y.; Hu, Y.; Lin, Y. Modeling Dynamic Heterogeneous Network for Link Prediction Using Hierarchical Attention with Temporal RNN. In Machine Learning and Knowledge Discovery in Databases. ECML PKDD 2020. Lecture Notes in Computer Science; Springer: Cham, Switzerland, 2020. [Google Scholar]
  43. Pawłowski, M.; Wróblewska, A.; Sysko-Romańczuk, S. Effective Techniques for Multimodal Data Fusion: A Comparative Analysis. Sensors 2023, 23, 2381. [Google Scholar] [CrossRef]
  44. Zhao, F.; Zhang, C.; Geng, B. Deep Multimodal Data Fusion. ACM Comput. Surv. 2024, 56, 1–36. [Google Scholar] [CrossRef]
  45. Lahat, D.; Adali, T.; Jutten, C. Multimodal Data Fusion: An Overview of Methods, Challenges, and Prospects. Proc. IEEE 2015, 103, 1449–1477. [Google Scholar] [CrossRef]
  46. Chandrasekaran, G.; Nguyen, T.N.; Hemanth, D.J. Multimodal Sentimental Analysis for Social Media Applications: A Comprehensive Review. Wiley Interdiscip. Rev. Data Min. Knowl. Discov. 2021, 11, e1415. [Google Scholar] [CrossRef]
  47. Gandhi, A.; Adhvaryu, K.; Poria, S.; Cambria, E.; Hussain, A. Multimodal Sentiment Analysis: A Systematic Review of History, Datasets, Multimodal Fusion Methods, Applications, Challenges and Future Directions. Inf. Fusion 2023, 91, 424–444. [Google Scholar] [CrossRef]
  48. Yin, H.; Yang, S.; Song, X.; Liu, W.; Li, J. Deep Fusion of Multimodal Features for Social Media Retweet Time Prediction. World Wide Web 2021, 24, 1027–1044. [Google Scholar] [CrossRef]
  49. Liu, Z.; Yang, T.; Chen, W.; Chen, J.; Li, Q.; Zhang, J. Sentiment Analysis of Social Media Comments Based on Multimodal Attention Fusion Network. Appl. Soft Comput. 2024, 164, 112011. [Google Scholar] [CrossRef]
  50. Wang, J.; Yang, S.; Zhao, H.; Yang, Y. Social Media Popularity Prediction with Multimodal Hierarchical Fusion Model. Comput. Speech Lang. 2023, 80, 101490. [Google Scholar] [CrossRef]
  51. Mondal, M.; Khayati, M.; Sandlin, H.Â.; Cudré-Mauroux, P. A Survey of Multimodal Event Detection Based on Data Fusion. VLDB J. 2025, 34, 1–25. [Google Scholar] [CrossRef]
  52. Zou, Z.; Gan, H.; Huang, Q.; Cai, T.; Cao, K. Disaster Image Classification by Fusing Multimodal Social Media Data. ISPRS Int. J. Geo-Inf. 2021, 10, 636. [Google Scholar] [CrossRef]
  53. Algiriyage, N.; Prasanna, R.; Stock, K.; Doyle, E.E.H.; Johnston, D. Multi-Source Multimodal Data and Deep Learning for Disaster Response: A Systematic Review. SN Comput. Sci. 2022, 3, 92. [Google Scholar] [CrossRef]
  54. Li, J.; Hong, D.; Gao, L.; Yao, J.; Zheng, K.; Zhang, B.; Chanussot, J. Deep Learning in Multimodal Remote Sensing Data Fusion: A Comprehensive Review. Int. J. Appl. Earth Obs. Geoinf. 2022, 112, 102926. [Google Scholar] [CrossRef]
  55. Luo, L.; Li, B.; Qi, C. Spatiotemporal Multi-graph Convolutional Network-based Provincial-day-level Terrorism Risk Prediction. Risk Anal. 2024, 44, 1514–1534. [Google Scholar] [CrossRef]
  56. Jiang, D.; Wu, J.; Ding, F.; Ide, T.; Scheffran, J.; Helman, D.; Zhang, S.; Qian, Y.; Fu, J.; Chen, S.; et al. An Integrated Deep-Learning and Multi-Level Framework for Understanding the Behavior of Terrorist Groups. Heliyon 2023, 9, e18895. [Google Scholar] [CrossRef]
  57. Arbor, N. Digital Attack Map: Top Daily DDoS Attacks Worldwid. 2020. Available online: https://www.digitalattackmap.com/ (accessed on 24 June 2024).
  58. Nejjari, N.; Lahlou, S.; Fadi, O.; Zkik, K.; Oudani, M.; Benbrahim, H. Conflict Spectrum: An Empirical Study of Geopolitical Cyber Threats from a Social Network Perspective. In Proceedings of the 2021 Eighth International Conference on Social Network Analysis, Management and Security (SNAMS), Gandia, Spain, 6–9 December 2021; pp. 1–7. [Google Scholar]
  59. Boschee, E.; Lautenschlager, J.; O’Brien, S.; Shellman, S.; Starz, J.; Ward, M. ICEWS Coded Event Data. 2015. Available online: https://dataverse.harvard.edu/dataset.xhtml?persistentId=doi:10.7910/DVN/28075 (accessed on 24 June 2024).
  60. Kostyuk, N.; Zhukov, Y.M. Invisible Digital Front: Can Cyber Attacks Shape Battlefield Events? J. Confl. Resolut. 2019, 63, 317–347. [Google Scholar] [CrossRef]
  61. Willett, M. The Cyber Dimension of the Russia–Ukraine War. In Survival: October–November 2022; Routledge: Abingdon, UK, 2022; pp. 7–26. [Google Scholar]
  62. Davies, S.; Engström, G.; Pettersson, T.; Öberg, M. Organized violence 1989–2023, and the prevalence of organized crime groups. J. Peace Res. 2024, 61, 673–693. [Google Scholar] [CrossRef]
  63. Brett, N. Economic Information Warfare: Classifying Cyber-attacks against Commodity Value Chains. In Proceedings of the ICCWS 2019 14th International Conference on Cyber Warfare and Security: ICCWS 2019, Stellenbosch, South Africa, 28 February–1 March 2019; pp. 448–455. [Google Scholar]
  64. Conte, M.; Cotterlaz, P.; Mayer, T. The CEPII Gravity Database. 2022. Available online: https://ideas.repec.org/p/cii/cepidt/2022-05.html (accessed on 13 May 2024).
  65. Valev, N. TheGlobalEconomy.com: Learning Resources and Data on the World Economy. 2024. Available online: https://www.theglobaleconomy.com/ (accessed on 11 May 2024).
  66. Mezzour, G.; Carley, L.R.; Carley, K.M. Global Mapping of Cyber Attacks. 2014. Available online: https://papers.ssrn.com/sol3/papers.cfm?abstract_id=2729302 (accessed on 4 July 2024).
  67. Levesque, F.L.; Fernandez, J.M.; Somayaji, A. National-Level Risk Assessment: A Multi-Country Study of Malware Infections. In Proceedings of the Workshop on the Economics of Information Security (WEIS), Berkeley, CA, USA, 13–14 June 2016; pp. 1–30. [Google Scholar]
  68. Shi, Y.; Huang, Z.; Feng, S.; Zhong, H.; Wang, W.; Sun, Y. Masked Label Prediction: Unified Message Passing Model for Semi-Supervised Classification. arXiv 2021, arXiv:2009.03509. [Google Scholar]
  69. Dwivedi, V.P.; Bresson, X. A Generalization of Transformer Networks to Graphs. arXiv 2021, arXiv:2012.09699. [Google Scholar]
  70. Li, M.; Ye, Z.; Zhao, H.; Xiao, Y.; Cao, S. Detecting Social Robots Based on Multi-view Graph Transformer. In Proceedings of the CCF Conference on Big Data. Communications in Computer and Information Science; Springer Nature: Berlin/Heidelberg, Germany, 2023; pp. 136–148. [Google Scholar]
  71. Wei, X.; Zhang, T.; Li, Y.; Zhang, Y.; Wu, F. Multi-Modality Cross Attention Network for Image and Sentence Matching. In Proceedings of the 2020 IEEE/CVF Conference on Computer Vision and Pattern Recognition (CVPR), Seattle, WA, USA, 13–19 June 2020; IEEE: Piscataway, NJ, USA, 2020; pp. 10938–10947. [Google Scholar]
  72. Yang, W.; Zhang, H.; Lim, J.B.; Zhang, Y.; Meng, H. A new chiller fault diagnosis method under the imbalanced data environment via combining an improved generative adversarial network with an enhanced deep extreme learning machine. Eng. Appl. Artif. Intell. 2024, 137, 109218. [Google Scholar] [CrossRef]
  73. Lou, Y.; Caruana, R.; Gehrke, J. Intelligible Models for Classification and Regression. In Proceedings of the 18th ACM SIGKDD International Conference on Knowledge Discovery and Data Mining, Beijing China, 12–16 August 2012; ACM: New York, NY, USA, 2012; pp. 150–158. [Google Scholar]
  74. Nori, H.; Jenkins, S.; Koch, P.; Caruana, R. InterpretML: A Unified Framework for Machine Learning Interpretability. arXiv 2019, arXiv:1909.09223. [Google Scholar]
  75. Alahmadi, R.; Almujibah, H.; Alotaibi, S.; Alsharif, M.; Bakri, M. Explainable Boosting Machine: A Contemporary Glass-Box Model to Analyze Work Zone-Related Road Traffic Crashes. Safety 2023, 9, 83. [Google Scholar] [CrossRef]
  76. Peng, C.Y.J.; Lee, K.L.; Ingersoll, G.M. An Introduction to Logistic Regression Analysis and Reporting. J. Educ. Res. 2002, 96, 3–14. [Google Scholar] [CrossRef]
  77. Ke, G.; Meng, Q.; Finley, T.; Wang, T.; Chen, W.; Ma, W.; Ye, Q.; Liu, T.Y. LightGBM: A Highly Efficient Gradient Boosting Decision Tree. In Proceedings of the Advances in Neural Information Processing Systems; Curran Associates, Inc.: Long Beach, CA, USA, 2017; Volume 30. [Google Scholar]
  78. Grover, A.; Leskovec, J. node2vec: Scalable feature learning for networks. In Proceedings of the 22nd ACM SIGKDD International Conference on Knowledge Discovery and Data Mining. Association for Computing Machinery, San Francisco, CA, USA, 13–17 August 2016; pp. 855–864. [Google Scholar]
  79. Ribeiro, L.F.; Saverese, P.H.; Figueiredo, D.R. struc2vec: Learning node representations from structural identity. In Proceedings of the 23rd ACM SIGKDD International Conference on Knowledge Discovery and Data Mining, Halifax, NS, Canada, 13–17 August 2017; pp. 385–394. [Google Scholar]
  80. Rampášek, L.; Galkin, M.; Dwivedi, V.P.; Luu, A.T.; Wolf, G.; Beaini, D. Recipe for a General, Powerful, Scalable Graph Transformer. Adv. Neural Inf. Process. Syst. 2022, 35, 14501–14515. [Google Scholar]
  81. Tailor, S.A.; Opolka, F.; Lio, P.; Lane, N.D. Adaptive Filters for Low-Latency and Memory-Efficient Graph Neural Networks. In Proceedings of the International Conference on Learning Representations, Virtual, 25–29 April 2022. [Google Scholar]
  82. Brody, S.; Alon, U.; Yahav, E. How Attentive are Graph Attention Networks? In Proceedings of the International Conference on Learning Representations, Virtual, 25–29 April 2022. [Google Scholar]
  83. Yu, L.; Sun, L.; Du, B.; Liu, C.; Xiong, H.; Lv, W. Predicting Temporal Sets with Deep Neural Networks. In Proceedings of the 26th ACM SIGKDD International Conference on Knowledge Discovery & Data Mining, New York, NY, USA, 6–10 July 2020; pp. 1083–1091. [Google Scholar]
  84. Bai, J.; Zhu, J.; Song, Y.; Zhao, L.; Hou, Z.; Du, R.; Li, H. A3T-GCN: Attention Temporal Graph Convolutional Network for Traffic Forecasting. ISPRS Int. J. Geo-Inf. 2021, 10, 485. [Google Scholar] [CrossRef]
  85. Panagopoulos, G.; Nikolentzos, G.; Vazirgiannis, M. Transfer Graph Neural Networks for Pandemic Forecasting. Proc. AAAI Conf. Artif. Intell. 2021, 35, 4838–4845. [Google Scholar] [CrossRef]
  86. Bhatti, U.A.; Tang, H.; Wu, G.; Marjan, S.; Hussain, A. Deep Learning with Graph Convolutional Networks: An Overview and Latest Applications in Computational Intelligence. Int. J. Intell. Syst. 2023, 2023, 1–28. [Google Scholar] [CrossRef]
  87. Ju, W.; Fang, Z.; Gu, Y.; Liu, Z.; Long, Q.; Qiao, Z.; Qin, Y.; Shen, J.; Sun, F.; Xiao, Z.; et al. A Comprehensive Survey on Deep Graph Representation Learning. Neural Netw. 2024, 173, 106207. [Google Scholar] [CrossRef]
  88. Gibney, E.; Lotero, L.; Cardillo, A.; Hurtado, R.; Gomez-Gardenes, J. Where Is Russia’s Cyberwar? Researchers Decipher Its Strategy. Nature 2022, 603, 775–776. [Google Scholar] [CrossRef] [PubMed]
  89. Spelta, A.; Pecora, N.; Pagnottoni, P. Assessing Harmfulness and Vulnerability in Global Bipartite Networks of Terrorist-Target Relationships. Soc. Netw. 2023, 72, 22–34. [Google Scholar] [CrossRef]
  90. Holt, T.J.; Freilich, J.D.; Chermak, S.M. Exploring the Subculture of Ideologically Motivated Cyber-Attackers. J. Contemp. Crim. Justice 2017, 33, 212–233. [Google Scholar] [CrossRef]
  91. Azubuike, C.F. Cyber Security and International Conflicts: An Analysis of State-Sponsored Cyber Attacks. Nnamdi Azikiwe J. Political Sci. 2023, 8, 101–114. [Google Scholar]
  92. Netolická, V.; Mareš, M. Arms Race “in Cyberspace”—A Case Study of Iran and Israel. Comp. Strategy 2018, 37, 414–429. [Google Scholar] [CrossRef]
  93. Dehnavi, E.A.; Fiedler, R.A. Cyber Security As A New Strategic Issue in the Middle East: A Case Study of Persian Gulf and North African Countries. Riv. Ital. Di Filos. Anal. Jr. 2023, 14, 599–606. [Google Scholar]
  94. Sumari, A.D.W.; Gunawan, D.; Munthaha, F. Cyberspace operations as multiplier power in asymmetric conflict. In Proceedings of the International Conference on Cyber Warfare and Security. Academic Conferences International Limited, West Lafayette, IN, USA, 24–25 March 2014; p. 324. [Google Scholar]
  95. Li, T.Y. Asymmetry in the Digital Age: Cyber Deterrence Strategies for Small States. J. Strateg. Secur. 2024, 17, 71–88. [Google Scholar] [CrossRef]
  96. Kausch, K. Cheap Havoc: How Cyber-Geopolitics Will Destabilize the Middle East. 2022. Available online: https://www.jstor.org/stable/resrep18776 (accessed on 4 July 2024).
  97. Bendiek, A.; Metzger, T. Deterrence theory in the cyber-century. In INFORMATIK 2015; Gesellschaft für Informatik eV: Bonn, Germany, 2015; pp. 553–570. [Google Scholar]
  98. Smeets, M. The Strategic Promise of Offensive Cyber Operations. Strateg. Stud. Q. 2018, 12, 90–113. [Google Scholar]
  99. Huskaj, G.; Blix, F.; Axelsson, S. A Theory of Offensive Cyberspace Operations and Its Policy and Strategy Implications. In Proceedings of the 23rd European Conference on Cyber Warfare and Security, Jyvaskyla, Finland, 27–28 June 2024; pp. 214–223. [Google Scholar]
  100. Tang, M. Huawei Versus the United States? The Geopolitics of Exterritorial Internet Infrastructure. Int. J. Commun. 2020, 14, 4556–4577. [Google Scholar]
  101. Ran, T.; Liu, Z. “The Russia-Ukraine War” or “The US-Russia War”? Thematic Analysis of Global Times’ Coverage of the Russia-Ukraine War. Media Asia 2024, 51, 3–32. [Google Scholar] [CrossRef]
  102. XinHuaNet. The United States’ Global Confrontation and Conflict: 1979–2020. 2021. Available online: http://www.xinhuanet.com/2021-12/13/c_1128158270.htm (accessed on 4 July 2024).
  103. Kozera, C.; Bernat, P.; Gürer, C.; Popławski, B.; Sözer, M. Game of Proxies—Towards a New Model of Warfare: Experiences from the CAR, Libya, Mali, Syria, and Ukraine. Secur. Def. Q. 2020, 31, 77–97. [Google Scholar] [CrossRef]
  104. Gold, J. The Five Eyes and Offensive Cyber Capabilities: Building a ‘Cyber Deterrence Initiative’. 2020. Available online: https://ccdcoe.org/library/publications/the-five-eyes-and-offensive-cyber-capabilities-building-a-cyber-deterrence-initiative/ (accessed on 4 July 2024).
  105. BBC. US ‘Launched Cyber-Attack on Iran Weapons Systems’. 2019. Available online: https://www.bbc.com/news/world-us-canada-48735097 (accessed on 4 July 2024).
  106. Sykulski, L. Old Methods in the New Framework: Strategy of Grey Zones in Hybrid Warfare. Strateg. XXI Natl. Def. Coll. 2021, 1, 162–170. [Google Scholar] [CrossRef]
  107. Dziwisz, D. Rethinking Future Conflicts. Politeja 2024, 21, 281–309. [Google Scholar] [CrossRef]
  108. Van der Togt, T. In search of a European Russia strategy. Atl. Perspect. 2020, 44, 36–41. [Google Scholar]
  109. Jensen, B.; Valeriano, B.; Maness, R. Fancy Bears and Digital Trolls: Cyber Strategy with a Russian Twist. In Military Strategy in the 21st Century; Routledge: Abingdon, UK, 2020; pp. 58–80. [Google Scholar]
  110. Guchua, A.; Zedelashvili, T.; Giorgadze, G. Geopolitics of the Russia-Ukraine War and Russian cyber attacks on Ukraine-Georgia and expected threats. Ukr. Policymaker 2022, 10, 26–36. [Google Scholar] [CrossRef]
  111. Park, J.H.; Kwon, H.Y. Cyberattack detection model using community detection and text analysis on social media. ICT Express 2022, 8, 499–506. [Google Scholar] [CrossRef]
  112. Abusaqer, M.; Benaoumeur Senouci, M.; Magel, K. Twitter User Sentiments Analysis: Health System Cyberattacks Case Study. In Proceedings of the 2023 International Conference on Artificial Intelligence in Information and Communication (ICAIIC), Bali, Indonesia, 20–23 February 2023; pp. 18–24. [Google Scholar]
  113. Serrano, S.; Smith, N.A. Is Attention Interpretable? In Proceedings of the 57th Annual Meeting of the Association for Computational Linguistics, Florence, Italy, 28 July–2 August 2019. [Google Scholar]
  114. Jain, S.; Wallace, B.C. Attention is not Explanation. In Proceedings of the 2019 Conference of the North American Chapter of the Association for Computational Linguistics: Human Language Technologies, Volume 1 (Long and Short Papers), Minneapolis, MN, USA, 2–7 June 2019. [Google Scholar]
  115. Zhao, W.X.; Zhou, K.; Li, J.; Tang, T.; Wang, X.; Hou, Y.; Min, Y.; Zhang, B.; Zhang, J.; Dong, Z.; et al. A survey of large language models. arXiv 2023, arXiv:2303.18223. [Google Scholar]
  116. Chen, Z.; Mao, H.; Li, H.; Jin, W.; Wen, H.; Wei, X.; Wang, S.; Yin, D.; Fan, W.; Liu, H.; et al. Exploring the Potential of Large Language Models (LLMs)in Learning on Graphs. SIGKDD Explor. Newsl. 2024, 25, 42–61. [Google Scholar] [CrossRef]
  117. Jin, B.; Liu, G.; Han, C.; Jiang, M.; Ji, H.; Han, J. Large Language Models on Graphs: A Comprehensive Survey. IEEE Trans. Knowl. Data Eng. 2024, 36, 8622–8642. [Google Scholar] [CrossRef]
Figure 1. Overall architecture of the interpretable multimodal data fusion framework.
Bdcc 09 00063 g001
Figure 2. Feature importance scores of different datasets. (a) illustrates the feature importance scores when cyberattack graph features are included but interaction terms are not incorporated. (b) shows the feature importance scores when interaction terms are included but cyberattack graph features are omitted. In these figures, CA refers to cyber attack data, NE refers to news event data, AC refers to armed conflict data, IT refers to international trade data, and NA refers to national attribute data.
Bdcc 09 00063 g002
Figure 3. Dataset weights divided by national income. (a) shows the distribution of attention weights for different countries/regions on 5 datasets. (b,c) group countries by income level, showing the distribution of attention weights for countries with and without armed conflict, respectively. Note: * represents p < 0.1 , ** represents p < 0.05 , *** represents p < 0.01 , **** represents p < 0.0001 . (d) presents the attention weights for the top 5 countries experiencing armed conflicts ranked by the number of cyberattacks.
Bdcc 09 00063 g003
Table 1. Summary statistics of five data.
DataTime Scale#Snapshots#Nodes/Snapshot#Edges/Snapshot#Edge Features
Cyber attackDay36622016813
News eventDay3661794952
Armed conflictDay366662012
International tradeYear121029,4882
National similarityYear122249,0621
Table 2. Prediction results of cyberattacks between countries.
Model TypesModelsPrecisionRecallF1Accuracy
Traditional machine
learning models
LR0.878 ± 0.0290.711 ± 0.1020.783 ± 0.0700.807 ± 0.052
GBDT0.880 ± 0.0350.713 ± 0.1020.784 ± 0.0700.808 ± 0.054
Random walk-based
graph embedding models
node2vec0.712 ± 0.0270.843 ± 0.0760.771 ± 0.0440.752 ± 0.040
struc2vec0.722 ± 0.0280.783 ± 0.0760.750 ± 0.0470.742 ± 0.041
Static graph neural
network models
GCN0.749 ± 0.0080.795 ± 0.0430.768 ± 0.0200.763 ± 0.011
GraphSAGE0.776 ± 0.0050.878 ± 0.0180.824 ± 0.0070.812 ± 0.006
GPS0.829 ± 0.0170.778 ± 0.0650.800 ± 0.0270.808 ± 0.018
EGC0.803 ± 0.0100.836 ± 0.0240.818 ± 0.0110.816 ± 0.008
GATv20.779 ± 0.0030.887 ± 0.0180.829 ± 0.0070.817 ± 0.006
Dynamic graph neural
network models
STGCN0.809 ± 0.0060.843 ± 0.0130.825 ± 0.0070.823 ± 0.006
DySAT0.786 ± 0.0080.872 ± 0.0140.826 ± 0.0070.817 ± 0.006
DNNTSP0.805 ± 0.0090.854 ± 0.0090.828 ± 0.0080.824 ± 0.008
A3T-GCN0.751 ± 0.0080.851 ± 0.0260.797 ± 0.0120.784 ± 0.009
MPNN+LSTM0.805 ± 0.0140.843 ± 0.0230.822 ± 0.0100.819 ± 0.009
Dynamic multi-view graph
neural network models
Our method0.821 ± 0.0080.856 ± 0.0170.838 ± 0.0060.835 ± 0.005
The highest value for each metric is highlighted in bold.
Table 3. Ablation analysis.
DatasetsMetric
Cyber
Attack
News
Event
Armed
Conflict
International
Trade
National
Attribute
PrecisionRecallF1Accuracy
0.780 ± 0.0110.871 ± 0.0180.822 ± 0.0070.813 ± 0.007
0.820 ± 0.0130.853 ± 0.0220.836 ± 0.0070.833 ± 0.006
0.824 ± 0.0140.846 ± 0.0240.834 ± 0.0140.833 ± 0.012
0.821 ± 0.0050.851 ± 0.0220.835 ± 0.0100.833 ± 0.008
0.821 ± 0.0090.850 ± 0.0220.834 ± 0.0080.832 ± 0.006
0.821 ± 0.0080.856 ± 0.0170.838 ± 0.0060.835 ± 0.005
The highest value for each metric is highlighted in bold.
Disclaimer/Publisher’s Note: The statements, opinions and data contained in all publications are solely those of the individual author(s) and contributor(s) and not of MDPI and/or the editor(s). MDPI and/or the editor(s) disclaim responsibility for any injury to people or property resulting from any ideas, methods, instructions or products referred to in the content.

