Article

Importance of Data Preprocessing for Accurate and Effective Prediction of Breast Cancer: Evaluation of Model Performance in Novel Data

1
Computer Science Department, University of Limpopo, Polokwane 0727, South Africa
2
Computer Science Department, Urgench State University, Khamid Alimdjan 14, Urgench 220100, Uzbekistan
*
Author to whom correspondence should be addressed.
Big Data Cogn. Comput. 2025, 9(10), 266; https://doi.org/10.3390/bdcc9100266
Submission received: 16 June 2025 / Revised: 19 August 2025 / Accepted: 21 August 2025 / Published: 21 October 2025

Abstract

Breast cancer is one of the leading causes of mortality among women globally, and an early and accurate diagnosis is essential for effective treatment and improved survival rates. Traditional diagnostic techniques often struggle to differentiate between benign and malignant tumors due to overlapping visual characteristics, resulting in false positives or delayed detection. For efficient breast cancer detection with machine learning, it is vital to identify the most significant features because those features play the most important roles in the treatment process. This study addresses this challenge by evaluating and comparing the performance of ten state-of-the-art machine learning classifiers for breast cancer detection using image-derived features. Initially, 30 features were extracted from a novel tertiary hospital dataset, and models were evaluated based on accuracy, precision, recall, and F-measure. To enhance model performance and reduce dimensionality, the Correlation-based Feature Selection (CFS) method was applied, leading to the identification of 11 highly informative features. Our experimental results demonstrate that, while models such as SVM and Logistic Regression achieved the highest accuracy (97.7%) on the full feature set, the Neural Network exhibited a superior performance (97.2%) on the reduced feature set, with a substantial reduction in training time. Most classifiers maintained comparable or improved accuracy with fewer features, indicating effective dimensionality reduction. Furthermore, pairwise statistical significance testing confirmed that ensemble and kernel-based classifiers achieved a statistically superior performance over simpler models. These findings highlight the importance of effective feature selection in developing accurate, efficient, and scalable breast cancer prediction systems.

1. Introduction

Breast cancer (BC) remains a significant global health challenge, accounting for millions of new diagnoses and hundreds of thousands of deaths annually [1]. In 2020 alone, there were 2.3 million new BC diagnoses and 685,000 deaths worldwide [2]. While widespread mammography screening and advancements in treatment have contributed to a decline in mortality rates, early detection remains critical for further reducing BC fatalities [3]. Currently, the accurate and early detection of BC from radiology images heavily relies on the expertise of highly trained radiologists. This presents a growing problem, particularly given the projected shortage of radiologists in many countries, which is likely to exacerbate diagnostic delays [4].
Mammography screening, while beneficial, is also associated with a notable incidence of false positive results [5,6]. These false positives can cause considerable patient anxiety, necessitate inconvenient follow-up appointments, lead to additional imaging tests, and sometimes require invasive procedures such as needle biopsies [5,6]. Given these challenges, machine learning (ML) techniques, particularly graph-based clustering, show promise for improving the evaluation of multiple-view radiology images [7,8,9,10]. Furthermore, deep learning (DL), a subset of ML, has recently revolutionized the interpretation of diagnostic imaging studies [11]. Among DL architectures, Convolutional Neural Networks (CNNs) are particularly significant for their advancements in this field [12].
The integration of Convolutional Neural Networks (CNNs) into computer-aided diagnosis (CAD) systems offers substantial advantages over conventional screening methodologies, particularly in terms of accelerated processing, enhanced reliability, and increased robustness in breast cancer detection. CNNs have established themselves as a leading paradigm for automated pattern recognition and intricate feature learning in diverse image-based analyses [13]. Their demonstrable efficacy has led to their widespread adoption for breast cancer detection across a spectrum of diagnostic imaging modalities, such as ultrasound (US), magnetic resonance imaging (MRI), and X-ray mammography, as follows:
Research on breast cancer (BC) detection using ultrasonography (US) images has explored various CNN-based methodologies. Eroğlu (2022) [14] developed a hybrid CNN system that enhanced diagnostic capabilities by extracting and concatenating features from pre-trained AlexNet, MobileNetV2, and ResNet50 models. Subsequently, the Minimum Redundancy Maximum Relevance (mRMR) method was employed for optimal feature selection. Classification was then performed using Support Vector Machine (SVM) and K-Nearest Neighbors (k-NN) algorithms, resulting in a notable accuracy rate of 95.6%. In another contribution, ref. [15] implemented an image segmentation technique to delineate sub-regions within breast US images, followed by an object recognition pipeline that integrated feature extraction, selection, and classification steps to automatically identify BC-associated areas. Furthermore, ref. [16] proposed an approach for BC image segmentation utilizing semantic classification and patch merging. This method encompassed the cropping of a region of interest (ROI), its enhancement through filtering and clustering techniques, subsequent feature extraction, and final classification via both a neural network and a k-NN classifier.
In [17,18], the researchers developed simple associative classification (AC) models to predict breast cancer disease by using small dataset with just nine features. The study [19,20] also created AC models based on clustering to accurately classify the breast cancer data. The study [21] provided a similar methodology to our current study by showing the effect of data preprocessing in achieving high accuracy, and the experimental assessment was carried out on a EEG signal dataset.
In this study, the importance of data preprocessing for Breast Cancer detection is demonstrated through comprehensive experimental evaluations on 10 state-of-art machine learning models using image-derived features. Firstly, a general feature extraction method is provided (30 features were initially extracted) and classification performance was assessed using standard metrics such as accuracy, precision, recall, and F-measure.
To improve the efficiency and reduce redundancy as well as show the significant features for breast cancer detection, we applied the CFS [22] method to extract highly informative features. Notably, most models maintained or even improved their predictive performance with the reduced feature set. Neural Network (97.2%), SVM (96.9%), and Logistic Regression (96.6%) achieved the highest accuracies. The findings demonstrate that effective feature selection can significantly reduce computational complexity while preserving diagnostic accuracy, highlighting its value in developing reliable and efficient breast cancer detection systems.
The rest of the paper is organized as follows: Section 2 presents the previous works related to our current study. Section 3 describes the methodology of our research work, and a comprehensive experimental evaluation is analyzed in Section 4, followed by a summarization of the study in the last section.

2. Related Works

Prediction is a cornerstone of machine learning, especially in the medical domain [23]. Extensive research has consistently demonstrated the efficacy of machine learning algorithms in various healthcare applications, with a particular focus on Breast Cancer (BC) prediction. The overwhelming majority of these studies report high prediction accuracy, highlighting the significant potential of ML to transform diagnostic and prognostic capabilities in oncology. This strong predictive performance stems from ML’s ability to discern complex patterns and subtle indicators within vast and heterogeneous medical datasets that might be imperceptible to human analysis.
In 2015, ref. [24] conducted a study on breast cancer prediction, employing a suite of machine learning techniques including Support Vector Machines (SVMs), Artificial Neural Networks (ANNs), Naïve Bayes classifiers, and Adaboost. A key aspect of their methodology involved the application of Principal Component Analysis (PCA) for dimensionality reduction, which effectively streamlined the feature space and likely enhanced the efficiency and performance of their predictive models.
In 2020, ref. [25] investigated the prognosis of breast cancer recurrence and patient mortality within 32 months post-surgery, utilizing both Artificial Neural Networks (ANNs) and Support Vector Machines (SVMs). Their findings indicated that the SVM model achieved superior performance, demonstrating an impressive accuracy of 96.86%. This highlights the potential of SVM as a highly effective tool for predicting critical outcomes in breast cancer patients.
Khourdifi [26] conducted a comparative study on the Wisconsin breast cancer dataset, sourced from the UCI Machine Learning Repository, applying four distinct machine learning algorithms: Support Vector Machines (SVMs), Random Forest (RF), Naïve Bayes, and K-Nearest Neighbors (K-NN). The simulations for these algorithms were performed using the Waikato Environment for Knowledge Analysis (Weka) software. Their findings indicated that SVM demonstrated the superior overall performance, excelling in both effectiveness and computational efficiency.
Chaurasia et al. [27] aimed to enhance the accuracy of breast cancer prediction models by employing Naïve Bayes, Radial Basis Function (RBF) network, and J48 algorithms on the Wisconsin Breast Cancer Database (WBCD) for classifying benign and malignant cases. Their findings indicated that Naïve Bayes emerged as the most effective predictor. Similarly, Kumar [28] conducted a performance analysis of data mining algorithms for breast cancer cell detection, utilizing Naïve Bayes, Logistic Regression, and Decision Tree models.
In 2016, Asri et al. [29] conducted a comparative study of various machine learning algorithms such as Support Vector Machine (SVM), Decision Tree (C4.5), Naïve Bayes (NB), and K-Nearest Neighbors (k-NN) for breast cancer risk prediction and diagnosis. Their research utilized the original Wisconsin Breast Cancer dataset. The experimental results demonstrated that SVM yielded the highest accuracy coupled with the lowest error rate, highlighting its superior performance in this diagnostic application.
Ricciardi et al. [30] enhanced the diagnosis of coronary artery disease by employing a combined approach of Principal Component Analysis (PCA) and Linear Discriminant Analysis (LDA). In their methodology, PCA was strategically utilized to generate new, more informative features from the original dataset. These newly derived features were then fed into the LDA model, which performed the classification task, ultimately leading to improved diagnostic accuracy for patients.
Kumar et al. [31] conducted a comprehensive study to predict malignant and benign breast cancer, evaluating the performance of twelve distinct algorithms: Ada Boost M1, Decision Table, J-Rip, J48, Lazy IBK, Lazy K-star, Logistic Regression, Multiclass Classifier, Multilayer Perceptron, Naïve Bayes, Random Forest, and Random Tree. Their analysis, utilizing data from the Wisconsin breast cancer database, revealed that Lazy K and Random Tree algorithms achieved the highest predictive accuracy among the models tested.
Gupta and Gupta [32] conducted a comparative analysis of four widely used machine learning techniques, Multilayer Perceptron (MLP), Decision Tree (C4.5), Support Vector Machine (SVM), and K-Nearest Neighbor (KNN) on the Wisconsin Breast Cancer dataset to predict breast cancer recurrence. Their primary objective was to identify the best classifier among these four, evaluated based on accuracy, precision, and recall. Through their investigation, including the application of 10-fold cross-validation, they concluded that MLP consistently outperformed the other techniques.
Zheng et al. [33] introduced a novel methodology for breast cancer prediction, combining K-means and Support Vector Machine (K-SVM) algorithms with 10-fold cross-validation. This approach notably improved prediction accuracy to 97.38% when tested on the Wisconsin Diagnostic Breast Cancer (WDBC) dataset. Their innovative strategy involved using K-means for the initial separate recognition of hidden patterns within malignant and benign tumors, followed by SVM to construct a new classifier. This unique combination achieved an accuracy of 97.38%, surpassing the performance of six other algorithms evaluated in their study. In a separate study, Sivakami and Saraswathi [34] developed a hybrid DT-SVM model for breast cancer prediction, leveraging a Decision Tree for feature selection and a Support Vector Machine for classification. This approach resulted in an improved breast cancer prediction accuracy of 91%.
Building upon prior advancements, this research endeavors to enhance breast cancer prediction and refine clinical decision support systems. Our methodology integrates and capitalizes on the complementary strengths of a comprehensive array of classification algorithms. Leveraging a retrospective dataset acquired from Tertiary Hospital, the paramount objective is to achieve both superior predictive accuracy and the lowest possible misclassification rate in the data analysis. This exhaustive comparative analysis provides critical insights into establishing the optimal configuration for robust breast cancer prediction.

3. Methodology

The methodology part of this research outlines the procedural stages involved in data gathering, data cleaning, preprocessing, model architecture, and the evaluation metrics to assess model effectiveness. To begin with, a tertiary hospital dataset is gathered and will be preprocessed to guarantee consistency in the data in order to meet the outlined objectives. Subsequently, the model will undergo training with 10 classification models. The diagram illustrating the study’s workflow is shown in Figure 1.
The following subsections discuss each of above-mentioned steps.

3.1. Data Collection and Feature Explanation

This retrospective, descriptive study involved a review of all patient records for biopsies performed at a tertiary hospital between 1 January 2023, and 31 October 2023. Since the study uses retrospective hospital data (Tertiary Hospital dataset), it relied on institutional waivers for secondary research use rather than individual consent, and the data was anonymized. Purposive sampling was used for data collection. Records of patients of all ages (18–66) were included, encompassing those who underwent single or multiple lesion biopsies. The dataset comprises at least four distinct images per patient, encompassing varied laterality (left and right) and views (craniocaudal [CC] and mediolateral oblique [MLO]). Images are diverse in format (JPEG, JPEG2000), size, and type (Monochrome-1, Monochrome-2). Additionally, the dataset includes patient features such as age, implant status, BIRADS assessment, and breast density, which are suitable for classification tasks. This novel dataset, on which our work is based, has not yet been utilized in published research. Exclusion criteria were applied to ensure the study’s focus. Records were excluded if they involved the following:
  • Core-needle breast biopsies not performed under ultrasound guidance.
  • Fine-needle aspiration (FNA).
  • Stereotactic core-needle breast biopsy.
  • Axillary lymph node biopsy.
All biopsies were carried out by senior registrars and consultants. Furthermore, all Breast Imaging Reporting and Data System (BI-RADS) classifications were exclusively made by the consultants.
Data for this study were meticulously recorded in a Microsoft Excel spreadsheet. We collected demographic information for each patient, specifically their age and sex. For every lesion biopsied, the following detailed information was captured:
  • Size: The maximum dimension of the lesion as measured on ultrasound.
  • Number of tissue samples: The total count of tissue samples obtained from the lesion during the biopsy.
  • Needle size: The gauge of the needle used for the biopsy procedure.
  • Imaging modality: Whether the lesion was assessed using both mammography and ultrasound, or ultrasound only.
  • BI-RADS category: The assigned Breast Imaging Reporting and Data System classification.
  • Tissue sample adequacy: A clear indication of whether the obtained tissue sample was sufficient for a definitive histological diagnosis.
  • Histological diagnosis: The final pathological diagnosis of the biopsied tissue.
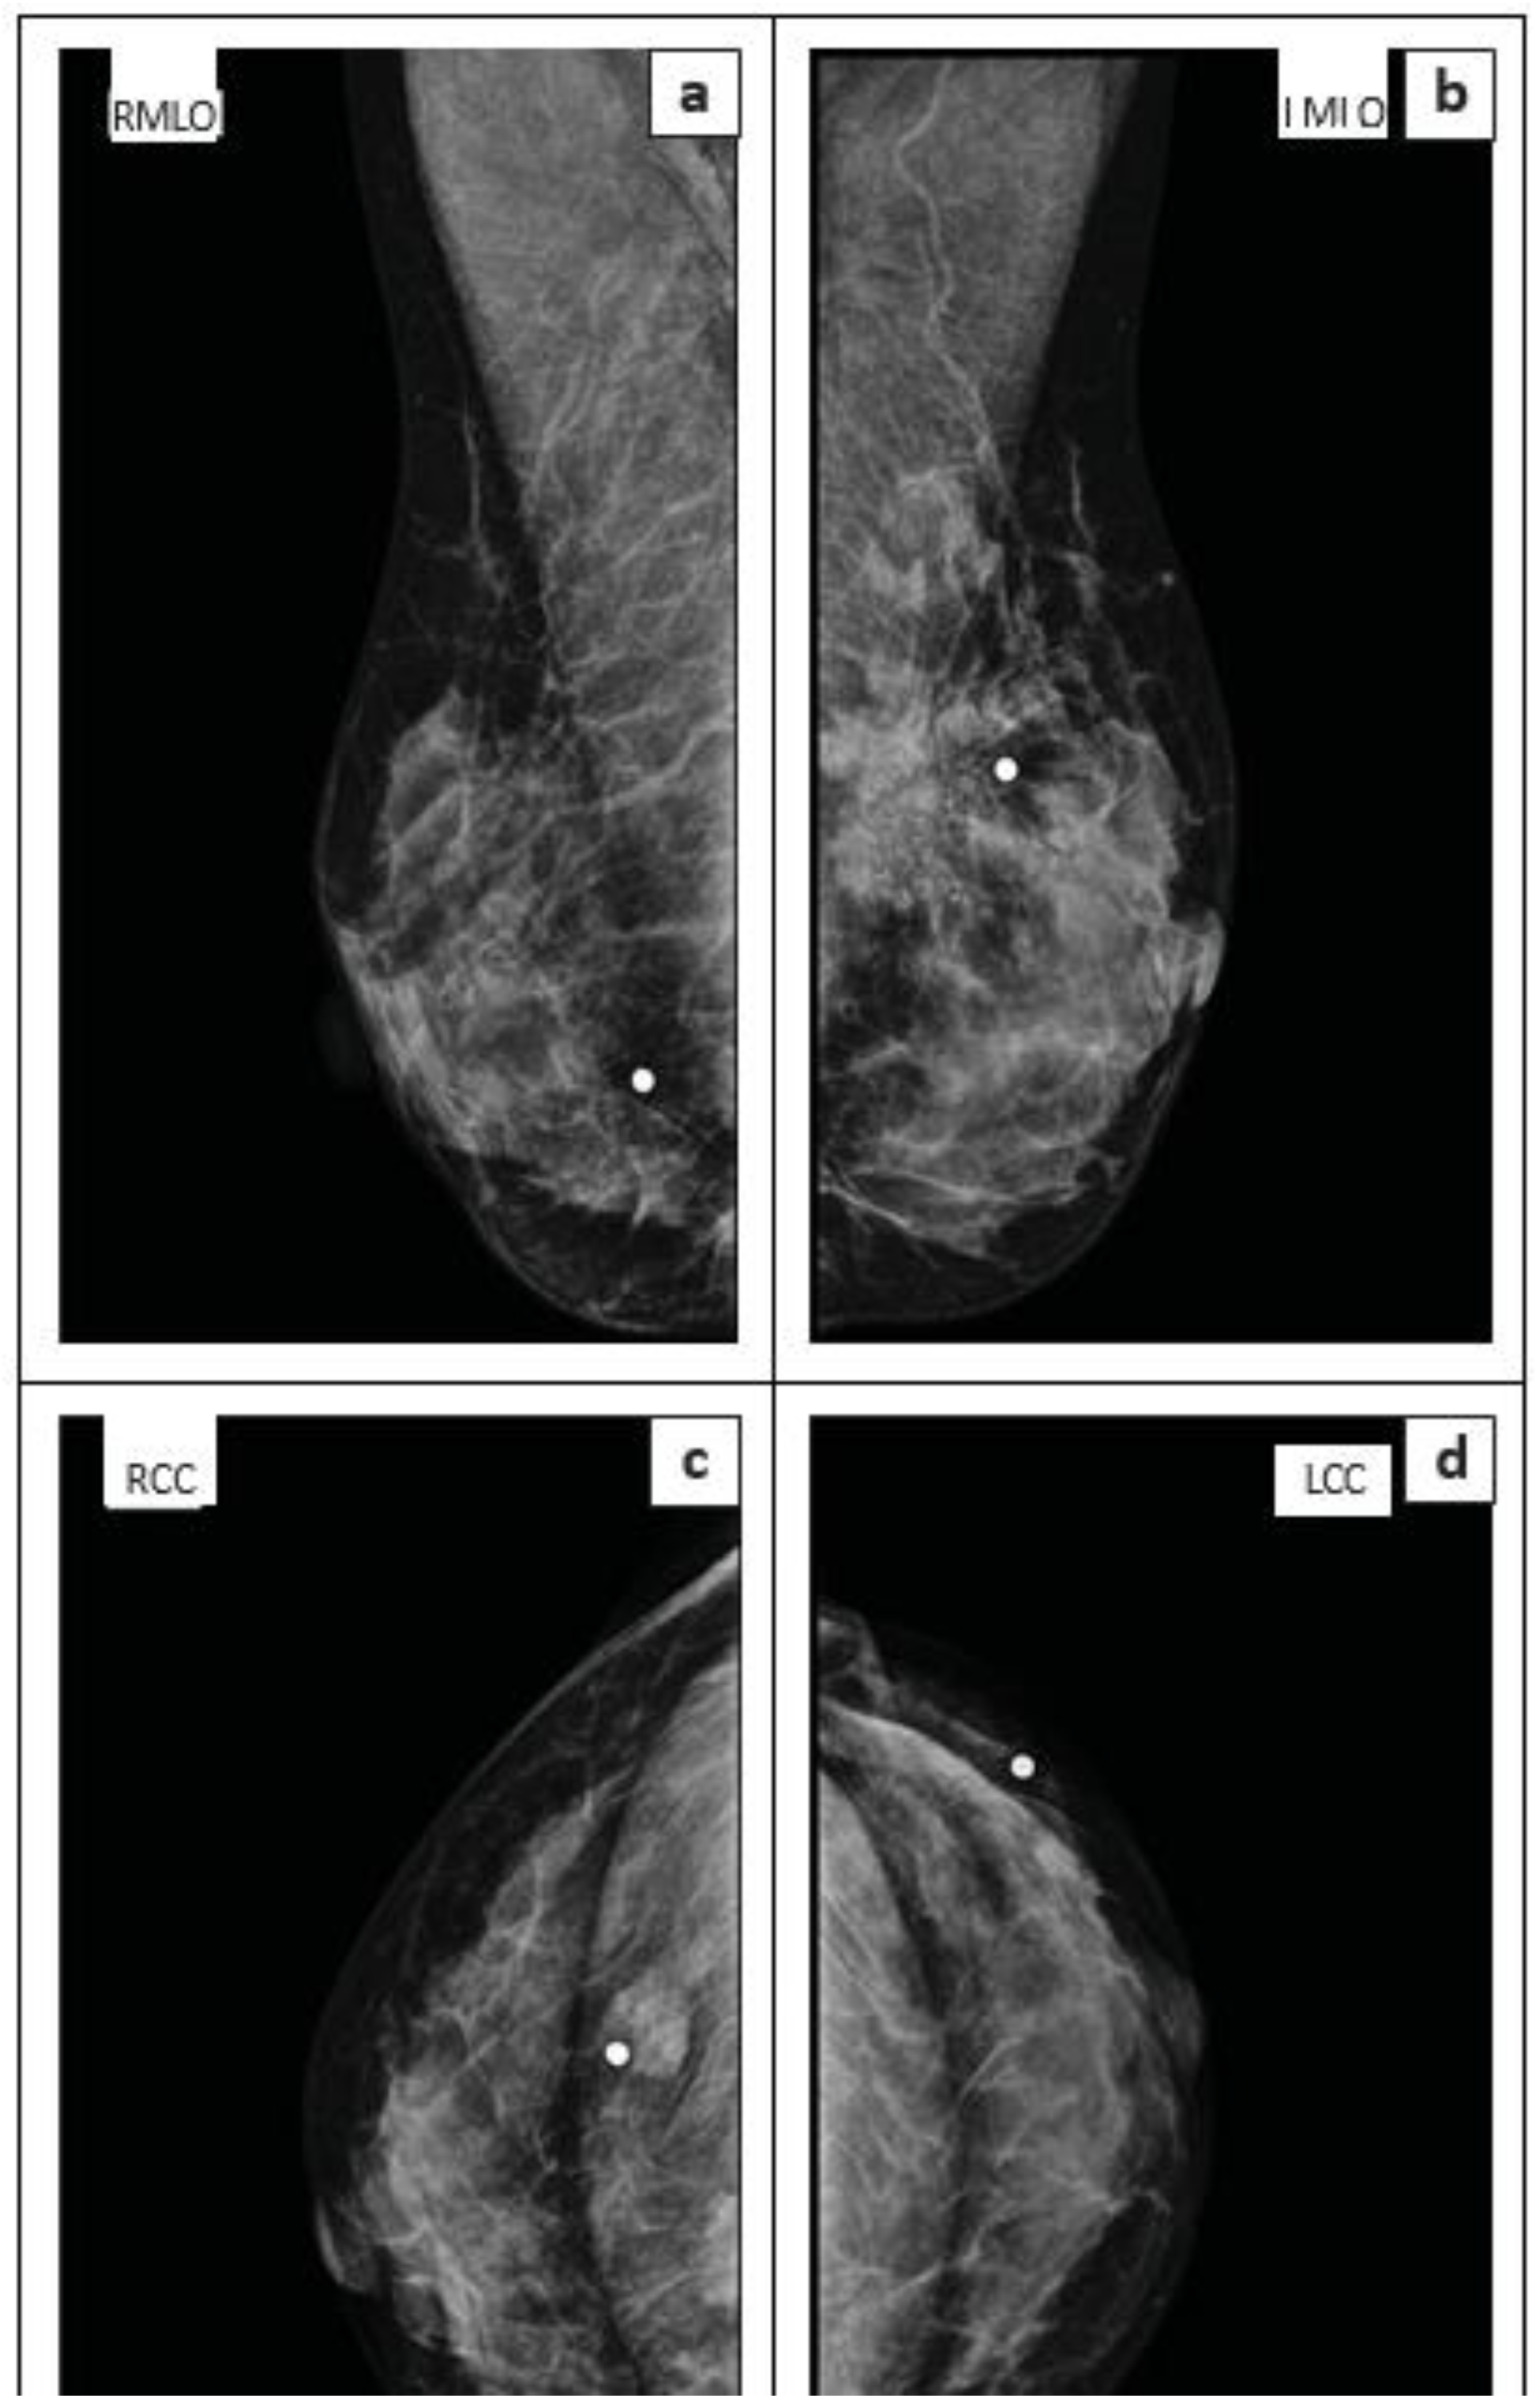
Sample mammogram images (shown in Figure 2), including the right mediolateral oblique (MLO) (a), left MLO (b), right craniocaudal (CC) (c), and left CC (d) views, reveal bilateral breast lumps, as indicated by skin markers at the palpable lesion sites.
In the right breast’s central lower quadrant, a focal soft tissue density is present, accompanied by pleomorphic calcifications. Correspondingly, the ultrasound of this lesion showed a hypoechoic appearance with poorly defined margins and posterior shadowing.
The left breast’s upper outer quadrant displays a larger, more concerning mass: a soft tissue density with spiculated margins, architectural distortion, and pleomorphic calcifications. Ultrasound confirmed that this lesion was also hypoechoic, with poorly defined margins and posterior shadowing.
Mammogram images are converted to an Excel format using FormX.Ai software. The FormX.Ai employs an advanced Optical Character Recognition (OCR), ML, and Large Language Model (LLM) technologies to identify and extract tables and data from images, delivering them as editable Excel files.
For this research, a tertiary hospital dataset was collected, which includes data from 614 patients (361 are identified as benign and 253 as malignant), with each instance containing 32 features. Among these, one will represent the target label (benign or malignant), and another denotes the patient’s identification number, resulting in 30 features available for input into the machine learning models. These characteristics will be obtained from the morphological patterns seen in cell nuclei, which will be drawn from both benign and malignant tumors. Important characteristics like area, perimeter, concavity, compactness, and fractal dimension will be selected to highlight these pathological distinctions.

3.2. Data Preprocessing

Data preprocessing is crucial for enhancing the performance of machine learning models. It processes input data to improve precision and suitability for model training.
In this research, the images sourced from retrospective hospital data (specifically, the Tertiary Hospital dataset) present inherent challenges due to considerable variations in both size and resolution. This necessitates a robust preprocessing pipeline to standardize the image characteristics before further analysis.
(i) Normalization: The retrospective hospital data, specifically from Tertiary Hospital, presented significant variability in image formats, including both 12-bit and 16-bit pixel depths. Furthermore, the dataset contained images with two distinct photometric interpretations: MONOCHROME1, where pixel values ascend from bright to dark, and MONOCHROME2, where values ascend from dark to bright. To ensure uniformity and consistency across the entire Tertiary Hospital dataset, all MONOCHROME1 images were converted to the MONOCHROME2 format.
To further standardize the pixel values, intensity normalization was performed. This critical step involved scaling all pixel values to a uniform range of 0 to 255, effectively converting them to an 8-bit per pixel representation. This comprehensive normalization process ensures that pixel values throughout the dataset are consistent and directly comparable, mitigating the impact of original acquisition variations and preparing the data for robust analysis.
(ii) Region of Interest (ROI) Selection: To accurately delineate the region of interest, our methodology commences with the application of a global thresholding technique to the image. Following this, we precisely extract the contour corresponding to the largest object within the image, which invariably represents the breast area. This identified contour is then used to generate a specific mask. This mask is subsequently applied to the original image, enabling us to crop and effectively isolate the desired region of interest, thereby preparing it for subsequent detailed analysis.
(iii) Image Alignment: Breast cancer datasets inherently contain images categorized by laterality left and right. To foster consistency and improve analytical accuracy, our approach involves aligning all images to a uniform “left” orientation. This is achieved by horizontally flipping all images depicting the right breast. This standardization of laterality ensures a consistent and reliable dataset, which is crucial for robust research and analysis.
(iv) Feature Extraction: Employing traditional image processing methodologies, a suite of pre-defined, interpretable quantitative features was extracted from the designated Regions of Interest (ROIs) within the images. These features often encompassed aspects such as shape, texture, intensity, and statistical distributions. A fundamental requirement for this approach was an initial pre-segmentation phase to precisely isolate the lesion of interest.
To enhance the image quality and prepare for subsequent analysis, several filtering techniques (such as median and bilateral) were applied to reduce noise. Pixel intensities were also scaled to ensure a consistent range across the dataset. A crucial step for mammographic images involved segmenting and excising the pectoral muscle to prevent its interference with comprehensive breast tissue assessment.
Clinical experts, specifically radiologists, were responsible for delineating the Regions of Interest (ROIs). To characterize the intensity distribution of pixels within the ROI, first-order statistical features were extracted. These features describe the intensity patterns without accounting for the spatial arrangement of pixels, and common examples include Mean, Median, Standard Deviation, Variance, Skewness, Kurtosis, Entropy, Maximum, Minimum, Range, and Uniformity.
To comprehensively characterize the intricate textural patterns within the medical images, second-order statistical features were meticulously extracted. These features are crucial for capturing the spatial inter-relationships between pixels, thereby providing a more nuanced description of image texture compared to first-order statistics. The following advanced texture analysis methods were employed:
1. The Gray-Level Co-occurrence Matrix (GLCM) was extensively utilized to quantify the frequency of co-occurrence of pixel intensity pairs at various spatial relationships. By analyzing these matrices, a rich set of features was derived to describe the different aspects of the texture.
2. Gray-Level Run-Length Matrix (GLRLM) was employed to quantify the runs of consecutive pixels that share the same gray level in each direction. This method is particularly effective for characterizing coarse or fine textures, as well as directional patterns.
3. Gray-Level Dependence Matrix (GLDM): The GLDM was utilized to measure the dependence of a pixel on its neighbors. Specifically, it quantifies how many connected voxels within a certain distance and gray-level range are dependent on the central voxel. This matrix yields features that are sensitive to the local homogeneity and heterogeneity of the texture.
The second-order features, when combined, provide a comprehensive quantitative description of the underlying textural characteristics within the breast cancer medical images, which are often indicative of disease pathology.
When analyzing radiomic features from mammography for breast cancer, three key statistical indicators are frequently employed to summarize the quantitative aspects of the lesions. The mean provides the average characteristic of a specific feature within a lesion or across a cohort of lesions. The worst value highlights the most extreme manifestation of a feature, often correlating with diagnostically or prognostically unfavorable attributes. The standard error (SE) quantifies the precision of the calculated mean, indicating the variability and reliability of that average value across the dataset.
Together, these metrics significantly contribute to characterizing breast lesions on mammograms, supporting the crucial differentiation between benign and malignant findings, and offering potential for predicting treatment response and patient outcomes.

3.2.1. Handling Missing Values

It is typical for datasets in the real world to contain missing values. These missing data points can adversely affect model training. Different techniques can be used to tackle this problem, including filling in missing values with the mean, median, or mode of the corresponding feature. This guarantees that the dataset is comprehensive and prepared for analysis. As an important phase in ensuring data quality, an evaluation will be carried out to check for the existence of missing values in the dataset. It is important to note that this assessment clearly confirms that there are no missing values in any of the cases.

3.2.2. Encoding Categorical Variables

Machine learning models necessitate numerical input. Categorical variables, such as “benign” and “malignant,” must therefore be transformed. One-hot encoding is a technique that converts these categorical features into binary (0 or 1) columns. Each unique category becomes a new column, and a ‘1’ is placed in the column corresponding to the category of the original data point, with ‘0’s elsewhere. This process enables machine learning algorithms to effectively process and learn from categorical information.

3.3. Correlation-Based Feature Subset Selection Method

To enhance the efficiency and interpretability of the classification models and to show the significant features for detection of Breast Cancer disease, a second experiment was conducted using the Correlation-based Feature Subset Selection method. The primary motivation for using CFS in this study stems from its ability to evaluate both the individual predictive power of features and the redundancy between them, providing a balanced and interpretable subset of features. This dual consideration is particularly valuable in biomedical datasets, where high inter-feature correlation is common and can lead to overfitting.
The Algorithm 1 takes a dataset D with n features classified into class C as input parameters. The algorithm starts with an empty feature subset, and in each iteration, a new subset is generated by adding one feature to the current subset. It uses a BEST-First search strategy to explore the space of possible feature subsets. Then, it evaluates the “Merit” of a new feature subset using a correlation-based heuristic defined in step 2. If the new subset has a higher “Merit” than the best one found so far, it becomes the new best feature subset and this process continues until a stopping criterion is met defined in step 4. Finally, the subset which achieved the highest merit score is returned as the selected feature subset.
Algorithm 1: A Representative Car Based on Cluster Center (RC)
Input: A dataset D consists of n features with class label C;
Output: An optimal subset of features;
1.Initialization:  S b e s t ,  M e r i t b e s t 0 ;
2.Define. The merit function is defined as follows:
M e r i t S = k × c o r f c k + k × ( k 1 ) × i c o r f f
Where k is the number of features in subset S, c o r f c is the average correlation between features and the class and i c o r f f is the average inter-correlation between features;
3.Perform Best First Search:
(a)
Start with empty subset S ;;
(b)
Expand the subset by adding feature at a time;
(c)
Compute M e r i t S for each candidate subset;
(d)
Retain the subset as S b e s t which achieves the highest Merit ( M e r i t b e s t ).
4.Stop search: If no improvement in Merit(S) for a predefined number of steps is identified;
5.Return: The best subset S b e s t with the highest merit M e r i t b e s t

3.4. Classification Models

In this study, we utilized 10 well-known state-of-the-art classification models. The strong classification models were selected that are commonly used with numeric features. We used the “WEKA” [35] software to run the selected models with default parameters. The performances of the following classification models are evaluated:
C4.5 [36] is a tree-based classifier which generates a pruned or unpruned Decision Tree using information gain. Each path from root to leaf is extracted as a rule; the default confidence factor (0.25) was used for pruning and the minimal number of instances per leaf was set to 2. The subtree raising operation was used to increase the overall accuracy;
Random Forest [37] generates a large number of Decision Trees in training process and outputs the class that is selected by majority of trees. The number of trees in the Random Forest was set to 100 and the maximum depth of each tree was not limited by default.
JRip [38] is a rule-based classifier that employs a propositional rule learning algorithm known as Repeated Incremental Pruning to Produce Error Reduction (RIPPER). The model was used with default settings: pruning was applied, the minimum total weight required for instances covered by a rule was set to 2, and two optimization runs were performed.
K-NN (K-Nearest Neighbor) [39] is an instance-based approach that identifies the k nearest neighbors (with the optimal k determined through cross-validation) and predicts the outcome based on the most frequent class among those neighbors. The Euclidean metric was used to find the distance.
KStar [40] is an instance-based classifier, which means it classifies a test instance by comparing it to similar training instances, using an entropy-based distance function to determine similarity. The global blending parameter was put to 20, and missing values were replaced with average column entropy curves by default.
ANN (Artificial Neural Network) [41] is a flexible model that learns from data through a network of interconnected nodes, or neurons, arranged in layers. It uses backpropagation to train a multi-layer perceptron for classifying instances. Specifically, the ANN was implemented using the WEKA software with the following settings: Number of hidden layers: 1; Number of neurons: The number of neurons in the hidden layer was set to (number of input features + number of classes)/2, following standard WEKA heuristics; Activation function: Sigmoid activation function was used in the hidden and output layers; Training epochs: 500 iterations; Optimizer: Gradient Descent method as implemented in WEKA’s Multilayer Perceptron classifier; Loss function: Cross-entropy was minimized through backpropagation.
SVM (Support Vector Machine) [42] utilizes John Platt’s sequential minimal optimization approach to train a support vector classifier. In this implementation, missing values are automatically handled, nominal attributes are converted into binary format, and all features are normalized by default. Radial Basis Function (RBF) kernel was used, as it is commonly effective for nonlinear classification problems like breast cancer detection.
Logistic Regression [43] is a classifier used to build and apply a multinomial Logistic Regression model incorporating a ridge regularization technique. Logistic Regression was implemented using the WEKA software with the following configuration: Optimization Method: Iterative Maximum Likelihood Estimation was used to estimate model parameters; Regularization: Ridge (L2) regularization was applied to prevent overfitting; Ridge Parameter: Set to 1.0 × 10⁻⁸, controlling the strength of regularization (default WEKA value); Input Normalization: Features were standardized (zero mean, unit variance) before model training, as per WEKA’s automatic preprocessing in Logistic Regression.
Naïve Bayes [44] is a probabilistic model which uses estimator classes. Numeric estimator precision values are selected based on the training data. WEKA’s default kernel density estimation was enabled to improve the probability estimates for numeric attributes.
Bagging [45] is a classifier which uses a Decision Tree as a base learner and it aims to reduce the variance. The Bagging classifier was implemented using WEKA’s default Bagging meta-classifier with the following settings: Base Classifier: DecisionStump was used as the base classifier following WEKA’s default configuration; Number of Iterations (Bagging Size): Set to 10 iterations, meaning 10 bootstrap samples were generated to train 10 individual models; Bag Size Percentage: 100% of the training data was sampled with replacement for each iteration; Random Seed: Set to 1 to ensure reproducibility across experiments; Standard bootstrap sampling with replacement was used to create diverse subsets of training data.

4. Results

In this study, 10 state-of-the-art classification algorithms defined in Section 3.2 were assessed for the detection of breast cancer, with the performance assessed through four key metrics: accuracy, precision, recall, and F-measure. The models were tested on comprehensively preprocessed 30 image-derived features and 11 image-derived features datasets using the 10-fold cross-validation evaluation protocol. Since we generate one image (one sample) for each patient, there is no overfitting on the train/test split. The performance of models on 30 image-derived features dataset is shown in Table 1. The best result is marked with bold and the worst result is underlined.
Among the models, SVM and Logistic Regression demonstrated the highest overall *classification accuracy of 97.7%, closely followed by Random Forest with 97.6%, indicating strong general performance in distinguishing between malignant (Class M) and benign (Class B) tumors.
Precision, which reflects the proportion of true positive predictions among all positive predictions, was notably high in SVM and Logistic Regression for Class M (99.2%) and Class B (96.6–96.8%), indicating that these models made highly reliable predictions. Recall, which measures the ability to identify all relevant instances, reached the highest values in Random Forest (96.8% for Class M, 98.1% for Class B) and Logistic Regression and SVM (both with 99.4% for Class B), suggesting their effectiveness in detecting most true cases of breast cancer.
In contrast, Naïve Bayes showed relatively lower scores across all metrics, reflecting limitations in handling the complexity of image-based cancer features. These comprehensive evaluations underscore the potential of ensemble and kernel-based methods in achieving high diagnostic accuracy and reliability in breast cancer classification.
The statistical significance testing (shown in Table 2) between classification models on a 30-feature dataset was performed using corrected paired t-tests at a 95% confidence level. “W” indicates the selected (raw) model which significantly outperforms the compared model (column). “L” indicates selected (raw) model performs significantly worse than the compared model (column) at a significance level of p < 0.05. Cells with “0” represent cases where no statistically significant difference were observed.
Table 2 reveals that Random Forest, SVM, and Neural Network were the most consistently effective models, achieving the highest number of statistically significant wins over other classifiers. Random Forest significantly outperformed the other six models, including Bagging, Naïve Bayes, Ripper, K-NN, C4.5, and KStar. Both SVM and Neural Network similarly secured multiple wins against weaker classifiers.
Logistic Regression demonstrated a competitive performance, showing statistically significant wins against Naïve Bayes, Ripper, and c4.5, and showing no significant losses to higher-performing models. In contrast, Naïve Bayes and c4.5 recorded the highest number of losses, being statistically outperformed by the majority of other models.
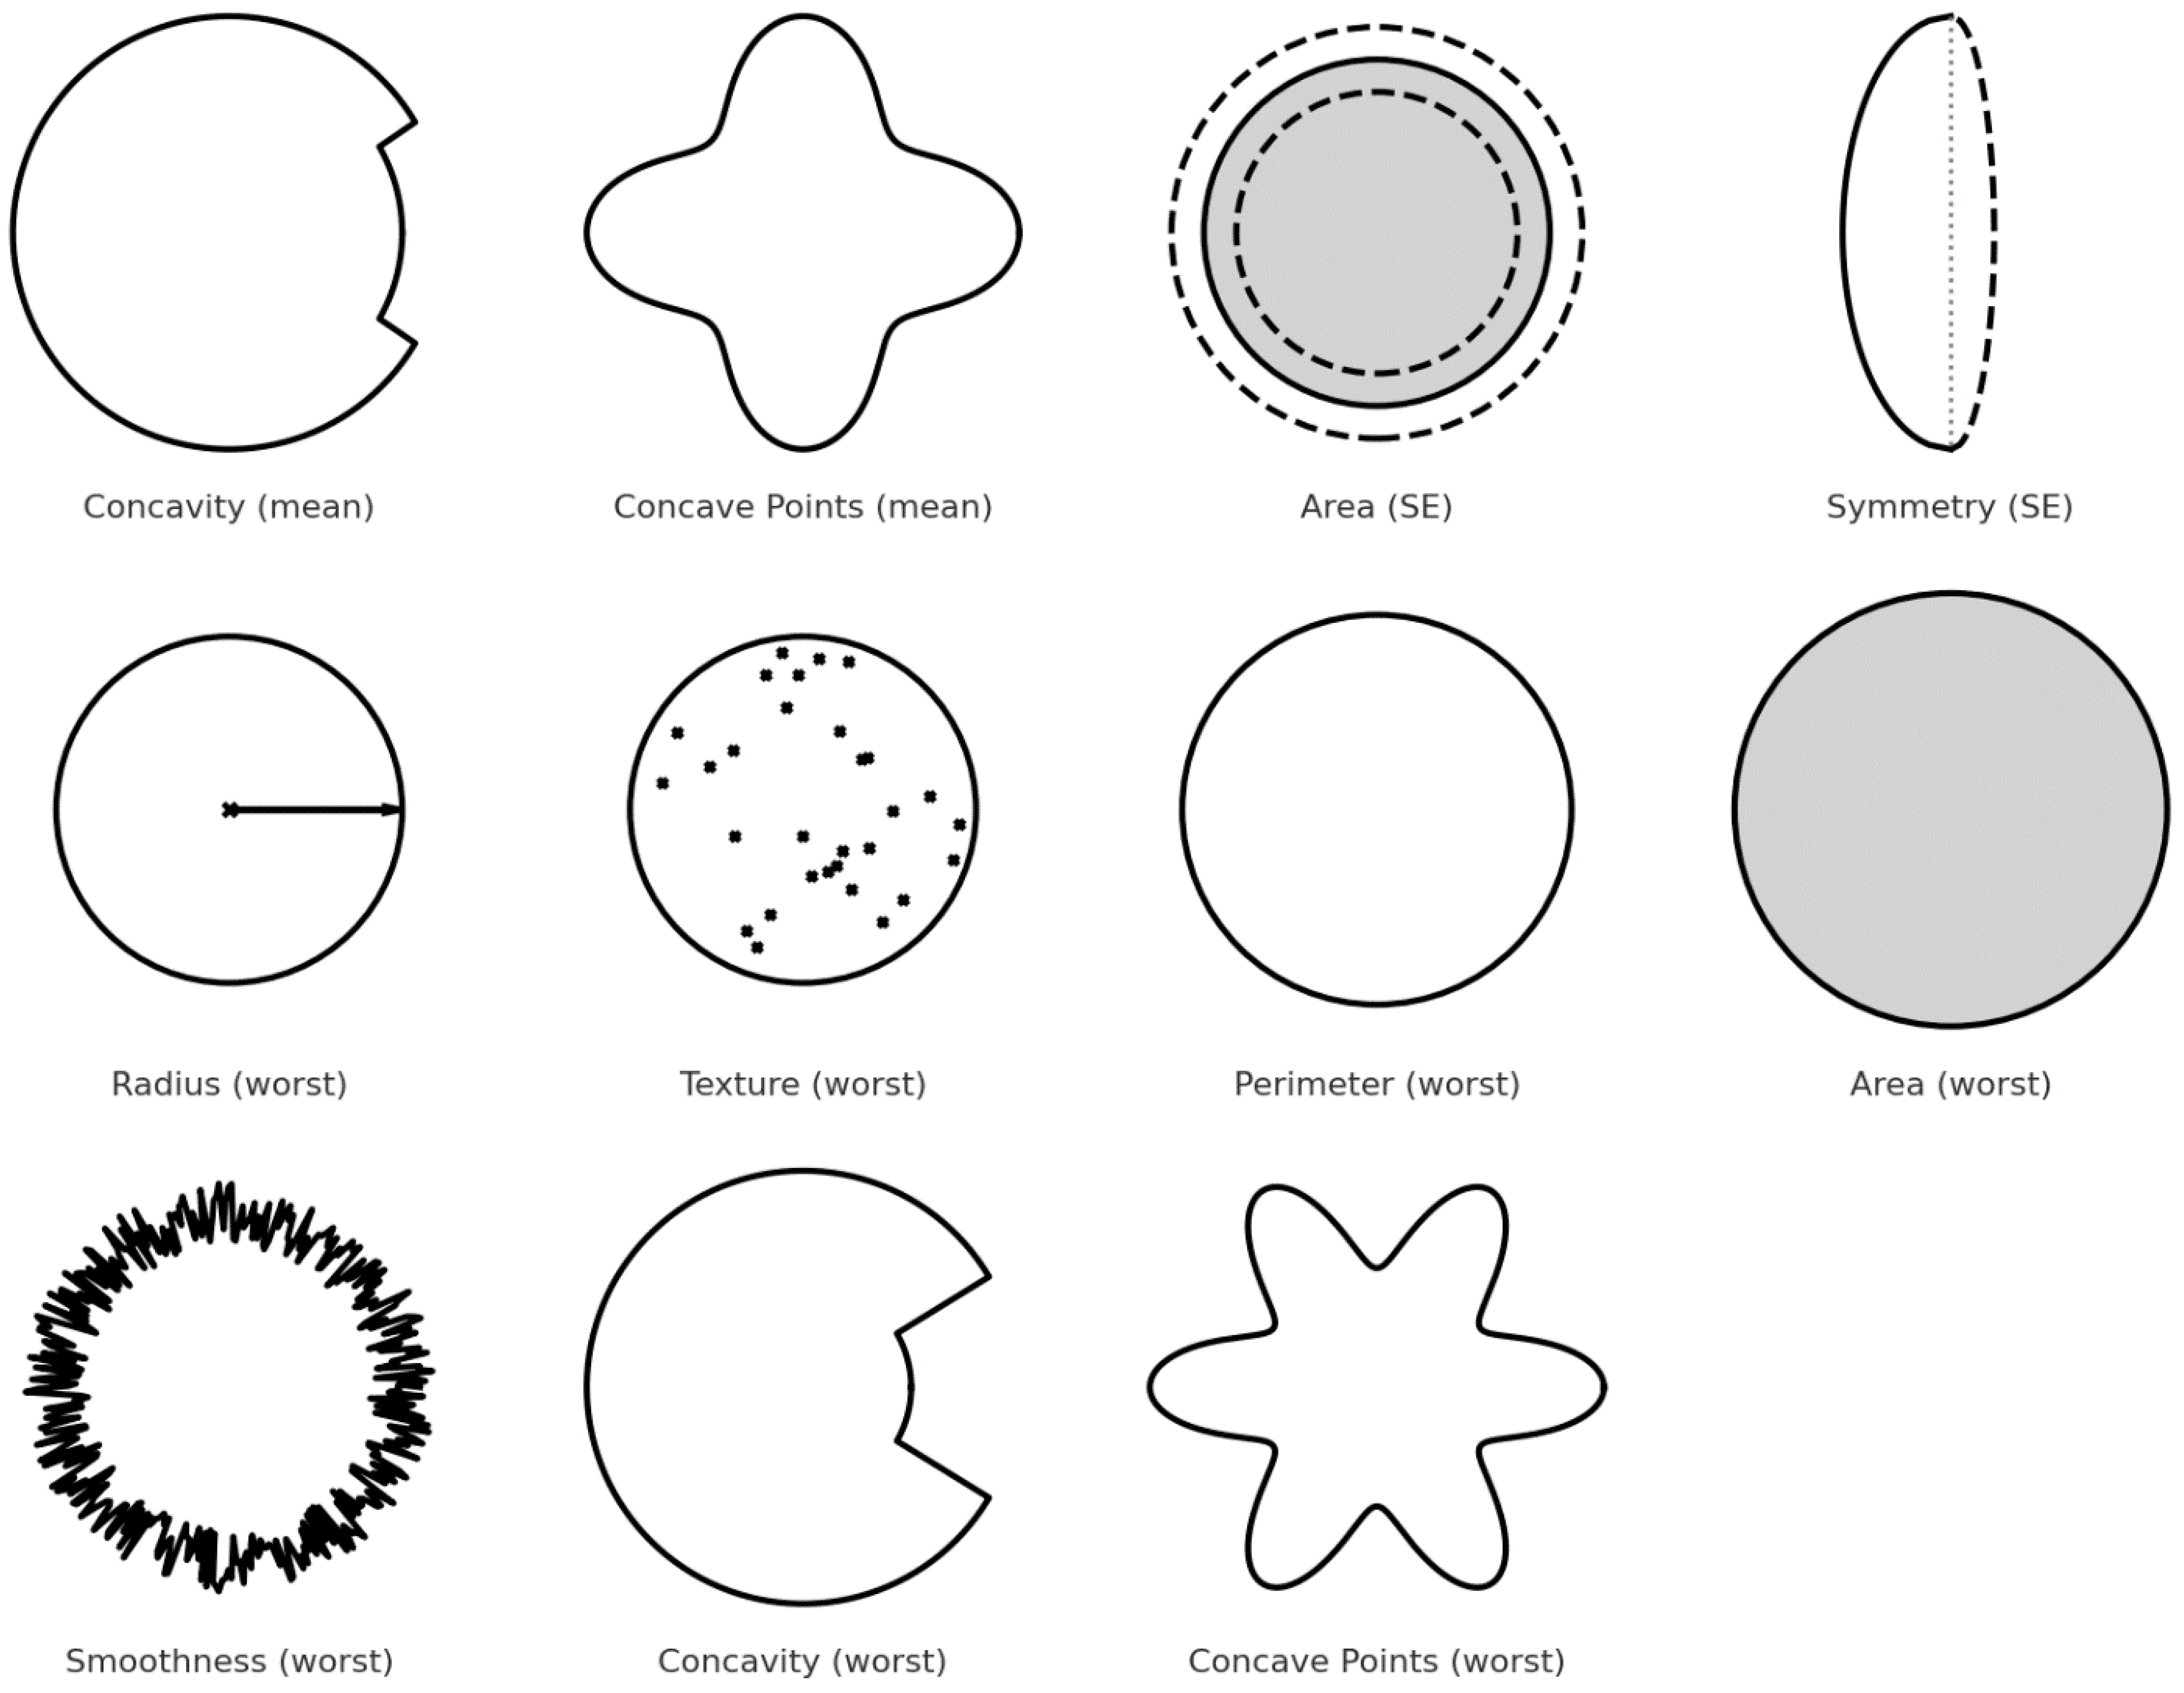
We extracted a more compact and effective feature subset from the original dataset by applying the CFS method described in Section 3.2 for breast cancer detection. The description of selected features is illustrated in Figure 3.
The detailed description and the importance of selected features shown in Figure 2 are provided in Table 3.
CFS identifies features that have a strong statistical relationship with the breast cancer diagnosis. This is the fundamental starting point for any biomarker discovery. If a feature is not selected by CFS, it is likely not independently predictive or is highly redundant with a more predictive feature, suggesting that it might not be a strong candidate for biological or clinical significance.
To manifest the importance and effectiveness of the feature selection method, the performance of machine learning models was re-evaluated using a reduced subset of 11 significant features shown in Table 4.
Table 4 presents that all models maintained high classification performance despite the reduced dimensionality. Notably, the Neural Network model achieved the highest overall accuracy of 97.2%, followed by SVM (96.9%) and Logistic Regression (96.6%), proving their robustness even with fewer input features. All models except Logistic Regression, SVM, and Random Forest gained slightly better accuracies on the 11-feature dataset compared to the 30-feature dataset.
Precision, recall, and F-measure values also remained high for all models, particularly for SVM and the neural network, where both classes (malignant and benign) were predicted with strong consistency. This demonstrates that the selected 11 features express the most relevant information for accurate classification, enabling efficient and effective breast cancer detection.
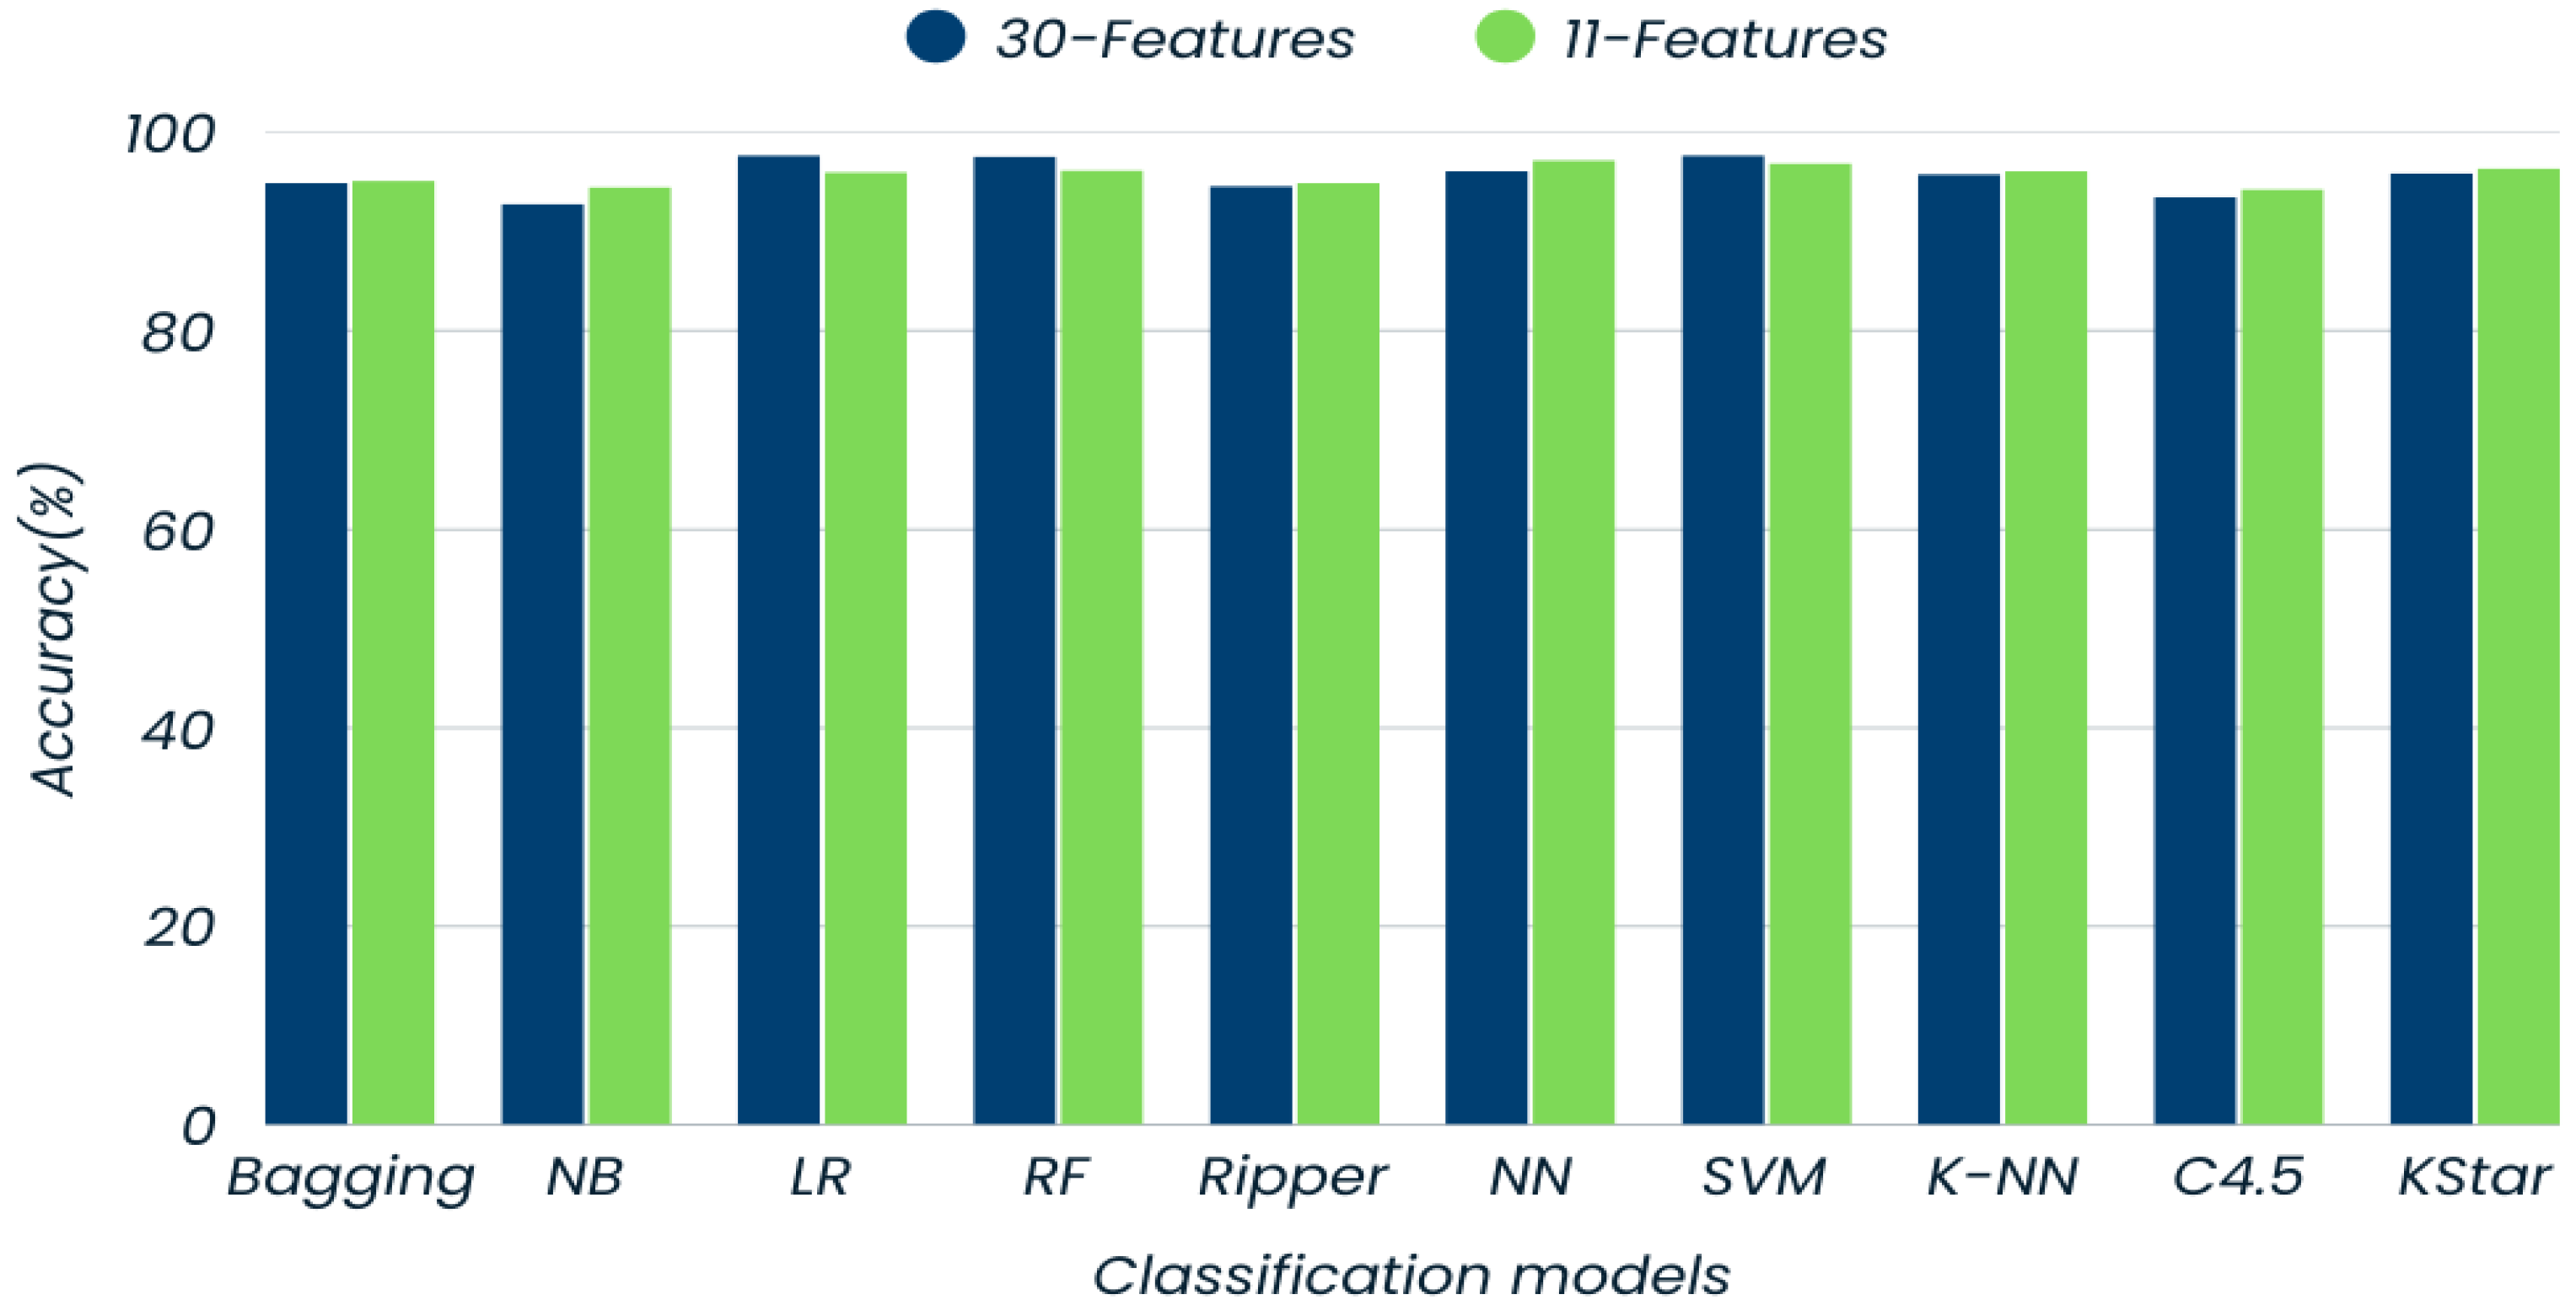
The resulting subset maintained or even improved the performance of several classifiers in terms of classification accuracy shown in Figure 4.
Figure 4 shows a comparison of models in terms of classification accuracies on two datasets: one with the full set of 30 features and another with a reduced subset of 11 features. The results demonstrate that most models exhibit only a slight difference in performance between the two feature sets. In particular, the Neural Network, SVM, and Logistic Regression achieved high accuracy even after dimensionality reduction, highlighting their effectiveness and robustness. Other models also achieved similar accuracies on the 11-feature dataset, which means that the selected 11 features capture the most critical aspects of the data, allowing for efficient breast cancer classification. The statistical significance testing between classification models on an 11-feature dataset is shown in Table 5.
Table 5 highlights that the Neural Network, SVM, and Logistic Regression showed the strongest performances relative to other models. The Neural Network significantly outperformed Bagging, Naïve Bayes, and Ripper, while SVM achieved similar significant wins compared to Bagging, Naïve Bayes, and Ripper. Logistic Regression obtained wins over Naïve Bayes and Ripper, while maintaining competitive performance against all other models. Random Forest displayed consistent performance but had no statistically significant wins or losses, suggesting stable but non-dominant behavior.
To show the efficiency of feature reduction on computational complexity, we performed the runtime analysis on 30-feature and 11-feature datasets illustrated in Table 6.
Table 6 presents the training time of ten classification models on both the 30-feature and 11-feature datasets. The results show that reducing the number of features consistently decreased the training time across almost all models. Notably, the Neural Network model showed the most significant reduction in computational time, decreasing from 1.67 s on the 30-feature dataset to 0.32 s on the 11-feature dataset, reflecting a substantial improvement in training efficiency. This ratio can be even bigger on larger datasets. These results demonstrate that feature selection improves computational efficiency, making the models more suitable for faster resource-efficient applications on larger datasets.

5. Conclusions

This study presented a comprehensive evaluation of 10 state-of-the-art machine learning models for breast cancer classification using image-derived features. The primary objective was to assess the effectiveness of these models in distinguishing between benign and malignant tumors and to explore the impact of feature reduction on classification performance. Initially, 30 image-derived features were extracted from the Tertiary Hospital dataset, and the models were tested using the 10-fold cross-validation method. Among the classifiers, SVM and Logistic Regression demonstrated the highest classification accuracy of 97.7%, closely followed by Random Forest with 97.6%, highlighting their strong predictive capabilities.
To improve model efficiency and reduce computational complexity, the Correlation-based Feature Selection (CFS) method was employed, resulting in a reduced set of 11 highly informative features. Models were re-tested on this 11-feature dataset, the Neural Network achieved the highest accuracy of 97.2%, followed by SVM (96.9%) and Logistic Regression (96.6%), confirming the robustness and adaptability of these models even with fewer input features. The results demonstrated that most classifiers retained or achieved better results in terms of classification accuracy after feature reduction, proving that the selected features effectively capture the most relevant diagnostic information.
The study limitations include reliance on a single dataset, which may limit generalizability due to potential variations in patient demographics and imaging methods. Additionally, while 30 image-derived features were used, their specifics (e.g., texture-based or deep learning-extracted) were not detailed, affecting reproducibility. The Correlation-based Feature Selection (CFS) method may also be restrictive, as it prioritizes linear relationships and could exclude valuable nonlinear feature interactions.
Overall, the study states the significant role of machine learning in improving breast cancer detection and underscores the importance of feature selection in enhancing model accuracy while minimizing computational overhead. Future work will focus on incorporating explainable AI techniques to provide greater transparency and interpretability in model predictions, which is critical for clinical adoption.

Author Contributions

Conceptualization, J.M. and V.B.; methodology, J.M. and V.B.; software, J.M.; validation, J.M.; formal analysis, J.M., V.B. and S.M.; resources, S.M. and V.B.; writing—original draft preparation, J.M. and V.B.; writing—review and editing, J.M., V.B. and S.M.; supervision, J.M.; funding acquisition, J.M., V.B. and S.M. All authors have read and agreed to the published version of the manuscript.

Funding

Jamolbek Mattiev acknowledges funding by the Agency for “Innovative Development” of the Republic of Uzbekistan; grant: UZ-N39. Vekani Baloyi and Sello Mokwena acknowledge University of Limpopo for financial support and the availability of computer resources.

Institutional Review Board Statement

The study was conducted in accordance with the Declaration of Helsinki, and approved by the Ethics Committee) of University of Limpopo as project number TREC/869/2023: PG. The Turfloop Research Ethics Committee (TREC) is registered with the National Health Research Ethics Council, Registration Number: REC-0310111-031.

Informed Consent Statement

Not applicable.

Data Availability Statement

The data will be available upon request. Due to the sensitive nature of the data, we could not make it readily available.

Conflicts of Interest

The authors declare no conflicts of interest.

Abbreviations

The following abbreviations are used in this manuscript:
CFSCorrelation-based Feature Selection
MRIMagnetic Resonance Imaging
MLMachine Learning
DLDeep Learning
ACAssociative Classification
SVMSupport Vector Machine
CNNConvolutional Neural Network
KNNK-Nearest Neighbor
NBNaïve Bayes
mRMRMinimum Redundancy Maximum Relevance
CADComputer-Aided Diagnosis
USUltrasound
BCBreast Cancer
ROIRegion of Interest
DDSMDigital Database for Screening Mammography
MLOMediolateral Oblique
VGGVisual Geometry Group
ANNArtificial Neural Networks
PCAPrincipal Component Analysis
RFRandom Forest
WBSDWisconsin Breast Cancer Database
RBFRadial Basis Function
LRLogistic Regression
LDALinear Discriminant Analysis
MLPMultilayer Perceptron
FNAFine-Needle Aspiration
BI-RADSBreast Imaging Reporting and Data System
OCROptical Character Recognition
LLMLarge Language Model
GLCMGray-Level Co-occurrence Matrix
GLRLMGray-Level Run-Length Matrix
GLDMGray-Level Dependence Matrix

References

  1. Ferlay, J.; Colombet, M.; Soerjomataram, I.; Parkin, D.M.; Piñeros, M.; Znaor, A.; Bray, F. Cancer statistics for the year 2020: An overview. Int. J. Cancer 2021, 149, 778–789. [Google Scholar] [CrossRef]
  2. Lei, S.; Zheng, R.; Zhang, S.; Wang, S.; Chen, R.; Sun, K.; Zeng, H.; Zhou, J.; Wei, W. Global patterns of breast cancer incidence and mortality: A population-based cancer registry data analysis from 2000 to 2020. Cancer Commun. 2021, 41, 1183–1194. [Google Scholar] [CrossRef]
  3. Marks, J.S.; Lee, N.C.; Lawson, H.W.; Henson, R.; Bobo, J.K.; Kaeser, M.K. Implementing recommendations for the early detection of breast and cervical cancer among low-income women. Morb. Mortal. Wkly. Rep. Recomm. Rep. 2000, 49, 35–55. [Google Scholar]
  4. Du-Crow, E. Computer-Aided Detection in Mammography. Ph.D. Thesis, The University of Manchester, Manchester, UK, 1 August 2022. [Google Scholar]
  5. Evans, A.; Trimboli, R.M.; Athanasiou, A.; Balleyguier, C.; Baltzer, P.A.; Bick, U.; Herrero, J.C.; Clauser, P.; Colin, C.; Cornford, E.; et al. Breast ultrasound: Recommendations for information to women and referring physicians by the European Society of Breast Imaging. Insights Imaging 2018, 9, 449–461. [Google Scholar] [CrossRef]
  6. Schueller, G.; Schueller-Weidekamm, C.; Helbich, T.H. Accuracy of ultrasound-guided, large-core needle breast biopsy. Eur. Radiol. 2008, 18, 1761–1773. [Google Scholar] [CrossRef]
  7. Shi, X.; Liang, C.; Wang, H. Multiview robust graph-based clustering for cancer subtype identification. IEEE/ACM Trans. Comput. Biol. Bioinform. 2022, 20, 544–556. [Google Scholar]
  8. Wang, H.; Jiang, G.; Peng, J.; Deng, R.; Fu, X. Towards Adaptive Consensus Graph: Multi-view Clustering via Graph Collaboration. IEEE Trans. Multimed. 2022, 25, 6629–6641. [Google Scholar] [CrossRef]
  9. Wang, H.; Wang, Y.; Zhang, Z.; Fu, X.; Zhuo, L.; Xu, M.; Wang, M. Kernelized multiview subspace analysis by self-weighted learning. IEEE Trans. Multimed. 2020, 23, 3828–3840. [Google Scholar] [CrossRef]
  10. Wang, H.; Yao, M.; Jiang, G.; Mi, Z.; Fu, X. Graph-Collaborated Auto-Encoder Hashing for Multi-view Binary Clustering. arXiv 2023, arXiv:2301.02484. [Google Scholar]
  11. Bai, J.; Posner, R.; Wang, T.; Yang, C.; Nabavi, S. Applying deep learning in digital breast tomosynthesis for automatic breast cancer detection: A review. Med. Image Anal. 2021, 71, 102049. [Google Scholar] [CrossRef]
  12. Li, Z.; Liu, F.; Yang, W.; Peng, S.; Zhou, J. A survey of convolutional neural networks: Analysis, applications, and prospects. IEEE Trans. Neural Netw. Learn. Syst. 2022, 33, 6999–7019. [Google Scholar] [CrossRef]
  13. Zuluaga-Gomez, J.; Al Masry, Z.; Benaggoune, K.; Meraghni, S.; Zerhouni, N. A CNN-based methodology for breast cancer diagnosis using thermal images. Comput. Methods Biomech. Biomed. Eng. Imaging Vis. 2021, 9, 131–145. [Google Scholar] [CrossRef]
  14. Eroğlu, Y.; Yildirim, M.; Çinar, A. Convolutional Neural Networks based classification of breast ultrasonography images by hybrid method with respect to benign, malignant, and normal using mRMR. Comput. Biol. Med. 2021, 133, 104407. [Google Scholar] [CrossRef]
  15. Huang, Q.; Yang, F.; Liu, L.; Li, X. Automatic segmentation of breast lesions for interaction in ultrasonic computer-aided diagnosis. Inf. Sci. 2015, 314, 293–310. [Google Scholar] [CrossRef]
  16. Huang, Q.; Huang, Y.; Luo, Y.; Yuan, F.; Li, X. Segmentation of breast ultrasound image with semantic classification of superpixels. Med. Image Anal. 2020, 61, 101657. [Google Scholar] [CrossRef]
  17. Mattiev, J.; Kavšek, B. Simple and Accurate Classification Method Based on Class Association Rules Performs Well on Well-Known Datasets. In Machine Learning, Optimization, and Data Science, Proceedings of the 5th International Conference, LOD 2019, Siena, Italy, 10–13 September 2019; Springer: Berlin/Heidelberg, Germany, 2019; pp. 192–204. [Google Scholar]
  18. Mattiev, J.; Kavšek, B. CMAC: Clustering Class Association Rules to Form a Compact and Meaningful Associative Classifier. In Machine Learning, Optimization, and Data Science, Proceedings of the 6th International Conference, LOD 2020, Siena, Italy, 19–23 July 2020; Springer: Berlin/Heidelberg, Germany, 2020; pp. 372–384. [Google Scholar]
  19. Mattiev, J.; Davityan, M.; Kavsek, B. ACMKC: A Compact Associative Classification Model Using K-Modes Clustering with Rule Representations by Coverage. Mathematics 2023, 11, 3978. [Google Scholar] [CrossRef]
  20. Mattiev, J.; Kavsek, B. Distance based clustering of class association rules to build a compact, accurate and descriptive classifier. Comput. Sci. Inf. Syst. 2021, 18, 791–811. [Google Scholar] [CrossRef]
  21. Mattiev, J.; Sajovic, J.; Drevenšek, G.; Rogelj, P. Assessment of Model Accuracy in Eyes Open and Closed EEG Data: Effect of Data Pre-Processing and Validation Methods. Bioengineering 2023, 10, 42. [Google Scholar] [CrossRef]
  22. Hall, M.A. Correlation-Based Feature Subset Selection for Machine Learning. Ph.D. Thesis, The University of Waikato, Hamilton, New Zealand, April 1998. [Google Scholar]
  23. Jessica, E.O.; Hamada, M.; Yusuf, S.I.; Hassan, M. The Role of Linear Discriminant Analysis for Accurate Prediction of Breast Cancer. In Proceedings of the 2021 IEEE 14th International Symposium of Embedded Multicore/Many-Core Systems-on-Chip (MCSoc), Singapore, 20–23 December 2021; pp. 340–344. [Google Scholar]
  24. Wang, H.; Yoon, S.W. Breast Cancer Prediction Using Data Mining Method. In Proceedings of the IIE Annual Conference, Institute of Industrial and System Engineers (IISE), New Orleans, LA, USA, 30 May–2 June 2015; p. 818. [Google Scholar]
  25. Boeri, C.; Chiappa, C.; Galli, F.; de Berardinis, V.; Bardelli, L.; Carcano, G.; Rovera, F. Machine learning techniques in breast cancer prognosis prediction: A primary evaluation. Cancer Med. 2020, 9, 3234–3243. [Google Scholar] [CrossRef]
  26. Khourdifi, Y. Applying Best Machine Learning Algorithms for Breast Cancer Prediction and Classification. In Proceedings of the 2018 International Conference on Electronics, Control, Optimization and Computer Science (ICECOCS), Kenitra, Morocco, 5–6 December 2018; pp. 1–5. [Google Scholar]
  27. Chaurasia, V.; Pal, S.; Tiwari, B.B. Prediction of benign and malignant breast cancer using data mining techniques. J. Algorithms Comput. Technol. 2018, 12, 119–126. [Google Scholar] [CrossRef]
  28. Kumar Mandal, S. Performance Analysis of Data Mining Algorithms for Breast Cancer Cell Detection Using Naïve Bayes, Logistic Regression and Decision Tree. Int. J. Eng. Comput. Sci. 2017, 6, 2319–7242. [Google Scholar]
  29. Asri, H.; Mousannnif, H.; al Moatassime, H.; Noel, T. Using machine learning algorithms for breast cancer risk prediction and diagnosis. Procedia Comput. Sci. 2016, 83, 1064–1069. [Google Scholar] [CrossRef]
  30. Ricciardi, C.; Valente, S.A.; Edmund, K.; Cantoni, V.; Green, R.; Fiorillo, A.; Picone, I.; Santini, S.; Cesarelli, M. Linear discriminant analysis and principal component analysis to predict coronary artery disease. Health Inform. J. 2020, 26, 2181–2192. [Google Scholar] [CrossRef]
  31. Kumar, V.; Misha, B.K.; Mazzara, M.; Thanh, D.N.; Verma, A. Prediction of malignant and benign breast cancer: A data mining approach in healthcare applications. In Advances in Data Science and Management; Springer: Berlin/Heidelberg, Germany, 2019; pp. 435–442. [Google Scholar]
  32. Gupta, S.; Gupta, M.K. A Comparative Study of Breast Cancer Diagnosis Using Supervised Machine Learning Techniques. In Proceedings of the 2nd International Conference on Computing Methodologies and Communication (ICCMC 2018), Erode, India, 15–16 February 2018; IEEE: Piscataway, NJ, USA, 2018; pp. 997–1002. [Google Scholar]
  33. Zheng, B.; Yoon, S.W.; Lam, S.S. Breast cancer diagnosis based on feature extraction using a hybrid of k-mean and support vector machine algorithms. Experts Syst. Appl. 2014, 41, 1476–1482. [Google Scholar] [CrossRef]
  34. Sivakami, K.; Saraswathi, N. Mining big data: Breast cancer prediction using DT-SVM hybrid model. Int. J. Sci. Eng. Appl. Sci. 2015, 1, 418–429. [Google Scholar]
  35. Hall, M.; Frank, E.; Holmes, G.; Pfahringer, B.; Reutemann, P.; Witten, I.H. The WEKA data mining software: An update. ACM SIGKDD Explor. Newsl. 2009, 11, 10–18. [Google Scholar] [CrossRef]
  36. Quinlan, R.J. C4.5: Programs for Machine Learning, 1st ed.; Morgan Kaufmann: Burlington, MA, USA, 1992. [Google Scholar]
  37. Breiman, L. Random Forests. Mach. Learn. 2001, 45, 5–32. [Google Scholar] [CrossRef]
  38. Cohen, W.W. Fast effective rule induction. In Proceedings of the Twelfth International Conference on Machine Learning, Tahoe City, CA, USA, 9–12 July 1995; pp. 115–123. [Google Scholar]
  39. Aha, D.W.; Kibler, D.; Albert, M.K.; Quinian, J.R. Instance-based learning algorithms. Mach. Learn. 1991, 6, 37–66. [Google Scholar] [CrossRef]
  40. Cleary, J.G.; Trigg, L.E. K*: An Instance-based Learner Using an Entropic Distance Measure. In Proceedings of the Twelfth International Conference on Machine Learning, Tahoe City, CA, USA, 9–12 July 1995; pp. 108–114. [Google Scholar]
  41. Haykin, S. Neural Networks: A Comprehensive Foundation, 2nd ed.; Prentice Hall: Hamilton, ON, Canada, 1994. [Google Scholar]
  42. Platt, J. Fast Training of Support Vector Machines using Sequential Minimal Optimization. In Advances in Kernel Methods—Support Vector Learning; MIT Press: Cambridge, MA, USA, 1999; pp. 185–208. [Google Scholar]
  43. le Cessie, S.; Van Houwelingen, J.C. Ridge Estimators in Logistic Regression. Appl. Stat. 1992, 41, 191–201. [Google Scholar] [CrossRef]
  44. George, H.J.; Langley, P. Estimating Continuous Distributions in Bayesian Classifiers. In Proceedings of the Eleventh Conference on Uncertainty in Artificial Intelligence, Montreal, QC, Canada, 18–20 August 1995; pp. 338–345. [Google Scholar]
  45. Breiman, L. Bagging predictors. Mach. Learn. 1996, 24, 123–140. [Google Scholar] [CrossRef]
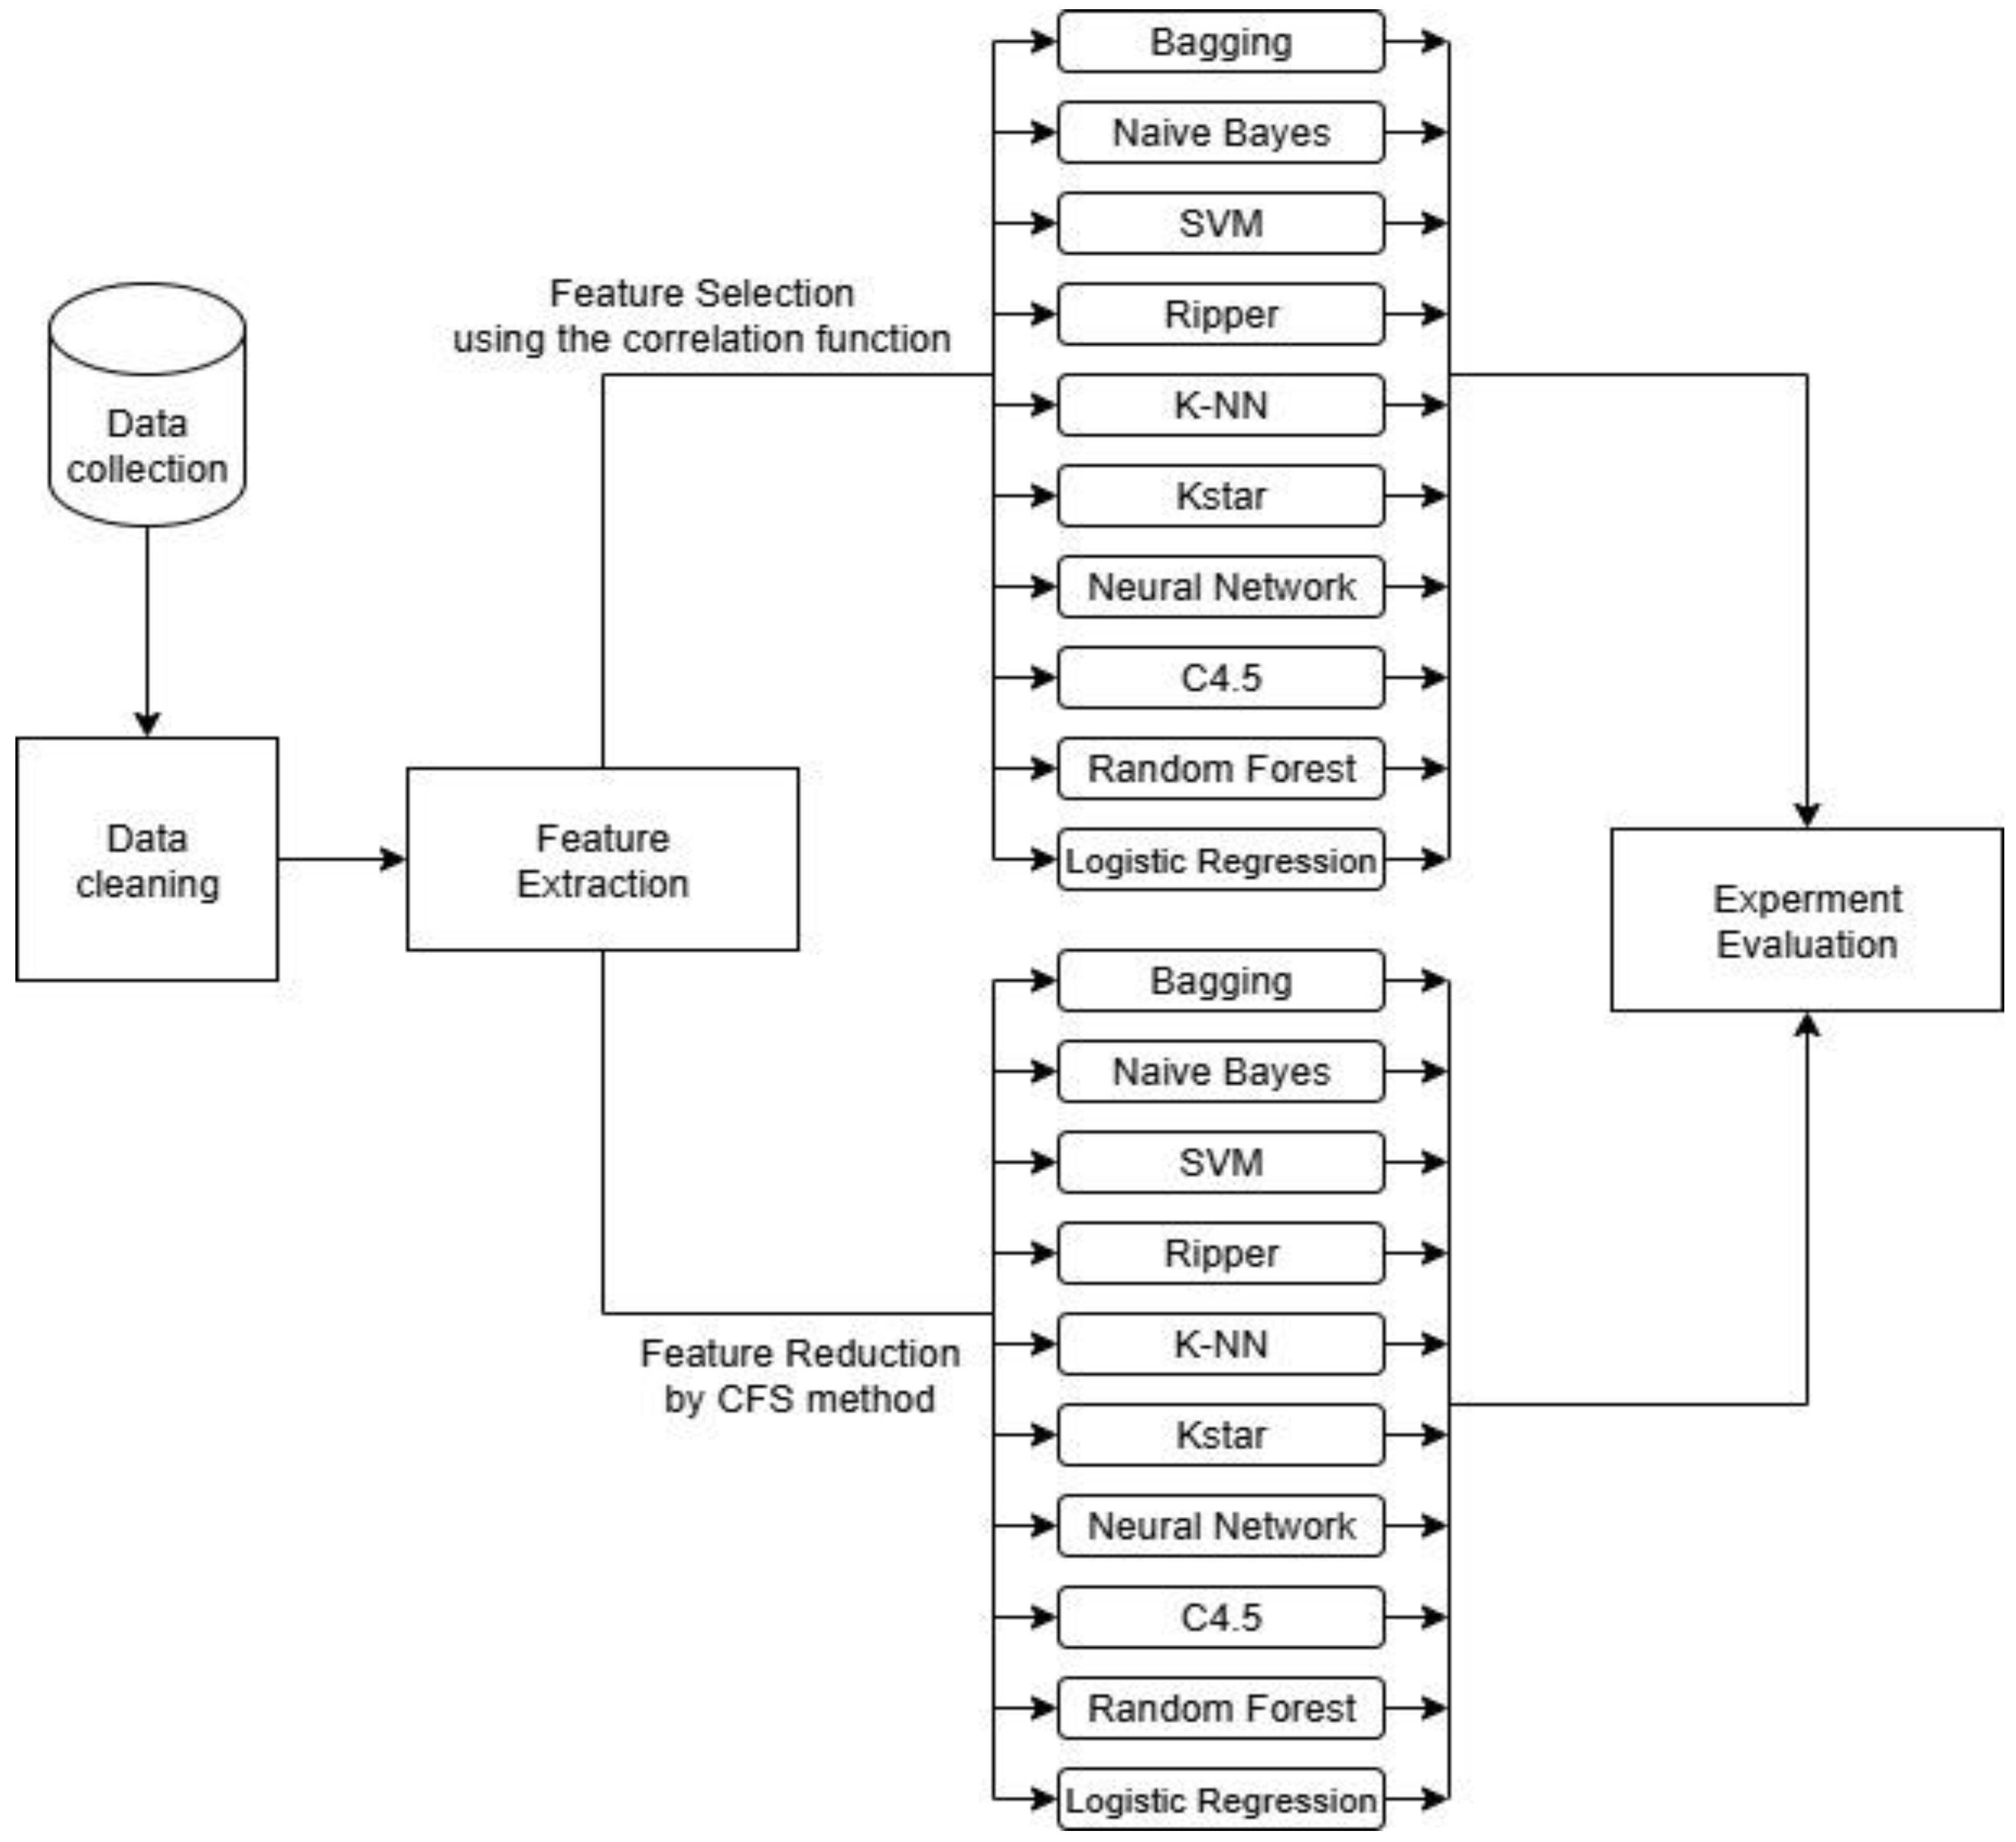
Figure 1. Study workflow of the proposed methodology.
Bdcc 09 00266 g001
Figure 2. Illustrative mammogram images.
Bdcc 09 00266 g002
Figure 3. Significant features for detecting Breast Cancer.
Bdcc 09 00266 g003
Figure 4. Comparison of classification models on 30-feature and 11-feature datasets.
Bdcc 09 00266 g004
Table 1. Classification accuracies of models on 30-features dataset.
ModelsAccuracy (%)Precision (%)Recall (%)F-Measure (%)
Class (M)Class (B)Class (M)Class (B)Class (M)Class (B)
Bagging94.994.095.693.795.893.995.7
Naïve Bayes92.893.092.789.395.391.194.0
Logistic
Regression
97.799.296.695.399.497.298.1
Random Forest97.697.297.896.898.197.097.9
Ripper94.693.095.894.195.093.595.4
Neural
Network
96.196.795.793.797.895.296.7
SVM97.799.296.895.399.497.298.1
K-NN95.894.296.995.795.894.996.4
C4.593.591.195.293.393.692.294.4
Kstar95.995.696.294.597.095.096.6
Table 2. Statistical significance testing result on 30-features dataset.
ModelsBaggingNaive BayesLogistic
Regression
Random ForestRipperNeural NetworkSVMK-NNC4.5KStar
BaggingW0L0LL0WL
Naïve BayesLLL0LLL0L
Logistic
Regression
0W0W000W0
Random
Forest
WW0W00WWW
Ripper00LLLL0W0
Neural
Network
WW00W0WWW
SVMWW00W0WWW
K-NN0W0L0LLW0
C4.5L0LLLLLL0
Kstar0W0L0LL0W
Table 3. Description of selected features for detecting breast cancer.
FeatureDescriptionImportance
concavity_meanMeasures the average severity of concave portions of the contour. Malignant tumors tend to have more irregular, concave shapes.
concave_points_meanAverage number of concave portions in the contour.A higher number of concave points is typical in malignant cells.
area_seStandard error of the area covered by the nucleus.Captures variability; malignant nuclei often have larger, more irregular areas.
symmetry_seStandard error of symmetry.Malignant masses are generally more asymmetric.
radius_worstLargest value of the radius across all nuclei.Malignant nuclei tend to be larger.
texture_worstVariation in texture (e.g., smoothness, granularity) of the nucleus.Textural irregularity is higher in malignant cells.
perimeter_worstLargest perimeter value found among nuclei.Longer perimeters reflect more irregular, possibly cancerous shapes.
area_worstLargest area found among nuclei.High values are associated with malignancy.
smoothness_worstSmoothness of the border (worst case).Malignant tumors tend to have fewer smooth edges.
concavity_worstMaximum concavity observed.Deep concavities are linked with malignancy.
concave_points_worstMaximum number of concave points detected.More concave points typically indicate cancerous lesions.
Table 4. Classification accuracies of models on an 11-feature dataset.
ModelsAccuracy (%)Precision (%)Recall (%)F-Measure (%)
Class (M)Class (B)Class (M)Class (B)Class (M)Class (B)
Bagging95.194.495.693.796.194.095.9
Naïve Bayes94.594.794.391.796.493.295.3
Logistic
Regression
96.696.097.095.797.295.897.1
Random Forest96.295.396.995.796.795.596.8
Ripper94.994.495.393.396.193.895.7
Neural
Network
97.297.297.396.098.196.697.7
SVM96.998.096.294.598.696.297.4
K-NN96.194.996.995.796.495.396.7
C4.594.392.695.593.794.793.195.1
Kstar96.496.496.494.997.595.697.0
Table 5. Statistical significance testing result on 11-features dataset.
ModelsBaggingNaive BayesLogistic
Regression
Random ForestRipperNeural NetworkSVMK-NNC4.5KStar
Bagging0000LL000
Naïve Bayes0LL0LL000
Logistic
Regression
0W0W00000
Random
Forest
0W0000000
Ripper00L000000
Neural
Network
WW00W0000
SVMWW00W0000
K-NN000000000
C4.5000000000
Kstar00000000W
Table 6. Runtime results of models on 30-feature and 11-feature datasets.
ModelsTrain Time on
30-Feature Dataset
Train Time on
11-Feature Dataset
Bagging0.030.01
Naïve Bayes0.010.01
Logistic Regression0.020.01
Random Forest0.080.07
Ripper0.030.01
Neural Network1.670.32
SVM0.010.01
K-NN0.010.01
C4.50.010.01
Kstar0.010.01
Disclaimer/Publisher’s Note: The statements, opinions and data contained in all publications are solely those of the individual author(s) and contributor(s) and not of MDPI and/or the editor(s). MDPI and/or the editor(s) disclaim responsibility for any injury to people or property resulting from any ideas, methods, instructions or products referred to in the content.