Article

Integrating Graph Retrieval-Augmented Generation into Prescriptive Recommender Systems

1
Center for Applied Data Science, Bielefeld University of Applied Sciences and Arts, 33330 Gütersloh, Germany
2
Fraunhofer Institute for Mechatronic Systems Design, Digital Transformation, 33102 Paderborn, Germany
*
Author to whom correspondence should be addressed.
These authors contributed equally to this work.
Big Data Cogn. Comput. 2025, 9(10), 261; https://doi.org/10.3390/bdcc9100261
Submission received: 28 July 2025 / Revised: 9 October 2025 / Accepted: 10 October 2025 / Published: 15 October 2025

Abstract

Making time-critical decisions with serious consequences is a daily aspect of work environments. To support the process of finding optimal actions, data-driven approaches are increasingly being used. The most advanced form of data-driven analytics is prescriptive analytics, which prescribes actionable recommendations for users. However, the produced recommendations rely on complex models and optimization techniques that are difficult to understand or justify to non-expert users. Currently, there is a lack of platforms that offer easy integration of domain-specific prescriptive analytics workflows into production environments. In particular, there is no centralized environment and standardized approach for implementing such prescriptive workflows. To address these challenges, large language models (LLMs) can be leveraged to improve interpretability by translating complex recommendations into clear, context-specific explanations, enabling non-experts to grasp the rationale behind the suggested actions. Nevertheless, we acknowledge the inherent black-box nature of LLMs, which may introduce limitations in transparency. To mitigate these limitations and to provide interpretable recommendations based on real user knowledge, a knowledge graph is integrated. In this paper, we present and validate a prescriptive analytics platform that integrates ontology-based graph retrieval-augmented generation (GraphRAG) to enhance decision making by delivering actionable and context-aware recommendations. For this purpose, a knowledge graph is created through a fully automated workflow based on an ontology, which serves as the backbone of the prescriptive platform. Data sources for the knowledge graph are standardized and classified according to the ontology by employing a zero-shot classifier. For user-friendly presentation, we critically examine the usability of GraphRAG in prescriptive analytics platforms. We validate our prescriptive platform in a customer clinic with industry experts in our IoT-Factory, a dedicated research environment.

1. Introduction

Evaluating different outcomes of alternative options in terms of the likelihood and the value of outcomes associated with these options is known as decision making [1]. Traditionally, determining the best action in a given situation is performed by a human. The course of determining such actions is crucial in any domain, from everyday problems to problems in various professional fields such as healthcare, logistics, or production. In all environments, effective decision making is vital to optimizing processes, reducing errors, and improving overall efficiency, making it a key area of focus for commercial achievements. Decisions must be made quickly and precisely, so that resources can be used optimally, patients can be treated correctly, and employees can be utilized to their full capacity. Demographic changes [2] show that more people are retiring than can be recruited. This means that the knowledge that has been used to make decisions over decades may be lost [3]. In particular, in smart factory environments, where workers operate with the same machines for decades, preserving their knowledge is essential for efficient operations. Without effective mechanisms for knowledge transfer, companies risk losing valuable insights that are essential for decision making and operational continuity.
In recent years, data has therefore been increasingly incorporated into the decision-making process to support workers in making data-driven decisions, often by leveraging artificial intelligence (AI) systems [4]. AI systems utilize data analytics to provide actionable insights, with four levels of data analytics playing a crucial role: descriptive, diagnostic, predictive, and prescriptive analytics [5]. These levels work in tandem, where AI processes and interprets data at each stage to enable more informed and optimized decision making across various contexts. While the first three stages aim to support the user in making decisions by providing information, it is the task of prescriptive algorithms to independently present the best action or sequence of actions to the user. In the context of prescriptive analytics, the user is only required to provide approval, as the system automatically determines and presents the best course of action, eliminating the need for the user to evaluate all options themselves.
The benefits and rationale behind such prescriptive algorithms may be clear from a developer’s perspective, as they enable faster decision making, provide insights for evaluating options, minimize biases, and maximize the potential for positive outcomes. However, for users of these systems, they are often presented as black-box models [6]. Data is input into a black-box system, where decisions or recommendations are subsequently produced and presented in a non-transparent manner. It is not uncommon for shopping or streaming sites to suggest completely irrelevant or seemingly unrelated products with the statement ”People who liked this product also liked this” [7]. While an incorrect suggestion in this context may not have harmful consequences, in critical fields such as manufacturing (e.g., suggesting something physically unfeasible) or healthcare, a completely inaccurate recommendation can drastically reduce user trust in such systems. Furthermore, recommendations often appear mysterious to workers, particularly to people with limited computer knowledge, leading to a lack of trust in the provided recommendations [8]. As a result, workers may disregard recommendations entirely if the system repeatedly provides incorrect suggestions, ultimately rendering the recommendation system ineffective. To effectively integrate decision support systems into work environments, a transparent decision-making process and a clear, comprehensible presentation of recommendations are essential [9].
This is where large language models (LLMs) [10] and knowledge graphs (KGs) [11] become particularly relevant. While LLMs excel at generating text and answering general questions, they often struggle to provide accurate or detailed responses to highly specific or specialized queries [12], as they are trained primarily on publicly available data sets [13]. Incorporating LLMs with private knowledge is referred to as retrieval-augmented generation (RAG) [14]. RAG systems were proposed to integrate classical retrieval methods with LLMs. They enable the extraction of relevant information from company knowledge bases and leverage this knowledge to provide structured and transparent guidance for the LLM. The problem of appropriate knowledge representation remains, and this is where KGs can provide an intuitive and easy-to-understand representation of complex relationships. Combining RAG and KGs leads to what is referred to as GraphRAG [15], which is capable of providing actionable recommendations based on a well-structured graph.
To combine the various components, a platform is needed that seamlessly integrates data sources, analytical models, and decision support tools into a standardized environment, enabling seamless integration, interaction, execution, and consistent interoperability across all components [16]. A prescriptive analytics platform extends this concept by specializing in the provision of actionable recommendations based on analytical insights. These platforms combine data integration, machine learning, and decision support systems, enabling the unification of diverse data sources and the extraction of meaningful insights. Leveraging technologies such as knowledge graphs, a prescriptive analytics platform enhances the reasoning capabilities of models, ensuring data-driven decisions are both efficient and transparent. In the context of an IoT-enabled factory, such a platform bridges the gap between data insights and practical implementation, driving operational efficiency and informed decision making.

1.1. Contributions

The aim of this work is to achieve two main objectives: First, we provide a theoretical investigation exploring how LLMs and KGs can be integrated into various components of a prescriptive analytics platform to enhance decision-making processes. This is supported by a comprehensive literature review. Second, we implement and validate our own prescriptive analytics platform, focusing on improving usability and performance in real-world applications. Figure 1 presents a schematic overview of our prescriptive analytics platform. Our contributions, in comparison to related work, are as follows:
  • A comprehensive review is provided on how to improve prescriptive analytics with LLMs, KGs, and GraphRAG. The review highlights where these methods can best support different steps of the decision-making process.
  • A prescriptive analytics platform is proposed and validated, combining classical data analytics components with GraphRAG. The platform has been integrated into and evaluated within the IoT-Factory research environment.
  • Future directions are discussed, focusing on how the integration of various LLMs into prescriptive analytics workflows can enhance decision support systems. Remaining risks and limitations are outlined, from which future research challenges are derived.
Most prescriptive platforms identified do not significantly differ from traditional data analytics platforms [16]. Furthermore, platforms that adopt interdisciplinary approaches are scarce and often remain at the conceptual stage. The limited research and development of interdisciplinary platforms that provide an end-to-end solution, from data gathering to the prescriptive component, highlight a significant research gap. To address this, we propose a novel prescriptive platform enhanced by GraphRag to deliver actionable insights. The platform is implemented and validated within the IoT-Factory setting.

1.2. Research Questions

In this paper, we focus on how LLMs and KGs can be integrated into prescriptive analytics platforms to generate enhanced actions and reaction strategies for users. This leads to the following research questions:
  • RQ1. How can LLMs and graph-based approaches be effectively integrated into document and time series procedures to enhance prescriptive analytics, and what are the limitations of current methodologies?
  • RQ2. In the context of the proposed prescriptive analytics platform, which traditional components can be replaced or enhanced by LLMs to improve performance in real-world applications?
  • RQ3. What are the practical challenges and limitations of integrating LLMs together with graph-based approaches into the prescriptive analytics platform for document analysis in industrial environments?
For the literature review, we consider publications from the last five years. The databases used were IEEE, Springer, and additional searches conducted via Google Scholar. The focus is on publications that have already used LLMs for prescriptive use cases. The following search strings were used for the search: (“Prescriptive Platform”) AND (“Large Language Model” OR “LLM” OR “Recommender System” OR “RAG” OR “Retrieval Augmented Generation” OR “Graph RAG” OR “Graph Retrieval Augmented Generation”).

2. Background and Literature Review

This section provides an overview of state-of-the-art algorithms that integrate LLMs with prescriptive analytics. The literature search revealed that only a limited number of studies explicitly address the combination of prescriptive analytics and LLMs. However, searching for “LLM” in conjunction with the closely related topic of “recommender systems” yields significantly more results. In addition to LLM-based approaches, KGs and RAG systems have emerged as powerful additions to LLMs, as they improve accuracy and ensure logically correct outputs generated by the LLM. GraphRAG builds on the RAG technology by using KGs to retrieve relevant data. A core focus is their integration with LLMs, highlighting their potential to enhance decision-making processes and addressing challenges in prescriptive analytics.

2.1. Linking and Distinguishing Prescriptive Analytics and Recommender Systems

To narrow down the scope of this work, we will outline the difference between prescriptive and recommender systems. Recommender systems are designed to provide personalized recommendations, such as product suggestions on a shopping site, but they can also propose optimal actions or decisions in various contexts [17]. In prescriptive analytics, recommender systems go beyond simply offering options by analyzing data, predicting outcomes, and advising on the best course of action to achieve specific goals [18]. For example, they might recommend operational changes in manufacturing, resource allocation in logistics, or treatment plans in healthcare, all tailored to maximize efficiency, reduce costs, or improve outcomes. A notable example are process-aware recommender systems (PAR systems), which are designed to monitor ongoing process executions, predict their outcomes, and recommend effective interventions to optimize specific key performance indicators (KPIs). These systems integrate monitoring, predictive analytics, and prescriptive analytics, leveraging historical event logs and machine learning techniques to suggest data-driven, objective corrective actions. By simulating potential future paths of a process, they can provide actionable recommendations, such as improving workflow in manufacturing or selecting the best intervention in healthcare, to enhance decision making and process performance [18].

2.2. Retrieval-Augmented Generation (RAG)

LLMs used to generate answers that rely solely on their internal knowledge, without access to external data, have several downsides, making them less accurate and transparent. Firstly, while LLMs possess knowledge across many domains, this knowledge is generally limited and may be outdated. This often results in hallucinated answers, factual inaccuracies, and uncertainty regarding the origin of the knowledge [14]. RAG addresses these issues by combining LLMs with external knowledge, enhancing their accuracy by providing additional relevant information. This approach enables LLMs to achieve state-of-the-art performance on many tasks while operating with up-to-date knowledge [19]. Gao et al. [14] categorize RAG into three stages: naive, advanced and modular RAG.
  • Naive RAG is the simplest version, where the system retrieves relevant information and uses it to generate an answer. However, this version has several limitations, such as retrieving irrelevant or incomplete information, which can still lead to hallucinations.
  • Advanced RAG reorganizes retrieved information and prioritizes key details. The retrieved information may be compressed or simplified to focus on relevant aspects, and the query can be rewritten to improve clarity and add context.
  • Modular RAG is the most advanced and flexible version. Each component is separated into its own module, allowing replacement, improvement or customization for specific tasks. It includes a search module to extract relevant information from multiple sources and a memory module to reuse past queries or results. This version is tailored for the specialization of specific document types, such as medical records or reports. Additionally, modular RAG supports step by step retrieval: based on a question, the system retrieves relevant information, generates a (partial) answer, identifies knowledge gaps and performs subsequent targeted retrievals to refine the information.

2.3. Knowledge Graphs

Knowledge graphs (KGs) are networks that represent data in a graph-based structure according to an ontology, consisting of nodes, edges, and edge labels. They enable the representation of complex relationships between entities (nodes) through edges that connect them. Each connection is labeled to define the relationship between the entities [20,21]. In a prescriptive context, each node may represent error or action information, with edges indicating the likelihood that a specific action solved a given error. The graphical structure serves as a way for semantic knowledge representation and the interconnection of domain concepts, providing high interpretability and supporting reasoning [22].
As a result, KGs are considered an essential component of explainable machine learning [23]. Real-world applications of KGs include information extraction, semantic parsing, and question answering [24]. KGs are particularly relevant for smart manufacturing use cases, as they enable the unification of diverse data sources within a smart factory while preserving the semantic structure and connections inherent in the data.
KGs improve systems and LLMs by enhancing their understanding of relationships and reasoning, leading to better decision making in smart factories. They excel at presenting interconnected data structures, facilitating multi-layered decision making across various domains, while remaining transparent and editable by users. Although knowledge can be easily added or updated, building and maintaining knowledge graphs is often a challenging, costly, and time-consuming process [25].

2.4. GraphRAG

GraphRAG is a combination of knowledge graphs and retrieval-augmented generation. The information retrieval by the RAG component is enhanced by incorporating KGs that capture structured relationships between entities. This enables the system to not only retrieve relevant information but also use the interconnections within the data by leveraging relationships between entities. This makes the system especially powerful for use cases where not only the information is important, but also the interconnections of the data [15]. The integration of LLMs with KGs addresses the limitation of LLMs in domain-specific reasoning by leveraging the structured knowledge and relationships captured in KGs. This combination has garnered significant attention for its potential to enhance knowledge retrieval and reasoning, particularly in the context of prescriptive analytics. To go beyond simply providing knowledge from KGs to LLMs, recent research emphasizes deeper integration strategies that enable both systems to complement each other. This involves not only augmenting LLMs with domain-specific knowledge but also enabling them to enhance and expand the capabilities of KGs. Key approaches include:
1. Semi-Automatic Knowledge Graph Construction
LLMs can assist in building and maintaining KGs by extracting relevant knowledge from unstructured data, identifying relationships, and suggesting updates, thus improving scalability and accuracy [26].
During knowledge graph construction, certain factors need to be considered, such as input data requirements (e.g., scalability), support for incremental updates of the KG, an easy pipeline for maintaining the KG, as well as quality assurance of the data being stored in the KG [22]. LLMs can address these factors by automating the extraction of structured knowledge from unstructured data, reducing manual effort and ensuring scalability. They enable real-time, incremental updates to KGs by integrating new information and resolving inconsistencies. Additionally, LLMs enhance quality assurance by identifying errors, standardizing data formats, and suggesting changes to ensure the KG remains accurate and reliable over time. By streamlining these processes, LLMs make the construction and maintenance of KGs more efficient and robust.
2. Domain-Specific Knowledge Augmentation
The task of providing domain-specific knowledge from a knowledge graph to an LLM is known as retrieval-augmented generation (RAG). RAG enhances the context of the LLM with external data. For this task, RAG utilizes three stages. First is a retrieval stage that performs a similarity matching based on text embeddings to identify relevant data to enhance the context [27]. These text embeddings can then be stored in a vector database [20]. In the augmentation stage, the user query is augmented and enriched with the retrieved content. The last stage is the generation stage, in which the response is generated by the LLM. For example, if an error case is retrieved, the knowledge graph can directly provide the connected action and relevant context information through its connected structure, enabling the LLM to generate a recommendation that goes beyond isolated facts. Using knowledge graphs in combination with LLMs reduces hallucinations of LLMs as they are directly provided with relevant information for generating the response to the given query [28].
3. Multi-Hop Link Prediction
A further use case for combining knowledge graphs and LLMs is in multi-hop link prediction tasks, where the model needs to infer indirect relationships through multiple intermediate nodes and edges. For example, in our domain, multi-hop reasoning could link an observed machine error to its underlying cause via intermediate context nodes, and then further connect this cause to a recommended corrective action. This enables the system to infer useful recommendations even when the error–action relationship is not explicitly stored in the knowledge graph. Achieving this is done by leveraging the natural language processing capabilities of LLMs to understand and reason through complex, multi-step connections [29]. Yang et al. [30] investigate whether LLMs are capable of multi-hop reasoning. They find strong evidence for first-hop link prediction, which also improves with larger model sizes. However, the performance for second-hop reasoning or link prediction is worse and not as consistent as first-hop link prediction. They conclude that, while LLMs do exhibit multi-hop link prediction capabilities, this capability is limited and varies with context. Furthermore, even when reaching the correct conclusion, the reasoning paths generated by LLMs may still be flawed. This leads to correct conclusions derived from incorrect reasoning processes. Therefore, the results of multi-hop reasoning processes need to be carefully evaluated [31]. The results of the LLMs in reasoning tasks are still better when encouraged to reason, as according to [32], the zero-shot performance can be further improved by introducing zero-shot chain of thought (CoT). Adding a prompt such as “Let’s think step by step” encourages the model to perform step-by-step reasoning, which significantly improves the performance of the model on complex reasoning tasks.
Our position is that the integration of LLMs into various data-processing pipelines within prescriptive analytics reduces the amount of expert knowledge required, aligning with the core goals of prescriptive analytics. However, the current literature reveals significant shortcomings in terms of accuracy, particularly for time series data, which are important for prescriptive analytics, especially in production environments.

3. Prescriptive Analytics Platform

A prescriptive analytics platform combines implicit and explicit data to provide actionable recommendations and explanations, making it adaptable to various applications with diverse data input requirements. While the platform is intended to serve a wide range of domains, manufacturing has been a focal testing scenario. We validate the prescriptive platform using our IoT-Factory. The IoT Factory serves as both the data source and the place where action recommendations are executed.

3.1. IoT-Factory

A smart factory is a fully networked factory in which all plants, products, and processes are linked via the IoT. The production environment is automated and mostly self-managed and does not require human intervention. The smart factory (Figure 2a) consists of 19 assembly and disassembly stations used to continuously assemble and disassemble an intelligent product (IoT-Device). Each station is equipped with unique sensors to measure the data relevant for that station. For example, the robot cell (Figure 2b) is equipped with pressure, torque, and acceleration sensors, cameras, and microphones to gather data during the gripping processes. These data are supplemented with energy data and status sensors such as light barriers. This enables versatile recording of time series data from the individual production cells. Not only are the stations themselves equipped with sensors, but also the IoT-Devices.
The IoT-Device consists of a main board with an integrated battery and communication module. In addition, various sensors, such as a gyroscope and a weather module, are attached early in the assembly cycle to collect data not only from the smart factory stations but also from each IoT-Device. This enriches the data variety by having access to production data from two different perspectives, the machine data of the producing station and the IoT-Device.
The material required for the individual production steps is brought to the respective station using robotinos (autonomous industrial trucks). The orders are organized via an MES system, and the tasks are passed on to the respective stations.
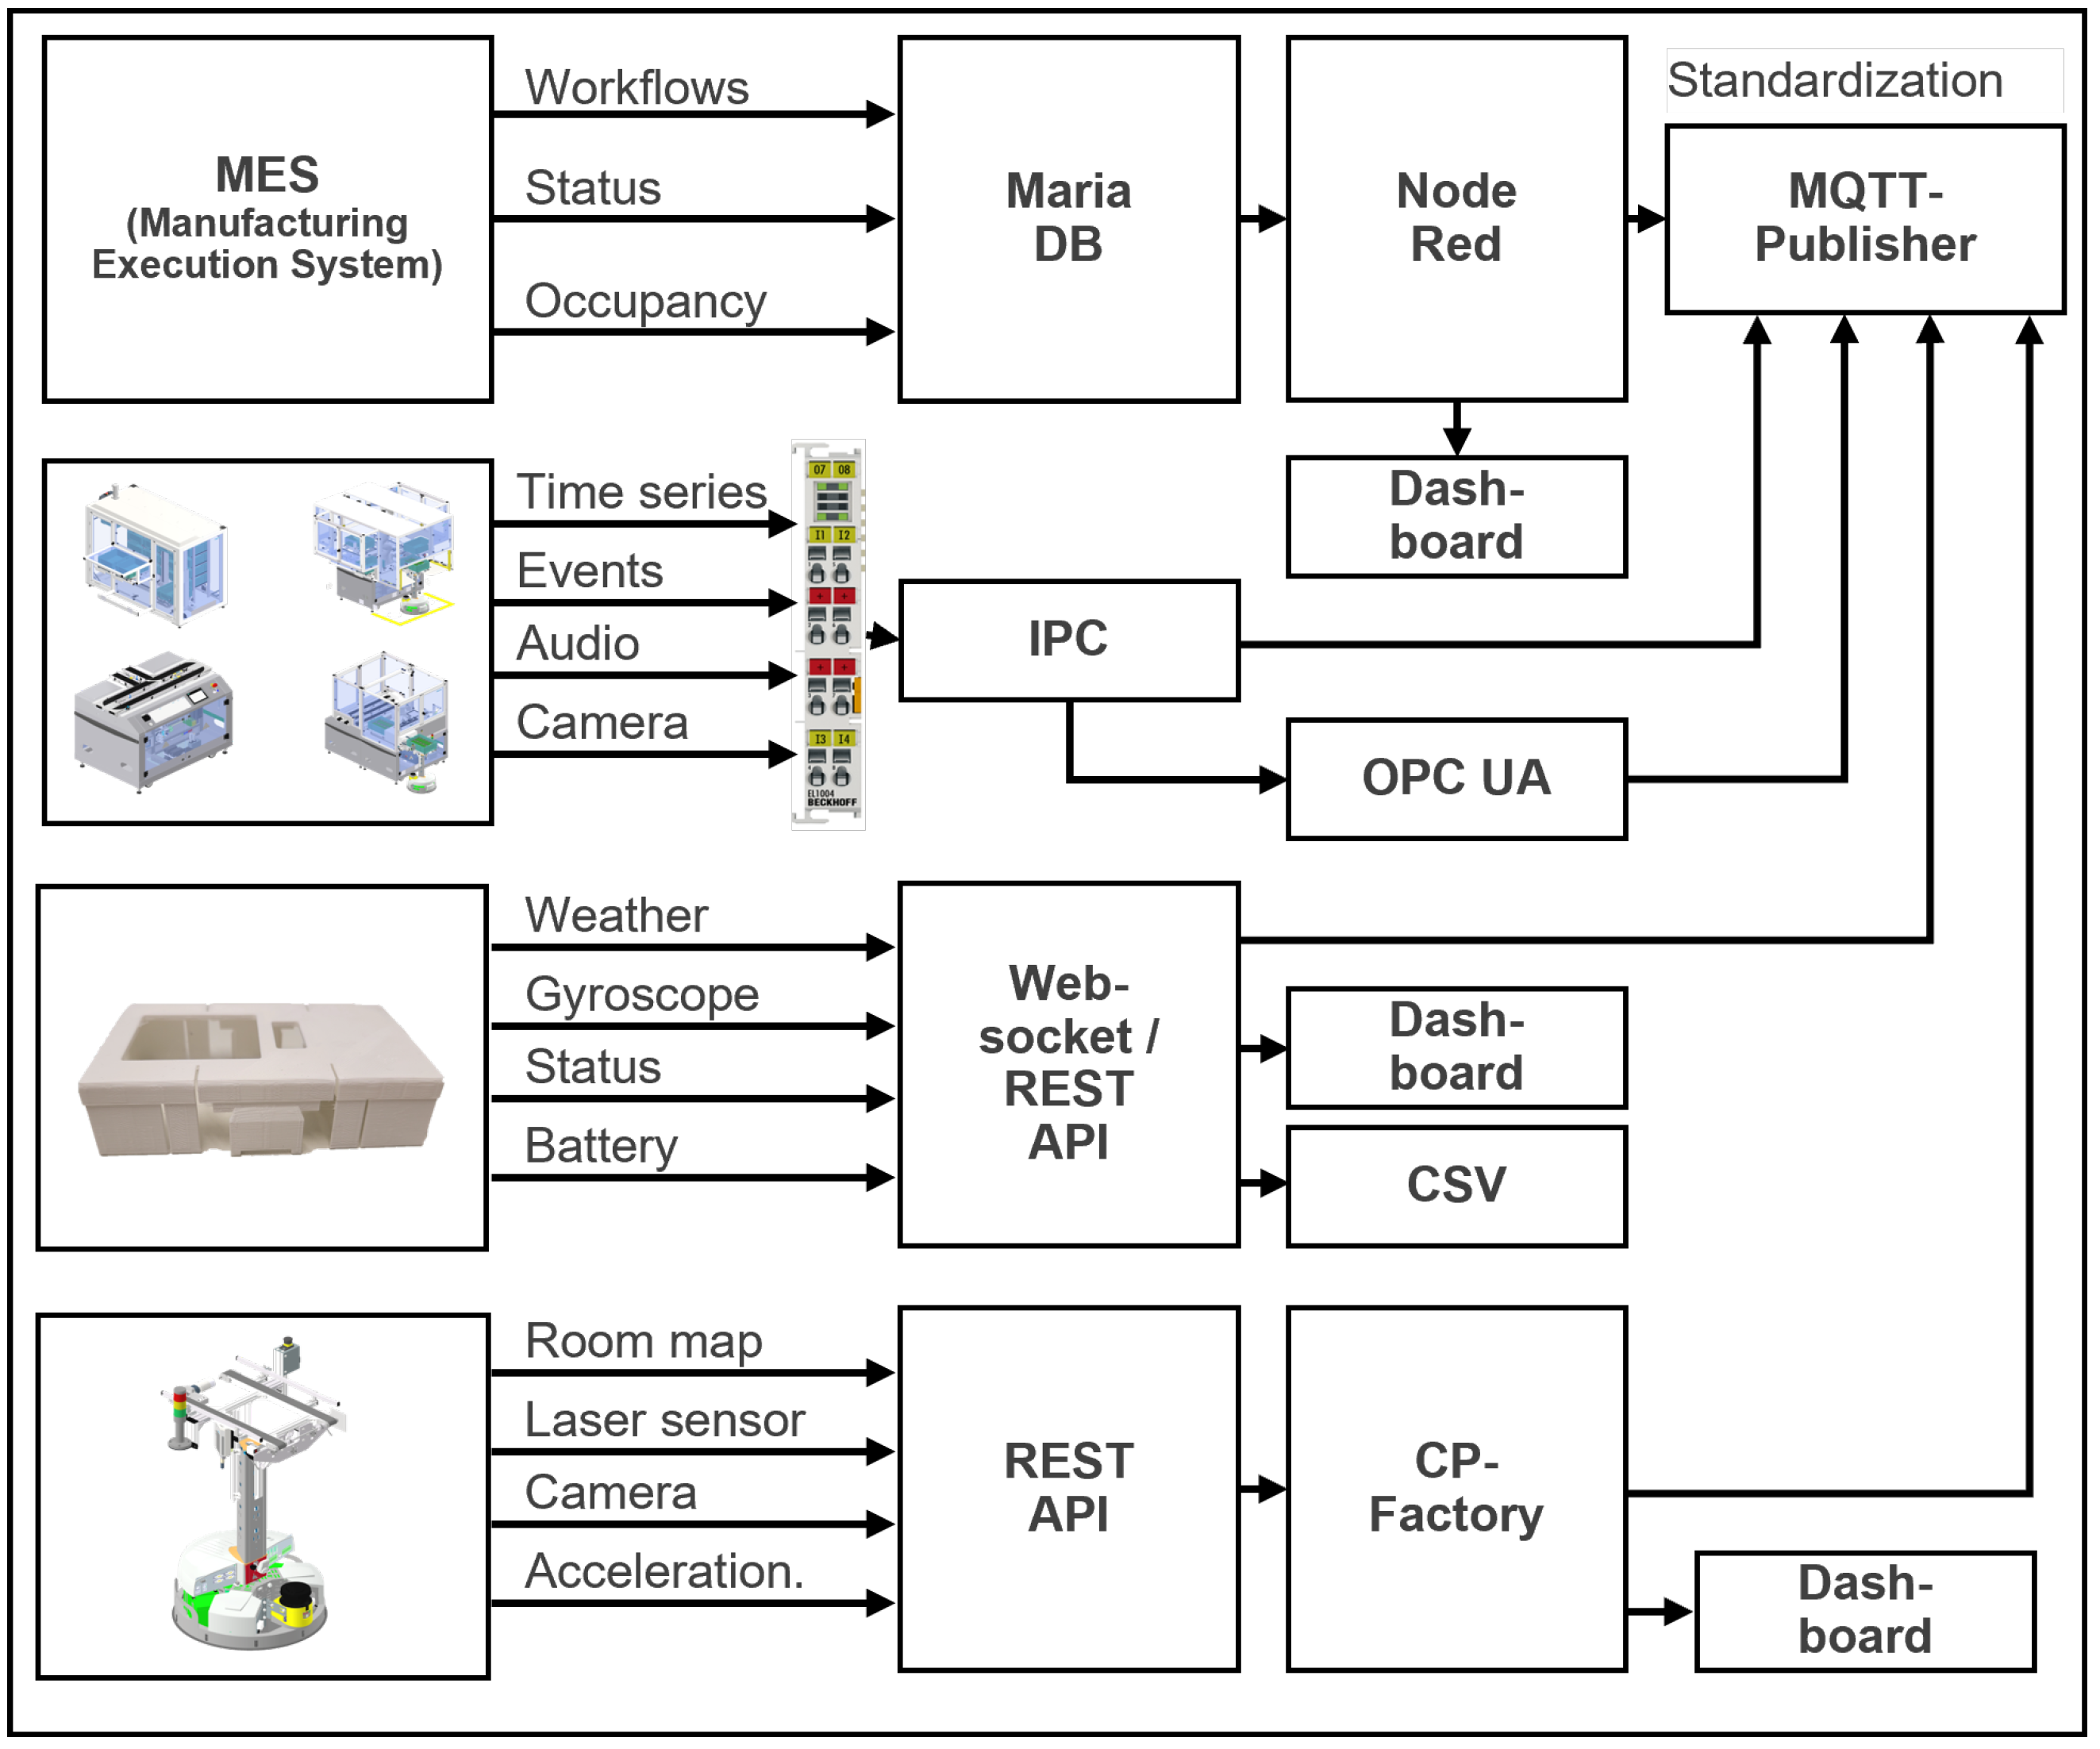
This leads to four different data sources: (i) time series, audio, image, and event data from the 19 production stations; (ii) weather, gyroscope, battery, and status data from IoT products; (iii) acceleration, position, and surroundings data from the robotinos; and (iv) schedules, status reports, and error reports from the MES. All these diverse data sources are then merged to be utilized for prescription (Figure 3). Depending on the data source, we use individual protocols to optimally gather the data. Then, all data sources are standardized and published via MQTT. Our prescriptive platform then retrieves the live data and begins processing.

3.2. Natural Language Processing Pipeline

Document Analysis

Documents containing specific knowledge about the factory serve as an excellent foundation for integration into a prescriptive analytics platform (Figure 4). By extracting relevant information and segmenting the content into smaller chunks, this knowledge can be structured into a knowledge graph, capturing both the information and its complex interrelationships. By combining knowledge from various sources across the factory (e.g., documentation for different machines) into a unified KG, cross-domain connections and relationships between data can be established. Factory workers can benefit significantly from this centralized knowledge repository.
The analysis of images contained within the documents leverages the ability of LLMs to perform image-to-text tasks. The images are described by the LLM, and the resulting text replaces the image at its location in the document. This ensures that no information contained in the images is lost, allowing for comprehensive document analysis. For complex images, it often makes sense to segment the image and retrieve descriptions for each segment individually. We emphasize that automated image descriptions can be incomplete or incorrect; large vision-language models and LLMs may omit details, misinterpret visual elements, or hallucinate facts. Therefore, generated text should be treated as an assistive summary, not an authoritative transcription. To mitigate these risks, a human should always be involved in the validation process.
Additionally, the platform can process video material, such as recordings of training sessions, by extracting the audio and transcribing it into text. Each transcription is split into coherent text segments and stored as nodes in a Neo4j knowledge graph after processing. Each node contains the text segment itself together with meta-information regarding the origin of the data, such as document name, page number, and origin type (e.g., document, video, or audio). This ensures transparency as each node can be traced to its origin.

3.3. Our Ontology

All of the information stored in the KG is organized and structured according to our ontology. Each factory error is linked to actions that represent potential solutions. Additionally, the knowledge graph includes context nodes, which are connected to both error nodes and action nodes. These connections are established by first classifying each node according to the ontology, calculating the text embeddings of all text segments, and utilizing the best action retriever, as detailed in Section 3.3.3.
The ontology provides a structured representation of information that improves retrieval for the LLM, supports explainable decision recommendations, and enables scalable linking of errors with actions. It also allows efficient navigation of relationships within the knowledge graph. While strict structure is generally considered a strength of ontologies, in our context, it can limit adaptability to changing production environments and cross-domain scenarios. This may restrict future use cases unless extensions are made. The ontology was built by deriving relevant concepts from practical difficulties reported by workers and insights from manufacturing staff, ensuring that the model reflects practical needs while remaining simple and not overly complex.
Moreover, it depends on accurate classification and embeddings; errors in these steps can propagate and yield sub-optimal recommendations, highlighting the need for careful preprocessing and validation.

3.3.1. Text Embeddings

Text embeddings transform text into high-dimensional embedding vectors that represent the semantic similarity of words. Words with similar meanings (such as synonyms) that are closely related to each other will have a small distance in the embedding space [33]. There are different types of models to calculate word embeddings, for example latent semantic analysis (LSA) and latent Dirichlet allocation (LDA) [34]. Text embedding tools are an important part of natural language processing tasks, such as information retrieval, information extraction, or natural language understanding [35]. As soon as the knowledge graph with the text descriptions exists, the text embedding are computed for the segments and saved in the corresponding nodes as well. In our implementation, each text segment corresponds to a node in the knowledge graph, and its embedding vector is stored as a property of this node for semantic search.
Figure 5 shows a 2D representation of the embedding space containing text segments from all documents available from the IoT-Factory that were loaded into the platform. The model and parameters used for its creation are detailed in Appendix B. The document labels, represented by different colors, indicate the category of the documents. Clustering of documents with the same label suggests that their semantic similarity is often reflected in the embedding space. However, we note that both clustering in high-dimensional spaces and visualization techniques such as t-SNE can distort distances and groupings, so results should be interpreted cautiously. As an example, MES, shown in green, is grouped very closely together, indicating that these documents pertain to a specific and well-defined aspect of the factory, with consistent terminology and focused content. Contrary to this, the IoT-Factory documents are not grouped closely together, indicating that these documents pertain to various aspects of the entire factory, covering a wide range of topics.

3.3.2. Text Classifier and Relationships

The next stage of the processing pipeline is a zero-shot text classifier. Each slightly overlapping text segment is classified in one of three text categories. We distinguish between actions, error cases, and general information. This classification is saved as meta-information. The models implemented for the classification tasks are OpenAI’s ChatGPT 4o mini [36] and Meta’s LLaMA3 model [37], with LLaMA3 integrated through the Ollama framework [38]. The detailed model descriptions are available in Appendix B. These classifications are then used in the subsequent step to establish node relationships within the knowledge graph, connecting error cases, actions, and general information in a meaningful and structured way.
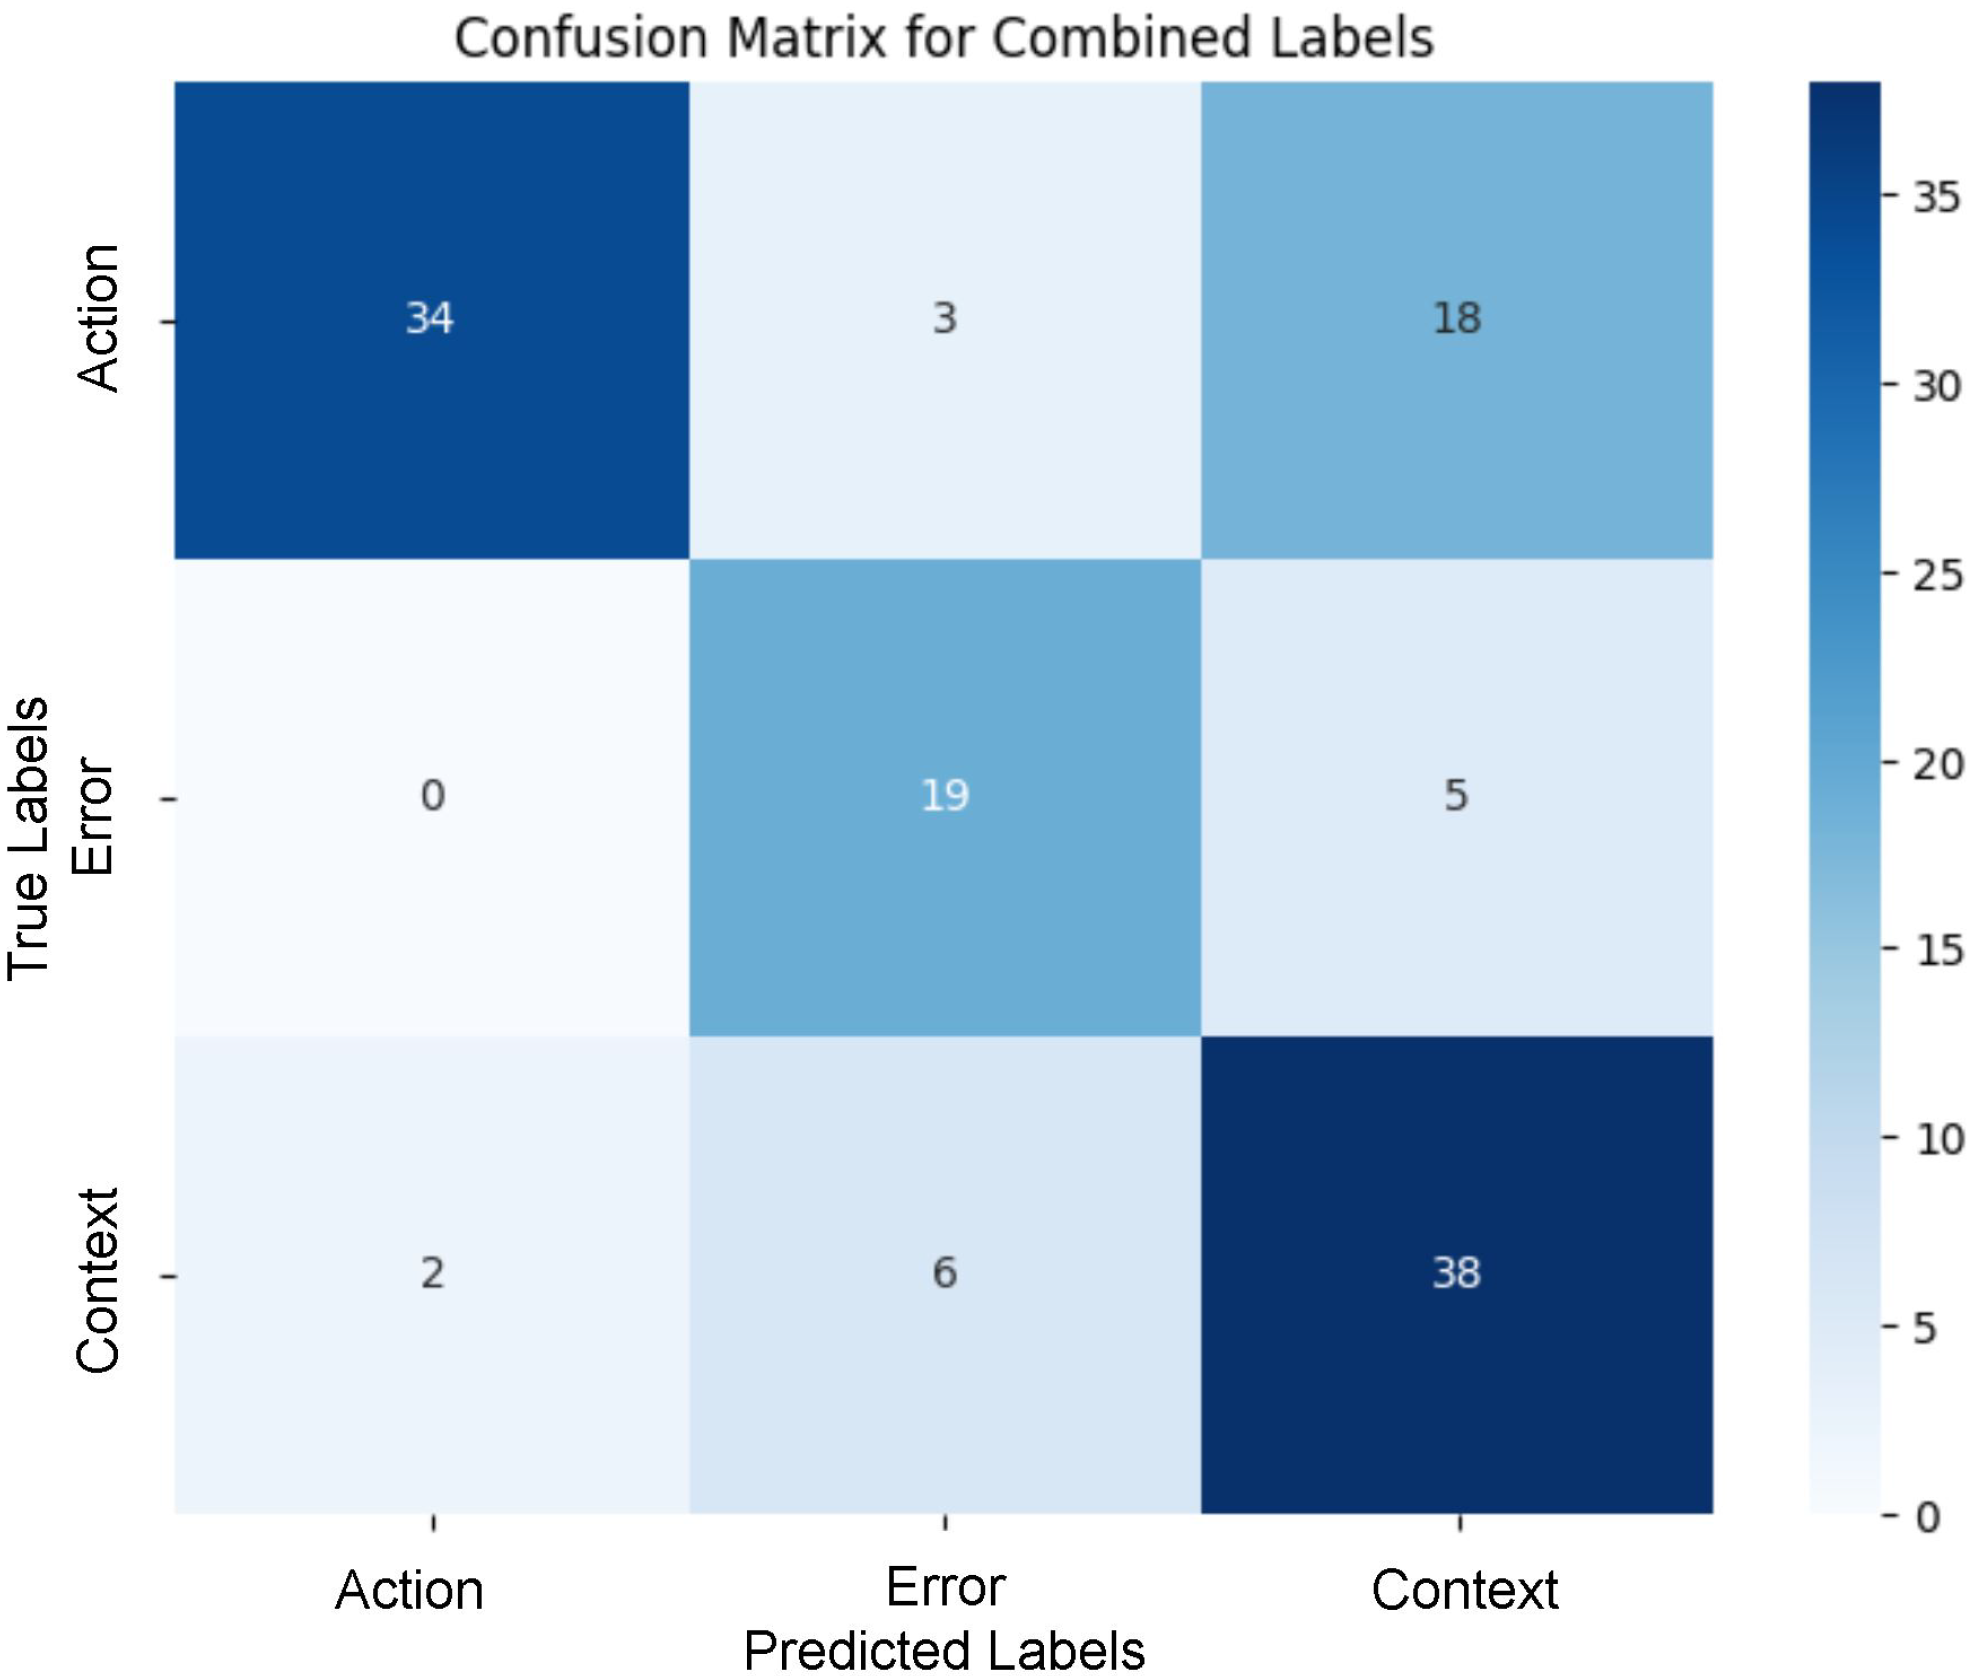
Each text segment was labeled by a zero-shot classifier into one of three categories—Error, Action, and Context Information—before being saved as a node in the knowledge graph. We performed a benchmark, comparing the labels produced by the zero-shot classifier with the labels assigned by a human expert. The zero-shot classifier achieved an accuracy of 72.80%. Figure 6 presents the results of the zero-shot classifier in the form of a confusion matrix across the three categories. The model demonstrates strong accuracy in predicting the Error and Context categories. However, there are some notable misclassifications, particularly between Action and Context, where several instances of Action were predicted as Context and vice versa.
One potential reason for misclassifications is the overlap between instructions and background information in some text segments, particularly when the information is extracted from complex document structures, such as nested tables. Content that mixes action steps with contextual information can be difficult to categorize consistently. Additionally, the longer text segments occasionally combine both action steps and contextual information in a single piece of text, further blurring the boundary between the two categories. Other contributing factors may include limitations of the zero-shot prompting setup and differences in the weighting of context-related information by humans and classifier. Beyond these issues, some text segments are inherently ambiguous, even for human interpretation, which poses a substantial challenge for automated classification.
During the benchmark, we determined that the text segments tend to be slightly too long. In one text segment, both the error and its solution could be described. However, that is not our intended behavior, as the goal is to separate errors, actions, and context information into their own nodes and then map the relationships between those nodes by defining connections between them.

3.3.3. Best Action Retriever

In this stage, the node relationships are created. Each error case is connected to a maximum of three action nodes and three general information nodes. This is done by calculating the cosine similarity of the text embeddings contained in the nodes. This relationship data is subsequently used in the RAG part of the process. The user request is augmented with this information to create an accurate response and decision recommendation by the LLM. The best action retriever was evaluated numerically and in a customer clinic with industrial testers (Section 5).

3.4. Time Series Processing Pipeline

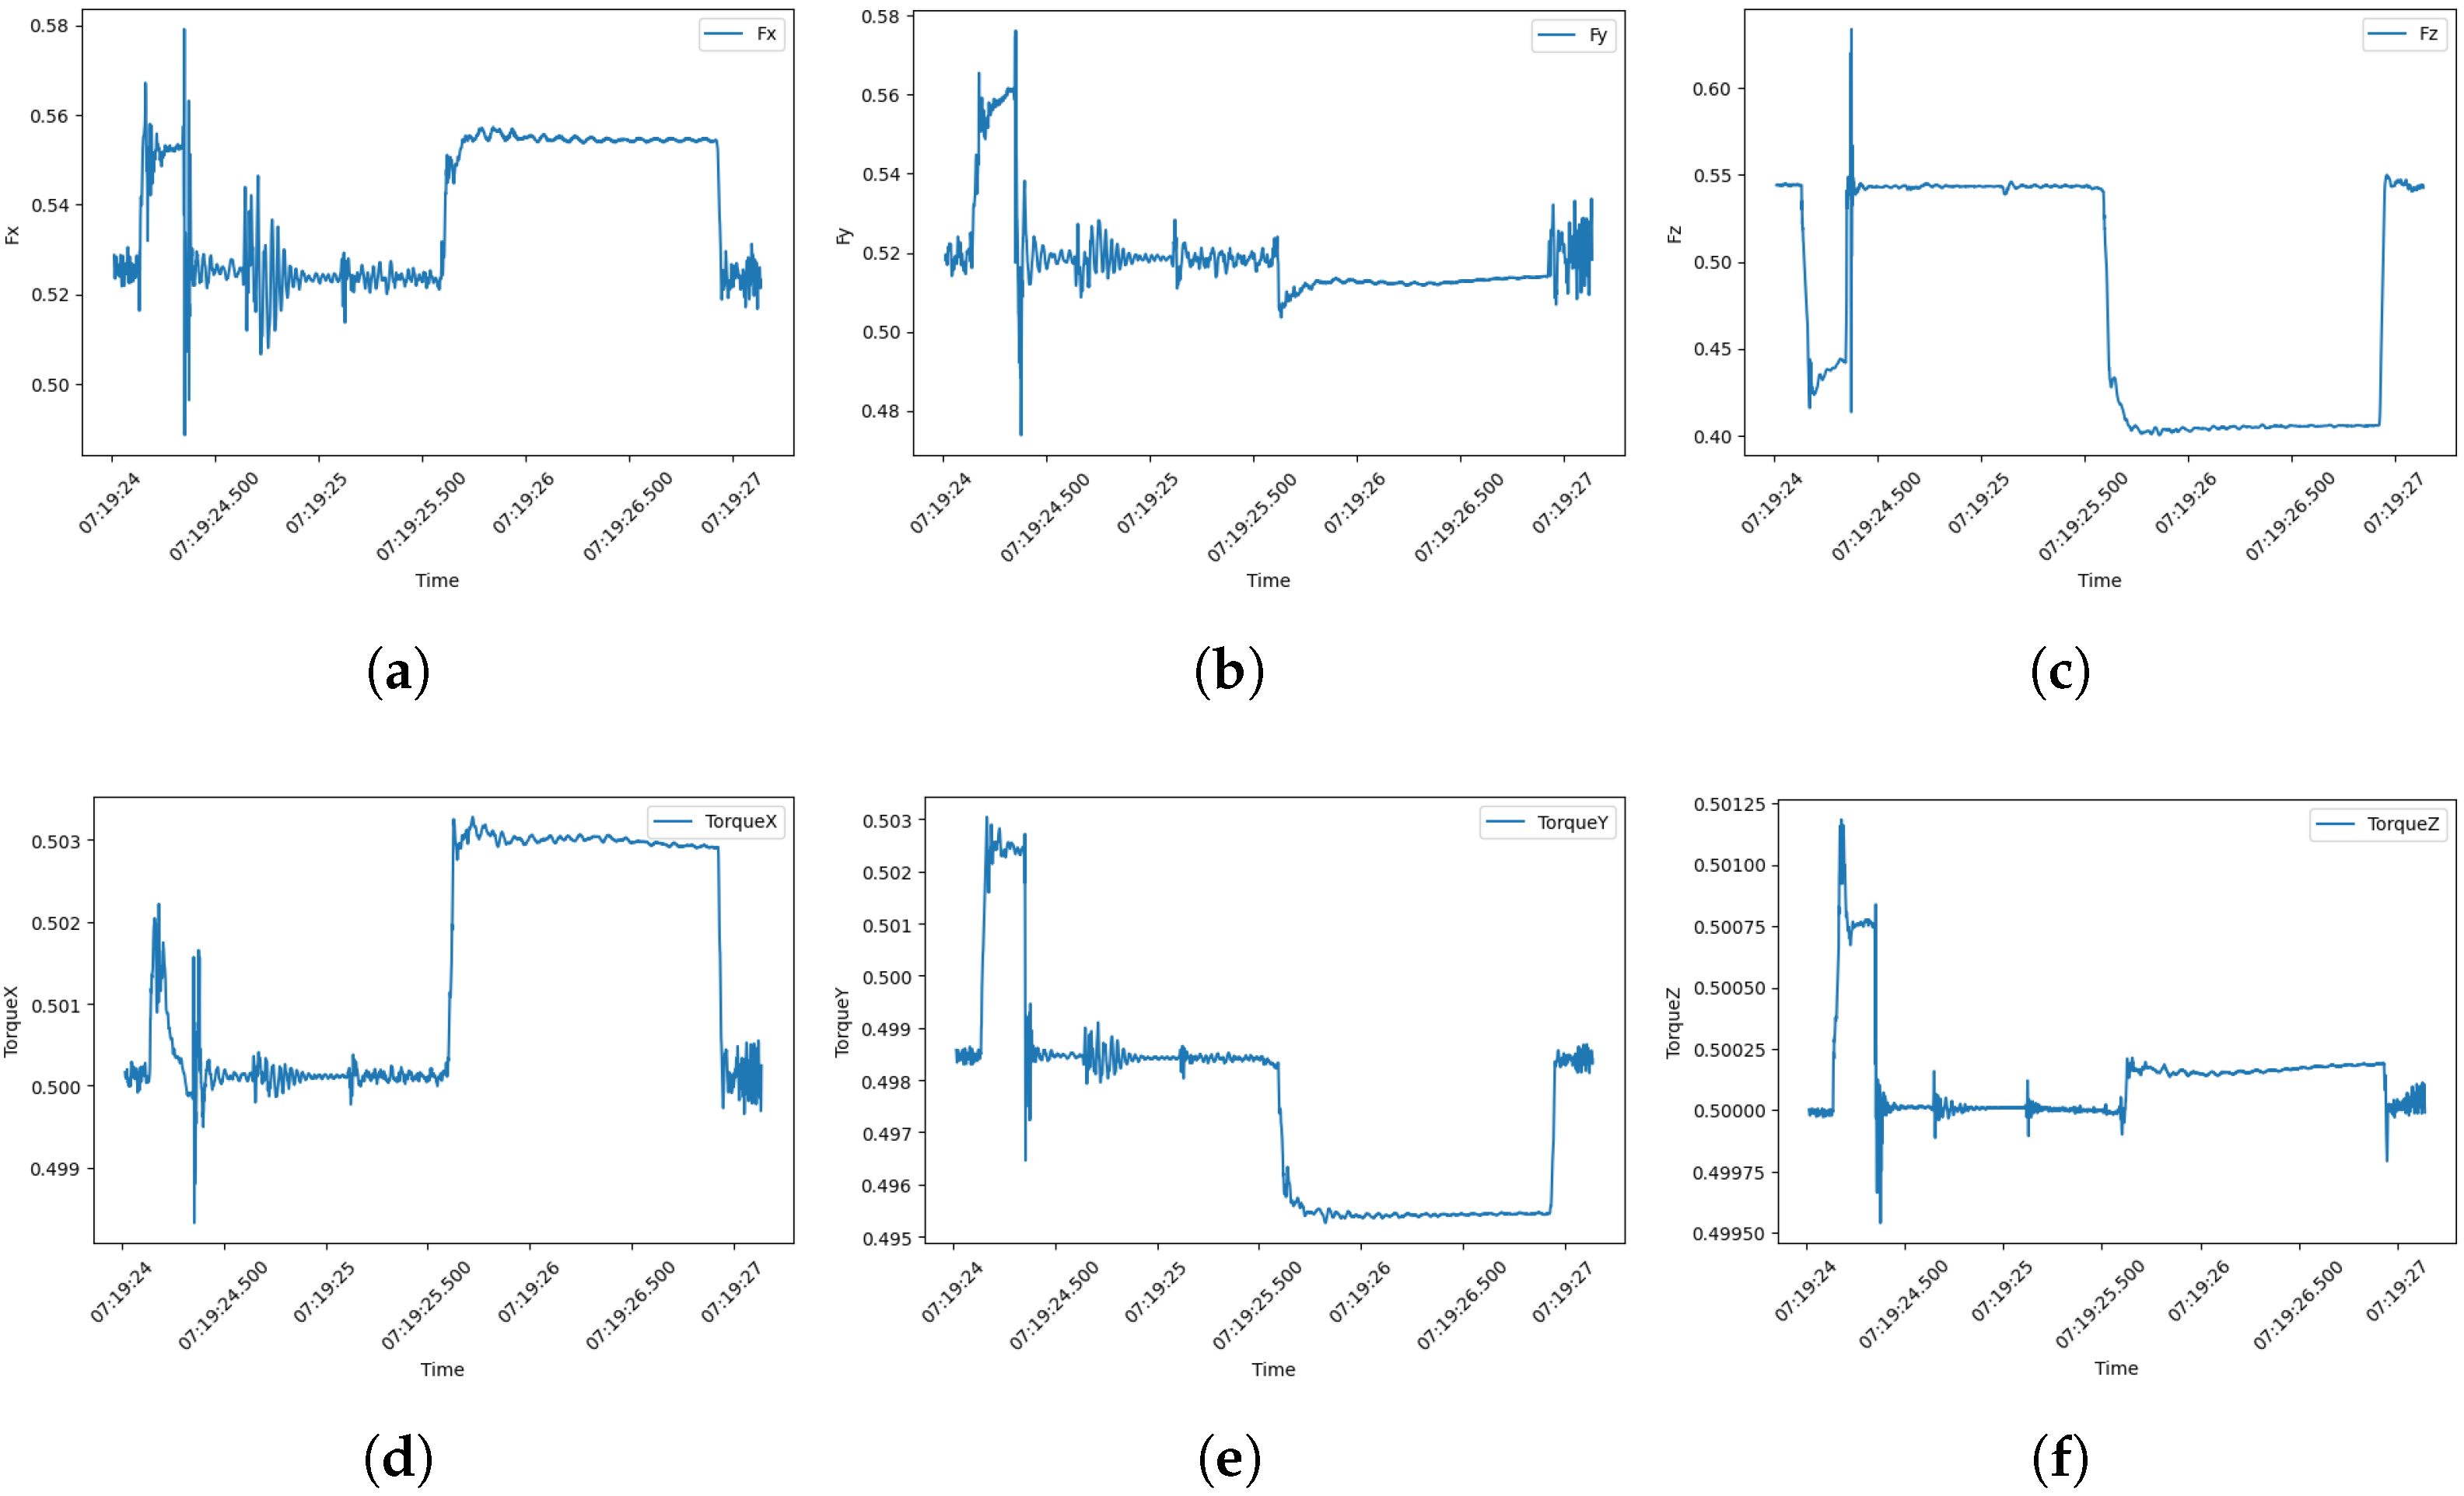
The classical preprocessing pipeline for sensor data that we implemented involves several key aspects. We save the raw sensor data in a time series database as well as relevant meta-information (Figure 7). This data can be plotted with the web interface of the time series database (we use InfluxDB) or on the frontend of our platform. We perform a data cleaning task to ensure that any data outliers are removed and replaced by an average of the neighboring values to avoid creating any inconsistencies. A crucial aspect is the generation of statistical features to describe the sensor data, which can be used for further data processing. These statistical features include mean, max, min, skewness, and kurtosis. These features are aggregated into one health index feature for each component of the IoT-Factory. By comparing the history of the health index to prior cycles and identifying the component with the most similar health index, a prediction of the remaining lifetime of this component can be made with higher accuracy, allowing for more effective maintenance scheduling and reducing the risk of unexpected failures. The prediction of the remaining lifetime of this component can then be passed to the LLM recommender to generate tailored maintenance recommendations, suggest optimal replacement schedules, and provide actionable insights to prevent potential failures. By adding a threshold to trigger the LLM, the system can automatically engage the platform when it becomes necessary, for example due to a low remaining lifetime of the component. The platform then generates a decision recommendation by using the knowledge from the knowledge graph to augment the query and provide a recommendation that is tailored specifically to the active machine and component.
Recent advancements in leveraging LLMs for time series forecasting, such as TIME-LLM [39], LLMTIME [40], TimeGPT [41], LagLlama [42], and GPT4TS [43], demonstrate that these models can effectively handle tasks such as forecasting, anomaly detection, and classification. Techniques like transforming time series data into text prompts (as in TIME-LLM) or treating time series as sequences of numerical digits to utilize zero-shot capabilities without fine-tuning (as in LLMTIME) highlight the versatility of these approaches. Moreover, foundational models like TimeGPT and LagLlama significantly reduce the complexity of traditional pipelines by requiring less preprocessing, allowing the LLM to infer patterns and relationships directly from the raw time series data. While these methods are not adopted in this work due to their current limitations in maturity and robustness, especially for domain-specific industrial applications, their ability to simplify workflows and leverage pre-trained models suggests a promising direction for future integration into prescriptive analytics.

3.5. Prescriptive Action Engine

To generate a decision recommendation, the prescriptive action engine can be triggered in three primary ways. First, a user can manually prompt the engine via the user interface, either by entering questions or by submitting factory-generated error messages. The system then leverages the knowledge graph to identify similar errors, retrieving relevant information and suggesting potential actions based on the relationships within the knowledge graph.
Second, the engine can be triggered autonomously, responding to the results of prior diagnostic analytics stages. For instance, when an anomaly detection process identifies an issue in time series data, this anomaly is automatically fed into the engine, generating a proactive decision recommendation without manual intervention, supporting faster responses to anomalies. This autonomous approach is also applied to other factory errors, which are directly processed by the prescriptive action engine. In this work, we did not yet measure a specific automation metric. However, the impact of autonomous triggering is expected to be a reduction in manual intervention, faster reaction times to anomalies, and more consistent decision recommendations.
Lastly, the system can be activated to generate a prescriptive action recommendation based on the output of a predictive system. This predictive system might anticipate upcoming machine failures in the factory, prompting the engine to suggest preemptive actions.

4. Detailed View of the Prescriptive Analytics Platform

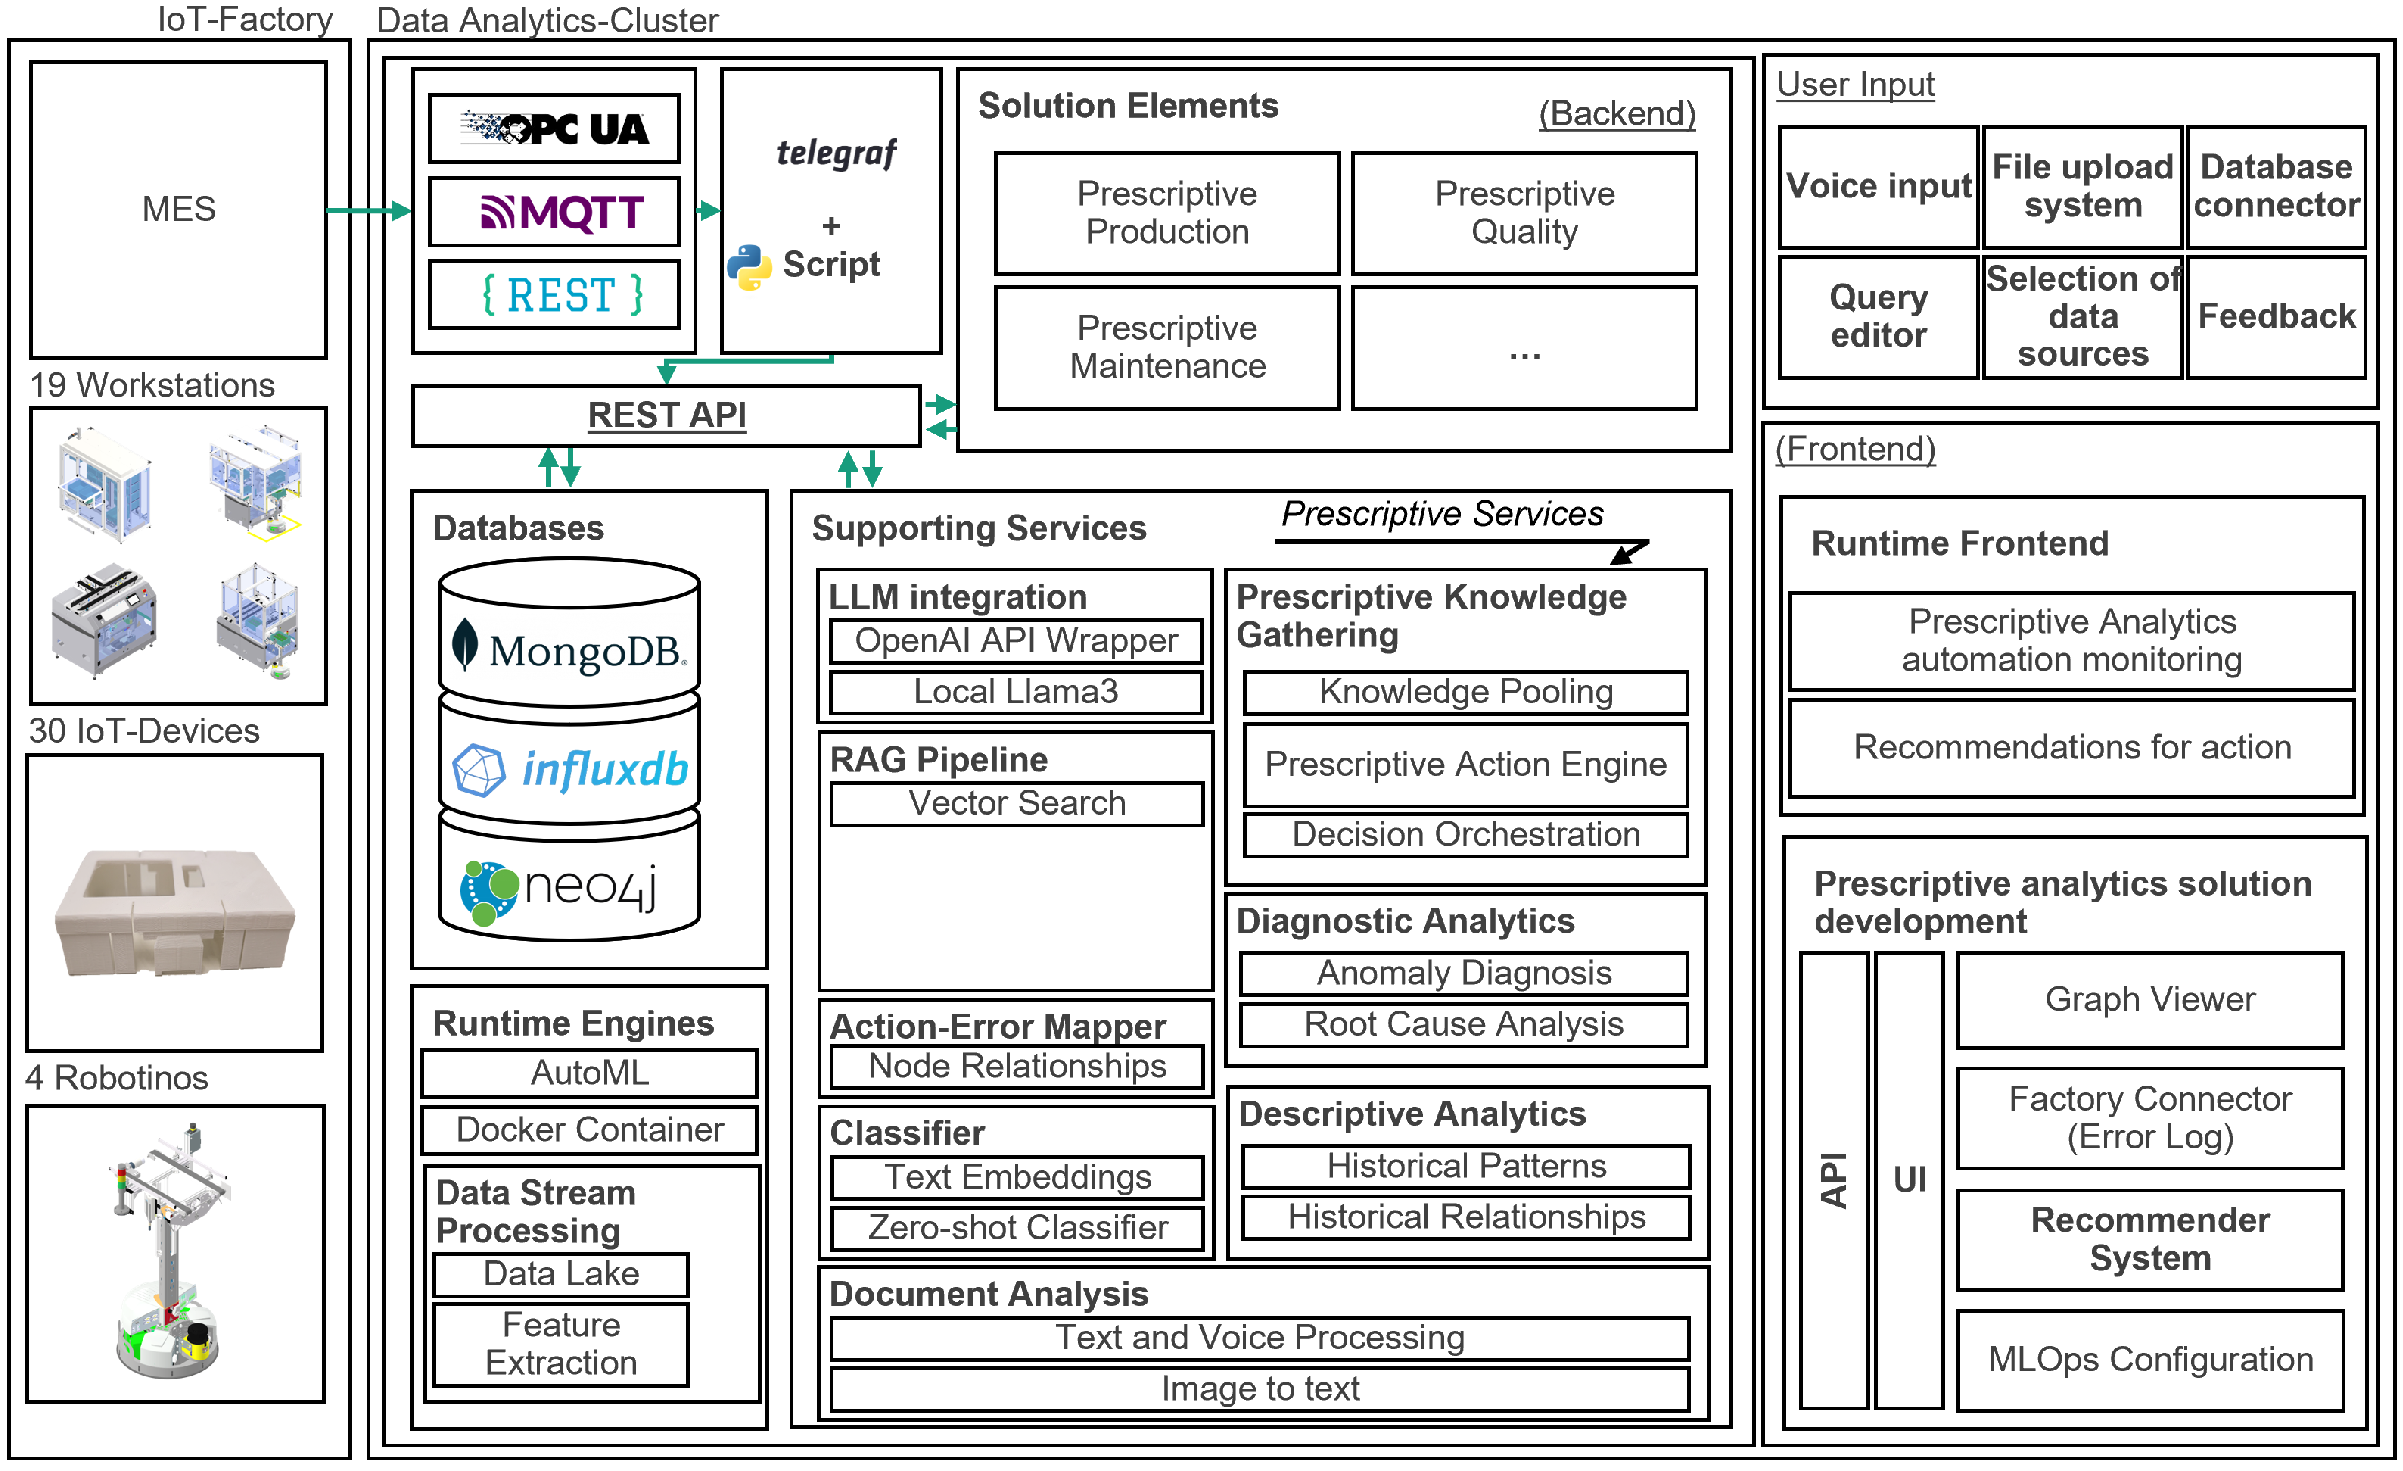
An application example of our prescriptive analytics platform is shown in Figure 8. The platform consists of multiple services that each serve an important purpose, enabling the generation of actionable decision recommendations. The image can be divided into several parts (from left to right): Data sources from the IoT-Factory, transfer protocols, databases, runtime engines, solution elements, supporting services, user input, frontend, and prescriptive analytics solution development.
IoT-Factory Data Sources:
The connected data sources from the IoT-Factory are diverse. Data from the MES (manufacturing execution system) is input into the platform, as well as data from 19 different workstations that work on the IoT device built in the IoT-Factory. The IoT device itself provides telemetry data from its different sensors (see Section 3.1), and lastly, the robotinos (which are transport vehicles taking care of the transport of goods toward the different workstations of the IoT-Factory) transmit data that is collected by the platform.
Data Transfer Protocols:
The platform is directly connected to the live data stream of the IoT-Factory. Errors occurring in the factory are accessed via OPC UA in a Node-RED workflow and saved to disk for further processing, serving as triggers for the platform. The time series data sent by the different sources inside the IoT-Factory are transferred via MQTT, which is a widely adopted transfer protocol for IoT data. Furthermore, REST is supported to complete the transfer protocol stack supported by the platform.
Databases:
A significant portion of the knowledge in the knowledge graph originates from legacy documents. These include factory manuals, documentation, transcribed audio training manuals, error descriptions, failure mode and effects analysis (FMEA), and environmental context data. To transform these heterogeneous sources into a structured representation, the documents are decomposed in a hierarchical chunking process into chapters, paragraphs, and sentences. Within each semantic paragraph, error, action, and context information is extracted and classified according to our ontology using the described classification method. Based on this segmentation, relationships are created by linking nodes extracted from the same paragraph according to the mentioned ontology. The original documents are stored in a MongoDB database, time series data transferred via various protocols are saved in an InfluxDB instance for further processing, and the knowledge graph itself is stored in Neo4j. All data and interconnections are brought together in this centralized knowledge graph.
Runtime Engines:
Docker is used as the runtime environment. All databases, scripts (e.g., for feature extraction of time series data), and data processing are performed in separate Docker containers, and all components communicate with each other through a centralized REST API.
Supporting Services:
Supporting services list a subset of the components integrated into the platform. The LLM component is integrated as either a connection to OpenAI through the OpenAI API or a local Llama3 model to support on-premise generation of recommendations in natural language. Furthermore, the knowledge is retrieved in a RAG pipeline. The action–error mapper maps node relationships of extracted data from various sources, while a classifier classifies the nodes according to our ontology (see Section 3.3). Document analysis is performed by converting all voice and image data to text and then processing the content. The knowledge is pooled by grouping it by IoT-Factory workstation. Descriptive and diagnostic services may be integrated, and the output is either saved in the knowledge graph or a recommendation is created directly. Preceding analytics modules act as triggers for the LLM recommender engine, for example when anomalies are detected in diagnostic workflows.
Solution Elements:
Example use cases that can be implemented are prescriptive production, prescriptive quality, and prescriptive maintenance. In every case, the knowledge graph is used to inform the use case and provide detailed information tailored to the specific application.
User Input:
Users can input data by providing a query in the chatbot user interface, or they can use voice input, which is then transcribed to text. Furthermore, it is possible to upload files, which are subsequently processed, and the knowledge extracted and transferred into the knowledge graph. All graph connections to already existing knowledge in the knowledge graph are made.
Frontend:
User input is handled via the frontend. All user interactions are performed here. Furthermore, the frontend allows for the monitoring of automations (e.g., diagnostic modules), and the recommendations generated by the system are shown here.
Prescriptive Analytics Solution Development:
The architecture is separated into a UI and API layer, ensuring flexibility and easy integration of components. The main components included are a graph viewer (Figure A1) for visualizing the knowledge graph, a factory connector to connect the live data streams from the IoT-Factory, the recommender system that generates actionable decision recommendations, and lastly, the MLOps configuration at the backbone of the system ensures the seamless deployment, monitoring, and maintenance of machine learning models used within the system.

5. User Validation and Discussions

5.1. User Validation in Customer Clinics

To evaluate the performance of our prescriptive platform, we conducted a customer clinic with n = 11 industrial company representatives. Participants were tasked with finding technical information in the documentation in order to solve problems that regularly occur in our IoT-Factory as quickly as possible. This evaluation was carried out in two scenarios: (i) using only the available documentation for the individual stations in printed and digital form, and (ii) using our prescriptive analytics platform, where participants entered their question and received the corresponding answer directly. The results (Table 1) demonstrate a significant reduction in the time required to acquire the knowledge needed to solve the problems. This reduction in knowledge acquisition time translates into faster troubleshooting, as the platform directly offers decision recommendations to address potential problems. In an industrial context, this improvement can significantly reduce machine downtime and enhance operational efficiency, making the solution particularly valuable for manufacturing environments. These efficiency gains can translate into measurable cost savings and increased production throughput, further demonstrating the platform’s industrial relevance.

5.2. Discussion

As part of this study, several research questions were formulated to guide our research. The questions were designed to help address important aspects of developing a prescriptive analytics platform leveraging LLMs and related techniques, such as knowledge graphs or retrieval-augmented generation methods.
RQ1 focuses on state-of-the-art approaches to integrate LLMs in the document and time series procedures within prescriptive analytics. However, traditional LLMs are often not sufficient, as they lack domain-specific knowledge and present issues such as hallucinations. To address these issues, we found that a widely used approach is through a RAG system. RAG systems have been proven to perform very well, effectively reducing hallucinations while also being easy to implement. RAG systems achieve a high performance by extracting relevant knowledge, which significantly reduces hallucinations and integrates domain-specific knowledge. To further enhance efficiency, we use a GraphRAG system, which combines RAG with a knowledge graph. The knowledge graph structure contains structured relationships between entities, which we use to internally map decision recommendations, error cases, and context nodes. However, GraphRAG is more complex than traditional RAG, and it requires continuous maintenance beyond document processing and embeddings. This includes the continuous detection and updates of the ontology (Section 3.3), as well as validating and correcting note relations.
When it comes to time series forecasting, integrating LLMs offers an alternative to traditional time series prediction methods, effectively replacing traditional workflows. This simplifies the data analytics process by removing many time-consuming tasks, such as data cleansing and feature engineering. However, despite their advantages, we have not found any literature on the application of LLMs in prescriptive analytics platforms. This suggests that while their implementation in this domain has potential, it remains largely unexplored. In our case, we focus solely on the prescriptive aspect, meaning the source of the trigger is irrelevant.
RQ2, the second research question, supplements RQ1, as it explores which components of a prescriptive analytics platform can be improved by integrating LLMs. Rather than replacing the recommendation system itself, the LLM serves as an additional layer for advanced reasoning on top of the existing recommendation engine. This makes the platform highly versatile and easily adaptable to different domains and use cases, as we do not need to develop a specialized algorithm to optimize processes. However, this also means that our focus leans more towards generating prescriptive recommendations in response to an error or a trigger, rather than using an algorithm to optimize production. There is no inherent reason why implementing this is necessary; however, the output of an optimization algorithm could still be used as a trigger for the LLM’s recommendation engine.
Another scenario for using LLMs is leveraging their zero-shot capabilities to label text segments, for example. This significantly reduces the time spent on manual labeling. That said, this approach relies on the performance of the available pre-trained models. Additionally, contextual misunderstandings can occur, and the accuracy may be lower for specialized domains. These downsides can lead to inconsistent results, even across similar cases.
Pre-trained LLM models such as REBEL can perform end-to-end relation extraction for many different relation types [44]. REBEL is a seq2seq model that allows for the extraction of structures knowledge in the form of triples (subject, relation, object) directly from unstructured text. Traditional relation extraction pipelines rely on separate stages for entity recognition and relation classification [45]. However, REBEL relies on Transformer-based language models, which allows the extraction without intermediate steps.
However, as the use cases for LLMs in prescriptive platforms increase, we must ask the question of whether they actually offer benefits in that particular use case, compared to legacy workflows with specifically tailored algorithms. An aspect that should also be considered when using LLMs is sustainability. LLMs use a substantial amount of power to generate decision recommendations. Therefore, while it may be possible to integrate LLMs into many parts of a prescriptive platform, it may not be sensible in terms of power consumption. This depends on the power intensity of the task being replaced and performed by an LLM.
RQ3, the third research question, pertains to the challenges and limitations of using LLMs in prescriptive analytics. Standard LLMs are often not sufficient to solve all tasks on their own due to well-known downsides, such as hallucinations. These issues are significantly mitigated by using a knowledge base and a RAG system to enhance the LLM’s context and provide domain-specific knowledge. RAG systems retrieve knowledge from trusted sources, reducing the reliance on the LLM’s probabilistic nature. However, hallucinations cannot be fully ruled out, as there may be scenarios where the retrieved information is incomplete or insufficient to provide a relevant answer. Additionally, validating answers as the absolute best possible solution remains a key challenge, which is critical for the goals of prescriptive analytics. One method of validation is to assess whether the system identifies solutions in the documentation that are comparable to or better than those proposed by a human expert. In our approach, we therefore incorporate expert feedback and regard this as the ground truth. This highlights the necessity of combining approaches to integrate LLMs while addressing their limitations, ultimately creating a robust system that effectively fulfills the requirements of prescriptive decision recommendations.

5.3. Future Research Directions

Research on LLMs is rapidly evolving and the potential use cases for their adoption are steadily increasing. Due to their versatility, use cases may emerge that are not possible at this time. One promising field of research is the use of LLMs with time series data. We have already highlighted the ability of LLMs to predict time series data with an accuracy that is considered state-of-the-art in some cases, according to the publishers of these frameworks.
The capabilities of LLMs are rapidly advancing, with recent efforts focused on enhancing their reasoning capabilities. We anticipate that these advancements will positively influence the quality of answers provided by LLMs, particularly when integrated with RAG systems.
Additional research is needed on the possibility of triggering automatic reactions in production factories based on the prescribed output of an LLM. It may be necessary to rely on specific algorithms for this task, as there are several challenges with automating these recommendations. First, the recommendation could potentially be wrong. Second, because the decision recommendation is generated in natural language and the corresponding action is also saved in plain language, there is no automatic mapping between the natural language action and the actual action at the IoT-Factory. Furthermore, as we use an LLM as the recommendation generation engine, the LLM will always provide an answer and decision recommendation, even if the answer is not necessarily correct. One way to mitigate this problem would be to implement an accuracy metric for the decision recommendation in the future.
In addition, future work should include a technical performance evaluation of the KG-driven platform component. The evaluation could evaluate retrieval accuracy and answer relevance under realistic manufacturing conditions. A key focus should further lie on the actual contribution of the knowledge graph to the decision recommendation process, as this is a current limitation of our study design and should be addressed in future work. This would show the robustness of the system and further validate the technical foundation of the platform, as well as the KG component.
In the current state, our solution requires a well-documented representation of the IoT-Factory, or a demonstrator in general. It would be interesting to investigate how to add undocumented expert knowledge directly into the approach [46].

6. Conclusions

This paper aims to showcase the potential of LLMs in enhancing prescriptive analytics platforms. We highlight key areas of the platform where LLMs could potentially be employed and identify further use cases for LLMs in prescriptive platforms. Most significantly, we implement a prescriptive platform that generates decision recommendations by utilizing a GraphRAG built from documents and other supporting media, which is subsequently stored in a knowledge graph enriched with expert knowledge. The focus lies on the generation of prescriptive recommendations, which is why the knowledge graph organizes knowledge into errors, actions, and contextual information. The prescriptive platform integrates a natural language chatbot, real-time error log reading through an IoT connection to the factory, and an expert feedback system to validate and enhance the LLM’s recommendations. The platform was rigorously validated through user testing in a customer clinic, where participants demonstrated faster solution identification and quicker breakdown resolution. By implementing a KG-driven prescriptive platform and integrating LLMs, our work addresses two major challenges faced by existing prescriptive platforms, namely the lack of transparency in implementation details and the limited use of LLMs for reasoning and decision support (see also Appendix A).

Author Contributions

Conceptualization, M.N. and N.M.; methodology, M.N., N.M. and J.W.; software, M.N. and N.M.; validation, M.N., N.M. and J.W.; formal analysis, M.N.; investigation, M.N.; resources, W.S.; data curation, M.N.; writing—original draft preparation, M.N. and N.M.; writing—review and editing, M.N., N.M., J.W., W.S. and M.K.; visualization, M.N., N.M. and J.W.; supervision, W.S. and M.K.; project administration, W.S. and M.K.; funding acquisition, W.S. and M.K. All authors have read and agreed to the published version of the manuscript.

Funding

This research was funded by German Federal Ministry of Education and Research (BMBF) in the project VIP4PAPS, grant number 03VP10031, and by Deutsche Forschungsgemeinschaft (DFG, German Research Foundation)—490988677—and Hochschule Bielefeld—University of Applied Sciences and Arts.

Institutional Review Board Statement

Not applicable.

Informed Consent Statement

Not applicable.

Data Availability Statement

The data supporting the findings of this study were generated within the IoT-Factory research environment and are not publicly available due to internal confidentiality restrictions.

Conflicts of Interest

The authors declare no conflicts of interest.

Appendix A. Supplementary Information on the Prescriptive Platform SLR

In our previous paper [16], we provided a comprehensive literature review (SLR) on the current state of prescriptive analytics platforms. We identified core components of prescriptive analytics platforms such as data sources, communication protocols, databases, and algorithms used across domains like healthcare and manufacturing. We proposed a taxonomy for categorizing prescriptive platforms based on their technical readiness, with two categories: conceptual and validated platforms. We highlighted various research gaps, including the lack of multidisciplinary platforms and the limited attention given to the different stages of automated decision making. Platforms were found to use various algorithms, such as evolutionary algorithms and support vector machines. However, many lacked transparency regarding specific implementation details, including the algorithms used. One key future research topic we identified is the integration of large language models with prescriptive analytics platforms.

Appendix B. Models, Hyperparameters, and Training Setup

The model used to compute the text embeddings is BAAI/bge-small-en-v1.5 [47], which is available on Hugging Face. The maximum dimensionality of the embeddings supported by the model is 384. The model was chosen because it is lightweight and optimized for the English language, as almost all documents from the IoT-Factory are available in English. Despite its small size, the model performs well on the MTEB benchmark [48]. MTEB is a benchmark for measuring the performance of text embedding models on various different embedding tasks [49]. The models implemented for the classification tasks are OpenAI’s GPT-4 (via the OpenAI API) and Meta’s LLaMA3 model (8B parameters). LLaMA3 was integrated through the Ollama framework, which enables local execution of the model. Both models were used in a zero-shot prompting setup, where the classification label was inferred directly from the input text without task-specific fine-tuning.
Table A1. Zero-shot prompt.
Zero-Shot Prompt
You are a classifier for the technical documentation of a smart factory. Your task is to categorize each short text chunk into one of three categories:
1. Action: Describes a step, procedure, instruction, or measure to be performed.
2. Error: Describes a problem, fault, failure, unexpected behavior, or issue.
3. Context Information: Provides background, explanations, rationale, environment, or general information that is not an action or error.
Classify the following text into **exactly one category**. Be concise and precise.
Text: “{text}”
Output: {“category”: “Action | Error | Context Information”}

Appendix C. Question and Answer Example

Table A2. Example of a prompt given to the prescriptive action engine and the corresponding generated prescriptive recommendations. In this example, an error occurred at the RASS3 assembly station of the IoT-Factory.
Instruction
You are an expert in troubleshooting in an IoT-Factory. Your answer must contain a description of the error and a description of the action to be taken. Only use the information provided to answer.
Actual Question (User prompt)
The error StaubliRobot._Error has
occurred at the RASS3 assembly station.
Response
Error description:
StaubliLimitSwitch: End stop of an axis reached. StaubliOvrTempCastings: Overtemperature on the housing.
StaubliOvrTempDsiBoard: Overtemperature on the DSI board.
StaubliOvrTempGlobalPtc: Overtemperature at one of the PTC sensors in the robot arm.
StaubliOvrTempMotor135: Overtemperature at the motors of axes 1, 3 and 5.
StaubliOvrTempMotor246: Overtemperature at the motors of axes 2, 4 and 6.
StaubliSpeedCtrlFault: Error on the speed controller.
StaubliProgramAbort: Program aborted.
GripperCloseError: Gripper cannot be closed, check sensors BG1/BG3.
RassGripperOpenError: Gripper cannot be opened, check sensors BG1/BG3.
Action description:
StaubliLimitSwitch:
Action: Release axis individually (joint movement). StaubliOvrTempCastings: Action: check and rectify overtemperature on the housing according to the Stäubli robot manual. StaubliOvrTempDsiBoard:
Action: Check and rectify overtemperature on the DSI board according to the Stäubli robot manual. StaubliOvrTempGlobalPtc:
Action: Check and rectify overtemperature on one of the PTC sensors in the robot arm according to the Stäubli robot manual. StaubliOvrTempMotor135:
Action: Check and rectify overtemperature on the motors of axes 1, 3 and 5 according to the Stäubli robot manual. StaubliOvrTempMotor246:
Action: Check and rectify overtemperature on the motors of axes 2, 4 and 6 according to the Stäubli robot manual. StaubliSpeedCtrlFault:
Action: check and rectify fault on speed controller according to Stäubli robot manual. StaubliProgramAbort:
Action: manually move robot to home position to restart. GripperCloseError:
Action: Check function of the gripper, adjust sensors BG1/BG3. RassGripperOpenError:
Action: Check function of the gripper, adjust sensors BG1/BG3. Meta information:
Most similar error case: CP-F-RASS-Stäubli-D-A003.pdf Page:151

Appendix D. Table A3

Table A3. Concept matrix for prescriptive platforms. We distinguish between different types of input data, protocols, databases, data format, and used hardware [16].
Input DataProtocolsDatabaseDataHardware
Contribution Sales DataHealth DataMESProcessQualityLogisticMachineImagesMQTTOPC-UARestSQLNOSQLHDFSPre-ProcessedHistoricReal-TimeEdgeCloud
[50] XX X XXXXX
[51] XXXXX XX X XXXXX
[52] XXX XXXX
[53] X X X
[54] XXXXXX X X
[55] X XXXX
[56] X
[57]X XX
[58] X X X X
[59] X X
[60]XX X X XX
[61] X
[62] X XX X
[63] X XX
[64] X X XX X XX
[65] X XXX

Appendix E. Knowledge Graph Viewer

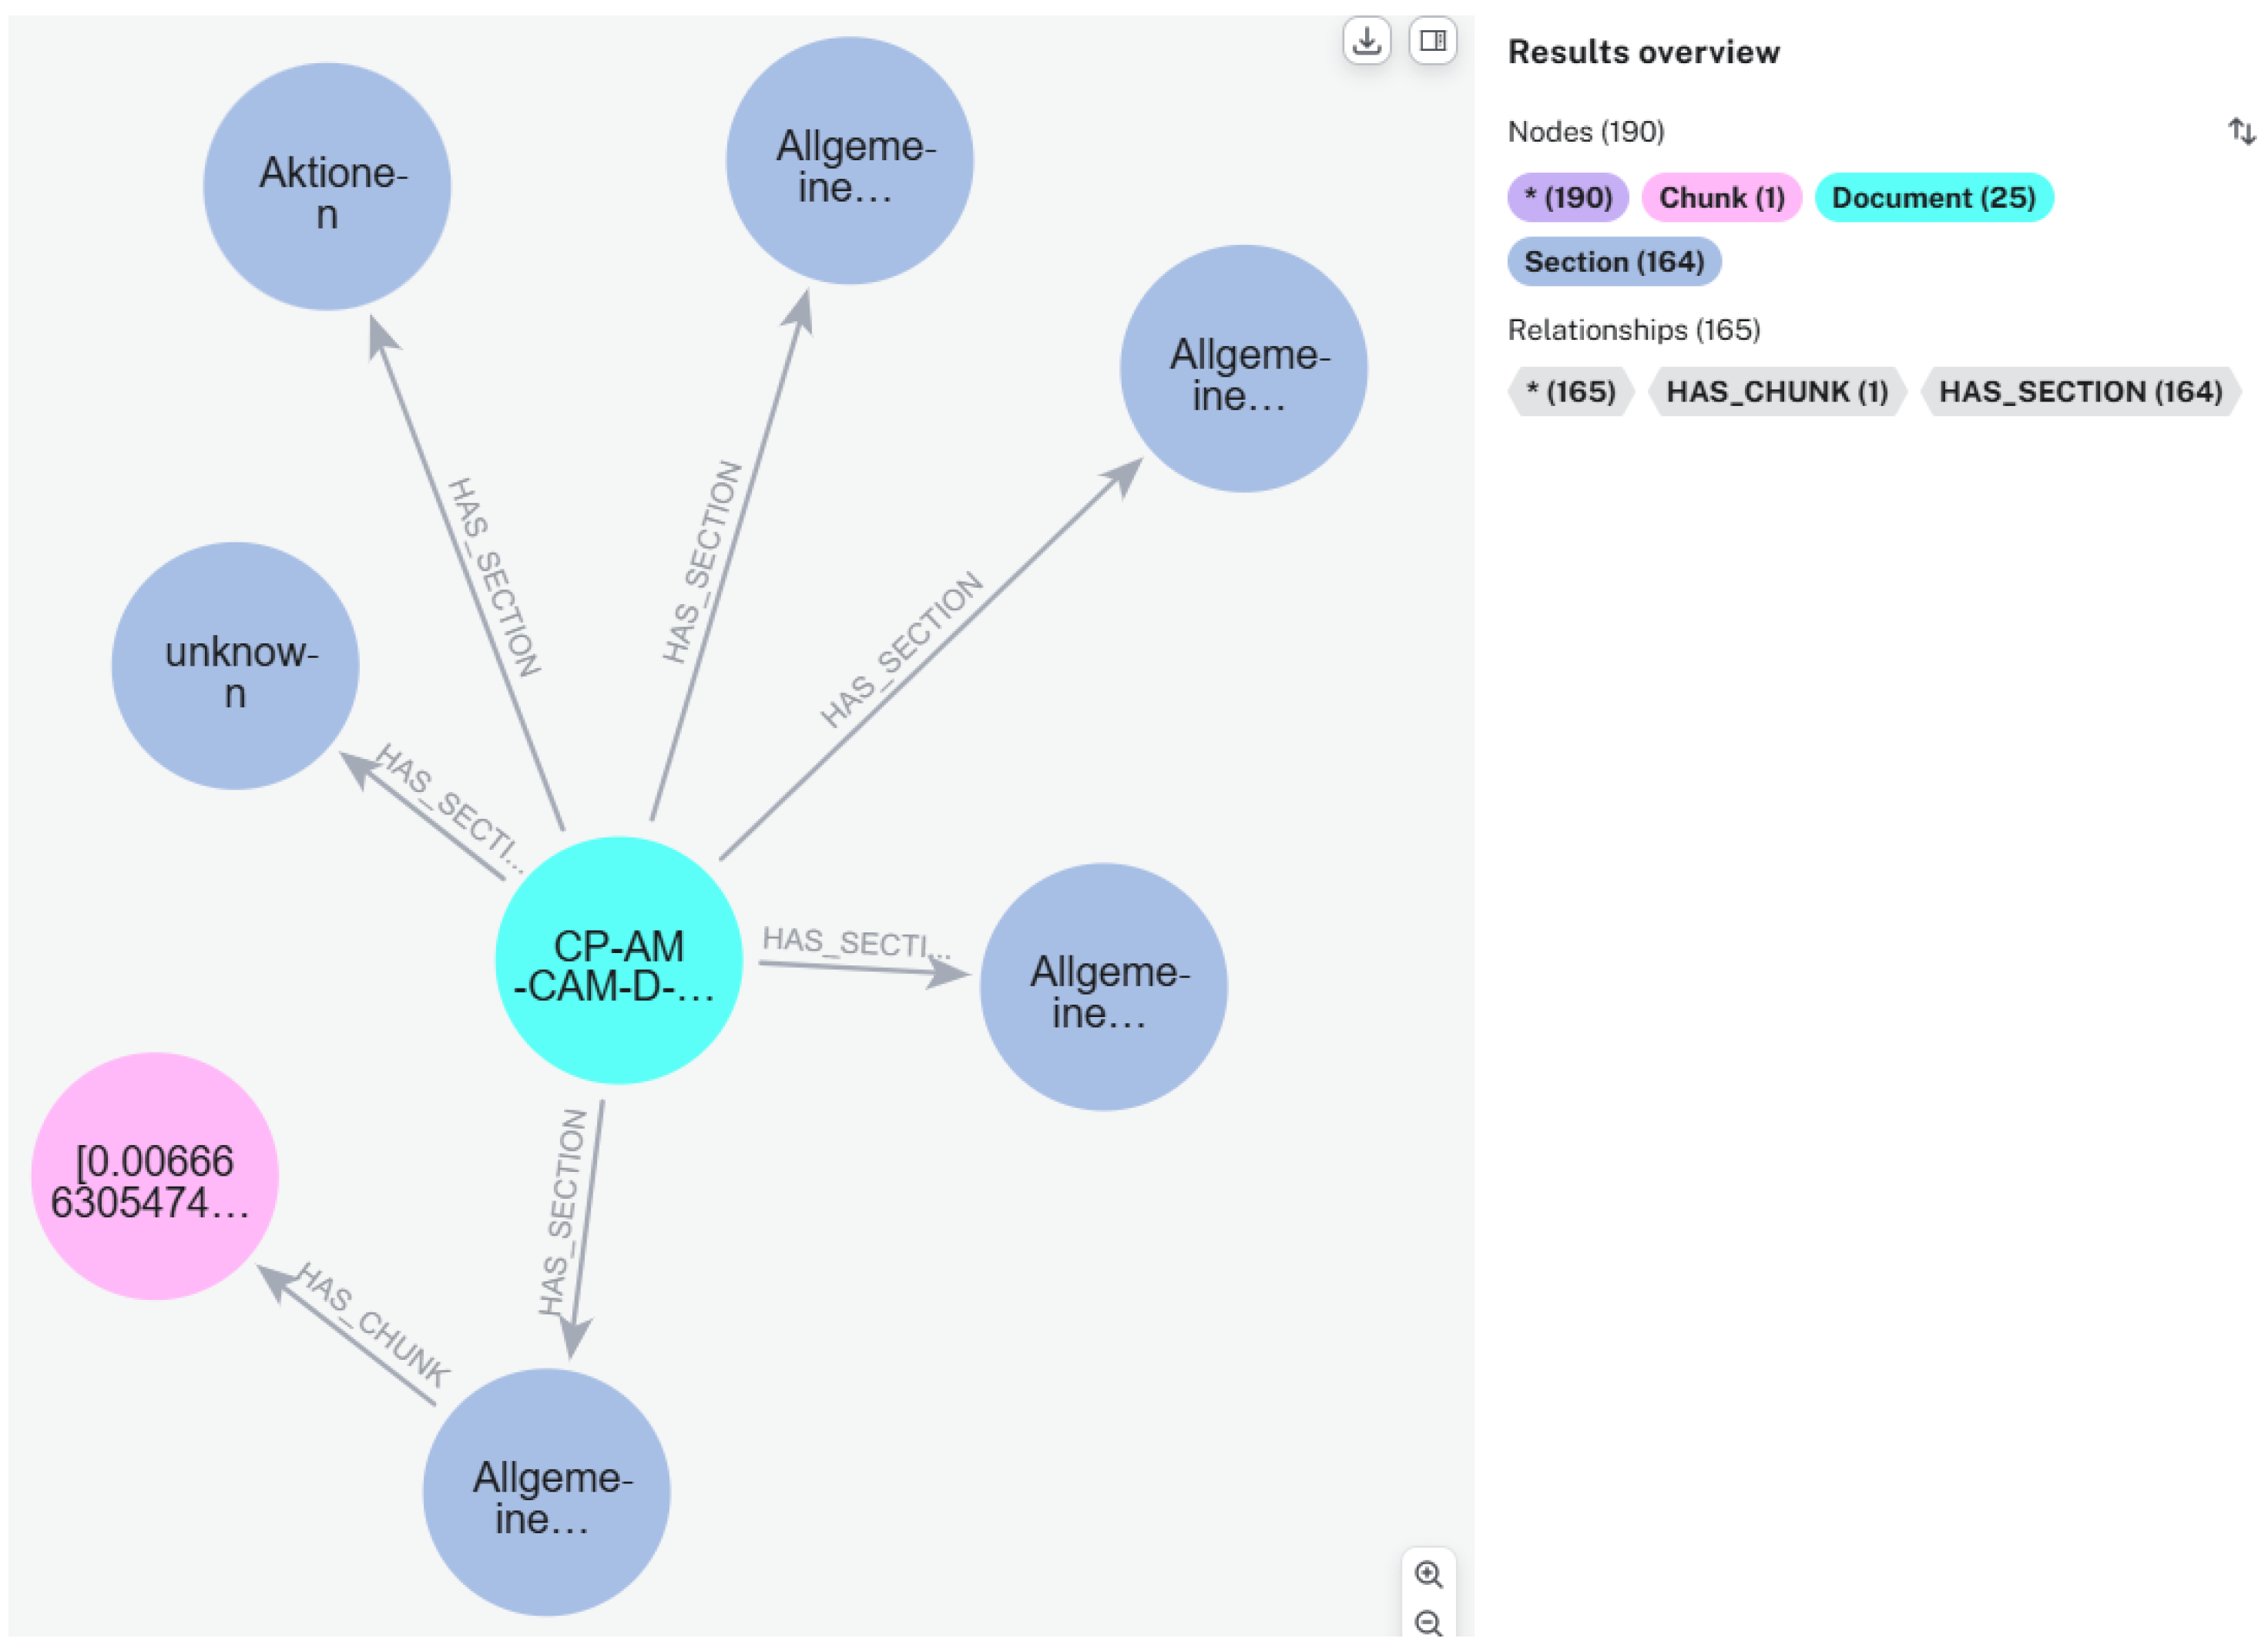
Figure A1. Knowledge graph viewer for one small document.
Bdcc 09 00261 g0a1

References

  1. Johnson, J. Chapter 12—Human Decision-Making is Rarely Rational. In Designing with the Mind in Mind, 3rd ed.; Johnson, J., Ed.; Morgan Kaufmann: Burlington, MA, USA, 2021; pp. 203–223. [Google Scholar] [CrossRef]
  2. Richter, D. Demographic change and innovation: The ongoing challenge from the diversity of the labor force. Manag. Rev. 2014, 25, 166–184. [Google Scholar] [CrossRef]
  3. Khuzadi, M. Knowledge capture and collaboration—Current methods. Neurocomputing 2011, 26, 17–25. [Google Scholar] [CrossRef]
  4. Brynjolfsson, E.; McElheran, K. Data in Action: Data-Driven Decision Making in U.S. Manufacturing. In CES Working Paper No. CES-WP-16-06; Rotman School of Management Working Paper No. 2722502; Rotman School of Management: Toronto, ON, Canada, January 2016. [Google Scholar] [CrossRef]
  5. Balali, F.; Nouri, J.; Nasiri, A.; Zhao, T. Data Intensive Industrial Asset Management, 1st ed.; Springer eBook Collection, Springer International Publishing and Imprint Springer; Springer: Cham, Switzerland, 2020. [Google Scholar] [CrossRef]
  6. Kim, B.; Park, J.; Suh, J. Transparency and accountability in AI decision support: Explaining and visualizing convolutional neural networks for text information. Decis. Support Syst. 2020, 134, 113302. [Google Scholar] [CrossRef]
  7. Alshammari, M.; Nasraoui, O.; Sanders, S. Mining Semantic Knowledge Graphs to Add Explainability to Black Box Recommender Systems. IEEE Access 2019, 7, 110563–110579. [Google Scholar] [CrossRef]
  8. Kartikeya, A. Examining correlation between trust and transparency with explainable artificial intelligence. 10 August 2021. In Explainable AI: Interpreting, Explaining and Visualizing Deep Learning; Springer: Cham, Switzerland, 2022; pp. 310–325. [Google Scholar] [CrossRef]
  9. Ehsan, U.; Wintersberger, P.; Liao, Q.V.; Mara, M.; Streit, M.; Wachter, S.; Riener, A.; Riedl, M.O. Operationalizing Human-Centered Perspectives in Explainable AI. In Proceedings of the Extended Abstracts of the 2021 CHI Conference on Human Factors in Computing Systems; Kitamura, Y., Quigley, A., Isbister, K., Igarashi, T., Eds.; ACM: New York, NY, USA, 2021; pp. 1–6. [Google Scholar] [CrossRef]
  10. Eigner, E.; Händler, T. Determinants of LLM-assisted Decision-Making. arXiv 2024, arXiv:2402.17385. [Google Scholar] [CrossRef]
  11. Gaur, M.; Faldu, K.; Sheth, A. Semantics of the Black-Box: Can Knowledge Graphs Help Make Deep Learning Systems More Interpretable and Explainable? IEEE Internet Comput. 2021, 25, 51–59. [Google Scholar] [CrossRef]
  12. Feng, C.; Zhang, X.; Fei, Z. Knowledge Solver: Teaching LLMs to Search for Domain Knowledge from Knowledge Graphs. arXiv 2023, arXiv:2309.03118. [Google Scholar] [CrossRef]
  13. Liu, Y.; He, H.; Han, T.; Zhang, X.; Liu, M.; Tian, J.; Zhang, Y.; Wang, J.; Gao, X.; Zhong, T.; et al. Understanding LLMs: A Comprehensive Overview from Training to Inference. Neurocomputing 2024, 620, 129190. [Google Scholar] [CrossRef]
  14. Gao, Y.; Xiong, Y.; Gao, X.; Jia, K.; Pan, J.; Bi, Y.; Dai, Y.; Sun, J.; Wang, M.; Wang, H. Retrieval-Augmented Generation for Large Language Models: A Survey. arXiv 2023, arXiv:2312.10997. [Google Scholar] [CrossRef]
  15. Peng, B.; Zhu, Y.; Liu, Y.; Bo, X.; Shi, H.; Hong, C.; Zhang, Y.; Tang, S. Graph Retrieval-Augmented Generation: A Survey. arXiv 2024, arXiv:2408.08921. [Google Scholar] [CrossRef]
  16. Niederhaus, M.; Migenda, N.; Weller, J.; Schenck, W.; Kohlhase, M. Technical Readiness of Prescriptive Analytics Platforms: A Survey. In Proceedings of the 2024 35th Conference of Open Innovations Association (FRUCT), Tampere, Finland, 24–26 April 2024; pp. 509–519. [Google Scholar]
  17. Shah, K.; Salunke, A.; Dongare, S.; Antala, K. Recommender systems: An overview of different approaches to recommendations. In Proceedings of the 2017 International Conference on Innovations in Information, Embedded and Communication Systems (ICIIECS), Coimbatore, India, 17–18 March 2017; pp. 1–4. [Google Scholar] [CrossRef]
  18. Leoni, M.D.; Dees, M.; Reulink, L. Design and Evaluation of a Process-aware Recommender System based on Prescriptive Analytics. In Proceedings of the 2020 2nd International Conference on Process Mining (ICPM), Padua, Italy, 5–8 October 2020; pp. 9–16. [Google Scholar] [CrossRef]
  19. Fan, W.; Ding, Y.; Ning, L.; Wang, S.; Li, H.; Yin, D.; Chua, T.S.; Li, Q. A Survey on RAG Meeting LLMs: Towards Retrieval-Augmented Large Language Models. arXiv 2024. [Google Scholar] [CrossRef]
  20. Edwards, C. Hybrid Context Retrieval Augmented Generation Pipeline: LLM-Augmented Knowledge Graphs and Vector Database for Accreditation Reporting Assistance. arXiv 2024, arXiv:2405.15436. [Google Scholar] [CrossRef]
  21. Weller, J.; Migenda, N.; Kühn, A.; Dumitrescu, R. Prescriptive Analytics Data Canvas: Strategic Planning For Prescriptive Analytics in Smart Factories; Publish-Ing.: Hannover, Germany, 2024. [Google Scholar] [CrossRef]
  22. Hofer, M.; Obraczka, D.; Saeedi, A.; Köpcke, H.; Rahm, E. Construction of Knowledge Graphs: Current State and Challenges. Information 2024, 15, 509. [Google Scholar] [CrossRef]
  23. Tiddi, I.; Schlobach, S. Knowledge graphs as tools for explainable machine learning: A survey. Artif. Intell. 2022, 302, 103627. [Google Scholar] [CrossRef]
  24. Wang, Q.; Mao, Z.; Wang, B.; Guo, L. Knowledge Graph Embedding: A Survey of Approaches and Applications. IEEE Trans. Knowl. Data Eng. 2017, 29, 2724–2743. [Google Scholar] [CrossRef]
  25. Wan, Y.; Liu, Y.; Chen, Z.; Chen, C.; Li, X.; Hu, F.; Packianather, M. Making knowledge graphs work for smart manufacturing: Research topics, applications and prospects. J. Manuf. Syst. 2024, 76, 103–132. [Google Scholar] [CrossRef]
  26. Kommineni, V.K.; König-Ries, B.; Samuel, S. From human experts to machines: An LLM supported approach to ontology and knowledge graph construction. arXiv 2024, arXiv:2403.08345. [Google Scholar] [CrossRef]
  27. Delile, J.; Mukherjee, S.; van Pamel, A.; Zhukov, L. Graph-Based Retriever Captures the Long Tail of Biomedical Knowledge. arXiv 2024, arXiv:2402.12352. [Google Scholar] [CrossRef]
  28. Ji, Z.; Liu, Z.; Lee, N.; Yu, T.; Wilie, B.; Zeng, M.; Fung, P. RHO (ρ): Reducing Hallucination in Open-domain Dialogues with Knowledge Grounding. In Findings of the Association for Computational Linguistics: ACL 2023; ACL: Stroudsburg, PA, USA, 3 December 2022; pp. 4504–4522. [Google Scholar] [CrossRef]
  29. Shu, D.; Chen, T.; Jin, M.; Zhang, C.; Du, M.; Zhang, Y. Knowledge Graph Large Language Model (KG-LLM) for Link Prediction. In Proceedings of the 16th Asian Conference on Machine Learning (ACML), Hanoi, Vietnam, 5–8 December 2024; PMLR; Volume 260, pp. 143–158. Available online: https://proceedings.mlr.press/v260/shu25a.html (accessed on 8 October 2025).
  30. Yang, S.; Gribovskaya, E.; Kassner, N.; Geva, M.; Riedel, S. Do Large Language Models Latently Perform Multi-Hop Reasoning? arXiv 2024, arXiv:2402.16837. [Google Scholar] [CrossRef]
  31. Nguyen, M.V.; Luo, L.; Shiri, F.; Phung, D.; Li, Y.F.; Vu, T.T.; Haffari, G. Direct Evaluation of Chain-of-Thought in Multi-hop Reasoning with Knowledge Graphs. In Findings of the Association for Computational Linguistics: ACL 2024; ACL: Stroudsburg, PA, USA, 17 February 2024; pp. 2862–2883. [Google Scholar] [CrossRef]
  32. Kojima, T.; Gu, S.S.; Reid, M.; Matsuo, Y.; Iwasawa, Y. Large Language Models Are Zero-Shot Reasoners. In Proceedings of the 36th International Conference on Neural Information Processing Systems (NeurIPS 2022), New Orleans, LA, USA, 28 November–9 December 2022. [Google Scholar]
  33. Morris, J.X.; Kuleshov, V.; Shmatikov, V.; Rush, A.M. Text Embeddings Reveal (Almost) As Much As Text. In Proceedings of the 2023 Conference on Empirical Methods in Natural Language Processing (EMNLP 2023), Singapore, 6–10 December 2023; pp. 12448–12460. [Google Scholar] [CrossRef]
  34. Mikolov, T.; Chen, K.; Corrado, G.; Dean, J. Efficient Estimation of Word Representations in Vector Space. In Proceedings of the 1st International Conference on Learning Representations (ICLR 2013 Workshop Track), Scottsdale, AZ, USA, 2–4 May 2013. [Google Scholar] [CrossRef]
  35. Synergistic Union of Word2Vec and Lexicon for Domain Specific Semantic Similarity; IEEE: New York, NY, USA, 2017.
  36. OpenAI. GPT-4o Mini. 2024. Available online: https://openai.com/index/introducing-gpt-4o-mini (accessed on 8 October 2025).
  37. Meta AI. Meta-Llama 3 (8B and 70B Models). 18 April 2024. Available online: https://ai.meta.com/blog/meta-llama-3/ (accessed on 8 October 2025).
  38. Ollama. Ollama: Run Large Language Models Locally. 2024. Available online: https://ollama.com (accessed on 8 October 2025).
  39. Jin, M.; Wang, S.; Ma, L.; Chu, Z.; Zhang, J.Y.; Shi, X.; Chen, P.Y.; Liang, Y.; Li, Y.F.; Pan, S.; et al. Time-LLM: Time Series Forecasting by Reprogramming Large Language Models. In Proceedings of the 12th International Conference on Learning Representations (ICLR 2024), Vienna, Austria, 7–11 May 2024. [Google Scholar]
  40. Gruver, N.; Finzi, M.; Qiu, S.; Wilson, A.G. Large Language Models Are Zero-Shot Time Series Forecasters. 11 October 2023. NeurIPS 2023. Available online: https://github.com/ngruver/llmtime (accessed on 19 August 2024).
  41. Garza, A.; Challu, C.; Mergenthaler-Canseco, M. TimeGPT-1. arXiv 2023, arXiv:2310.03589. [Google Scholar] [CrossRef]
  42. Rasul, K.; Ashok, A.; Williams, A.R.; Ghonia, H.; Bhagwatkar, R.; Khorasani, A.; Bayazi, M.J.D.; Adamopoulos, G.; Riachi, R.; Hassen, N.; et al. Lag-Llama: Towards Foundation Models for Probabilistic Time Series Forecasting. 12 October 2023. First Two Authors Contributed Equally. All Data, Models and Code Used Are Open-Source. GitHub. Available online: https://github.com/time-series-foundation-models/lag-llama (accessed on 24 July 2024).
  43. Zhou, T.; Niu, P.; Wang, X.; Sun, L.; Jin, R. One Fits All: Power General Time Series Analysis by Pretrained LM. In Proceedings of the 36th Conference on Neural Information Processing Systems (NeurIPS 2023), Vancouver, BC, Canada, 23 February 2023; Available online: https://proceedings.neurips.cc/paper_files/paper/2023/hash/86c17de05579cde52025f9984e6e2ebb-Abstract-Conference.html (accessed on 8 October 2025).
  44. Huguet Cabot, P.L.; Navigli, R. REBEL: Relation Extraction By End-to-end Language generation. In Proceedings of the Findings of the Association for Computational Linguistics: EMNLP 2021; Association for Computational Linguistics: Stroudsburg, PA, USA, 2021; pp. 2370–2381. [Google Scholar] [CrossRef]
  45. Chen, Z.; Guo, C. A pattern-first pipeline approach for entity and relation extraction. Neurocomputing 2022, 494, 182–191. [Google Scholar] [CrossRef]
  46. Kovalerchuk, B.; Fegley, B. LLM Enhancement with Domain Expert Mental Model to Reduce LLM Hallucination with Causal Prompt Engineering. arXiv 2025, arXiv:2509.10818. [Google Scholar] [CrossRef]
  47. Beijing Academy of Artificial Intelligence. bge-small-en-v1.5. 2024. Available online: https://huggingface.co/BAAI/bge-small-en-v1.5 (accessed on 8 October 2025).
  48. Beijing Academy of Artificial Intelligence. bge-base-en-v1.5. 2024. Available online: https://huggingface.co/BAAI/bge-base-en-v1.5 (accessed on 8 October 2025).
  49. Muennighoff, N.; Tazi, N.; Magne, L.; Reimers, N. MTEB: Massive Text Embedding Benchmark. arXiv 2022, arXiv:2210.07316. [Google Scholar] [CrossRef]
  50. Vater, J.; Schlaak, P.; Knoll, A. A Modular Edge-/Cloud-Solution for Automated Error Detection of Industrial Hairpin Weldings using Convolutional Neural Networks. In Proceedings of the 2020 IEEE 44th Annual Computers, Software, and Applications Conference (COMPSAC), Madrid, Spain, 13–17 July 2020; pp. 505–510. [Google Scholar] [CrossRef]
  51. Vater, J.; Harscheidt, L.; Knoll, A. A Reference Architecture Based on Edge and Cloud Computing for Smart Manufacturing. In Proceedings of the 2019 28th International Conference on Computer Communication and Networks (ICCCN), Valencia, Spain, 29 July–1 August 2019; pp. 1–7. [Google Scholar] [CrossRef]
  52. Perea, R.V.; Festijo, E.D. Analytics Platform for Morphometric Grow out and Production Condition of Mud Crabs of the Genus Scylla with K-Means. In Proceedings of the 2021 4th International Conference of Computer and Informatics Engineering (IC2IE), Depok, Indonesia, 14–15 September 2021; pp. 117–122. [Google Scholar] [CrossRef]
  53. Bashir, M.R.; Gill, A.Q.; Beydoun, G. A Reference Architecture for IoT-Enabled Smart Buildings. SN Comput. Sci. 2022, 3, 493. [Google Scholar] [CrossRef]
  54. Gröger, C. Building an Industry 4.0 Analytics Platform. Datenbank-Spektrum 2018, 18, 5–14. [Google Scholar] [CrossRef]
  55. Filz, M.A.; Bosse, J.P.; Herrmann, C. Digitalization platform for data-driven quality management in multi-stage manufacturing systems. J. Intell. Manuf. 2024, 35, 2699–2718. [Google Scholar] [CrossRef]
  56. Ribeiro, R.; Pilastri, A.; Moura, C.; Morgado, J.; Cortez, P. A data-driven intelligent decision support system that combines predictive and prescriptive analytics for the design of new textile fabrics. Neural Comput. Appl. 2023, 35, 17375–17395. [Google Scholar] [CrossRef]
  57. Von Bischhoffshausen, J.K.; Paatsch, M.; Reuter, M.; Satzger, G.; Fromm, H. An Information System for Sales Team Assignments Utilizing Predictive and Prescriptive Analytics. In Proceedings of the 2015 IEEE 17th Conference on Business Informatics, Lisbon, Portugal, 13–16 July 2015; pp. 68–76. [Google Scholar] [CrossRef]
  58. Divyashree, N.; Nandini Prasad, K.S. Design and Development of We-CDSS Using Django Framework: Conducing Predictive and Prescriptive Analytics for Coronary Artery Disease. IEEE Access 2022, 10, 119575–119592. [Google Scholar] [CrossRef]
  59. Hentschel, R. Developing Design Principles for a Cloud Broker Platform for SMEs. In Proceedings of the 2020 IEEE 22nd Conference on Business Informatics (CBI), Antwerp, Belgium, 22–24 June 2020; pp. 290–299. [Google Scholar]
  60. Madrid, M.C.R.; Malaki, E.G.; Ong, P.L.S.; Solomo, M.V.S.; Suntay, R.A.L.; Vicente, H.N. Healthcare Management System with Sales Analytics using Autoregressive Integrated Moving Average and Google Vision. In Proceedings of the 2020 IEEE 12th International Conference on Humanoid, Nanotechnology, Information Technology, Communication and Control, Environment, and Management (HNICEM), Manila, Philippines, 3–7 December 2020; pp. 1–6. [Google Scholar]
  61. Lepenioti, K.; Bousdekis, A.; Apostolou, D.; Mentzas, G. Human-Augmented Prescriptive Analytics with Interactive Multi-Objective Reinforcement Learning. IEEE Access 2021, 9, 100677–100693. [Google Scholar] [CrossRef]
  62. Sam Plamoottil, S.; Kunden, B.; Yadav, A.; Mohanty, T. Inventory Waste Management with Augmented Analytics for Finished Goods. In Proceedings of the 2023 Third International Conference on Artificial Intelligence and Smart Energy (ICAIS), Coimbatore, India, 2–4 February 2023; pp. 1293–1299. [Google Scholar]
  63. Rehman, A.; Naz, S.; Razzak, I. Leveraging big data analytics in healthcare enhancement: Trends, challenges and opportunities. Multimed. Syst. 2022, 28, 1339–1371. [Google Scholar] [CrossRef]
  64. Adi, E.; Anwar, A.; Baig, Z.; Zeadally, S. Machine learning and data analytics for the IoT. Neural Comput. Appl. 2020, 32, 16205–16233. [Google Scholar] [CrossRef]
  65. Mustafee, N.; Powell, J.H.; Harper, A. RH-RT: A data analytics framework for reducing wait time at emergency departments and centres for urgent care. In Proceedings of the 2018 Winter Simulation Conference (WSC), Gothenburg, Sweden, 9–12 December 2018; pp. 100–110. [Google Scholar]
Figure 1. Schematic representation of our prescriptive analytics platform. Our implemented prescriptive analytics platform is shown in detailed in Section 4. Implicit knowledge is continuously extracted from sensor data and software connections, while explicit knowledge is extracted from documents. Both forms of knowledge are processed individually and stored in the same knowledge graph. The prescriptive unit extracts insights from the knowledge graph in order to provide recommendations, actions, and explanations.
Bdcc 09 00261 g001
Figure 2. Overview of the smart factory used for the experiments. The prescriptive analytics platform was implemented and thoroughly validated in this realistic research environment, ensuring real-world usability. (a) Top view on the IoT-Factory. (b) Close-up view showing one of the robot assembly stations.
Bdcc 09 00261 g002
Figure 3. Schematic representation of how we record the data at the IoT-Factory and transfer it to our prescriptive platform. We use a variety of protocols, such as MQTT, OPCUA, and Rest API to forward and standardize the data.
Bdcc 09 00261 g003
Figure 4. Snippet of a robot arm document containing error codes and descriptions.
Bdcc 09 00261 g004
Figure 5. This figure shows the 2D embedding space of all document segment embeddings of the IoT-factory, using t-SNE. The data points are labeled by their file paths, which identify the document station of the IoT-Factory they originate from. The clusters formed in the visualization demonstrate that the document segments exhibit distinct content differences, with similar content being grouped together.
Bdcc 09 00261 g005
Figure 6. The figure shows the confusion matrix for the results of the zero-shot classifier, compared to the ground truth provided by an expert. High accuracy was achieved for the ‘Action’ and ‘Context’ categories. However, some misclassifications occurred between ‘Action’ and ‘Context’, as well as between ‘Error’ and ‘Context’.
Bdcc 09 00261 g006
Figure 7. Figures (af) show six sensors of the IoT-Factory. The data represent a brief assembly process in which two components are assembled. (ac) are force sensors that measure the force exerted in the x, y, and z directions. (df) are torque sensors that measure the torque exerted by the robot around the x, y, and z axes.
Bdcc 09 00261 g007
Figure 8. This figure shows the implementation of our prescriptive analytics platform. The architecture is divided into functional components, including data ingestion, knowledge extraction, prescriptive analytics, and user interaction.
Bdcc 09 00261 g008
Table 1. Customer clinics results.
QuestionTime Spent per Question [min]Average
[min]
Our Solution
[min]
Group 1Group 2Group 3
The error StaubliRobot.Error occurred on RASS301:1100:5201:3001:1100:18
The Kuka PickandSort brake test failed01:4901:4202:3002:0300:21
Conveyor belt pneumatic commissioning failed04:4303:2605:0004:2300:17
Throttle check valve GRO-QS-4 operating pressure too high05:1411:17-08:1600:25
Note: Bold values indicate the results achieved using the proposed solution.
Disclaimer/Publisher’s Note: The statements, opinions and data contained in all publications are solely those of the individual author(s) and contributor(s) and not of MDPI and/or the editor(s). MDPI and/or the editor(s) disclaim responsibility for any injury to people or property resulting from any ideas, methods, instructions or products referred to in the content.