1. Introduction
Lung cancer diagnosis and treatment remain a challenge, representing a significant global health concern due to its high mortality rates. Non-small cell lung Cancer (NSCLC) constitutes the primary cause of cancer deaths worldwide in both men and women [
1]. Among the multiple manifestations of lung cancer, solitary pulmonary nodules (SPNs) stand out as an area of critical focus [
2]. The mortality associated with SPNs underscores the urgency of understanding and promptly managing these lesions. The prognosis of lung cancer is closely tied to the stage at which it is diagnosed [
3]. SPNs, discrete lesions in the lung parenchyma, demand particular attention due to the potential for malignancy. Mortality rates are significantly influenced by when the SPN is detected for the first time, with delayed detection leading to advanced stages of disease and diminished treatment efficacy. Elucidating pathways for the early identification and accurate classification of SPNs is crucial for improving patient outcomes.
Imaging modalities, particularly computerized tomography (CT) and positron emission tomography (PET), play a dominant role in the diagnostic landscape of SPNs [
4,
5]. CT scans offer detailed anatomical information, enabling the characterization of nodule morphology and facilitating the assessment of size, shape, and density. Conversely, PET provides metabolic information, aiding the differentiation between benign and malignant nodules. The synergistic use of CT and PET enhances diagnostic accuracy, offering a comprehensive understanding of both the anatomical and functional aspects of SPNs.
Despite advancements in imaging technologies, the interpretation of SPNs remains susceptible to human error, contributing to diagnostic uncertainty. Additionally, the conventional diagnostic process is often time-consuming, leading to delays in treatment initiation. The intricate nature of SPNs, coupled with the need for meticulous imaging and clinical data analysis, poses a challenge for timely and accurate decision making.
Machine learning (ML) emerges as a promising method to augment the diagnostic capabilities in SPN classification [
6,
7,
8]. With the aid of computational algorithms, ML models can process vast amounts of imaging and clinical data, discern patterns, and derive predictive insights. Various innovative models have specifically been developed for interpreting CT scans and/or PET images, alongside assessing the clinical and morphological features pertaining to SPNs. Deep learning algorithms such as convolutional neural networks (CNNs) have been extensively applied due to their proficiency in handling and analyzing volumetric imaging data [
9,
10,
11,
12,
13,
14,
15,
16,
17,
18,
19]. Furthermore, ensemble methods such as random forests have been employed, leveraging a combination of imaging characteristics and patient data to enhance diagnostic accuracy [
5,
8,
13,
16,
20,
21,
22]. These models benefit from their ability to integrate and analyze multiple data types, providing a holistic view that supports more reliable and robust diagnostic decisions.
While ML can indeed assist by flagging potential issues and corroborating findings, its precision is not infallible and does not approach the near-100% accuracy often required in clinical settings. Therefore, the role of human readers is still paramount, ensuring that diagnoses and treatment plans are grounded in both technological support and the invaluable insights derived from clinical experience. Indeed, existing medical imaging literature exhibits several limitations. A significant drawback lies in the pervasive lack of methodological transparency across numerous studies, impeding the reproducibility and understanding of proposed approaches. Furthermore, the field grapples with a dearth of effective multi-modal methodologies, particularly in integrating PET and CT images. The predominant emphasis on unimodal analyses overlooks the potential synergies arising from a more comprehensive fusion of imaging modalities. Additionally, the limited inclusion of manually extracted features alongside PET and CT data constrains the holistic characterization of medical images. Integrating physicians’ subjective evaluations or diagnostic yields as additional inputs for building the models is rarely met in the existing literature, despite the fact that the latter may improve the models [
23,
24]
In recent years, there has been a significant shift towards explainable artificial intelligence (XAI) in medical applications. XAI refers to AI systems designed to provide transparent and interpretable insights into their decision-making processes. The drive towards XAI is particularly strong in the medical field due to the critical need for trust and accountability in healthcare. Medical decisions have profound implications for patient outcomes, and opaque “black-box” models pose significant challenges in this high-stakes context.
This study proposes an automated and explainable SPN diagnosis solution based on ML. More precisely, integrating data from CT, PET, and clinical features, a multi-modal network provides a holistic perspective surpassing the individual modalities’ limitations.
The contributions of this paper are the following:
A multi-modal framework is presented to handle PET and CT efficiently, as well as manually extracted image features of patients with SPNs
The presented framework exhibits excellent agreement with the human readers, which is crucial for the feasibility of such frameworks.
The proposed network shows high-level detection of malignant SPNs in multi-modal data concerning biopsy-confirmed SPNs of the ablation study.
The explainability-enhancing method of the saliency maps and the feature importance provide valuable insights into the available data.
2. Related Work
Apostolopoulos et al. [
7] introduced a 3D CNN developed for extracting representative features of SPN representations. The Lung Image Database Consortium and Image Database Resource Initiative (LIDC-IDRI) dataset, comprising 2124 SPNs represented in sets of 2D slices, was used to evaluate the model. Through concatenating 16 slices for each SPN, 3D nodule representations were constructed. Their proposal demonstrated a notable 90.68% accuracy in distinguishing benign from malignant SPNs, focusing on strongly labelled subsets of the dataset (898 unique SPNs). To leverage weakly labelled SPNs, a semi-supervised training algorithm was employed, progressively expanding the training dataset with confident predictions. This strategy successfully classified 1585 SPNs with an accuracy of 87.44%. Ultimately, their network was trained and tested using the complete dataset (2124 SPNs), achieving an overall accuracy of 89.68% in distinguishing between benign and malignant nodules.
In [
9], the authors propose a hierarchical CNN called feature fusion VGG19 (FF-VGG19), which enhances feature extraction. To address the scarcity of large-scale data, they use a dataset, LIDC-IDRI, and a small CT scan dataset derived from a PET/CT system. Realistic nodule representations are generated using deep convolutional generative adversarial networks (DC-GAN) to overcome data limitations. The generated nodule images are classified into two classes using a semi-supervised approach called self training to handle weak labelling. The DC-GAN produces realistic SPNs with synthetic nodules that challenge even experts. The proposed CNN, based on VGG-16, achieves a classification accuracy increase of +7% on LIDC-IDRI (92.07%) and +5% on the CT dataset (84.3%).
The authors of [
10] aimed to enhance the accuracy of benign–malignant classification in low-dose computed tomography (LDCT) scans for early lung cancer detection. Recognizing the complexity of the nodule–cancer relationship, the study proposed a method relying on deep abstract features to predict nodule malignancy. A dual pathway model was developed to efficiently capture intra-nodule heterogeneities and contextual information, integrating both aspects. This approach incorporated supervised and unsupervised learning schemes, with a random forest model as a classification component. Results from 1297 manually segmented nodules demonstrated a high discrimination power of 0.936 in the area under the receiver operating characteristic curve (AUROC). The study concludes that integrating nodule target and context images into a unified network significantly improves discrimination power compared to conventional single-pathway convolutional neural networks.
Char et al. [
11] introduced CT-lungNET, a DL model for malignancy prediction in small pulmonary nodules (≤2 cm) on non-enhanced chest CT. The study collected 173 CT images with 208 nodules, evaluating CT-lungNET against AlexNET. CT-lungNET exhibited an improved AUROC of 0.85 (95% CI: 0.74–0.93) compared to AlexNET (0.82; 95% CI: 0.71–0.91). The authors employed an observer performance test involving different expertise groups, revealing that CT-lungNET enhanced classification performance for non-radiologists (mean AUC improvement: 0.13; range: 0.03–0.19), while the improvement was not significant for radiologists (mean AUC improvement: 0.02; range: −0.02 to 0.07).
In [
9], the authors introduced a semi-supervised deep transfer learning (SDTL) framework for benign–malignant pulmonary nodule diagnosis. Due to the small size of samples with pathological proof, an iterated feature-matching-based semi-supervised method is proposed, leveraging a larger dataset without pathological results. A similarity metric function in the network semantic representation space is used to iteratively optimize the classification network by gradually incorporating samples with no pathological results. The study involved 3038 pulmonary nodules with pathologically-proven labels and 14,735 unlabeled nodules. SDTL achieved superior diagnosis performance, with an accuracy of 88.3% and an AUC of 91.0% in the primary dataset and an accuracy of 74.5% and AUC of 79.5% in the independent testing dataset. An ablation study revealed that transfer learning contributes to a 2% accuracy improvement, and semi-supervised learning provides an additional 2.9% improvement.
The authors of [
16] assessed the effectiveness of combining 18F-FDG PET/CT radiomic features with ML to distinguish between benign and malignant SPNs. Analyzing the data from 48 patients, the models achieved reasonable performance (AUCs~0.81). Notably, the DL model exhibited higher sensitivity (88% vs. 83%), and the classical learning model demonstrated increased specificity (86% vs. 79%) compared to conventional evaluation.
Wang et al. [
25] proposed a novel approach for the classification task using a multiple-scale residual network (MResNet). The MResNet integrates the advantages of residual units and a pyramid pooling module (PPM) to extract general features for lung nodule classification precisely through deep learning. Leveraging ResNet as a backbone network, it learns contextual information, while the PPM fuses features across multiple scales. The testing set results show 85.23% accuracy, 92.79% sensitivity, 72.89% specificity, 84.56% PPV, 86.34% NPV, and an AUC of 0.9275.
In [
12], the authors used the dual time point imaging (DTPI) protocol to acquire FDG PET/CT images and investigate the potential of quantitative heterogeneity derived from various texture features to enhance discrimination between malignant and benign SPNs. Employing ML methods, the study demonstrated that models trained on texture features from DTPI images outperformed standard clinical metrics and visual interpretation. Notably, texture features extracted from delayed FDG PET/CT images significantly improved the ability to distinguish between benign and malignant SPNs. This research highlights the promising role of quantitative heterogeneity analysis through ML in refining early diagnosis and classification of lung cancer in granuloma-endemic regions.
In [
22], the authors used a retrospective cohort study involving 187 cases of non-small cell lung cancer (NSCLC) and 190 benign pulmonary nodules to evaluate a diagnosis model trained using twelve PET and CT features. The model verified the standardized uptake value (SUV) as a crucial biochemical factor for early-stage lung cancer. The PET/CT diagnosis model exhibited a sensitivity and area under the curve (AUC) of 86.5% and 0.89, respectively. Validation in separate cohorts of 462 and 229 cases demonstrated consistently high sensitivity and AUC.
The extant body of scholarly work in medical imaging has yielded numerous commendable contributions; nevertheless, it is imperative to recognize and redress the prevailing constraints inherent in this domain. A significant limitation lies in the scarcity of approaches that effectively integrate PET and CT images seamlessly and multi-modally. The predominant focus on unimodal analyses in the existing research neglects the potential synergies derived from these imaging modalities. Additionally, the limited inclusion of manually extracted features alongside the PET and CT data further curtails the comprehensive characterization of medical images. Thoroughly exploring these multi-faceted datasets is important for realizing heightened diagnostic precision. Moreover, the current body of literature overlooks the integration of physicians’ subjective assessments and opinions that could enhance the interpretability and reliability of automated methodologies.
In our work, we aim at addressing some of the aforementioned challenges. Specifically, our approach combines PET and CT imaging features, which are either automatically extracted from ML processing methods or manually extracted from the human readers. Since our method does not rely on explainable radiomic features [
5,
8], we proposed the use of saliency maps to visualize important regions in the CT image, as well as the feature importance method of the ML algorithm to analyze the weight of each feature to the outcome.
3. Materials and Methods
3.1. Patient Data
3.1.1. Positron Emission Tomography
Positron emission tomography (PET) is a cornerstone in diagnosing and managing lung cancer. In lung cancer, PET is essential in distinguishing benign from malignant lesions, aiding in accurate staging and treatment planning. For SPNs, PET’s ability to assess glucose metabolism enhances the precision of diagnosis, enabling clinicians to differentiate between potentially harmful nodules and those of lesser concern. PET/CT has recently been proven the most sensitive and accurate modality to detect NSCLC (first occurrence and local, regional, or distant metastases) [
26]. With evaluation accuracies of ≤3 cm and ≥0.6 cm in diameter in identifying SPNs, PET/CT became essential in (a) determining staging and re-staging of NSCLC, (b) detecting recurrent or residual disease [
27], (c) evaluating response to therapy, (d) providing prognostic information, and (e) therapy planning and monitoring [
28]. In this study, a hybrid PET/CT scanner was utilized (Discovery iQ3 sl16, GE Healthcare, Chicago, IL, USA). This system uses three detector rings with a 15 cm field of view to reconstruct 35 axial images at 4.25 mm intervals. Three-dimensional (3D) volumes are acquired to represent the whole body using various bed positions. At the same time, the patient was in a supine position.
3.1.2. Computerized Tomography
Offering detailed anatomical insights, CT plays a crucial role in characterizing the morphology and density of pulmonary lesions. In lung cancer diagnosis, CT aids in identifying and precisely locating tumors, facilitating effective treatment planning. When applied to SPNs, CT is instrumental in discerning the structural attributes of nodules, assisting in the differentiation between benign and malignant lesions. The high-resolution imaging provided by CT contributes to early detection and informed decision-making, which is crucial in the comprehensive management of pulmonary abnormalities. To acquire the CT images, sixteen detectors of 3.75 mm size, 1.5 pitch, and 5 mm collimation are placed. The CT exposure factors are 120–140 kVp and 80 mAs. The CT images are acquired in free-breathing mode. The CT slice thickness was 1.25.
3.1.3. Data Collection
The study period ranges from 2018 to 2022. Over this period, more than 1200 PET/CT scans were scanned and examined to identify potential participants. Scans that did not contain SPNs were excluded. Moreover, studies that contained lung nodules with a diameter greater than 3 cm were discarded. As a result, 498 PET/CT scans qualified for the study. The total amount of localized SPNs is 498.
SPN malignancy characterization has been carried out by the physicians or radiologists using either (a) biopsy results, (b) a verdict based on a combination of image and clinical factors (age, tobacco smoking or exposure to secondhand smoke, occupational hazards, previous chronic lung diseases), or (c) patient follow-up. The nature of the survey waives the requirement to obtain patients’ informed consent. Each participant is accompanied by one PET and one CT scan. The PET/CT scanner performs the latter.
Table 1 presents an overview of the study population and the dataset characteristics.
All data collection, including PET, CT, and clinical information, was conducted with a strict commitment to anonymity. Sensitive DICOM data were promptly removed post-image collection, and the clinical data solely employed anonymous identification numbers instead of patient names. This ethical approach adheres to the principles outlined in the Declaration of Helsinki, safeguarding participant privacy while ensuring the highest standards in medical research. The complete procedure for data collection is illustrated in
Figure 1.
The dataset consists of 7 features, as explained in
Table 2. The features are numeric or categorical and cover a wide range of clinical factors that the medical staff considers for SPN diagnosis.
The image characteristics of this database are presented in
Table 3. All images come in the DICOM format standard.
3.1.4. Data Split
We split our data into two distinct datasets (
Figure 2). The first dataset is used for training and validation purposes and contains SPNs without histopathological confirmation. The second is used for the ablation study and includes SPNs with biopsy confirmation.
3.2. Explainable Multi-Modal Deep Learning Framework
3.2.1. Convolutional Neural Network for Processing Image Data
Convolutional neural networks (CNNs) [
29] stand out as a cornerstone in image processing. CNNs represent a specialized class of deep neural networks designed for tasks involving image recognition and analysis [
30]. The core innovation lies in their ability to automatically and adaptively learn spatial hierarchies of features directly from raw pixel data.
The fundamental building blocks of CNNs are convolutional layers [
31]. Analogous to receptive fields in the human visual system, these layers scan input images using convolutional filters. This process captures local features such as edges, textures, and shapes, progressively assembling a hierarchical input representation.
The CNN of the study is a fine-tuned virtual geometry group (VGG) network [
32]. VGG19 has been widely selected for similar tasks [
6,
7] in the recent research work of our team. Therefore, for the present study, we employed it under a similar parameter and hyper-parameter configuration. VGG19 is a version of VGG devised by Simonyan and Zisserman in 2014 [
32], comprising 19 layers (16 convolutional layers, three fully connected layers, five max-pooling layers, and culminating in a softmax layer). If trained from scratch, VGG19 has 144 million learnable parameters and 19.6 billion floating point operations (FLOPs) per inference. However, the present application of VGG19 is through the conception of transfer learning.
Trained on the ImageNet [
33] dataset, housing 1.2 million images across 1000 classes, VGG19 showcased a pioneering top-5 error rate of 7.3% on the ImageNet test set at its inception. Hence, this network possesses a remarkable ability to discern intricate patterns and features within images. By fine-tuning this pre-trained model on medical datasets specifically tailored to diverse medical imaging modalities, the network can swiftly adapt its learned features to the unique nuances of medical images. This process significantly reduces the demand for extensive labelled medical data, a valuable resource often limited in the medical field.
We froze all the convolutional layers to retain the feature extraction capabilities obtained from its original training in the ImageNet [
33] database. After the final convolution blocks, we connected a dense network to distinguish between essential and redundant image features. This network receives the image features and uses them to perform the final classification. Global average pooling is adopted to reduce spatial dimensions, aiding in regularization. The dense layer consists of 1200 nodes, creating a densely connected network. A 50% dropout rate is applied to the dense layer during training, a technique for mitigating overfitting. The Adam optimizer is chosen, offering adaptive learning rates based on gradient information. Categorical cross-entropy is the loss function suitable for similar classification tasks. The model processes images of size (120, 120, 3), employing augmentation techniques like rotation, width-shift, height-shift, horizontal flip, and vertical flip. The training is configured with a batch size of 32, a maximum of 200 epochs, and early stopping criteria at 92% validation and 92% training accuracy. Complete information regarding the parameters, hyper-parameters, and training settings are supplied in
Table S1.
3.2.2. Extreme Gradient Boosting (XGBoost)
The (extreme gradient boosting (XGBoost) [
34] model leverages a comprehensive set of features, including gender, age, SUVmax, diameter, location, type, margins, and CNN-based CT and PET imaging predictions. The aspect lies in incorporating CNN-CT and CNN-PET predictions, which encapsulate the deep learning insights derived from both CT and PET imaging.
XGBoost emerges as a highly versatile ML algorithm, widely acclaimed for its exceptional efficacy across many computational tasks. At its foundational core, XGBoost operates upon the principle of boosting, wherein a sequential training methodology is employed. This method systematically incorporates weak learners into an ensemble, often represented as decision trees. Each subsequent integration of a weak learner operates in concert to rectify the errors inherent in its predecessors, yielding a progressively refined model. A salient feature of XGBoost lies in its introduction of gradient boosting, an advanced technique that optimizes the model’s performance through the meticulous minimization of gradients associated with a specified loss function.
The XGBoost classifier is configured with a learning rate of 0.1, determining the step size during optimization. A max depth of 5 sets the maximum depth of each decision tree in the ensemble. The minimum number of samples required to be a leaf node is set to 1 (min_samples_leaf), and the minimum number of samples required to split an internal node is set to 2 (min_samples_split). The ensemble consists of 100 decision trees (n_estimators). Additionally, a subsample ratio of 0.8 indicates that each tree is trained on a random subset comprising 80% of the training data. This combination of parameters aims to strike a balance between model complexity and generalization for effective predictive performance. Complete information regarding the parameters, hyper-parameters, and training settings are supplied in
Table S1.
3.2.3. Feature Importance
The feature importance in an XGBoost model is a metric that quantifies the contribution of each input variable (feature) to the model’s predictive performance. It is calculated by assessing how much the model’s accuracy decreases when a feature is randomly permuted, shuffling the values within that feature across the dataset. The more significant the drop in accuracy, the more influential the feature is considered.
Figure 3 illustrates the importance of features according to XGBoost. The importance was calculated based on the training set.
The four significant predictors, according to XGBoost, are the VGG19 predictions on the CT and PET images (with % importance of 21 and 11, respectively), followed by the SUVmax (12% importance) and the diameter (7% importance). As expected, age and gender were not essential predictors (0% importance). The remaining features showed lower values, ranging from 1% to 4%.
To reduce model complexity and prevent overfitting to the training data, we selected only features that exhibit an importance higher than or equal to 3%. Hence, the features we used are the following (15 in total): CT image VGG19 prediction, PET image VGG19 prediction, SUVmax, diameter, margins lobulated, margins spiculated, margins well-defined, margins ill-defined, type solid, type calcified, type cavitary, type ground-class, location lingula, location left lower lobe, and location left upper lobe.
3.3. Research Methodology
We present our research methodology (
Figure 4) in the pseudocode as follows:
Pseudocode of methodology
Inputs: Train dataset of CT images, train dataset of PET images, train tabular data, train labels (assigned by the human reader), test dataset of CT images, test dataset of PET images, test tabular data, test labels (biopsy-confirmed)
Repeat for 25 times:
Develop the VGG19 model.
Cross-validate VGG19 on CT-only data → compute metrics.
Cross-validate VGG19 on PET-only data → compute metrics.
Train and fit CT-only data → keep the predictions for each patient.
Train and fit PET-only data → keep the predictions for each patient.
Create a clinical data dataset and include the VGG19 predictions on the CT and PET images as extra features.
Fit an XGBoost model and inspect the importance of each feature.
Exclude features with importance less than 3%.
Re-build the complete dataset based on feature selection.
Cross-validate XGBoost on the complete dataset → compute metrics.
Train and fit XGBoost on the complete dataset.
Deploy the trained XGBoost to make predictions on the test data → compute metrics.
Compare the performance of image-only models with the multi-modal method with the XGBoost classifier.
Measure the agreement between the models and the experts (using the training set under a 10-fold cross-validation).
3.4. Performance Metrics
A series of performance metrics were used to quantify the effectiveness of the proposed methodology.
Accuracy represents the overall effectiveness of the classification model, calculated by the ratio of correctly predicted observations, both true positives (TP) and true negatives (TN) to the total observations. The total observations also include the false positive (FP) and false negative (FN) cases.
Sensitivity or true positive rate (TPR) assesses the proportion of TP correctly identified by the model, whereas specificity or true negative rate (TNR) measures the proportion of actual negatives correctly identified.
Precision, or positive predictive value (PPV), reflects the accuracy of positive predictions made by the model. The F1 Score is a balance between precision and sensitivity, providing a single score that weighs both the false positives and false negatives.
The area under the curve (AUC) pertains to the ROC curve, which plots the true positive rate against the false positive rate at different threshold values and summarizes the model’s ability to discriminate between the two classes. Kappa statistics provide an assessment of agreement corrected for chance between the observed and predicted classifications. False positive rate (FPR) quantifies the extent of actual negatives that are incorrectly identified as positives, and false negative rate (FNR) indicates the proportion of positives mistakenly tagged as negatives. Finally, negative predictive value (NPV) measures the accuracy of negative predictions made by the model. Each metric illuminates different aspects of model performance and collectively contributes to a comprehensive evaluation of the classifier effectiveness in distinguishing between malignant and benign SPNs. Their complete equations and descriptions can be found in [
35].
4. Results
4.1. Agreement with the Human Reader on the Training Set
The reported results were calculated based on a 10-fold cross-validation training procedure for the training set. The latter method divides the dataset into ten equal subsets, and the model is trained and validated ten times. During each iteration, a different subset serves as the validation set, while the remaining nine subsets are used for training. This process ensures that every data point is utilized for training and validation. The reported results are the average performance metrics over the 10-folds. This approach provides a more robust assessment of the model’s performance by addressing issues like overfitting and offering a reliable estimate of generalization performance compared to a single train–test split. The reader shall note that for the particular experiment, the human reader’s labels were used as the reference values. Hence, we measured the agreement between the model and the readers.
4.1.1. Imaging
Figure 5 showcases the training and validation accuracy and loss of VGG19 using the training dataset. The corresponding ROC curves are presented in
Figure 6. CT images were classified using the VGG19 method, yielding an accuracy (agreement with the human reader) of 85.12% with a 95% confidence interval (CI) of 84.48% to 85.77%. The sensitivity and specificity were reported as 85.08% (95% CI: 84.41% to 85.75%) and 85.16% (95% CI: 84.42% to 85.90%), respectively. The area under the curve (AUC) was 0.9191 with a 95% CI of 0.9162 to 0.9221. The curves of
Figure 6 verify the excellent attained AUC score.
PET images were classified using the same method, resulting in an agreement with the human reader of 82.40% (95% CI: 81.71% to 83.09%). The sensitivity and specificity were reported as 74.10% (95% CI: 73.41% to 75.45%) and 89.34% (95% CI: 88.42% to 90.63%). All results are summarized in
Table 4.
In the case of PET image training and validation, we observed fluctuations in the validation accuracy and loss, especially after epoch 30. Therefore, training was stopped at epoch 30.
4.1.2. Multi-Modal
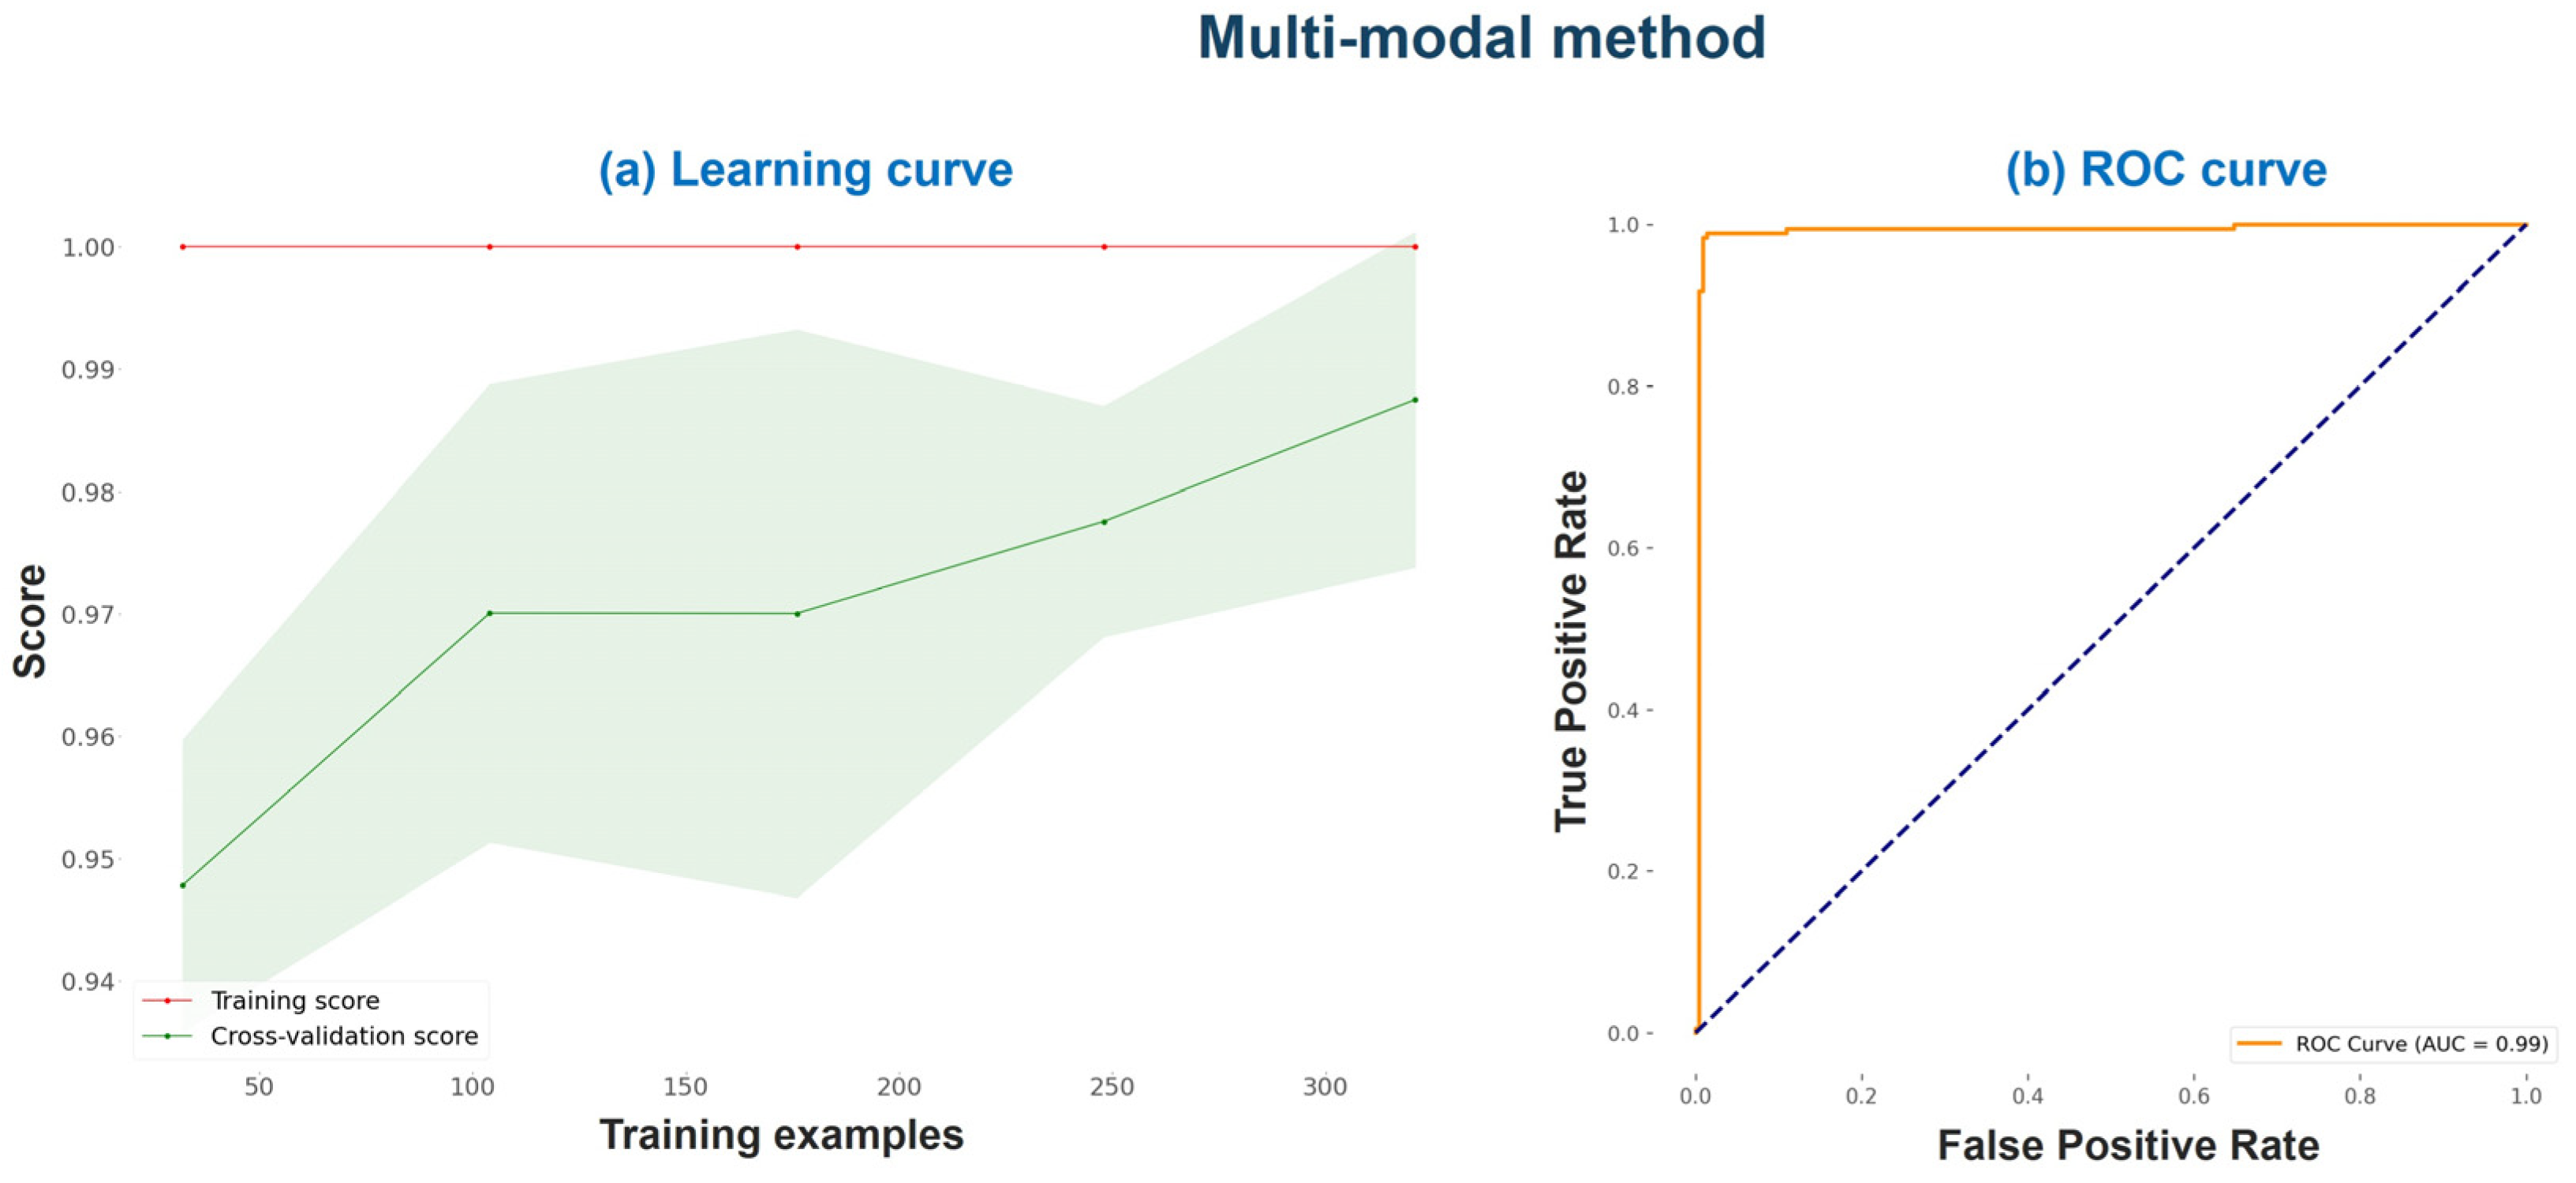
In the multi-modal method, the combination of VGG19 and XGBoost achieved an accuracy of 97.49%. The sensitivity and specificity were 96.67% and 98.17%, respectively. The area under the curve (AUC) was 0.9918.
The multi-modal approach without using SPN features performed worse (95.27% accuracy with a CI between 94.44% and 96.25%). When excluding the SUVmax predictor from the input features, we observed a significant decline in accuracy (
Table 4). The latter highlights the importance of SUVmax in the diagnosis. Nevertheless, the inclusion of all features led to optimal results.
Additional metrics are also presented in
Table 5.
Figure 7 illustrates the multi-modal method’s learning curve and ROC curve on the training set under a 10-fold cross-validation procedure.
The learning curve of
Figure 7 suggests that the progressive addition of more training examples improved the cross-validation score. The cross-validation score starts around 95% with 50 training examples and increases gradually as the number of training examples increases, reaching close to 97% at 300 training examples. The cross-validation score represents the model’s performance on unseen data and is more indicative of the model’s generalization ability. Additionally, the ROC curve (
Figure 7b) shows excellent performance and a very high AUC score.
4.2. Model Evaluation Based on Biopsy Results
For this ablation study, we trained the networks using the entire training set (model fit) and saved their parameters. Hence, we used three trained networks to perform the evaluation using the biopsy dataset: (a) a VGG19 network dedicated to classifying SPNs from the CT images, (b) a second VGG19 network dedicated to the PET image classification, and (c) a trained XGBoost classifier that combines the outputs of the two VGG19 networks with the rest of the features and provides a final verdict of the malignancy of an SPN. The results are presented in
Table 6 and
Table 7.
Figure 8 illustrates the ROC curve.
The classification of CT images, which contain SPNs with a histopathological conformation of their class (malignant or benign), and using the trained VGG19 method resulted in an accuracy of 79.48%, with a 95% confidence interval (CI) spanning from 77.09% to 81.87%. The sensitivity and specificity were reported as 72.32% and 97.78, respectively. The AUC score for CT image classification was 0.9371, with a 95% CI ranging from 0.9258 to 0.9484.
Similarly, the classification of the PET images yielded an accuracy of 80.47% (95% CI: 78.43% to 82.51%). The sensitivity and specificity were reported as 75.07% and 94.26%, respectively. The AUC score for PET image classification was 0.9354, with a 95% CI from 0.9255 to 0.9452.
The multi-modal classification method, combining VGG19 and XGBoost, achieved an overall accuracy of 85.21%, with a 95% confidence interval (CI) ranging from 83.74% to 86.68%. The sensitivity and specificity were reported as 81.23% (95% CI: 79.22% to 83.24%) and 95.37% (95% CI: 92.99% to 97.75%), respectively. The AUC score for this multi-modal approach was 0.9611, with a 95% CI from 0.9532 to 0.9690. The high AUC score is verified by the ROC curve (
Figure 8).
TPR and TNR were 81.23% and 95.37%, respectively. The FPR and FNR were 4.63% and 18.77%, respectively. Considerations for improvement could focus mainly on reducing the false negative rate (FNR), which stands at 18.77%. Lowering this rate could lead to an improved sensitivity and NPV, further enhancing the model’s utility and reliability. Additionally, while the false positive rate (FPR) at 4.63% is relatively low, continued optimization in this area could still provide substantial benefits, particularly in applications where false alarms are costly or disruptive.
4.3. Consistency with the Literature
Table 8 presents the existing works wherein SPN labelling was performed by the human readers.
Table 9 shows the existing works wherein SPN malignancy was surgically-verified. Comparatively, the present study consistently demonstrates competitive or superior performance across multiple performance metrics compared to the referenced studies.
In cases where the CT image is used, and the measured accuracy corresponds to an agreement between the model and the human reader, the reported accuracy lies between 85 and 92%. The present study reports a mean agreement of 85%, consistent with the literature but worse than most studies. Similarly, for PET studies, the agreement ranges between 82 and 88% (the present study lies at approximately 82%). Notably, when considering both PET and CT images, the present study exhibits excellent agreement with the human readers and clinical features (agreement of 97.49%).
When using external biopsy or surgically confirmed datasets, the reported accuracy ranges from 75% to 86%, using either PET, CT, or both modalities. The present study reports 85% accuracy in distinguishing between confirmed benign or malignant SPNs. The results of our study remain consistent with the literature. However, our ablation study’s dataset is significantly smaller than the datasets of other studies.
4.4. Saliency Maps
Saliency maps are a visualization technique used to understand the importance of different regions in an input image with respect to the output of a deep neural network, typically a CNN. The basic idea behind saliency maps is to identify which pixels in the input image contribute the most to the model’s prediction or decision.
The saliency map is generated by calculating the gradient of the output score with respect to each input pixel. This is typically carried out using backpropagation, where the gradient information flows backwards through the network. The magnitude of the gradient indicates how sensitive the output is to changes in a particular pixel. The calculated gradients are then used to construct the saliency map. One common approach is to take the absolute value of the gradients, as the gradient sign indicates the direction of the change but not necessarily the magnitude. The absolute values are often normalized to highlight relative importance. The final saliency map is a heatmap where each pixel’s intensity corresponds to its importance in influencing the model’s decision. Higher intensity indicates higher importance, and the heatmap visually highlights the regions in the input image that contribute the most to the model’s output.
Figure 9 illustrates six examples of saliency maps from the biopsy dataset using the CT images and the trained VGG19 dedicated for CT image classification.
The extracted maps offer valuable information for the potential reader. For example, the human evaluator may not trust a prediction when the saliency maps visualize irrelevant image pixels. The latter is an indicator of poor diagnostic accuracy. On the contrary, saliency maps that highlight potentially important regions can offer an important second opinion.
5. Discussion
The results achieved in the study point towards the efficacy of the XGBoost model in determining key predictors of malignant SPN and its role in reducing the complexity of the model. As per the method, the four significant predictors are the VGG19 predictions from CT and PET images, SUVmax, and diameter. Age and gender were revealed to be of little importance. The minimal feature importance attributes to age and gender correspond with the overall understanding in biomedical research, reinforcing their lower predictive value in SPN malignancy classification.
The results obtained from the single-modal method, using VGG19 for CT and PET image classification, presented a satisfactory accuracy level that was in agreement with the human reader but came with a certain level of variation. It is worth noting that synthesizing visualization techniques with ML techniques, as applied in the VGG19 model, furnishes valuable insights into SPNs and their determinants, thus facilitating diagnosis.
However, the multi-modal method that combines VGG19 and XGBoost exhibited an exceptional performance, achieving an accuracy (agreement with the human reader) of 97.49%. The improved accuracy can be attributed to the synergy of high-predictability features (CT image VGG19 prediction, PET image VGG19 prediction, SUVmax, and diameter, among others) integrated into the multi-modal approach.
The model’s performance was slightly lower when applying the trained algorithms for the classification of SPNs with confirmed labels by biopsy. The reader shall note that the training was performed using the human reader labels as reference classes. These comparative results confirm that the proposed approach maintains a reasonable level of performance when dealing with biopsy-confirmed data, despite been trained on weakly labelled data.
Likewise, the comparative analysis with the recent literature showcased that the present study either matches or surpasses the performance of the existing models. Lower accuracies in the CT and PET studies were somewhat compensated by the improved performance in the combined CT and PET study, demonstrating the benefits of a multi-modal approach.
Limitations
This study’s findings highlight the potential of combining imaging techniques and ML methods for more accurate diagnosis and classification of malignant SPNs.
However, these findings should be validated with a larger dataset to fully highlight the potential of this multi-modal approach in a clinical setting. There is also a need for future research to identify additional relevant features (e.g., radiomics) that could further increase the accuracy of SPN malignancy classification. While the results present a promising step forward in AI-powered medical diagnosis, adopting this technology should be supplemented with extensive training, expert opinion, and clinical judgment. Additionally, exploring a variety of CNN architectures, particularly more recent developments, could uncover further improvements in the model’s performance. This study predominantly utilized XGBoost among ML algorithms; incorporating a broader series of ML techniques could provide a more robust understanding of their comparative strengths and suitability. Furthermore, the validation of findings across multiple centers would strengthen the generalizability and reliability of the results, ensuring that the model performs well across diverse clinical environments and patient populations.
6. Conclusions
This study has demonstrated the efficacy of a multi-modal ML framework for the diagnosis of SPNs, from both CT and PET imaging modalities, supplemented by clinical features. The integration of these diverse data sources into a single diagnostic tool reflects a significant improvement over the traditional single-modal methods, exhibiting a very good agreement with the human reader (97.49%) and considerable diagnostic performance in biopsy-confirmed cases (accuracy of 85.21%). Notably, this approach not only ensures a robust agreement with human radiological assessments but also introduces a scalable model enhanced with explainability through the use of saliency maps. The necessity for validation with a larger, more diverse dataset is clear, which suggests that while the results are promising, further research is required to establish the generalizability of the findings. Future studies could also benefit from multi-center validation to ensure the model’s reliability across various clinical settings.
Supplementary Materials
The following supporting information can be downloaded at:
https://www.mdpi.com/article/10.3390/bdcc8080085/s1, Table S1. Parameters, hyper-parameters and training settins of the employed CNN. Table S2. Parameters, hyper-parameters and training settins of the employed CNN.
Author Contributions
Conceptualization, I.D.A. and E.I.P.; data curation, N.D.P. and D.J.A.; formal analysis, N.P.; funding acquisition, E.I.P.; investigation, N.D.P.; methodology, I.D.A. and D.J.A.; resources, D.J.A.; software, I.D.A. and N.P.; supervision, E.I.P.; validation, I.D.A., N.D.P., N.P. and E.I.P.; visualization, I.D.A.; writing—original draft, I.D.A.; writing—review and editing, N.D.P., D.J.A., N.P. and E.I.P. All authors have read and agreed to the published version of the manuscript.
Funding
The research project was supported by the Hellenic Foundation for Research and Innovation (H.F.R.I.) under the “2nd Call for H.F.R.I. Research Projects to support Faculty Members & Researchers” (Project Number: 3656).
Institutional Review Board Statement
All procedures in this study were in accordance with the Declaration of Helsinki. This study was approved on the 3rd of March 2022 by the ethical committee of the University General Hospital of Patras (Ethical and Research Committee of University Hospital of Patras—protocol number 108/10–3–2022).
Informed Consent Statement
The requirement to obtain informed consent was waived by the director of the diagnostic center due to its retrospective nature.
Data Availability Statement
The data presented in this study are available on request from the corresponding author. The data are not publicly available due to privacy and ethical restrictions.
Conflicts of Interest
The authors declare no conflicts of interest.
References
- Rodak, O.; Peris-Díaz, M.D.; Olbromski, M.; Podhorska-Okołów, M.; Dzięgiel, P. Current Landscape of Non-Small Cell Lung Cancer: Epidemiology, Histological Classification, Targeted Therapies, and Immunotherapy. Cancers 2021, 13, 4705. [Google Scholar] [CrossRef] [PubMed]
- Mazzone, P.J.; Lam, L. Evaluating the Patient with a Pulmonary Nodule: A Review. JAMA 2022, 327, 264. [Google Scholar] [CrossRef] [PubMed]
- Cruickshank, A.; Stieler, G.; Ameer, F. Evaluation of the Solitary Pulmonary Nodule. Intern. Med. J. 2019, 49, 306–315. [Google Scholar] [CrossRef] [PubMed]
- Ko, J.P.; Bagga, B.; Gozansky, E.; Moore, W.H. Solitary Pulmonary Nodule Evaluation: Pearls and Pitfalls. Semin. Ultrasound CT MRI 2022, 43, 230–245. [Google Scholar] [CrossRef] [PubMed]
- Huang, L.; Lin, W.; Xie, D.; Yu, Y.; Cao, H.; Liao, G.; Wu, S.; Yao, L.; Wang, Z.; Wang, M.; et al. Development and Validation of a Preoperative CT-Based Radiomic Nomogram to Predict Pathology Invasiveness in Patients with a Solitary Pulmonary Nodule: A Machine Learning Approach, Multicenter, Diagnostic Study. Eur. Radiol. 2022, 32, 1983–1996. [Google Scholar] [CrossRef] [PubMed]
- Apostolopoulos, I.D.; Pintelas, E.G.; Livieris, I.E.; Apostolopoulos, D.J.; Papathanasiou, N.D.; Pintelas, P.E.; Panayiotakis, G.S. Automatic Classification of Solitary Pulmonary Nodules in PET/CT Imaging Employing Transfer Learning Techniques. Med. Biol. Eng. Comput. 2021, 59, 1299–1310. [Google Scholar] [CrossRef] [PubMed]
- Apostolopoulos, I.D.; Apostolopoulos, D.J.; Panayiotakis, G.S. Solitary Pulmonary Nodule Malignancy Classification Utilising 3D Features and Semi-Supervised Deep Learning. In Proceedings of the 2022 13th IEEE International Conference on Information, Intelligence, Systems & Applications (IISA), Corfu, Greece, 18 July 2022; pp. 1–6. [Google Scholar]
- Uthoff, J.; Stephens, M.J.; Newell, J.D.; Hoffman, E.A.; Larson, J.; Koehn, N.; De Stefano, F.A.; Lusk, C.M.; Wenzlaff, A.S.; Watza, D.; et al. Machine Learning Approach for Distinguishing Malignant and Benign Lung Nodules Utilizing Standardized Perinodular Parenchymal Features from CT. Med. Phys. 2019, 46, 3207–3216. [Google Scholar] [CrossRef] [PubMed]
- Apostolopoulos, I.D.; Papathanasiou, N.D.; Panayiotakis, G.S. Classification of Lung Nodule Malignancy in Computed Tomography Imaging Utilising Generative Adversarial Networks and Semi-Supervised Transfer Learning. Biocybern. Biomed. Eng. 2021, 41, 1243–1257. [Google Scholar] [CrossRef]
- Astaraki, M.; Zakko, Y.; Toma Dasu, I.; Smedby, Ö.; Wang, C. Benign-Malignant Pulmonary Nodule Classification in Low-Dose CT with Convolutional Features. Phys. Med. 2021, 83, 146–153. [Google Scholar] [CrossRef] [PubMed]
- Chae, K.J.; Jin, G.Y.; Ko, S.B.; Wang, Y.; Zhang, H.; Choi, E.J.; Choi, H. Deep Learning for the Classification of Small (≤2 Cm) Pulmonary Nodules on CT Imaging: A Preliminary Study. Acad. Radiol. 2020, 27, e55–e63. [Google Scholar] [CrossRef] [PubMed]
- Chen, S.; Harmon, S.; Perk, T.; Li, X.; Chen, M.; Li, Y.; Jeraj, R. Diagnostic Classification of Solitary Pulmonary Nodules Using Dual Time 18F-FDG PET/CT Image Texture Features in Granuloma-Endemic Regions. Sci. Rep. 2017, 7, 9370. [Google Scholar] [CrossRef] [PubMed]
- Lin, C.-Y.; Guo, S.-M.; Lien, J.-J.J.; Lin, W.-T.; Liu, Y.-S.; Lai, C.-H.; Hsu, I.-L.; Chang, C.-C.; Tseng, Y.-L. Combined Model Integrating Deep Learning, Radiomics, and Clinical Data to Classify Lung Nodules at Chest CT. Radiol. Med. 2024, 129, 56–69. [Google Scholar] [CrossRef] [PubMed]
- Liu, H.; Cao, H.; Song, E.; Ma, G.; Xu, X.; Jin, R.; Liu, C.; Hung, C.-C. Multi-Model Ensemble Learning Architecture Based on 3D CNN for Lung Nodule Malignancy Suspiciousness Classification. J. Digit. Imaging 2020, 33, 1242–1256. [Google Scholar] [CrossRef] [PubMed]
- Park, Y.-J.; Choi, D.; Choi, J.Y.; Hyun, S.H. Performance Evaluation of a Deep Learning System for Differential Diagnosis of Lung Cancer with Conventional CT and FDG PET/CT Using Transfer Learning and Metadata. Clin. Nucl. Med. 2021, 46, 635–640. [Google Scholar] [CrossRef] [PubMed]
- Salihoğlu, Y.S.; Uslu Erdemir, R.; Aydur Püren, B.; Özdemir, S.; Uyulan, Ç.; Ergüzel, T.T.; Tekin, H.O. Diagnostic Performance of Machine Learning Models Based on 18F-FDG PET/CT Radiomic Features in the Classification of Solitary Pulmonary Nodules. Mol. Imaging Radionucl. Ther. 2022, 31, 82–88. [Google Scholar] [CrossRef]
- Senent-Valero, M.; Librero, J.; Pastor-Valero, M. Solitary Pulmonary Nodule Malignancy Predictive Models Applicable to Routine Clinical Practice: A Systematic Review. Syst. Rev. 2021, 10, 308. [Google Scholar] [CrossRef] [PubMed]
- Setio, A.A.A.; Traverso, A.; De Bel, T.; Berens, M.S.N.; Bogaard, C.V.D.; Cerello, P.; Chen, H.; Dou, Q.; Fantacci, M.E.; Geurts, B.; et al. Validation, Comparison, and Combination of Algorithms for Automatic Detection of Pulmonary Nodules in Computed Tomography Images: The LUNA16 Challenge. Med. Image Anal. 2017, 42, 1–13. [Google Scholar] [CrossRef]
- Shi, F.; Chen, B.; Cao, Q.; Wei, Y.; Zhou, Q.; Zhang, R.; Zhou, Y.; Yang, W.; Wang, X.; Fan, R.; et al. Semi-Supervised Deep Transfer Learning for Benign-Malignant Diagnosis of Pulmonary Nodules in Chest CT Images. IEEE Trans. Med. Imaging 2022, 41, 771–781. [Google Scholar] [CrossRef] [PubMed]
- Huang, B.; Sollee, J.; Luo, Y.-H.; Reddy, A.; Zhong, Z.; Wu, J.; Mammarappallil, J.; Healey, T.; Cheng, G.; Azzoli, C.; et al. Prediction of Lung Malignancy Progression and Survival with Machine Learning Based on Pre-Treatment FDG-PET/CT. eBioMedicine 2022, 82, 104127. [Google Scholar] [CrossRef] [PubMed]
- Shah, R.P.; Selby, H.M.; Mukherjee, P.; Verma, S.; Xie, P.; Xu, Q.; Das, M.; Malik, S.; Gevaert, O.; Napel, S. Machine Learning Radiomics Model for Early Identification of Small-Cell Lung Cancer on Computed Tomography Scans. JCO Clin. Cancer Inform. 2021, 5, 746–757. [Google Scholar] [CrossRef] [PubMed]
- Wang, H.; Li, Y.; Han, J.; Lin, Q.; Zhao, L.; Li, Q.; Zhao, J.; Li, H.; Wang, Y.; Hu, C. A Machine Learning-Based PET/CT Model for Automatic Diagnosis of Early-Stage Lung Cancer. Front. Oncol. 2023, 13, 1192908. [Google Scholar] [CrossRef] [PubMed]
- Kang, Y.; Chiu, Y.-W.; Lin, M.-Y.; Su, F.-Y.; Huang, S.-T. Towards Model-Informed Precision Dosing with Expert-in-the-Loop Machine Learning. In Proceedings of the 2021 IEEE 22nd International Conference on Information Reuse and Integration for Data Science (IRI), IEEE, Las Vegas, NV, USA, 10–12 August 2021; pp. 342–347. [Google Scholar]
- Samaras, A.-D.; Moustakidis, S.; Apostolopoulos, I.D.; Papandrianos, N.; Papageorgiou, E. Classification Models for Assessing Coronary Artery Disease Instances Using Clinical and Biometric Data: An Explainable Man-in-the-Loop Approach. Sci. Rep. 2023, 13, 6668. [Google Scholar] [CrossRef] [PubMed]
- Wang, H.; Zhu, H.; Ding, L.; Yang, K. A Diagnostic Classification of Lung Nodules Using Multiple-Scale Residual Network. Sci. Rep. 2023, 13, 11322. [Google Scholar] [CrossRef] [PubMed]
- Greenspan, B.S. Role of PET/CT for Precision Medicine in Lung Cancer: Perspective of the Society of Nuclear Medicine and Molecular Imaging. Transl. Lung Cancer Res. 2017, 6, 617–620. [Google Scholar] [CrossRef] [PubMed]
- Buscail, E.; Chiche, L.; Laurent, C.; Vendrely, V.; Denost, Q.; Denis, J.; Thumerel, M.; Lacorte, J.; Bedel, A.; Moreau-Gaudry, F.; et al. Tumor-proximal Liquid Biopsy to Improve Diagnostic and Prognostic Performances of Circulating Tumor Cells. Mol. Oncol. 2019, 13, 1811–1826. [Google Scholar] [CrossRef] [PubMed]
- Mounessi, F.S.; Eckardt, J.; Holstein, A.; Ewig, S.; Könemann, S. Image-Based Lung Functional Radiotherapy Planning for Non-Small Cell Lung Cancer. Strahlenther. Onkol. 2020, 196, 151–158. [Google Scholar] [CrossRef] [PubMed]
- LeCun, Y.; Bengio, Y.; Hinton, G. Deep learning. Nature 2015, 521, 436–444. [Google Scholar] [CrossRef] [PubMed]
- Goodfellow, I.; Bengio, Y.; Courville, A.; Bengio, Y. Deep Learning; MIT Press: Cambridge, MA, USA, 2016; Volume 1. [Google Scholar]
- LeCun, Y.; Kavukcuoglu, K.; Farabet, C. Convolutional Networks and Applications in Vision. In Proceedings of the 2010 IEEE International Symposium on Circuits and Systems, Paris, France, 30 May–2 June 2010; pp. 253–256. [Google Scholar]
- Simonyan, K.; Zisserman, A. Very Deep Convolutional Networks for Large-Scale Image Recognition. arXiv 2014, arXiv:1409.1556. [Google Scholar]
- Deng, J.; Dong, W.; Socher, R.; Li, L.-J.; Li, K.; Fei-Fei, L. Imagenet: A large-scale hierarchical image database. In Proceedings of the 2009 IEEE Conference on Computer Vision and Pattern Recognition, Miami, FL, USA, 20–25 June 2009; pp. 248–255. [Google Scholar]
- Chen, T.; Guestrin, C. XGBoost: A Scalable Tree Boosting System. In Proceedings of the 22nd ACM SIGKDD International Conference on Knowledge Discovery and Data Mining, San Francisco, CA, USA, 13 August 2016; pp. 785–794. [Google Scholar]
- Sokolova, M.; Japkowicz, N.; Szpakowicz, S. Beyond Accuracy, F-Score and ROC: A Family of Discriminant Measures for Performance Evaluation. In AI 2006: Advances in Artificial Intelligence; Sattar, A., Kang, B., Eds.; Lecture Notes in Computer Science; Springer: Berlin/Heidelberg, Germany, 2006; Volume 4304, pp. 1015–1021. ISBN 978-3-540-49787-5. [Google Scholar]
- Weir-McCall, J.R.; Debruyn, E.; Harris, S.; Qureshi, N.R.; Rintoul, R.C.; Gleeson, F.V.; Gilbert, F.J.; Lucy Brindle, A.B.; Callister, M.; Clegg, A.; et al. Diagnostic Accuracy of a Convolutional Neural Network Assessment of Solitary Pulmonary Nodules Compared with PET With CT Imaging and Dynamic Contrast-Enhanced CT Imaging Using Unenhanced and Contrast-Enhanced CT Imaging. Chest 2023, 163, 444–454. [Google Scholar] [CrossRef] [PubMed]
Figure 1.
Data collection procedure.
Figure 1.
Data collection procedure.
Figure 3.
Feature importance derived from XGBoost training.
Figure 3.
Feature importance derived from XGBoost training.
Figure 4.
Research Methodology.
Figure 4.
Research Methodology.
Figure 5.
Training and validation accuracy and loss for VGG19 under a 10-fold cross-validation procedure using the training set.
Figure 5.
Training and validation accuracy and loss for VGG19 under a 10-fold cross-validation procedure using the training set.
Figure 6.
ROC curves of VGG19 under a 10-fold cross-validation procedure using the training set.
Figure 6.
ROC curves of VGG19 under a 10-fold cross-validation procedure using the training set.
Figure 7.
Learning curve and ROC curve of the multi-modal method on the training set under a 10-fold cross-validation procedure.
Figure 7.
Learning curve and ROC curve of the multi-modal method on the training set under a 10-fold cross-validation procedure.
Figure 8.
ROC curve of the multi-modal method when using the biopsy dataset for evaluation. The blue dashed line is the 1:1 line. The yellow line is the ROC curve.
Figure 8.
ROC curve of the multi-modal method when using the biopsy dataset for evaluation. The blue dashed line is the 1:1 line. The yellow line is the ROC curve.
Figure 9.
Saliency map examples. Each group contains the original SPN image (right) and the produced map (left). The maps are extracted from the biopsy dataset using the CT images and the trained VGG19, dedicated for CT image classification.
Figure 9.
Saliency map examples. Each group contains the original SPN image (right) and the produced map (left). The maps are extracted from the biopsy dataset using the CT images and the trained VGG19, dedicated for CT image classification.
Table 1.
Clinical Characteristics of the NSCLC dataset.
Table 1.
Clinical Characteristics of the NSCLC dataset.
| Clinical Characteristics | Frequency |
|---|
| No of participants | 498 |
| Age (mean ± sd) | 66 ± 8 |
| Sex (male/female) | 69% male/31% female |
| Benign SPNs (histopathological) | 27 |
| Benign SPNs (human expert) | 219 |
| Total Benign SPNs | 246 |
| Malignant SPNs (histopathological) | 69 |
| Malignant SPNs (human expert) | 183 |
| Total Malignant SPNs | 252 |
| Total % of SPNs with histopathological confirmation | 19.27% |
| Total % of SPNs characterized by the human expert | 80.72% |
| Type |
| Solid | 32% |
| Semi-solid | 3% |
| Ground-class | 3% |
| Other | 62% |
| Margins |
| Well-defined | 21% |
| Lobulated | 20% |
| Spiculated | 18% |
| Ill-defined | 5% |
| Other | 36% |
| Location |
| Left Upper Lobe (LUL) | 19% |
| Left Lower Lobe (LLL) | 14% |
| Lingula | 8% |
| Middle | 6% |
| Right Upper Lobe (RUL) | 24% |
| Right Lower Lobe (RLR) | 25% |
| Other | 4% |
Table 2.
Details of the NSCLC dataset’s features.
Table 2.
Details of the NSCLC dataset’s features.
| No. | Feature Name | Type of Feature | Type of Values |
|---|
| | Gender | Demographic | Male/Female |
| | Age | Demographic | Numeric |
| | SUVmax | FDG Uptake | Numeric |
| | Diameter | SPN Feature | Numeric |
| | Location | SPN Feature | Categorical |
| | Type | SPN Feature | Categorical |
| | Margins | SPN Feature | Categorical |
Table 3.
Image characteristics.
Table 3.
Image characteristics.
| Image Type | DICOM |
|---|
| Slice thickness | 1.25 |
| Number of image sets | 2 (PET and CT) |
| Anonymity | Sensitive information is excluded |
Table 4.
Performance metrics in the training dataset. The metrics are computed under a 10-fold cross-validation procedure.
Table 4.
Performance metrics in the training dataset. The metrics are computed under a 10-fold cross-validation procedure.
| Input Data | Classification Method | Accuracy
(%) | Sensitivity
(%) | Specificity
(%) | AUC |
|---|
| CT image | VGG19 | 85.12
(95% CI: 84.48–85.77) | 85.08
(95% CI: 84.41–85.75) | 85.16
(95% CI: 84.42–85.90) | 0.9191
(95% CI: 0.9162–0.9221) |
| PET image | VGG19 | 82.40
(95% CI: 81.71–83.09) | 74.10
(95% CI: 84.41–75.45) | 89.34
(95% CI: 84.42–90.63) | 0.8856
(95% CI: 0.9162–0.8913) |
| Multi-modal without SPN features | XGBoost | 95.27
(95% CI: 94.44–96.25) | 94.02
(95% CI: 93.24–95.56) | 96.64
(95% CI: 96.22–98.62) | 0.9824
(95% CI: 0.9795–0.9856) |
| Multi-modal without SPN features and without SUVmax | XGBoost | 81.88
(95% CI: 78.83–83.59) | 86.55
(95% CI: 83.66–88.42) | 77.12
(95% CI: 75.39–77.94) | 0.8447
(95% CI: 0.8266–0.8555) |
| Multi-modal without SUVmax | XGBoost | 92.26
(95% CI: 90.84–93.61) | 93.47
(95% CI: 92.46–93.94) | 91.18
(95% CI: 89.97–92.25) | 0.9492
(95% CI: 0.9396–0.9583) |
| Multi-modal with the entire set of features | VGG19 + XGBoost | 97.49
(95% CI: 97.12–97.85) | 96.67
(95% CI: 96.10–97.23) | 98.17
(95% CI: 97.86–98.49) | 0.9918
(95% CI: 0.9897–0.9938) |
Table 5.
Complete performance metrics of the multi-modal method on the training set. The metrics are computed under a 10-fold cross validation procedure.
Table 5.
Complete performance metrics of the multi-modal method on the training set. The metrics are computed under a 10-fold cross validation procedure.
| Metric | Value (95% CI) |
|---|
| Accuracy (%) | 97.49 (0.97–0.98) |
| Sensitivity (%) | 96.67 (0.96–0.97) |
| Specificity (%) | 98.17 (0.98–0.98) |
| Precision (%) | 97.79 (0.97–0.98) |
| F1 | 0.9722 (0.9682–0.9763) |
| AUC | 0.9918 (0.9897–0.9938) |
| Kappa | 0.9493 (0.9419–0.9566) |
| FPR (%) | 1.83 (1.51–2.14) |
| FNR (%) | 3.33 (2.77–3.9) |
| PPV (%) | 97.79 (97.41–98.17) |
| NPV (%) | 97.25 (96.79–97.71) |
Table 6.
Performance metrics on the biopsy dataset. The metrics are computed under a 10-fold cross-validation procedure.
Table 6.
Performance metrics on the biopsy dataset. The metrics are computed under a 10-fold cross-validation procedure.
| Input Data | Classification Method | Accuracy
(%) | Sensitivity
(%) | Specificity
(%) | AUC |
|---|
| CT image | VGG19 | 79.48
(95% CI: 77.09–81.87) | 72.32
(95% CI: 68.82–75.82) | 97.78
(95% CI: 96.36–99.20) | 0.9371
(95% CI: 0.9258–0.9484) |
| PET image | VGG19 | 80.47 (95% CI: 78.43–82.51) | 75.07 (95% CI: 71.80–78.35) | 94.26 (95% CI: 91.01–97.51) | 0.9354 (95% CI: 0.9255–0.9452) |
| Multi-modal without SPN features | XGBoost | 81.19
(95% CI: 80.68–81.62) | 77.49
(95% CI: 76.69–77.95) | 86.36
(95% CI: 85.71–86.96) | 0.9125
(95% CI: 0.91–0.9154) |
| Multi-modal without SPN features and without SUVmax | XGBoost | 73.55
(95% CI: 70.02–75.61) | 69.17
(95% CI: 66.25–0.7222) | 79.65
(95% CI: 0.7458–0.8487) | 0.8424
(95% CI: 0.8205–0.8526) |
| Multi-modal without SUVmax | XGBoost | 80.67
(95% CI: 0.8051–0.8096) | 79.64
(95% CI: 0.7873–0.8003) | 89.91
(95% CI: 0.8903–0.91) | 0.9223
(95% CI: 0.9195–0.9294) |
| Multi-modal with the entire set of features | VGG19 + XGBoost | 85.21 (95% CI: 83.74–86.68) | 81.23 (95% CI: 79.22–83.24) | 95.37 (95% CI: 92.99–97.75) | 0.9611 (95% CI: 0.95.32–0.9690) |
Table 7.
Complete performance metrics of the multi-modal method on the biopsy dataset. The metrics are computed under a 25-run training–testing procedure.
Table 7.
Complete performance metrics of the multi-modal method on the biopsy dataset. The metrics are computed under a 25-run training–testing procedure.
| Metric | Value (95% CI) |
|---|
| Accuracy (%) | 85.21 (0.84–0.87) |
| Sensitivity (%) | 81.23 (0.79–0.83) |
| Specificity (%) | 95.37 (0.93–0.98) |
| Precision (%) | 97.89 (0.97–0.99) |
| F1 | 0.8871 (0.8747–0.8995) |
| AUC | 0.9611 (0.9532–0.969) |
| Kappa | 0.6778 (0.6491–0.7066) |
| FPR (%) | 4.63 (2.25–7.01) |
| FNR (%) | 18.77 (16.76–20.78) |
| PPV (%) | 97.89 (96.84–98.93) |
| NPV (%) | 66.86 (64.63–69.1) |
Table 8.
Comparison with existing works wherein SPN labelling was performed by the human readers.
Table 8.
Comparison with existing works wherein SPN labelling was performed by the human readers.
| Study | Input Data Type | Test Data Size | Labelling | Result |
|---|
| [7] | CT | 897 | Human Reader | ACC: 90.85%
SEN: 94.76%
SPE: 82.05% |
| [9] | CT | 1113 | Human Reader | ACC: 92.07%
SEN: 89.35%
SPE: 94.80% |
| [6] | CT | 112 | Human Reader | ACC: 94%
SEN: 92%
SPE: 94.50% |
| [10] | CT | 1297 | Human Reader | AUC: 0.936 |
| [11] | CT | 208 | Human Reader | AUC: 0.85 |
| [14] | CT | 252 | Human Reader | ACC: 90.6%
SEN: 83.7%
SPE: 93.9% |
| [25] | CT | 2119 | Human Reader | ACC: 85.23%
SEN: 92.79%
SPE: 72.89%
AUC: 0.9275 |
| [16] | PET/CT | 48 | Human Reader | AUC: 0.81
SEN: 88%
SPE: 86% |
| This study | CT | 402 | Human Reader | ACC: 85.12% (84.48–85.77)
SEN: 85.08% (84.41–85.75)
SPE: 85.16% (84.42–85.90)
AUC: 0.9191 (0.9162–0.9221) |
| This study | PET | 402 | Human Reader | ACC: 82.40% (81.71–83.09)
SEN: 74.10% (84.41–75.45)
SPE: 89.34% (84.42–90.63)
AUC: 0.8856 (0.9162–0.8913) |
| This study | CT + PET + image features | 402 | Human Reader | ACC: 97.49% (97.12–97.85)
SEN: 96.67% (96.10–97.23)
SPE: 98.17% (97.86–98.49)
AUC: 0.9918 (0.9897–0.9938) |
Table 9.
Comparison with existing works wherein SPN malignancy was surgically verified.
Table 9.
Comparison with existing works wherein SPN malignancy was surgically verified.
| Study | Input Data Type | Test Data Size | Labelling | Result |
|---|
| [20] | PET + CT | 1168 | Surgically verified | ACC: 79%
AUC: 0.876 |
| [15] | PET + CT | 105 | Surgically verified | ACC: 85%
SEN: 86%
SPE: 33% |
| [12] | PET | 86 | Surgically verified | ACC: 86%
SEN: 64%
SPE: 91% |
| [36] | CT + PET | 270 | Surgically verified | SEN: 72%
SPE: 82% |
| [19] | CT | 1175 | Surgically verified | ACC: 74.5%
AUC: 0.795 |
| This study | CT | 96 | Surgically verified | ACC: 79.48% (77.09–81.87)
SEN: 72.32% (68.82–75.82)
SPE: 97.78% (96.36–99.20)
AUC: 0.9371 (0.9258–0.9484) |
| This study | PET | 96 | Surgically verified | ACC: 80.47% (78.43–82.51)
SEN: 75.07% (71.80–78.35)
SPE: 94.26% (91.01–97.51)
AUC: 0.9354 (0.9255–0.9452) |
| This study | CT + PET + image features | 96 | Surgically verified | ACC: 85.21% (83.74–86.68)
SEN: 81.23% (79.22–83.24)
SPE: 95.37% (92.99–97.75)
AUC: 0.9611 (0.9532–0.9690) |
| Disclaimer/Publisher’s Note: The statements, opinions and data contained in all publications are solely those of the individual author(s) and contributor(s) and not of MDPI and/or the editor(s). MDPI and/or the editor(s) disclaim responsibility for any injury to people or property resulting from any ideas, methods, instructions or products referred to in the content. |
© 2024 by the authors. Licensee MDPI, Basel, Switzerland. This article is an open access article distributed under the terms and conditions of the Creative Commons Attribution (CC BY) license (https://creativecommons.org/licenses/by/4.0/).


 ,
, 


