1. Introduction
The growth of online services has given people the chance to share their thoughts on a broad range of subjects, such as products, services, movies, companies, and political figures. This widespread sharing of personal views has resulted in the gathering of large amounts of information, requiring efficient techniques to assess and understand people’s perspectives on different topics. A significant challenge in this process is the subjective nature of the emotional evaluation of textual content. Studies have shown that the same text can lead to varying interpretations among different individuals, sometimes leading to completely opposite assessments.
As technological advancements continue, the significance of public sentiment in influencing a wide range of decisions has become increasingly apparent. This is particularly evident in the field of behavioral finance, where financial decisions are often seen as being driven by emotional factors [
1]. It is posited that public sentiment, as reflected in social media outputs like Twitter, may have a comparable impact on stock market prices; for instance, tweets carrying positive or negative sentiments, especially those with financial hashtags, are thought to potentially influence stock movements. The prevailing sentiment of a day is hypothesized to affect stock prices the following day—negative sentiment could lead to a decrease in prices, whereas positive sentiment might cause an increase. Additionally, the influence of tweets on stock prices is believed to be proportional to the number of followers of a Twitter account, suggesting a greater impact from accounts with larger followings.
Furthermore, natural language texts, inherently unstructured, present additional difficulties for processing. These texts often include elements such as sarcasm, humor, and typographical errors, which can be challenging for both human and machine interpretation. Another layer of complexity arises from the language-specific nature of sentiment analysis methods. For instance, techniques developed for English texts may not be directly applicable to texts in Kazakh, highlighting a limitation in the universality of these methods.
The tonality of text, crucial in sentiment analysis, is also context-dependent. The emotional connotation of specific words can vary significantly across different domains, affecting the interpretation of sentiment; therefore, a critical task in sentiment analysis is the automatic extraction and classification of opinions from texts. This involves determining the presence of a subjective component in text and categorizing text based on its tonality, which may range from positive to negative and possibly include additional classes. Tonality is defined here as the emotional evaluation that the author of the text expresses about a particular object or subject.
There has been considerable research in this area, particularly focusing on the prediction of stock prices using Twitter sentiment analysis. The authors of [
2,
3] investigated the impact of tweet sentiment on the Dow Jones Industrial Index (DJII), utilizing Granger causality to unveil a significant association between the mood of calmness in tweets and DJII values. Their approach, informed by these insights, yielded considerable gains within a 40-day period. Further, the authors of [
4] examined how tweet sentiment correlates with stock price fluctuations and trading volumes, employing diverse models to forecast stock prices for entities like General Electric, Intel, and IBM, with an approximate 70% accuracy rate. These findings collectively underscore a substantial link between Twitter sentiment and stock market dynamics. Sentiment analysis, especially when applied to tweets, has found utility in forecasting outcomes in political and social arenas. The authors of [
5] created a framework for learning public sentiment towards the 2020 U.S. presidential election by using Twitter data. Additionally, the authors of [
6] deployed classification techniques, such as random forest, SVMs, and naive Bayes, to ascertain stock directions from news sentiment, securing an accuracy between 85% and 94% across various scenarios.
The introduction of contextualized embedding has significantly influenced sentiment analysis, particularly for social media content such as tweets. The work of [
7] stands out in this field; it assesses a range of word representation models, including transformer-based auto-encoder models like RoBERTa, and showcases their effectiveness in capturing the intricacies of the informal and evolving language found in tweets. This research highlights the advantages of contextualized models over static ones for sentiment analysis, aligning with the findings of [
8,
9,
10]. These studies have proven the effectiveness of models like BERT across various NLP tasks, affirming the resilience of these advanced models. The authors of [
11] explored the complexities of automating tweet analysis, a crucial aspect of understanding the inherent challenges of sentiment analysis. Their findings further supports’ [
7], underscoring the importance of the profound comprehension of natural text to effectively navigate the informal syntax characteristic of tweets.
The groundwork for modern sentiment analysis methodologies was significantly influenced by the development of vector space models (VSMs), as highlighted by [
12,
13]. Their pioneering efforts in exploring semantic similarities within VSMs and introducing count-based approaches like bag-of-words (BoW) and TF-IDF paved the way for the evolution of more complex word representation models [
14]. This shift from basic VSMs to advanced embedding strategies represents a major leap forward in the field of sentiment analysis. The introduction of Word2Vec and FastText by the authors of [
15], which proposed the application of dense vectors for word representation, was a pivotal moment. The advancements by the authors of [
16,
17,
18] further addressed the complexities introduced by Twitter’s ever-changing language, showcasing the significance of these developments in tackling the nuances of social media text analysis.
The significance of creating sentiment-specific embedding for sentiment analysis is underscored by the authors of [
19], who introduced the sentiment-specific word embedding model (SSWE). This innovative approach integrates sentiment information within embeddings to solve the problem of words that share syntactic similarities yet exhibit divergent sentiment polarities being closely positioned in vector space. Similarly, the authors of [
20] developed an attention-based LSTM framework aimed at forecasting the directional trends of major indices and individual stock prices, leveraging headlines from financial news. This model demonstrated competitive performance against advanced models that blend knowledge graphs for event-embedding learning. In a related work, the authors of [
21] applied random matrix theory (RMT) and information theory to dissect the correlation and flow of information between The New York Times’ publications and global financial indices. Their findings reveal a profound connection between news content and global markets, positioning news as a pivotal influence on market dynamics.
In the development of sentiment lexicons we have explored several approaches, notably dictionary-based and corpus-based methods. The dictionary-based methods have been extensively discussed in the literature, with notable contributions from [
22,
23]. While these methods face challenges in processing social media content, mainly due to misspellings and the use of out-of-vocabulary words, this opens up exciting opportunities for the further exploration and development of more robust techniques capable of understanding the nuances of social media language. Corpus-based methods, in contrast, are better suited for handling social media data. These methods utilize a range of statistical and linguistic features with which to distinguish opinion words from other words, as demonstrated in the works of [
24,
25]. Another key category of methods encompasses both dictionary-based and corpus-based approaches, and involves graph-based techniques. The authors of [
26] introduced an innovative strategy for building a lexical network by using a lot of unlabeled data, followed by the application of a graph propagation algorithm. This approach, alongside similar strategies that utilize graph or label propagation for the extraction of opinion words, has been further investigated by researchers such as those in [
27,
28], underscoring the versatility and efficacy of graph-based methods in sentiment lexicon construction.
In this study, we have deliberately chosen an approach that bypasses the need for external dictionaries, acknowledging that such resources are not universally available across languages. This choice leads us to concentrate directly on the text itself, with a particular emphasis on identifying sentiment-related terms pivotal for the context at hand as we construct our neural network model. This method serves to bridge the gap of knowledge by ensuring our sentiment analysis is both contextually relevant and accurately reflective of stock market trends.
We employ a variety of strategies that enhance both the accuracy and clarity of the models through advanced mathematical modeling. This approach formalizes the connection between the tone of tweets and their context, laying a methodological foundation for training the neural network models and improving our understanding of their application. Adapted to address the distinct challenges posed by Twitter data, our approach integrates convolutional neural networks (CNNs) to effectively analyze sentiment trends on social media platforms. These CNNs process input matrices where each row is a vector representation of a word in a semantic feature space, capturing the relationships between terms and their contextual significance. Additionally, our data preparation methods are strategically designed to manage the dynamic and volatile nature of financial data. By emphasizing raw text analysis and employing deep learning, including advanced CNN architectures, we enhance our ability to conduct precise trend analysis and extract more insights into market sentiments.
This paper is organized as follows:
Section 2 details our methodology, describing the data collection, preprocessing steps, and the design of the neural network model.
Section 3 presents the results, including the performance of the model under different parameters.
Section 4 discusses the implications of our findings, comparing them with existing methods and highlighting the innovations that our approach offers. Finally, the paper concludes with a summary of our findings and suggestions for future research directions.
2. Materials and Methods
2.1. Data Preprocessing
The preprocessing stage began by using Python libraries, including BeautifulSoup for web scraping, to collect datasets that incorporate references to stock names from diverse sources, as outlined in studies such as [
29]. Our primary dataset originated from the Twitter Sentiment Analysis Dataset (TSA) available on Huggingface, comprising 1,578,627 classified tweets [
30]. Each tweet is labeled as 1″ for positive sentiment and 0″ for negative sentiment. In addition, we incorporated the Twitter7 dataset [
31], a substantial collection of approximately 476 million tweets amassed from June to December 2009. This dataset, part of the Stanford Large Network Data Collection (SNAP), is approximately 25 GB in size and encompasses data from 17 million users, including 476 million tweets, 181 million URLs, 49 million hashtags, and 71 million retweets. The structure of each data entry includes time, user, and tweet content.
Furthermore, we sourced stock prices data from Yahoo Finance. This dataset features a subset of US-listed instruments, updated daily based on trading volume and information availability [
32]. It’s important to note that this dataset may have gaps due to its selection criteria, implying that certain instruments may temporarily appear or disappear from the dataset. The market data includes various return calculations over different timespans.
Table 1 summarizes the datasets used in our study, focusing on their sources and a brief description, along with a mention of machine learning methods and algorithms that have been previously applied to similar data in the field.
The preprocessing stage involved several steps, focusing on data cleaning and filtering to prepare the data for analysis. The process included the following:
Removing XML/JSON characters: We eliminated irrelevant characters (e.g., >, &) using a parser, as they hold no value for sentiment analysis.
Decoding data: Complex symbols in tweets were decoded into simple, understandable characters using UTF-8 encoding, the most widely accepted method for data decoding.
Standardizing apostrophes and slang: To improving processing, apostrophes were standardized and slang was uniformly adjusted. Given the prevalent use of shortened words in social media posts, such as transforming “for” into “fr”, it is necessary to establish a dictionary that maps slang and abbreviated terms back to their standard English equivalents. Specifically, the ‘correct()’ function in TextBlob could be instrumental in automatically correcting and standardizing slang to ensure consistent interpretation by models.
Converting created words: User-generated words in tweets were reformatted into a standard format for better computational interpretation.
We opted for a Regex Tokenizer over a standard tokenizer due to its effectiveness in handling the less standardized nature of tweet data, which often includes extra spaces and symbols. This tokenizer uses regular expressions to determine split positions in the text [
33]. For feature vectorization, we employed Hashing TF-IDF, a method commonly used in text mining to reflect the importance of a term in a document relative to the corpus. This approach helps in converting words into vectors for subsequent sentiment classification and prediction.
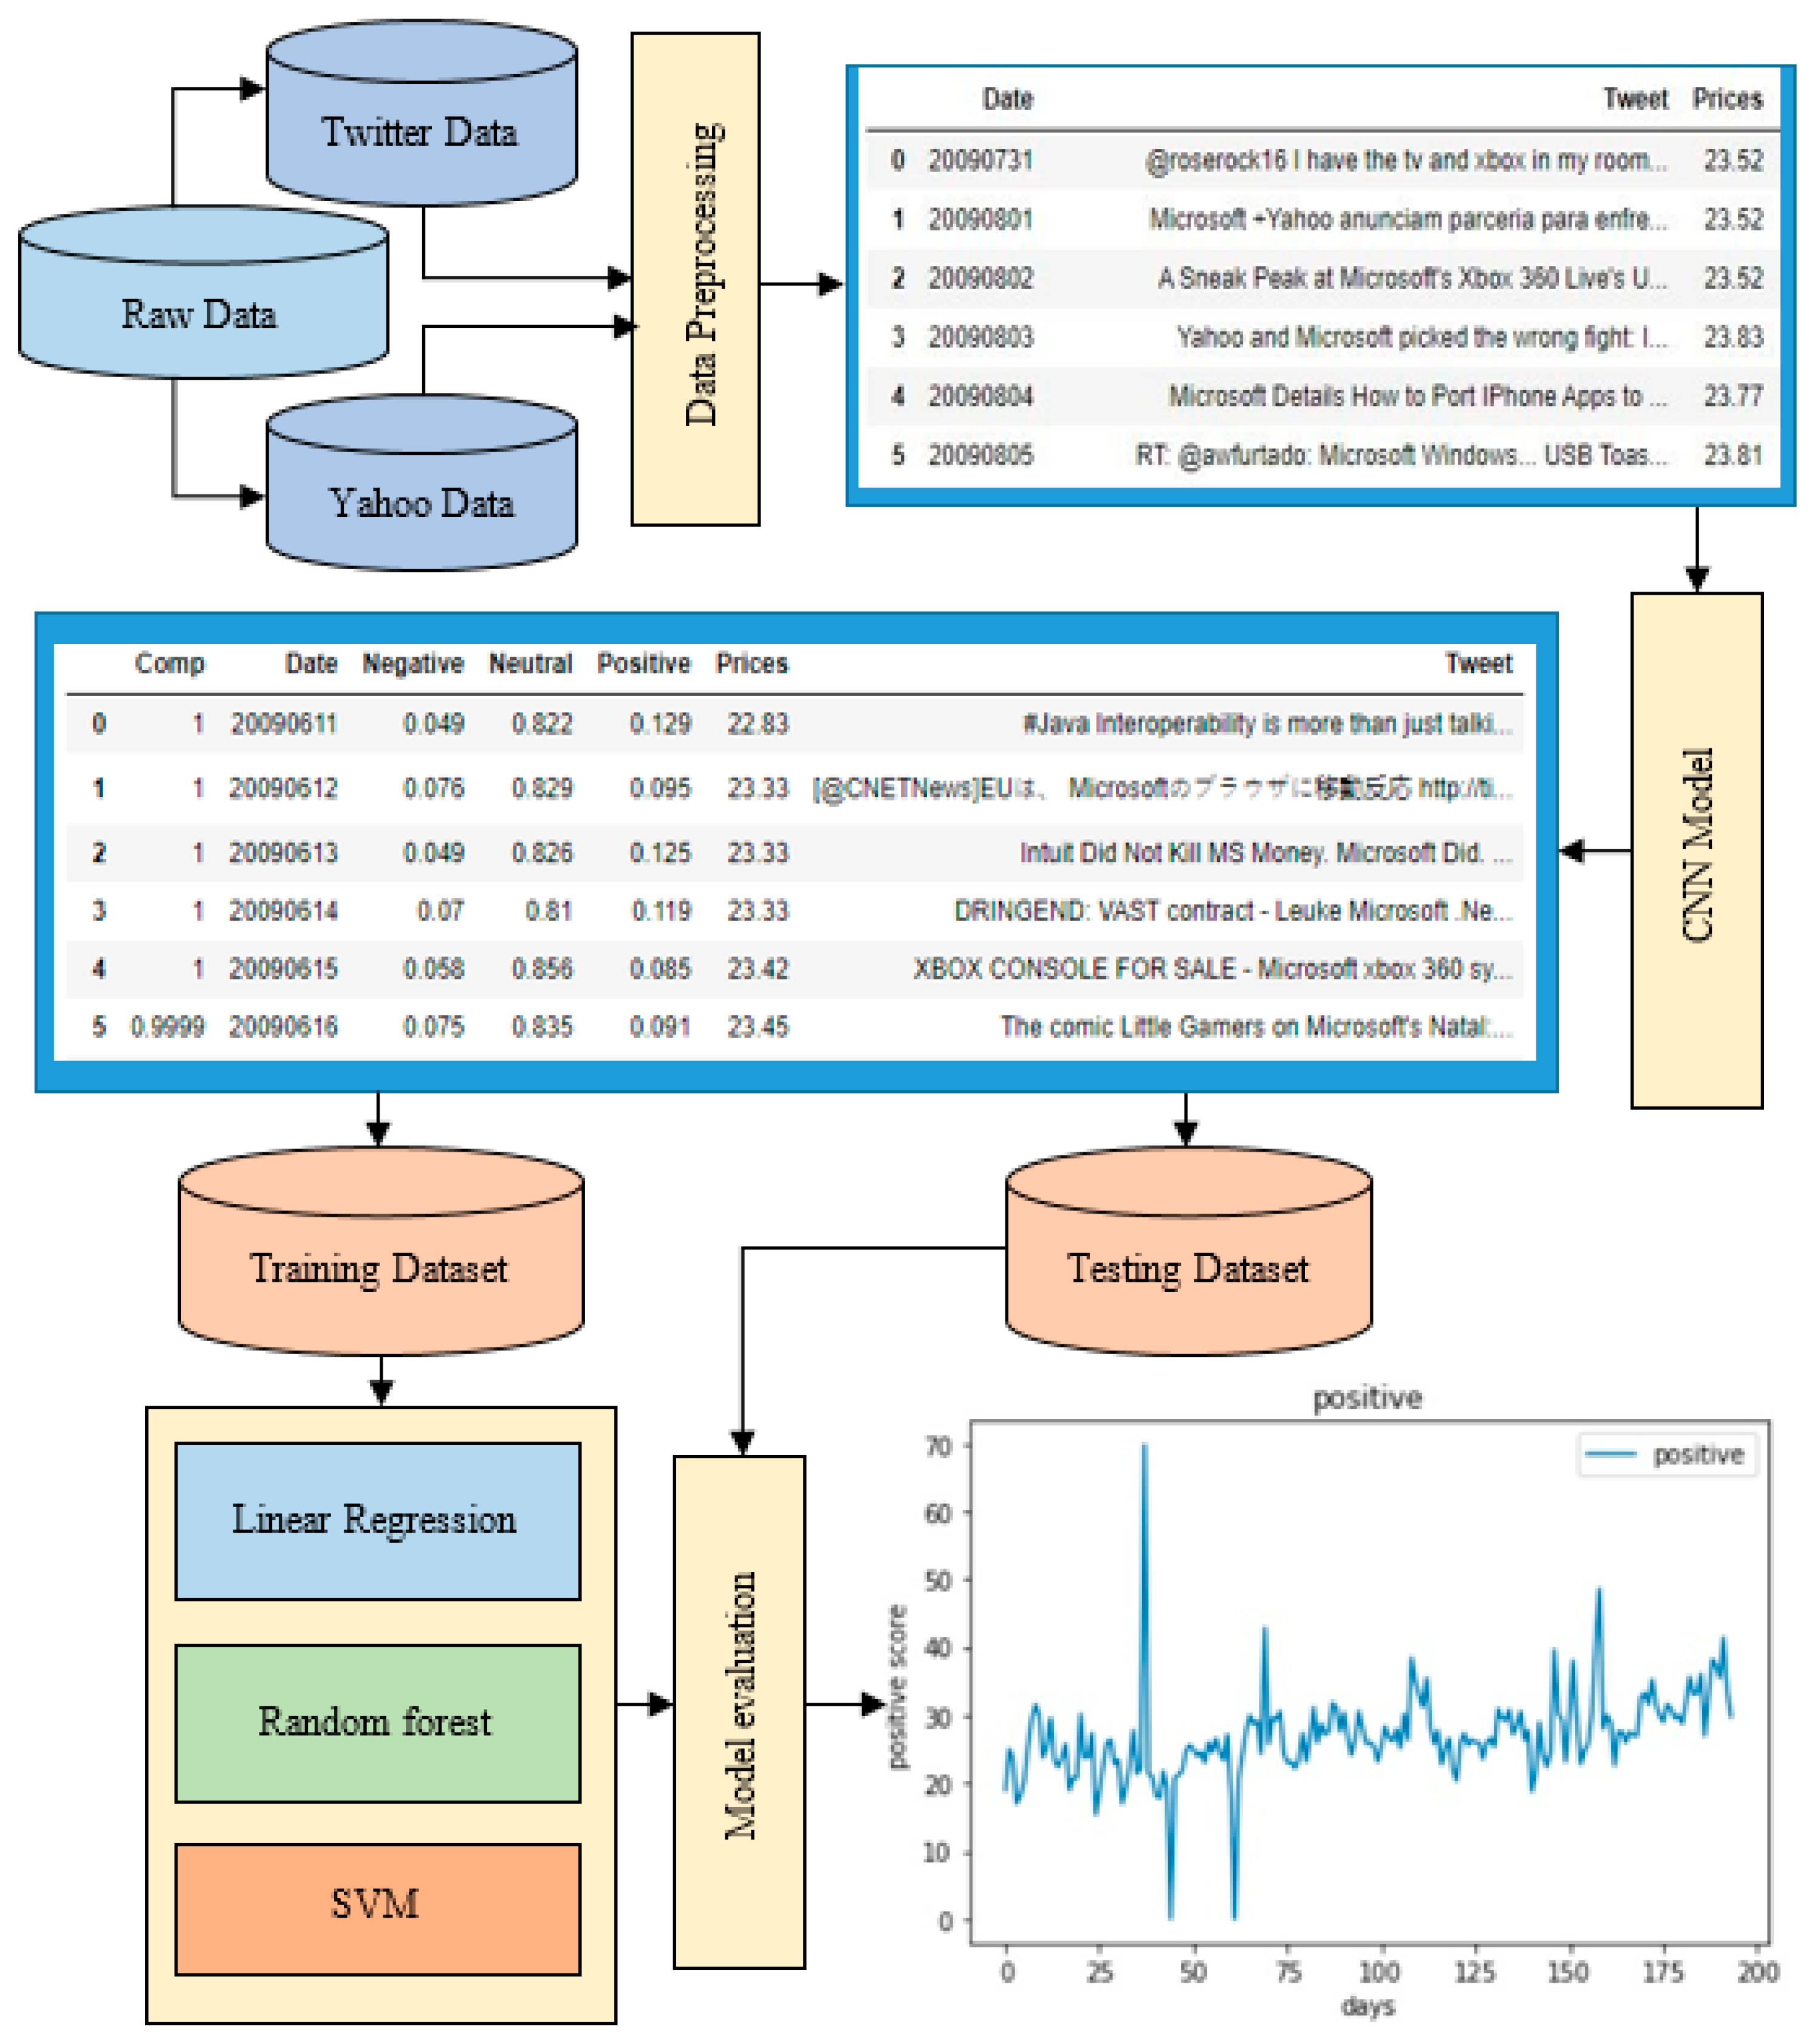
Additionally, we combined selected tweets with stock price data to create a dataset better suited for training our neural network model. The processed dataset was divided into two parts: 85% for training and 15% for testing, where the training involved generating feature vectors for each tweet to classify them as positive or negative. For a visual representation of our methodology, refer to
Figure 1, which illustrates the detailed scheme of our proposed approach.
In developing the neural network, CNNs were adapted from their original use in image processing to handle the automated processing of text data effectively. Each tweet, represented as a fixed-height matrix where each row corresponds to a vector representation of a word in the feature space, was processed through convolution layers. These layers, with filters tuned only in terms of height, allow for the extraction of the most significant n-grams irrespective of their position in the text, thanks to the subsequent subsampling layer, which reduces the feature map dimensions by using max pooling. This structured approach not only captures the semantic richness of words within tweets, which often include varied punctuation and emoticons, but also clusters similar words into semantic spaces visualized through t-SNE, enhancing our model’s ability to interpret and classify tweet sentiments accurately.
While CNNs typically process input matrices where each row represents a vector representation of a word in a semantic feature space constructed using tools like FastText, in this study we have developed our own method based on the described mathematical framework to integrate tones with the context of their use. The CNN employs filters with a fixed width and adjustable height, effectively capturing the relationships between adjacent rows and allowing the output feature matrix of each filter to vary based on the filter’s height and the original matrix’s height. Subsampling layers follow, utilizing a compaction function like 1-max pooling to diminish the dimensionality and highlight the most critical information from each convolution.
As a result, a complete tone dictionary is developed by first identifying all contexts mentioned in a message and then determining the total tonality for each context. This process assigns a tone score to each lexical expression based on semantic similarity, effectively managing the complexities that arise when multiple contexts are present within a single sentence. The CNN’s architecture supports this by ensuring that significant linguistic features related to context-specific tones are captured and processed. The feature maps generated from each subsampling layer are then consolidated into a unified feature vector. This vector is fed into a fully connected layer that advances to the network’s output layer, where the final sentiment classification is determined, linking the tone of expressions to their specific contexts in a precise and structured manner.
Our study leverages sophisticated mathematical modeling to enhance both the precision and interpretability of our models. The mathematical framework formalizes the relationship between the tone of tweets and their contexts, providing a structured basis for training our hybrid neural network classification model.
2.2. Context-Oriented Sentiment Analysis
The problem of the context-oriented sentiment analysis of text documents (Twitter posts) can be described as follows: for each post, , from the available set of posts, , it is necessary to find subset, , contexts of that are mentioned in said post, and for each one, , define a tone from the set, : “negative”, “neutral”, and “positive”. When an opinion on Twitter displays contradictory feelings within the same context, it is assigned a specific label, “C”, for contradiction. This involves identifying and categorizing each segment of the message according to a predefined set of labels, denoted as Y. The process is divided into the following key components:
2.2.1. Subtask 1: Extracting the Relevant Context from a Post
This subtask can be viewed as the task of classifying objects (we typically refer to them as Twitter posts, but, in reality, they are messages selected for containing emotional aspects related to stocks) into overlapping classes, ; a set of feedback sentences, ; and a finite set of contexts known for the given subject domain. : the set of admissible responses of the classifier. : an unknown target dependency whose values are known only for the objects of the finite training sample ; therefore, we need to identify such an algorithm, , capable of correctly classifying/filtering an arbitrary object, . The algorithm uses filters to parse the vector representations of the words, adjusting dynamically based on the learned importance of different contexts. These filters are designed to capture both the direct semantic content of the words and their relational positions within and across the set context boundaries.
2.2.2. Subtask 2: Detecting the Sentiment Expressed in Relation to Context
This task is a classification problem involving distinct, and at the same time non-overlapping, categories/classes. : set of sentences of some post, , and, for each, is defined as —the set of contexts mentioned in this paper. a set of tone labels. : an unknown target dependence whose values are known only on the objects of a finite training sample . It is required to construct an algorithm, , capable of classifying an arbitrary object, , within a specific context.
We assigned specific values to words based on their position within the convolution context, shifting the context by multiple trigrams to capture the application context effectively. This technique allows for identifying internal connectivity between specific words that carry tonal significance, thereby linking the structural design of the neural network to its formal representation.
2.2.3. Subtask 3: Extracting an Opinion for a Post of a , A Set of Text Documents, with Each Post, , Consisting of Multiple Sentences,
For each sentence,
, there is a set of pairs,
, where
is the
-th context of the sentence and
is a certain
l-th context tone,
. It is required to construct an algorithm capable for each
to specify a set of pairs,
, such that
.
C is a contradiction label, , where is the total number of contexts encountered in the text, , not including repeated contexts, .
2.2.4. Subtask 4: Extracting User Sentiment as a Binary Classification of User Opinions
The subtask of extracting user sentiment context, viewed as a series of binary classification tasks, simplifies the challenge of identifying trends in opinion across multiple overlapping classes. Employing a one-versus-all strategy, we developed a distinct classifier for each declared opinion context within the subject domain. Each classifier is specifically trained on data relevant to one opinion trend, while contrasting it against data from all other contexts. This approach effectively uses CNN layers and filters to capture and distinguish between the diverse contexts in the dataset.
Formally, if is a set of opinions, and each text, , consists of a set of sentences in an opinion, , which are subject to classification, is a finite set of contexts, is a set of admissible responses, and is a finite training sample, then for each context is a new vector of labels, and if , otherwise —we obtain a new training sample.
For this framework, we create a set of training samples, with one sample corresponding to each opinion’s context. This results in a set of classifiers, denoted as , where each classifier, (for i ranging from 1 to k), is trained on the respective sample, . To enhance the training process, reference terms such as nouns, verbs, and adjectives that are particularly descriptive of the context are selected from a labeled training set, again considering the current implemented filter state of the neural network. After compiling a reference dictionary, any new term with a vector representation, , can be associated with a specific opinion’s context, , in one of two principal ways:
Direct element-by-element comparison with each reference term, , of the context, ;
By calculating the cumulative similarity to the context . is a set of an opinion’s context reference terms, . Each has a distributed vector representation, . Cosine similarity is used as a measure of proximity between vectors in both cases.
For the first method (2):
is the number of referenced terms.
For the second method (3):
is the number of reference terms. If the obtained proximity value exceeds some threshold, the tested term is considered contextual. In many cases, the threshold value for each analysis can be set experimentally, though this does not always prevent the occurrence of noisy data, necessitating further refinement.
Our objective is to ascertain the tone of each retrieved text based on its context. To facilitate this, we utilized a reference dictionary compiled in previous processes for the subject currently under consideration. This dictionary helps generate a set of features for each context, which are then converted into feature vectors suitable for input into a CNN-based classifier. To construct the reference dictionary, we select potential candidates for emotional expressions from the texts, focusing primarily on nouns, adjectives, and verbs, while also considering adverbs and various text fragments based on their relevance and frequency. Subsequently, we establish a weighting system to quantify the emotional tone of each term using measures of semantic similarity (Equations (4) and (5)). This structured approach allows for a more nuanced analysis of text data, aligning linguistic features with emotional contexts effectively.
There, are sets of reference emotional terms for positive and negative sentiments, respectively. The composition of these sets is determined by a designated expert, typically not the authors of the paper, to ensure objectivity. Each set comprises lexical expressions that encapsulate positive and negative emotions. Every element within these sets has a distributed representation denoted as , and represents the vector of the term under analysis. The specific values of total similarities are calculated as and . The sentiment of a word is determined by comparing these similarity scores; the tone with the greater similarity score is selected as the sentiment for the word under consideration.
After determining the sentiment for each lexical expression, a comprehensive sentiment–tone dictionary is created, associating each lexical expression with a tone score based on their approximate semantic similarity above a certain threshold level. Determining the tone for each context within a sentence can be complex due to the potential presence of multiple contexts. This is typically addressed in two steps: initially identifying all contexts mentioned in the message, and subsequently determining the overall sentiment for each context.
Even though we depend only on our model, we also integrate the financial sentiment dictionary developed by Loughran and McDonald [
34] to enhance and validate the outcomes of our classification model. This English sentiment lexicon is specifically designed for analyzing financial documents, categorizing words into six sentiments critical in financial contexts: negative, positive, litigious, uncertainty, constraining, or superfluous. By utilizing this lexicon, we can more accurately interpret the emotional tone of financial texts, which is pivotal in predicting stock market movements. A higher prevalence of words labeled as “positive” within the analysis suggests an increasing trend in stock prices. Using the financial sentiment dictionary significantly augments our model’s capability to dissect and comprehend financial documents with remarkable precision, thereby improving the reliability and effectiveness of forecasting stock price movements based on the sentiment in text messages.
The final stage of our methodology involved data analysis using machine learning techniques to predict stock prices based on sentiment data and historical price trends. If sentiment analysis shows a positive sentiment, there is a potential correlation with rising stock prices. On the other hand, a negative sentiment could be linked to falling stock prices. This approach uses sentiment as a predictive indicator in financial markets, enabling investors to make better-informed decisions based on the current market mood.
3. Results
3.1. CNN Model Training
An intriguing outcome of our research is the adaptation of context-based CNN models within the task of sentiment analysis. Where previous studies have generally limited their scope to a smaller set of messages, resulting in high variance and insufficient accuracy for dependable investment decisions, our approach extends it to a broader portfolio of stocks. While focusing on a few stocks can provide deep insights into individual market behaviors, extending the analysis to a larger set of messages can capture a wider array of market dynamics and reduce the risk associated with anomalous movements in any single stock. We use a dataset, as shown in
Figure 2, which initially contains unfilled fields for sentiment scores, as an input for training our CNN model.
In this phase of the work, we applied our mathematical models using a CNN, which was implemented through the TensorFlow framework. We began by setting the operational hyperparameters of the neural network as suggested by best practices [
35]. Specifically, we utilized around 100 filters for dimensions, and set the dropout probability during the regularization phase at 0.5 to prevent overfitting. For the training of the neural network, we employed batch gradient descent with a batch size of 64, across 8 training epochs. Additionally, we explored the effects of various filter combinations through multiple experiments.
In the developed architecture, we utilized filters of varying heights, primarily for the parallel processing of trigrams, after determining through practical experience that results for 5-g were less effective. The most effective configuration was found with filters of size 7, aimed at balancing the capture of both near and far word contexts without overloading the network with redundant or closely sized filters. We integrated eight convolutional layers for each filter height, implementing the ReLU activation function, which proved advantageous for the performance of our model.
This design strategy led to the aggregation of features into a comprehensive feature vector, subsequently fed into a hidden fully connected layer equipped with 80 neurons—this number was also derived from practical testing. At the final stage, the resulting feature map was directed to a neural network layer with a sigmoid activation function. To optimize performance, we configured the final model with the Adam optimizer and partially employed binary cross-entropy as the loss function.
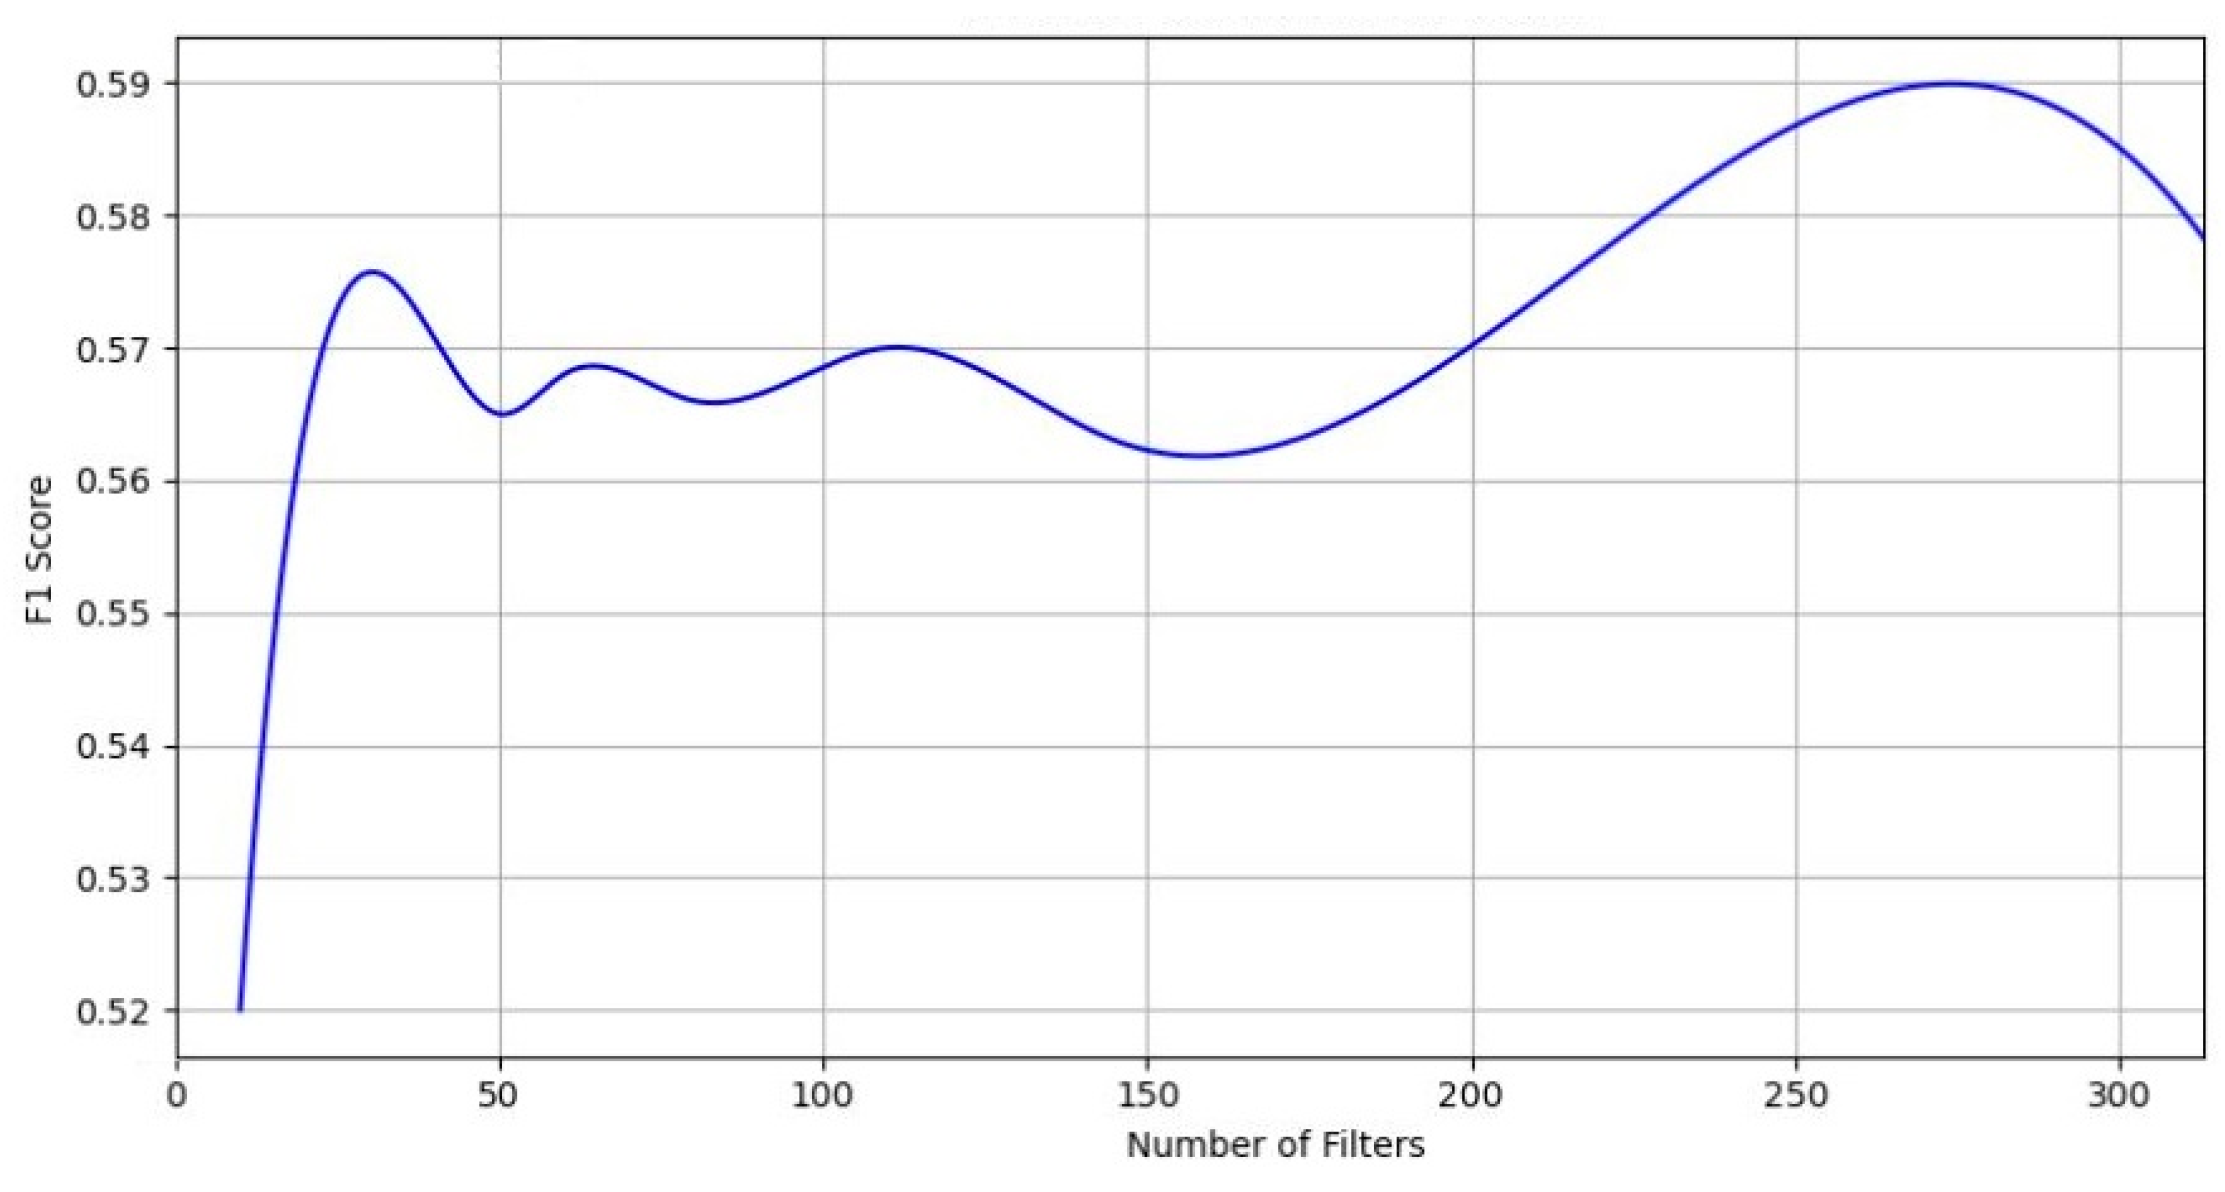
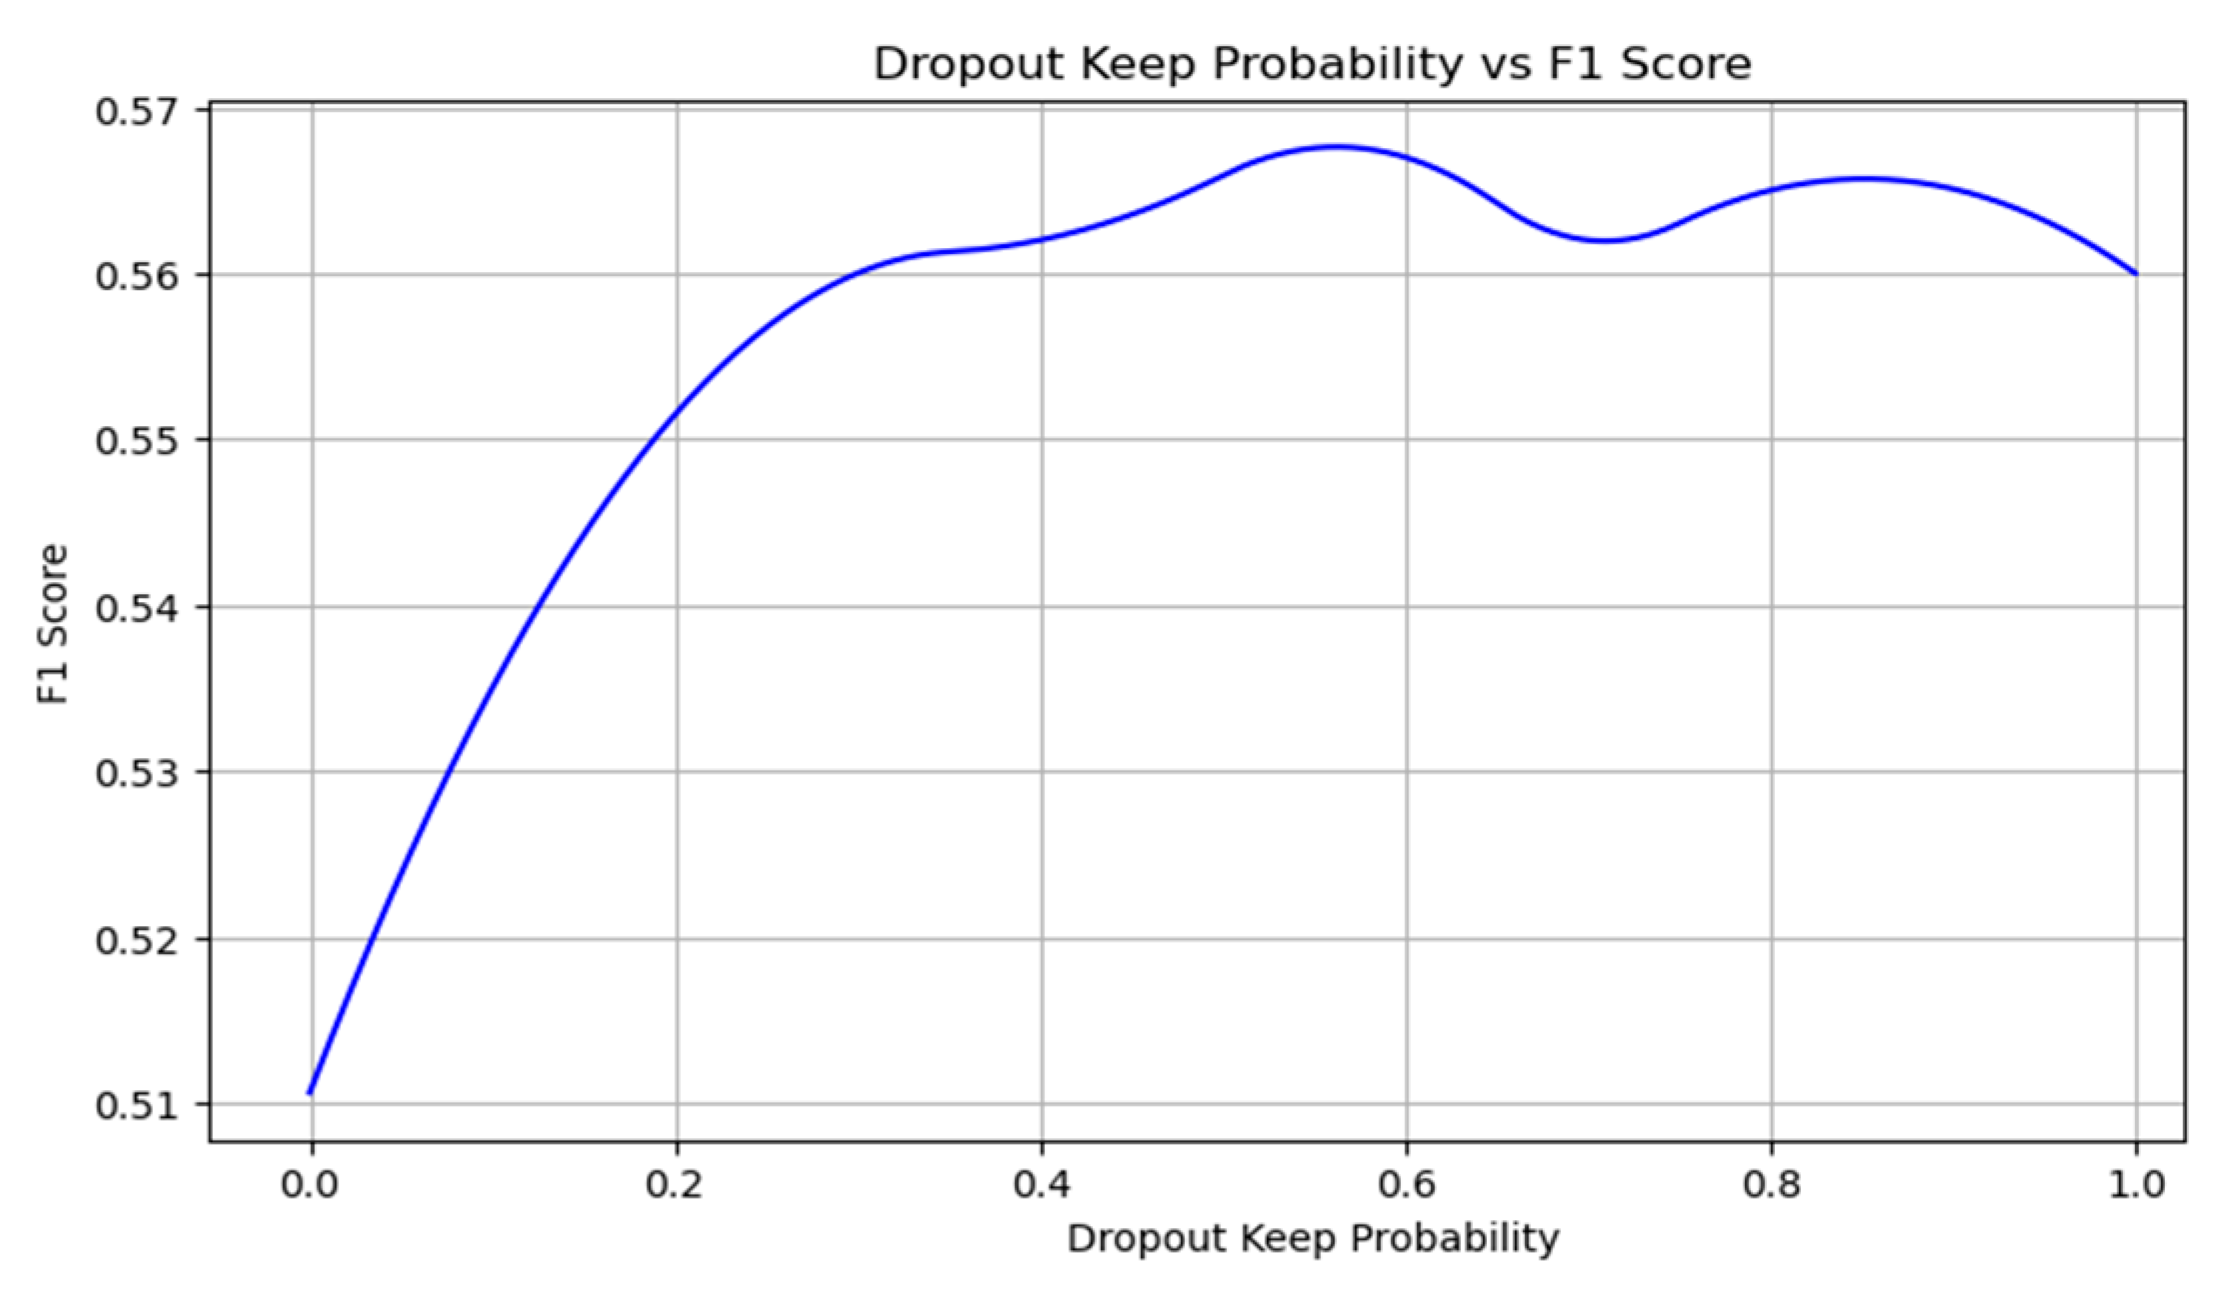
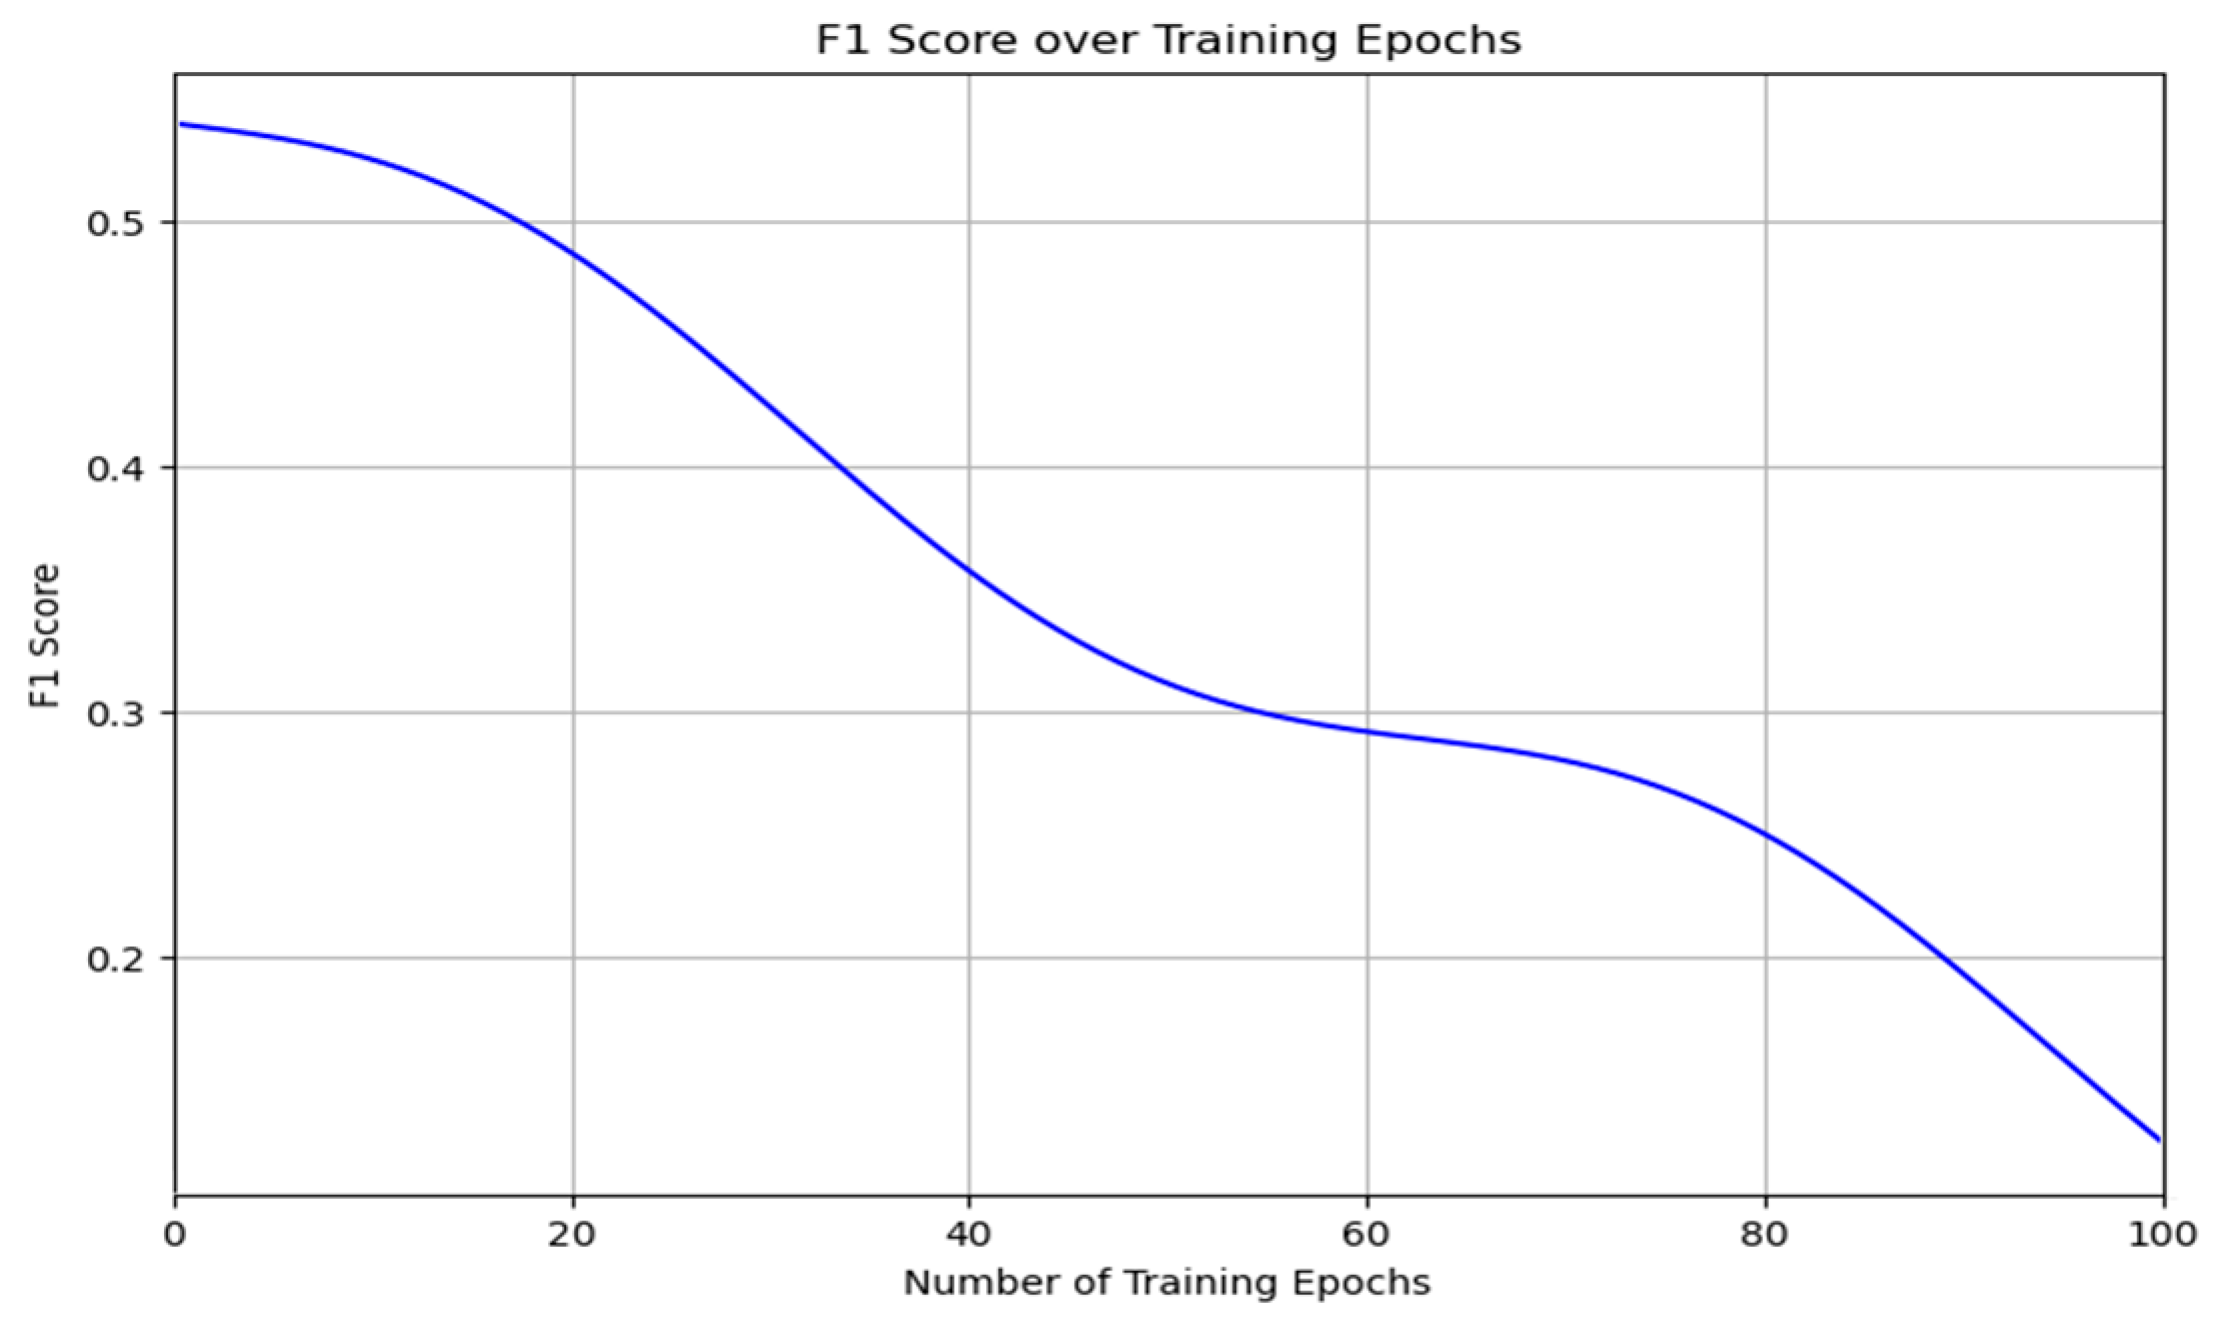
Moreover, we discovered that the best results were achieved when the probability of dropout was maintained at around 0.5. This level ensures that there are sufficient neurons for effective classification while also enabling regularization to prevent overtraining. Increasing the number of filters does influence the results marginally, yet a plateau in the growth of accuracy and completeness is observed upon reaching a specific threshold (refer to
Figure 3), emphasizing the fine balance required in neural network configuration for optimal performance.
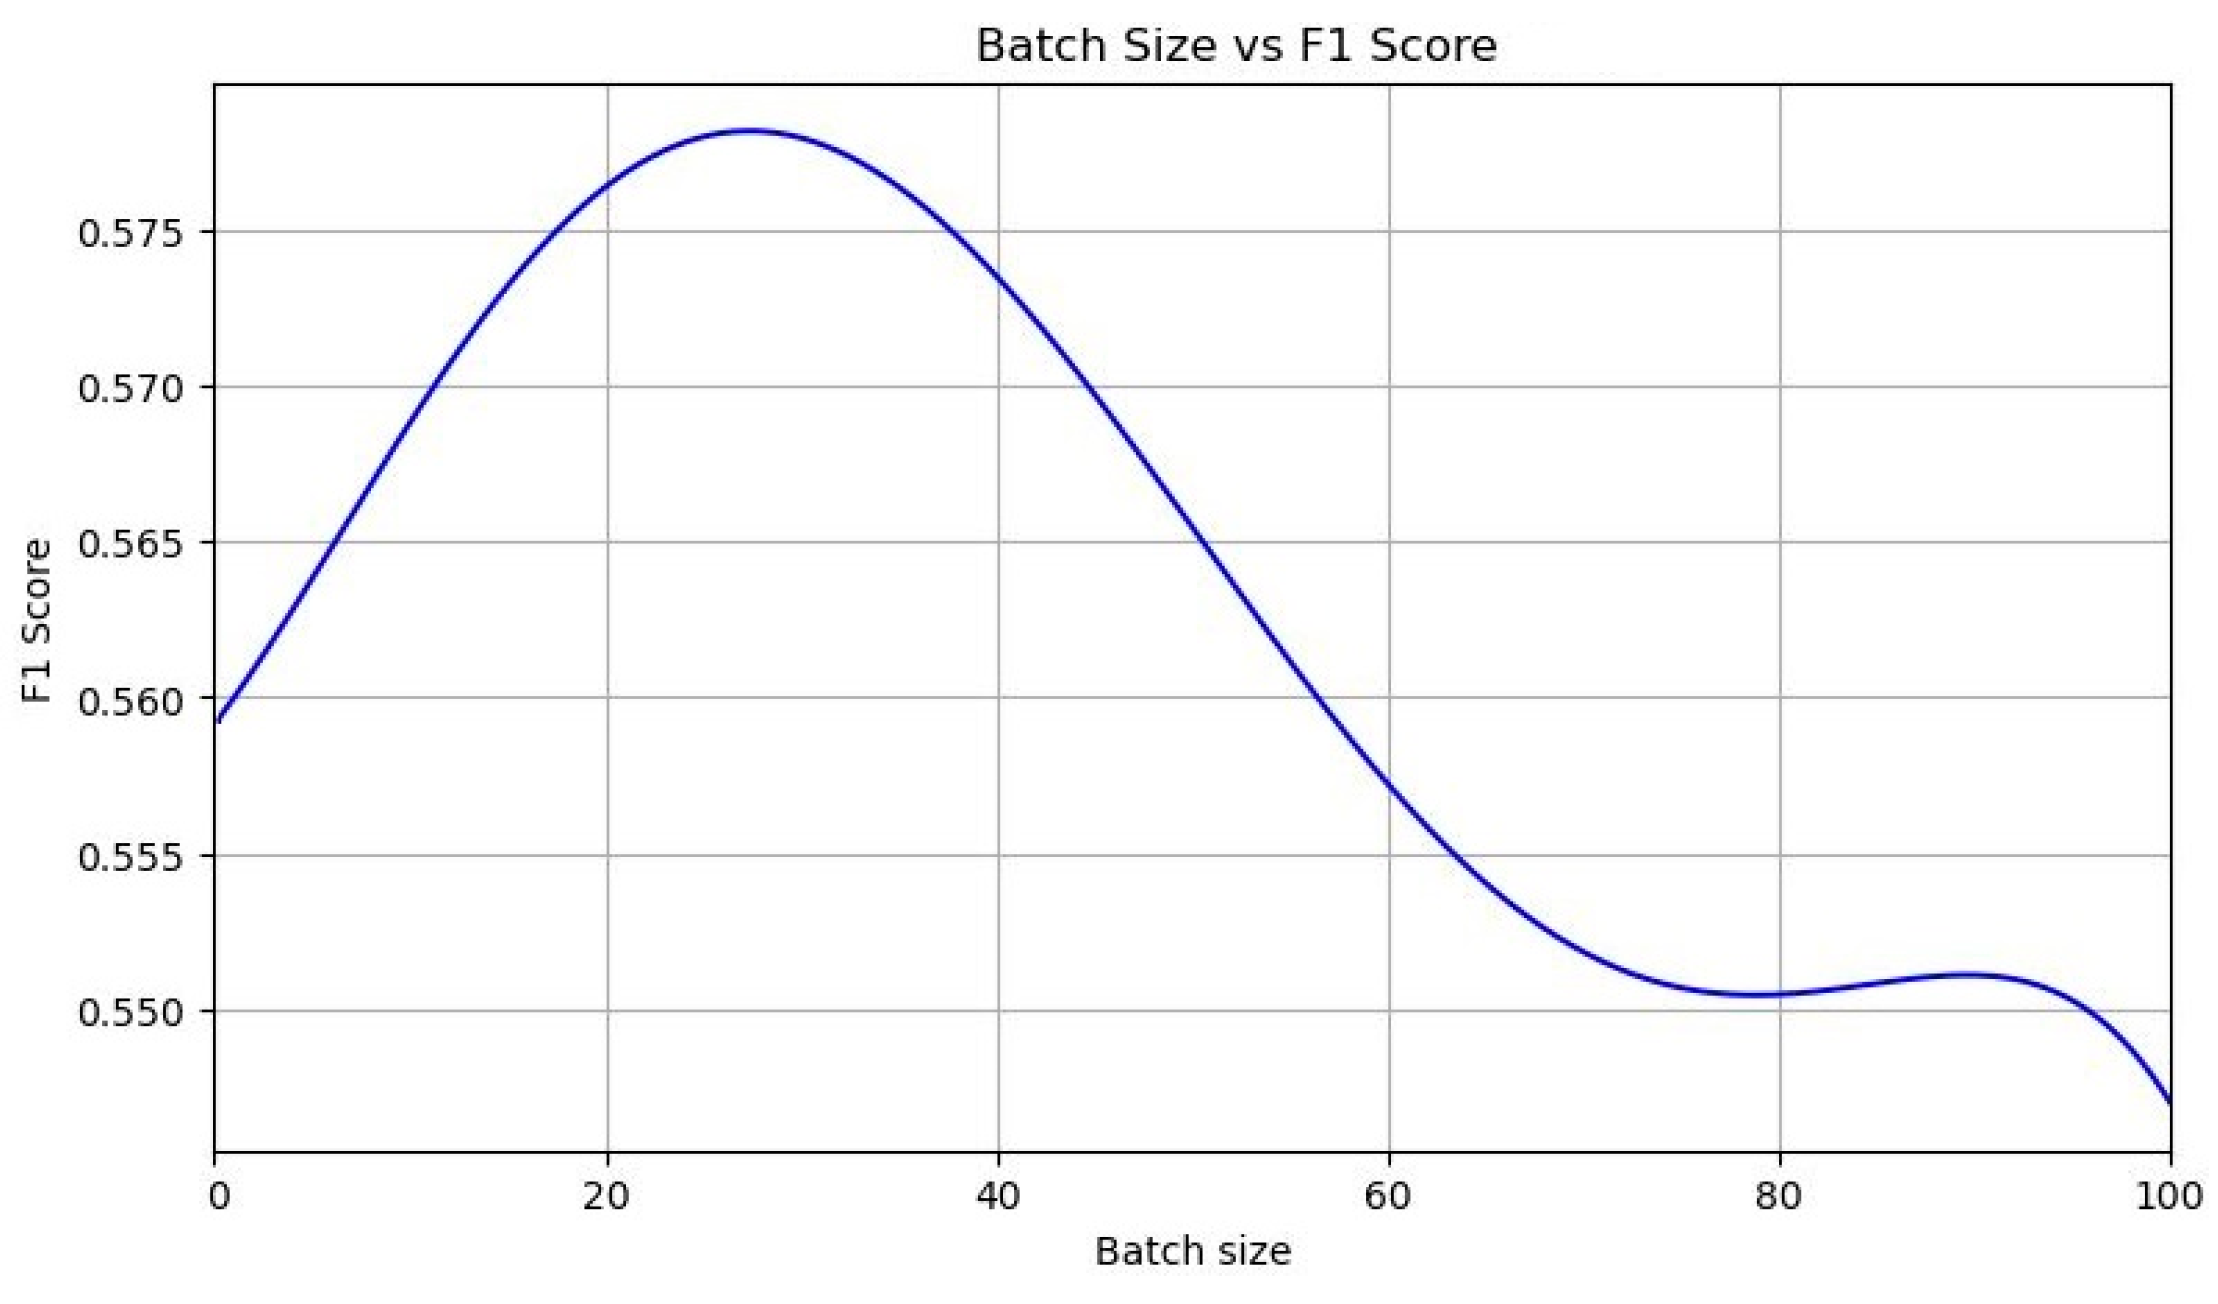
Batch gradient descent is often touted as a faster and more stable method for implementing error backpropagation compared to stochastic gradient descent; however, this claim is not without its detractors, especially considering its tendency to halt and get stuck in local minima, particularly at higher batch sizes, such as 128, as evidenced by recent findings. Critics argue that this method might not always be the optimal choice, particularly when smaller batch sizes, like 64, are shown to potentially reduce these issues, offering a viable alternative. The recommendation to increase the number of training epochs is also under scrutiny. Increasing epochs from 20 to 50 or more has often been seen to degrade performance in scenarios with limited training samples, leading to heightened sensitivity to overtraining. This raises questions about the efficacy of traditionally favored approaches, suggesting that smaller batch sizes might not only help avoid the pitfalls of premature convergence but also necessitate a re-evaluation of the relationship between batch size, number of epochs, and overall network training dynamics.
The architecture of the convolutional neural network is important in the extraction and processing of textual data. The arrangement of the convolutional layers, coupled with filter sizes that capture varying contextual lengths, enables the network to discern subtle nuances in tone and sentiment. This flexibility is crucial for tasks such as sentiment analysis, where the emotional undertone of a text can significantly influence its interpretation. The ability of the CNN to adapt its filters to the specific demands of the dataset emphasizes the importance of an approach to neural network design where parameters are not arbitrarily chosen but are instead intentionally selected to optimize performance. The performance of these parameters is shown in
Figure 4,
Figure 5 and
Figure 6.
Moreover, the integration of dropout as a regularization technique demonstrates a strategic balance between learning complexity and model generalizability. By randomly omitting neurons during the training phase, with a dropout rate set at 50%, it prevents the network from becoming overly dependent on any single neuron, thus mitigating the risk of overfitting. This technique ensures that the model remains robust and capable of generalizing from the training data to unseen examples, which is essential for maintaining high levels of accuracy in real-world applications. In practice, implementing dropout has helped improve our model’s accuracy by approximately 5%, thereby enhancing its performance on external validation datasets.
Our strategy involved adapting the models to each assessed dataset during a five-fold cross-validation process (see
Table 2). By incorporating tweets from the training folds with additional datasets, we enriched the adaptation process of our model, a technique that was rigorously tested using diverse seeds and parameter tuning. The culmination of these tests yielded an average prediction accuracy of over 90%, helping the significant correlation between tweets and market behavior and validating the sufficiency of our sample size.
Employing two CNNs sequentially has proven to be less effective than using a single one; separately, it can significantly improve sentiment classification when focusing on prevalent positive sentiments. Optimal context extraction was achieved using filters of dimensionality up to 7, with a dropout rate of 0.5, demonstrating CNNs’ robust capabilities in text analysis and sentiment differentiation [
36], especially between emotional and neutral tones.
Table 3 and
Figure 7 illustrate our findings, linking sentiment analysis from social media with stock prices to provide a deeper insight into public sentiment and market trends.
After testing our classification model, we conducted data analysis by using the pre-processed sentiment data and stock prices. The employed algorithms included linear regression, random forest, and support vector machines (SVMs). The objective was to leverage machine learning techniques to predict stock prices based on sentiment data and historical price trends.
3.2. Predicting Stock Prices Based on Sentiment Data
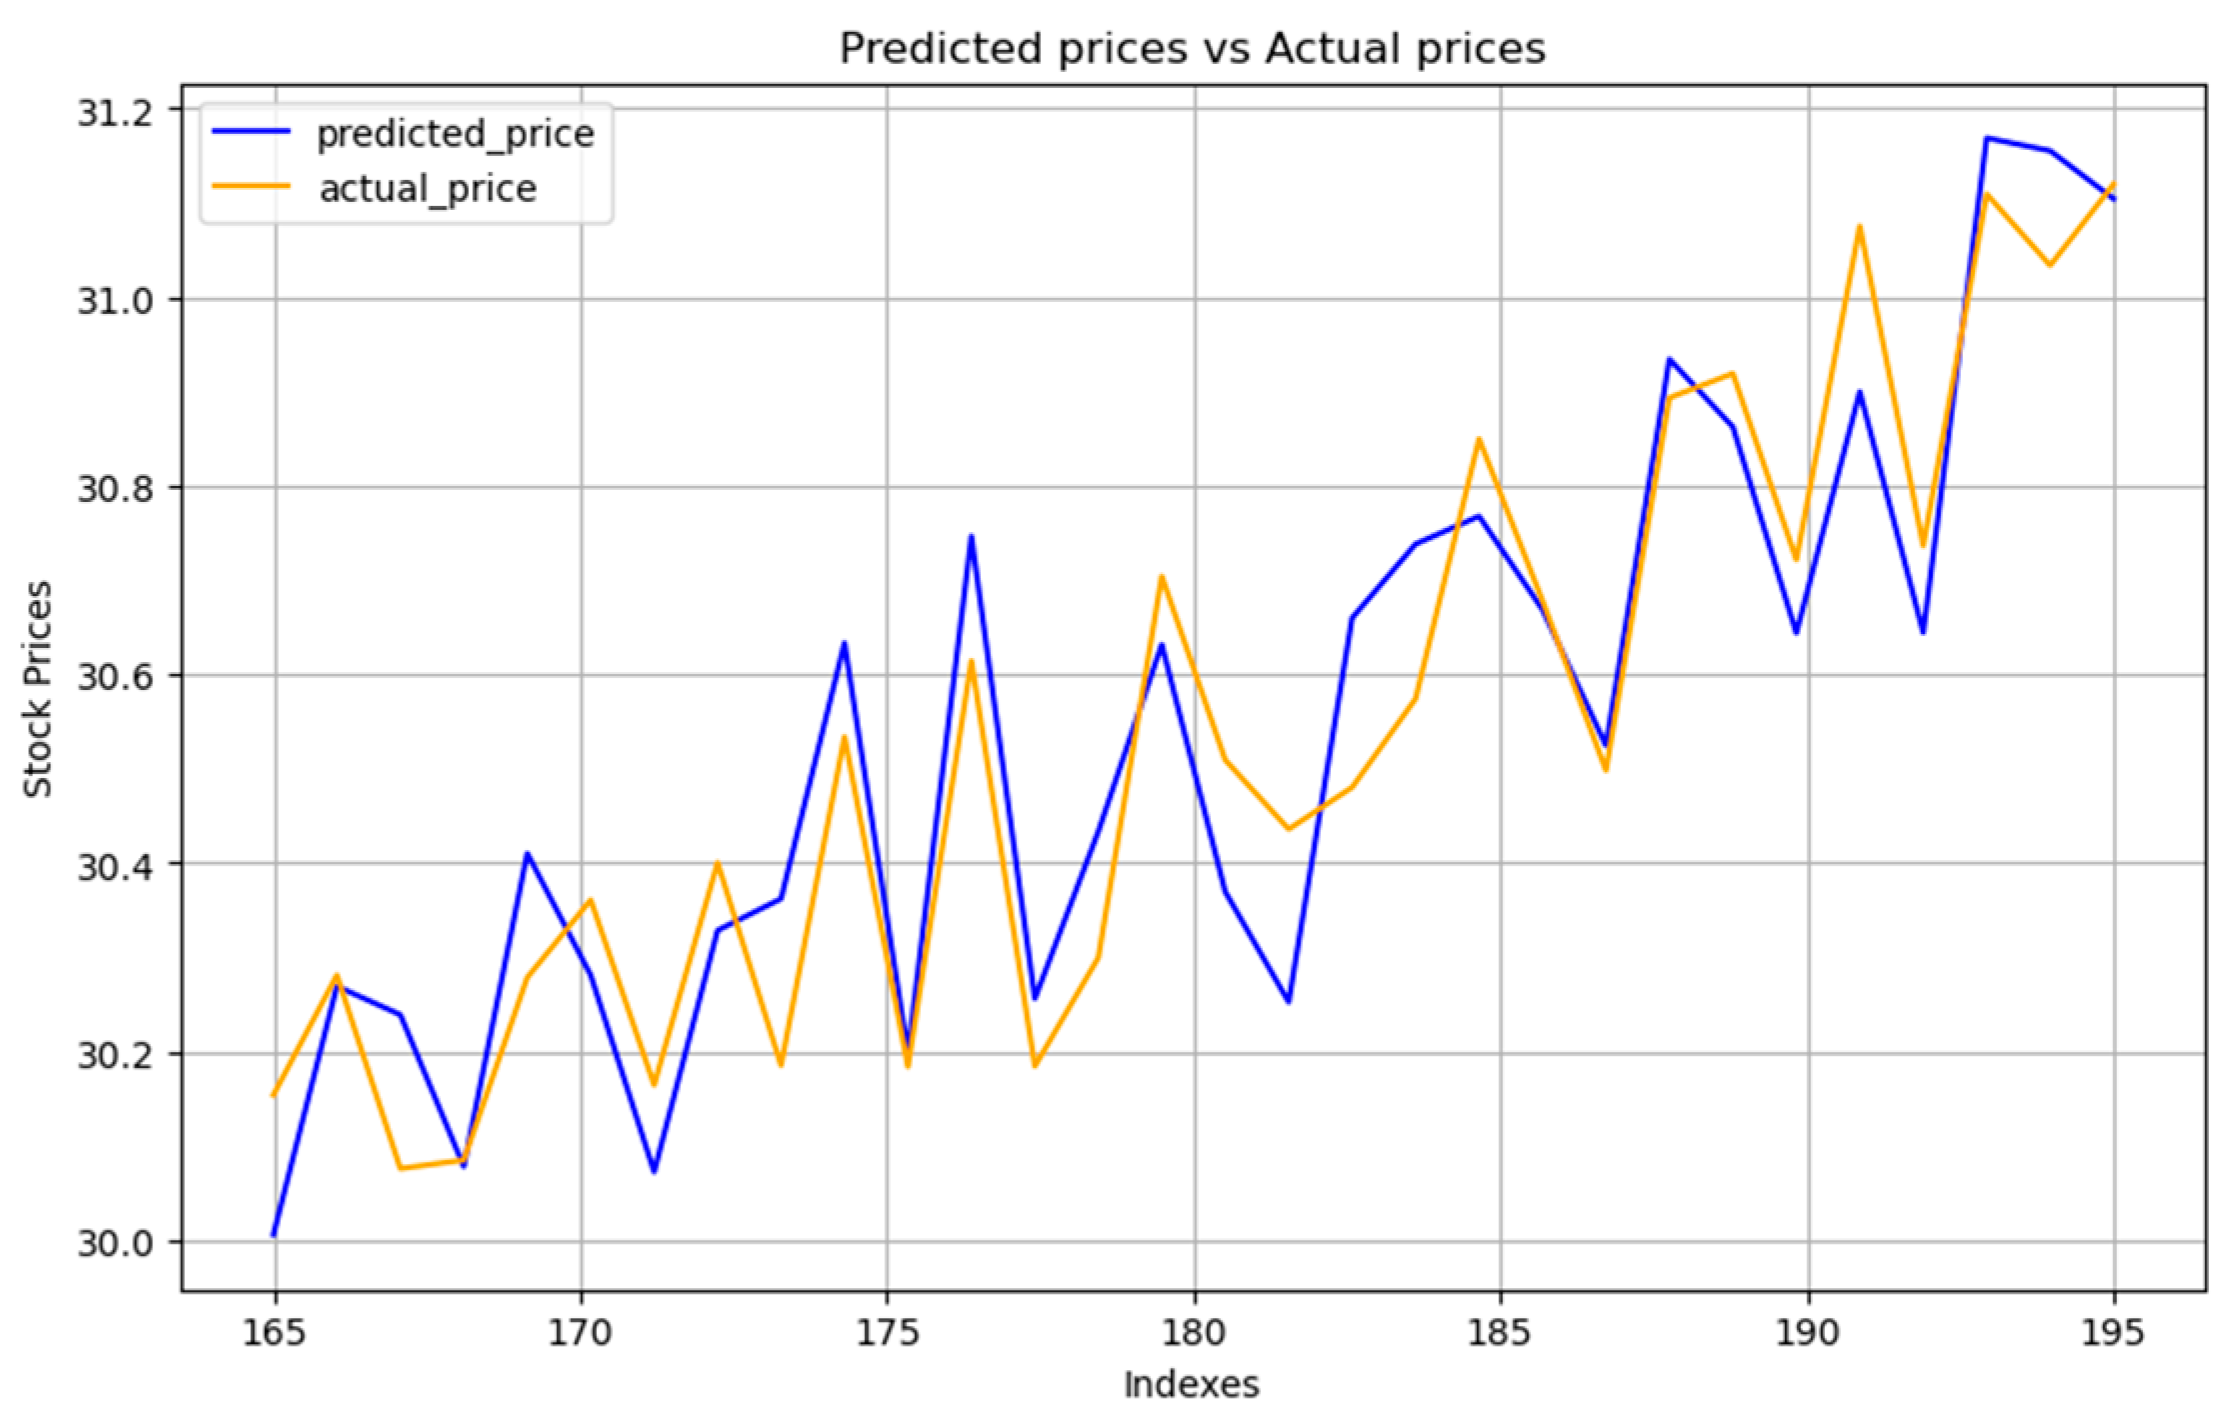
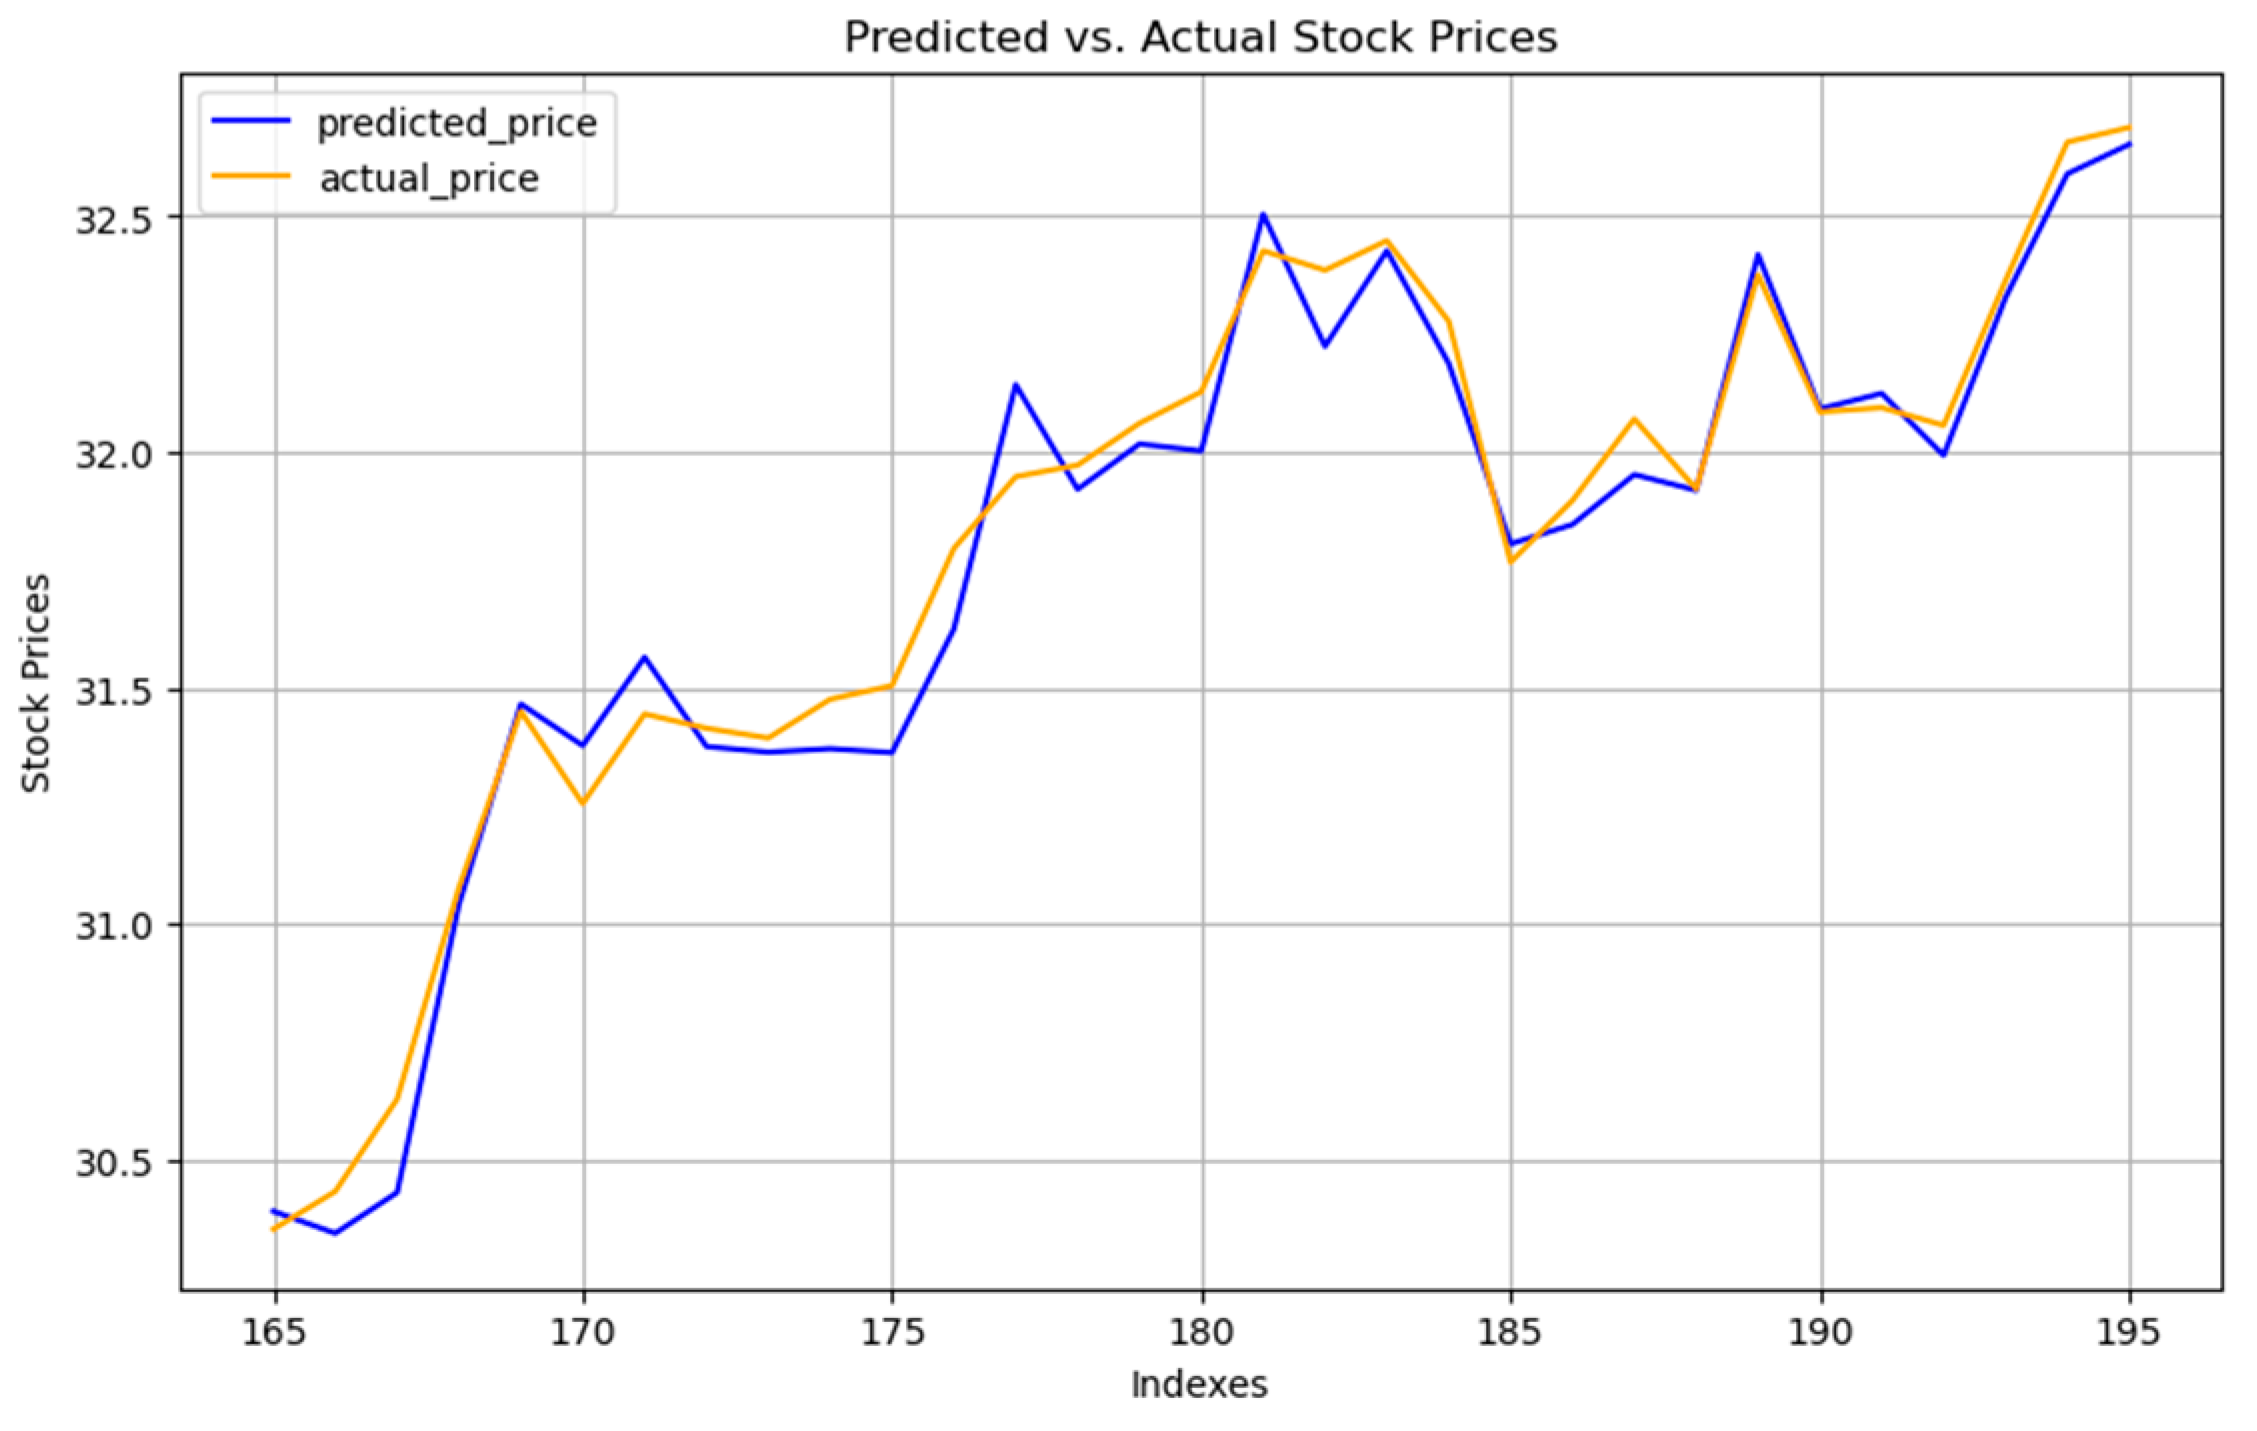
Given that our primary focus is on supervised learning algorithms and our dataset spans six months, we opted to allocate the initial five months of data for training purposes and the final month for testing. The figures presented clearly indicate that SVMs and linear regression outperform random forest in terms of prediction accuracy.
Figure 8,
Figure 9 and
Figure 10 display the prediction outcomes from linear regression, random forest, and SVMs, respectively.
Linear regression showed satisfactory prediction capabilities but tended to mirror the prior day’s actual stock prices closely. This pattern could potentially result in substantial losses in the volatile stock market, where prices can shift abruptly. On the other hand, SVM predictions demonstrated a closer alignment with actual prices, managing to capture the market’s trend more accurately despite a slight prediction delay. This indicates SVMs’ superior adaptability to market fluctuations compared to linear regression.
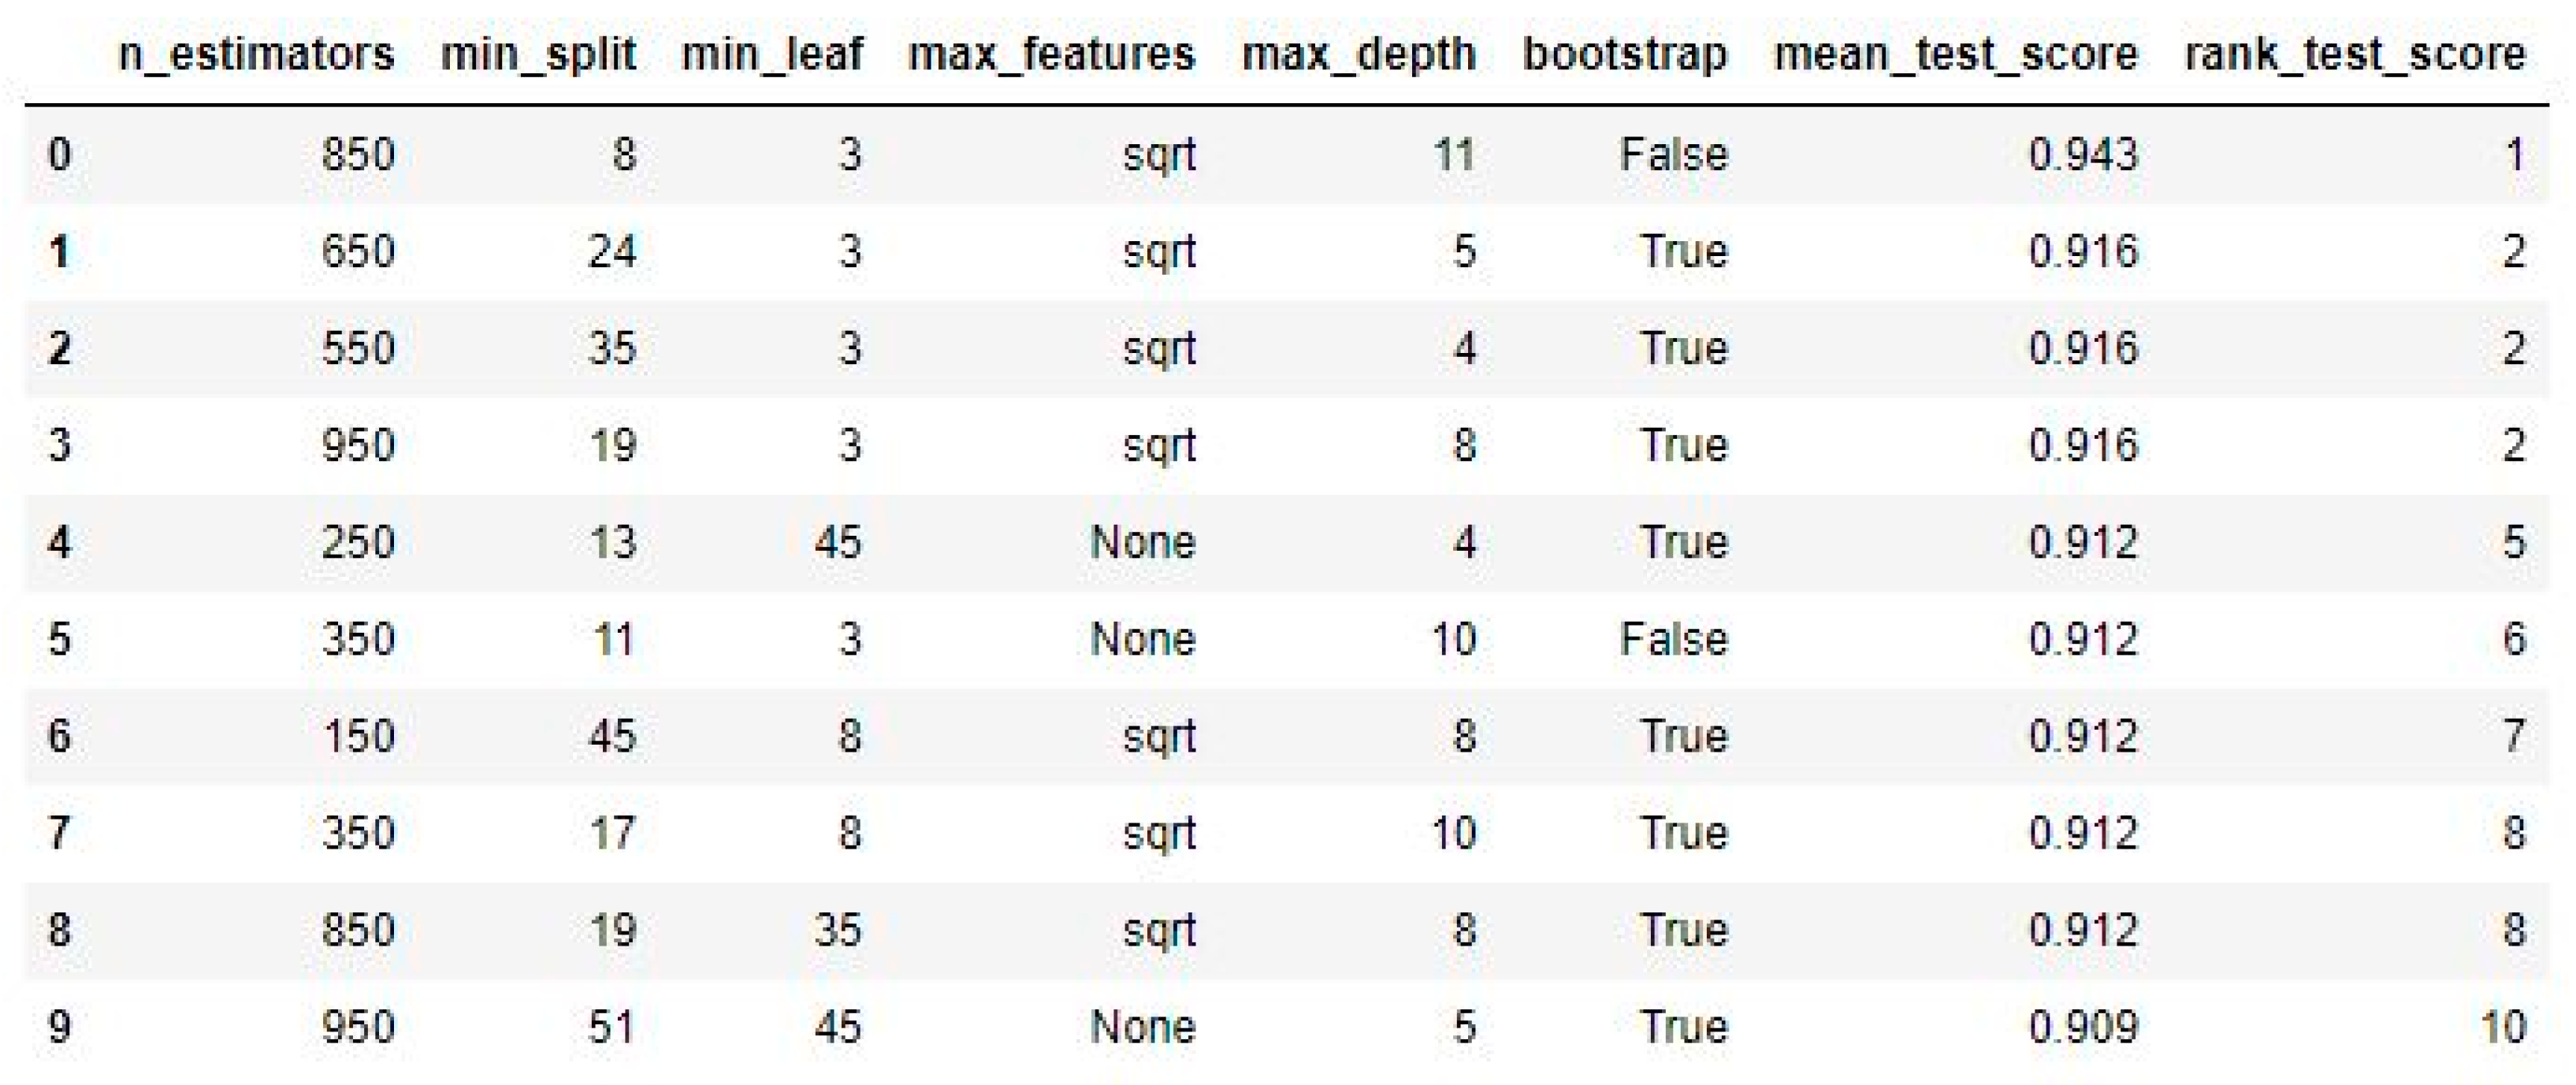
To refine our models further, we implemented a feature selection method aimed at identifying and utilizing the most crucial features from a reduced size of the training set. This process involved assessing the impact of different sizes of important features on the performance of our models, especially in handling imbalanced data. After feature selection, we began optimizing the hyperparameters of the random forest model by using the RandomizedSearchCV method [
37]. This method allows us to explore a broad range of values for each hyperparameter, enhancing prediction quality. Optimizing these parameters allows us to adapt the model to best fit the specifics of the data and task at hand. Over the course of 110 optimization iterations, we created more than 100 random forest models using this method to randomly select combinations of hyperparameters.
This approach provides valuable data on the most effective parameter ranges, including the number of trees in the forest, the maximum depth of each tree, and whether bootstrap samples are used when building trees, which can significantly improve the model’s prediction quality. For a detailed analysis of the effectiveness of different parameter combinations, refer to
Figure 11, which contains results from the RandomizedSearchCV method. This figure provides information on each tested configuration, which was crucial for selecting the optimal model settings for the current model.
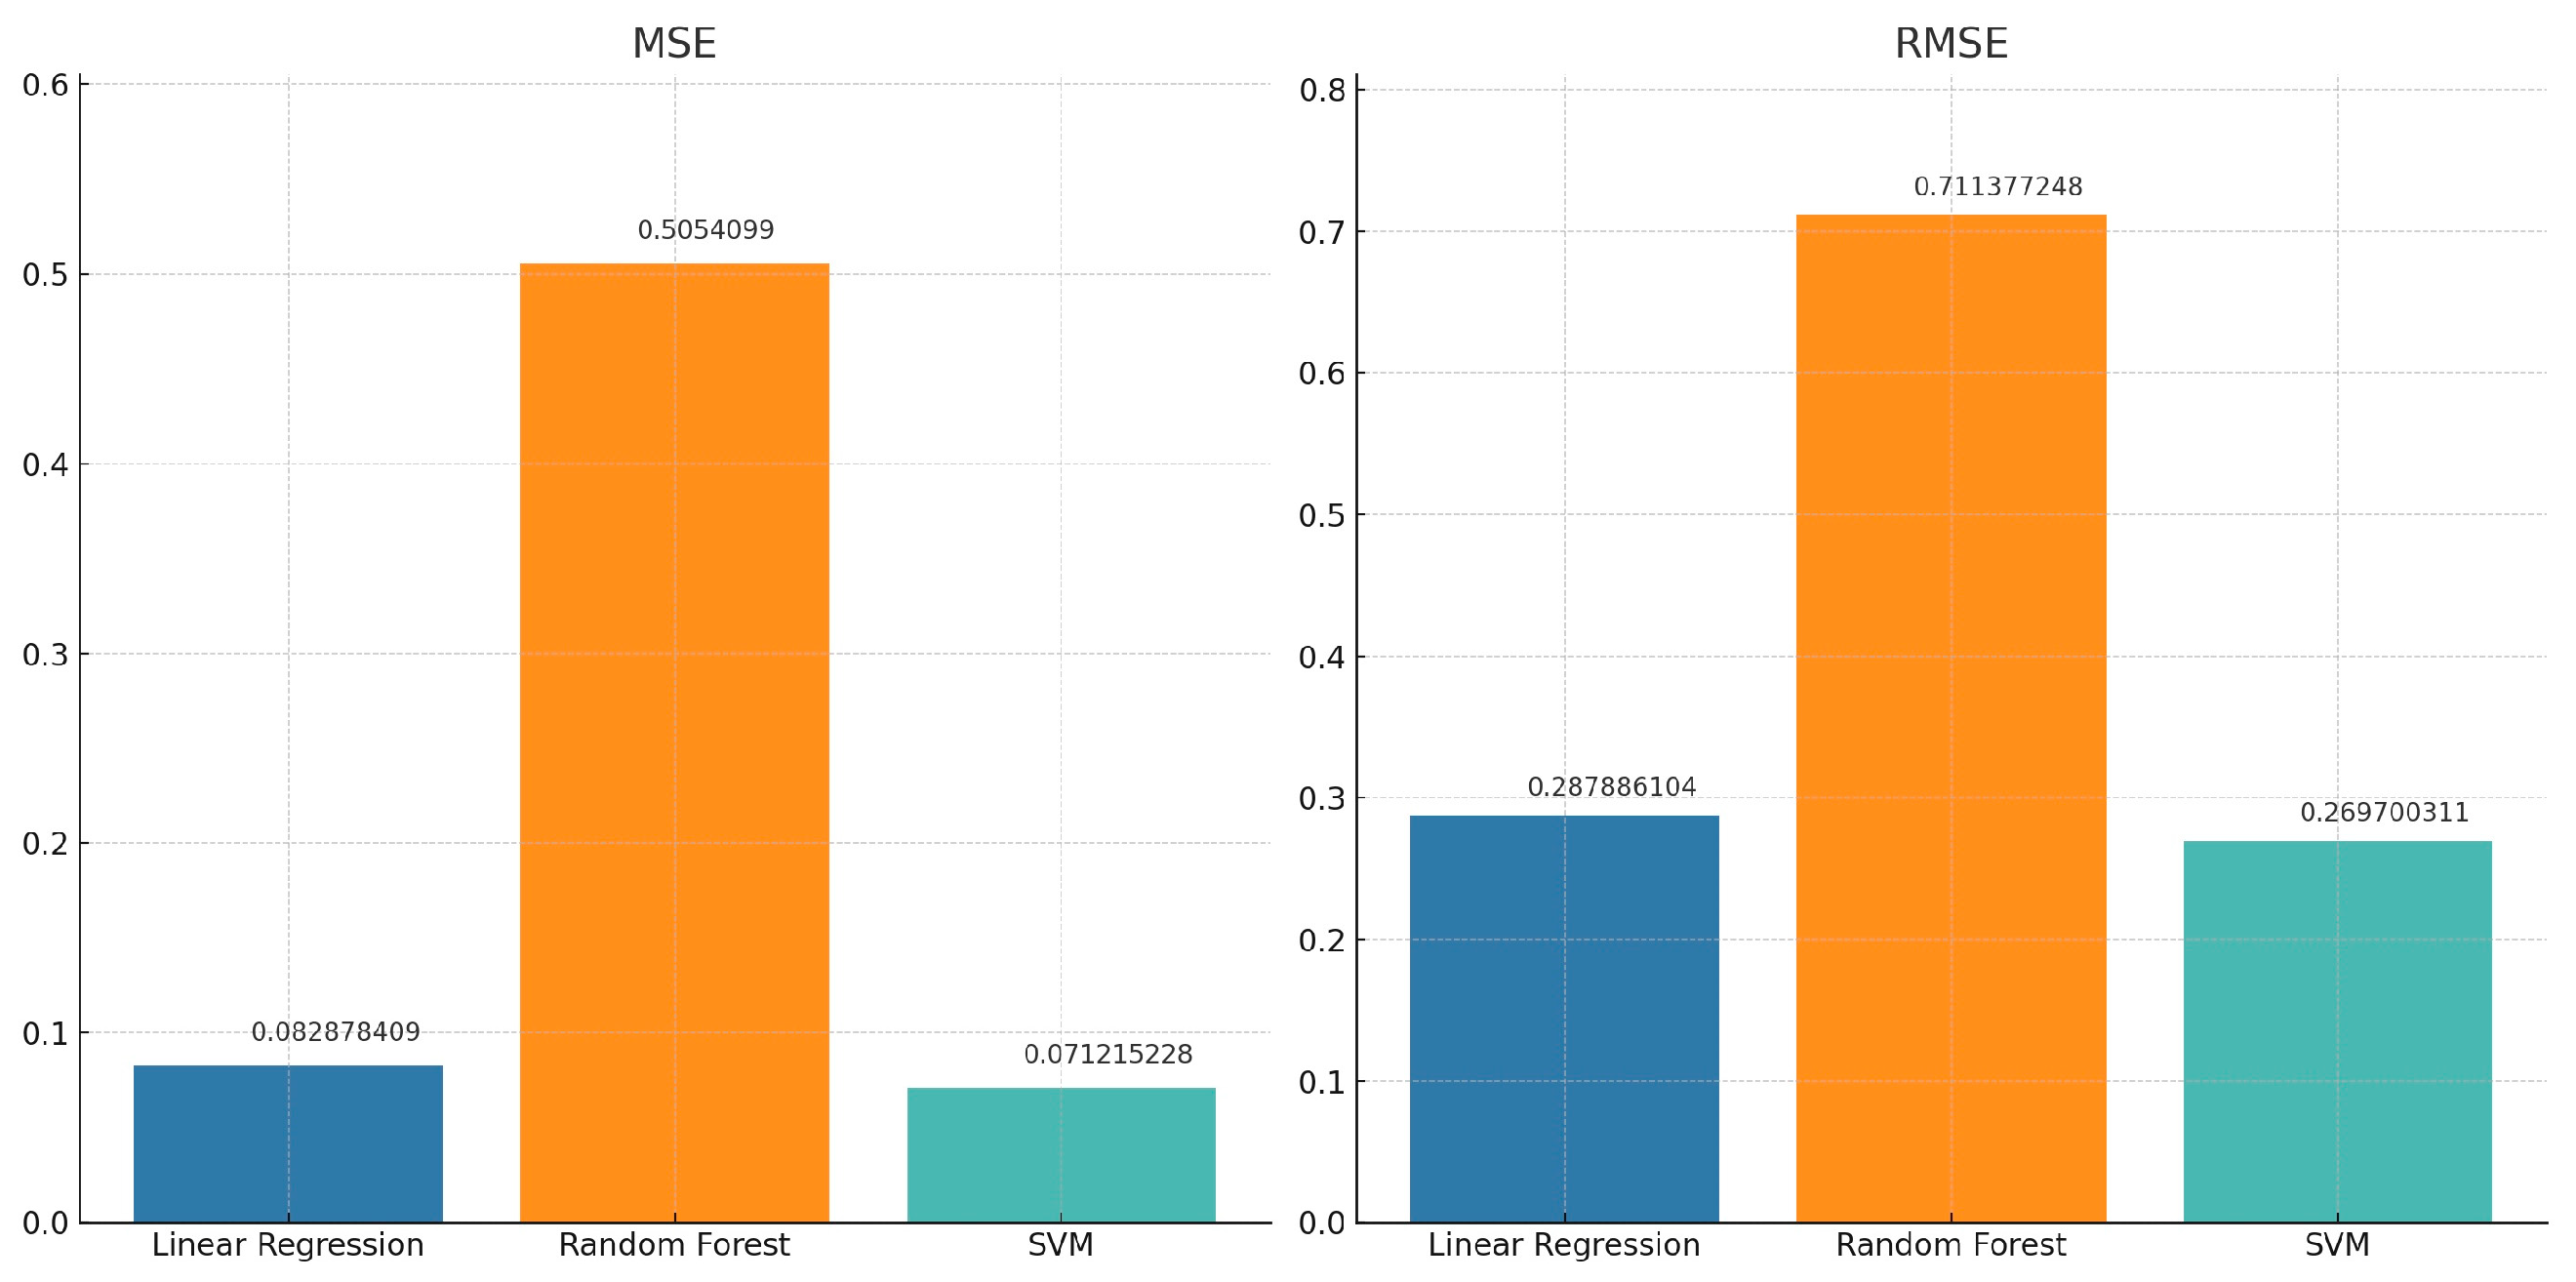
While numerous studies employ the accuracy of trend prediction as the benchmark for evaluating prediction models, this work adopts a different approach [
38]. Considering that stock investment decisions are not solely based on the directional trend of stock movements but also on seasonal factors and other complexities, a mere qualitative assessment is insufficient. Therefore, we opt for root mean square error (RMSE) and mean square error (MSE) as our evaluation metrics. These quantitative measures are widely recognized and provide a more comprehensive assessment of a prediction model’s performance. The outcomes of our evaluation, based on these criteria, are detailed in
Table 4.
Our analysis, shown in
Figure 12, highlights how well the linear regression and SVM models can predict with low errors. The SVM model, in particular, stands out for its accuracy, matching what we expected [
39]. Its predictions are very close to the real market prices, and it is good at following the ups and downs of the market, even if there is a slight delay in its predictions. This shows that the SVM model is quite robust and flexible, able to keep up with market changes better than the linear regression model. We have put a lot of effort into making our model as accurate as possible by focusing on the most important factors that affect market movements. By carefully choosing which features to include in our model, we have been able to make our predictions more precise.
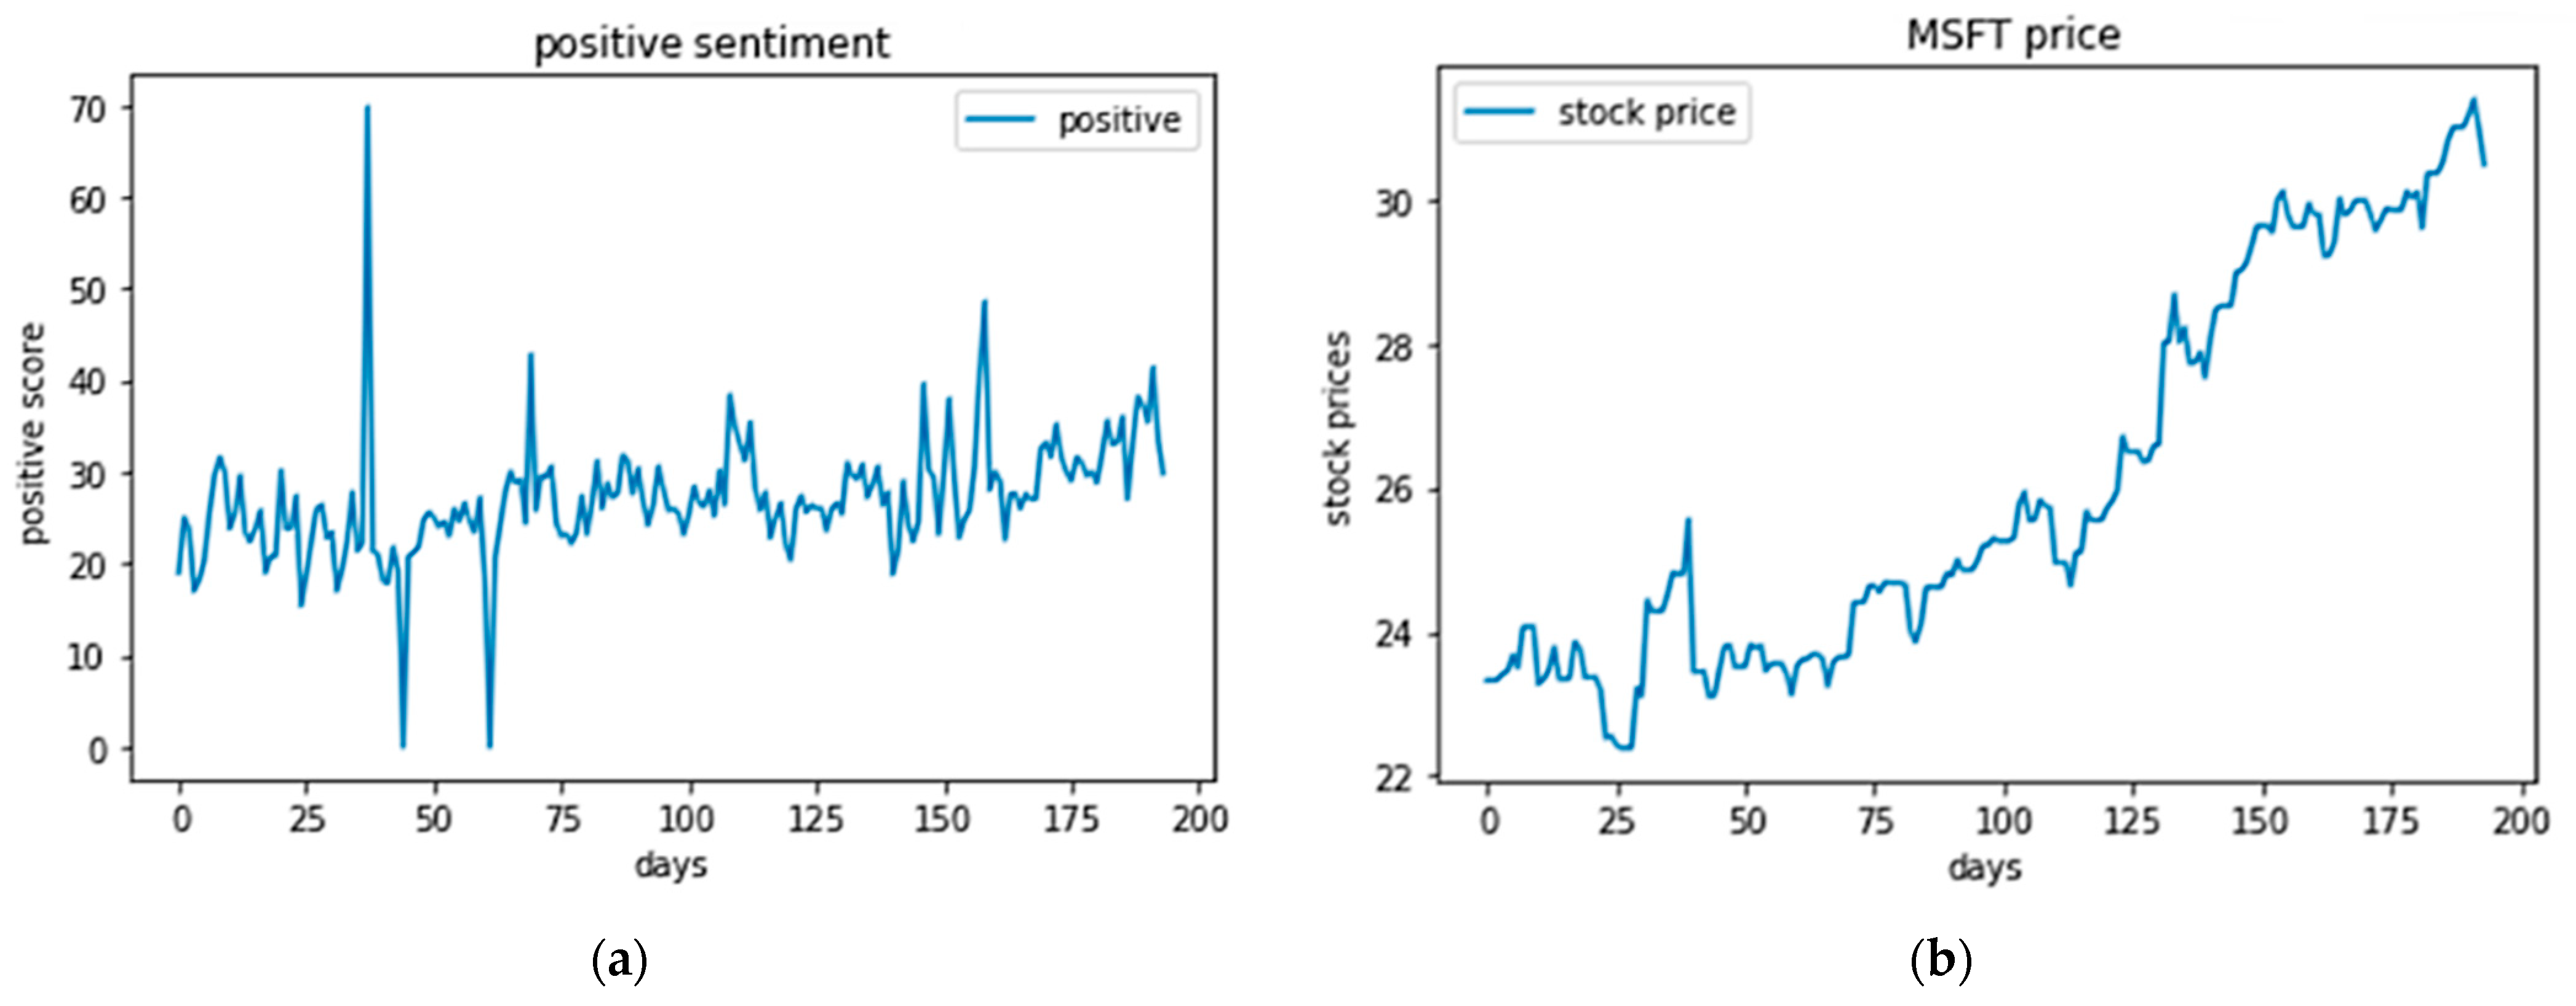
In
Figure 13, we explore market dynamics by correlating Microsoft’s stock price with prevailing sentiment trends on social media over a 200-day period. The first part of the figure (
Figure 13a) shows the daily positive sentiment scores on social media, which vary significantly with peaks reaching as high as 70 and notable spikes around days 50 and 175. The second part (
Figure 13b) displays Microsoft’s stock price, which exhibits a general upward trend from approximately
$22 to
$30 over the same period, with noticeable dips and recoveries aligning with shifts in sentiment scores. The figure illustrates how periods of increased positive sentiment, like the sharp peak on day 50, correspond to a rise in stock prices shortly thereafter. Conversely, lower sentiment around days 100 to 125 aligns with a plateau in stock prices, suggesting a direct influence of public perception on market behavior; however, it is also important to note that while the correlation is evident, causation cannot be definitively established from these graphs alone.
As a result, we could apply our model to predict NASDAQ stock trends by analyzing sentiments from daily Twitter posts (see
Table 5). With so many tweets out there, and many not related to the stock market, we made sure to only use tweets that mention stock hashtags. This way, we have a wide range of data that is meaningful and large enough to be statistically reliable, helping us analyze trends more accurately and keep unnecessary noise to a minimum.
For sentiment extraction, tweets were classified into positive, neutral, or negative categories. The predictive model designed to forecast stock price fluctuations demonstrated an accuracy exceeding 75% on the test set. This result is indicative of the efficacy of our proposed strategy, which consistently outperformed alternative methods over the observed period. The models were trained using offline data, with the dataset divided into a training set, constituting 80% of the data, and a test set, comprising the remaining 20%. Each dataset entry includes feature vectors encapsulating sentiment scores and the prior day’s stock price change rate. With over 20 k records in the dataset, the models underwent initial training followed by evaluation against the test set.
Comparative analysis across three distinct models revealed that the SVMs yielded the highest performance metrics on the test data, establishing them as the selected model for our final system implementation. This chosen model demonstrates the practical application of sentiment analysis in financial market prediction, solidifying its relevance and utility in the domain of quantitative finance.
4. Discussion
The discussion of the results starts by placing our findings within the larger framework of theoretical implications in the field of sentiment analysis. Initially, we conducted a thorough preprocessing of both Twitter and stock market data, ensuring precise alignment by date for a cohesive analysis; however, unlike some earlier research that suggested a more uniform distribution of sentiment [
40], the sentiment analysis, applied after the preprocessing phase, revealed an unexpected pattern: the sentiment scores across stocks formed a left-skewed distribution, hinting at a subtler sentiment polarity than previously thought. Contrary to the common narrative, the results suggested that extremely negative sentiments had a more pronounced impact on stock price declines than previously reported, while significantly positive sentiments were closely tied to stock price increases. This observation directly challenges the notion that public sentiment has a stochastic effect on stock prices, underscoring the hidden influence of extreme sentiments on market dynamics. Further diverging from past findings [
41,
42], we posited that Twitter influencers might have significant sway over market movements, a hypothesis not extensively explored in prior work [
43]. We explored sentiment fluctuations over time, adopting an hourly classification to uncover potential impacts on stock performance. This detailed approach, focusing on temporal sentiment variations, proposes a novel method for sentiment analysis in finance, setting the stage for the deeper incorporation of time series models in future investigations [
44].
The practical implications of the research suggest that the combined use of CNNs with SVMs, RF, and LR creates a framework for sentiment analysis, particularly well-suited for financial applications, as previously discussed [
45]. This approach uses the strengths of each model to better capture the complex dynamics of market sentiment, thus enriching the theoretical discourse on machine learning applications in finance. The findings provide empirical support for pre-training context-based CNN models to improve the accuracy of classification; however, we identified that amassing larger sets of tweets does not invariably enhance predictive performance, particularly for models trained from scratch on tweets. Moreover, the employment of the short strategy, bolstered by spread return calculations, does not always mirror the complex nature of market trading. The findings suggest an optimal tweet sample size of 40,000 or fewer, beyond which the model’s adaptation becomes less effective. This decline in adaptation efficacy may stem from the over-adjustment of model weights during back-propagation, potentially undermining the intrinsic semantic and syntactic knowledge previously encoded within the model’s layers.
The model, while a significant step toward understanding stock price movements through sentiment analysis, encounters several limitations that currently impede its real-world application. One of the prominent limitations is the tendency of the model to favor positive sentiment terms over negative ones. This bias may stem from the overall upward trend in stock prices observed within the dataset’s time frame. As a consequence, the model’s predictive accuracy is skewed, reflecting the prevailing positive market conditions rather than a balanced sentiment assessment. Additionally, the model’s training on multiple stocks and the potential cross-sentiment influence among users could introduce systematic bias, affecting the generalizability of the predictions. The impact of breaking news on subsequent days could affect predictions, which suggests a need for further study.
Another aspect we encountered during model training was the reliance on bigram frequency as the primary feature that may further constrain the model’s capacity to encapsulate complex sentiment expressions, as it overlooks the potential richness of sentiment conveyed in longer N-gram terms [
46]. Let us consider the statement “the news about the sector was not good, but savvy investors saw it as a chance to buy at a discount before the inevitable recovery”, which illustrates how the bigram “not good” can be misleading as an indicator of negative sentiment about stock prices. This example shows that bigrams or even higher-order N-grams might not capture the entire context of tweets or other textual data.
During the CNN model training, we aimed to overcome these language-dependent issues. While such problems are less common in English, languages like Russian, which use double negation, can present messages with meanings that are entirely different from what they seem. We applied various sets of parameters, including the length of N-grams, to train a model that is balanced in terms of accuracy. Despite these limitations, we chose to use bigrams for their better reliability and the speed of training the neural network model. Bigrams provide a more balanced solution than longer N-grams because they are less likely to capture unnecessary “noisy” information, which can attenuate the meaning of phrases, especially in non-standard text fragments like tweets [
47].
To address these challenges, we are exploring several methods for hybridization and data preprocessing. These include better stop word filtration, morphological analysis, the use of more accurate embedding techniques, and improving the data selection process, especially for tweets used in training. The goal is to incorporate advanced NLP methods to adapt to certain anomalies inherent to languages, particularly where grammar plays a significant role in analytic languages. Our current attempts in this area are still in the early stages, but the inherent features and architecture of CNNs offer numerous opportunities for customization. Although these limitations and challenges exist, they provide guidance for future research directions. We see hybridizing the primary approach and data preprocessing as a practical solution in future research, improving the model’s context understanding.
Furthermore, we consider that the choice of the lagging parameter, while based on comparative performance metrics, lacks a robust selection algorithm that could potentially enhance the model’s predictive capability. While the model has shown improvement in performance, the error margin remains too high for practical use. We are considering the application of a non-linear model to the entire feature set as a possible improvement.
Future iterations of this model would benefit from the application of more sophisticated algorithms for parameter selection, likely leading to improved performance outcomes. Another challenge is the integration of multiple software tools, which has led to complications in achieving a seamless combination. This technical hurdle has notably restricted our ability to access real-time data and accurately predict stock price movements as they unfold. These limitations outline the areas for improvement and future research directions. The solutions for refining the model are mostly based on feature selection, which, along with the implementation of proposed algorithms and tools, are important next steps to achieve the desired level of reliability in more dynamic data environments.
5. Conclusions
In conclusion, the study highlights the viability of employing SVMs and linear regression as classifiers following the extraction of features from context-based CNN models. These classifiers emerge as judicious selections, complementing the intricate modeling process and reinforcing the veracity of sentiment analysis as a pivotal tool in stock price prediction. We have taken a distinctive path by forgoing traditional external dictionaries in favor of direct textual analysis, a decision driven by the limited availability of such dictionaries across various languages. This approach allowed us to zero-in on sentiment-linked phrases crucial within specific scenarios, thereby crafting a neural network model customized to contextually significant sentiment analysis. The method effectively narrows the knowledge gap, ensuring that the sentiment analysis is not only relevant to specific contexts but also mirrors stock market trends with high fidelity. Our exploration incorporates diverse strategies to not merely refine our models’ accuracy but also their comprehensibility. By harnessing advanced mathematical modeling techniques, we have strived to ensure that our findings are crystal clear.
The study’s insights into sentiment polarity and the influential role of Twitter users offer a fresh perspective that contradicts some established beliefs, suggesting that the relationship between public sentiment and stock market trends is more complex than previously understood; however, the research faces limitations due to a bias toward positive sentiments, influenced by an upward trend in the dataset. The reliance on bigram frequency can introduce biases and may not fully capture complex sentiment expressions, impacting predictive accuracy. By addressing these challenges through methods such as hybridizing the primary approach and refining data preprocessing techniques, we can enhance the model’s ability to accurately reflect the complexity of expressed sentiments.
Future work will focus on enhancing feature selection, refining algorithms, and better software integration to improve the model’s accuracy for real-world financial applications. This work serves as a viable template for developing advanced predictive models that can be directly applied to stock market investing, transcending the role of mere academic reference to become a practical tool in the arsenal of investors.
