1. Introduction
Machine learning is obtaining an important role in many industries. The usability of machine learning contributes to regression, classification, clustering, dimensionality reduction, and decision-making tasks that constitute supervised learning, unsupervised learning, and reinforcement learning, respectively. Each machine learning is driven by distinctive functionalities such as predictive tasks, insight extraction from the unlabeled data, and the responses from the current state. The adoption of machine learning by industries, specifically in the telecommunication field, is focused on lowering operating costs, creating highly automated processes, creating new revenue streams, and enabling faster provisioning processes (fulfilment and assurance) [
1]. Machine learning applications are positioned to accelerate a more critical use of resources to enable sixth generation (6G) networks [
1].
This progression in the telecommunication industry incited the growth of many applications to carry specific tasks in various flows/activities from 5G, subsequently progressing to improve in similar ways for 6G. Traffic steering functions optimize the overall flows for traffic traversing in the telecommunication infrastructure. This function gives bare load balancing functionality to dynamic traffic management by re-routing the traffic based on network conditions [
2]. Ultimately, the traffic steering function computes the end-to-end path of the traffic flow to obtain the optimum route. Other than optimizing the flow, the study in [
3] adopts the traffic steering method to improve the reliability of the data transmission utilizing heterogeneous access networks. This area is further investigated by [
4,
5] to improve the overall resource using distinctive machine learning methods to predict traffic demands and avoid congestion.
6G aspires to have new use cases, more devices, and ubiquitous connectivity. The two essential elements qualifying the next generation of networks into 6G are the diverse use cases and the heterogeneous transport networks. According to the study in [
6], four pillars support the 6G aspirations: (1) Enhanced Human Communication, (2) Enhanced Machine Communication, (3) Enabling Services, and (4) Network Evolution. In particular, this paper focuses on the network evolution of 6G, which aims to enable artificial intelligence (AI) and expand service ubiquity. AI and service ubiquity emerge as new opportunities to provide additional options for transport network resources to the overall service deliverables. The research expands to understand the approach to maximizing the enormous volume of data generated in the infrastructure, potentially giving valuable insight for subsequent actions to fulfil the service ubiquity aspiration by enabling the integration of a non-terrestrial network (NTN) into the terrestrial network (TN). The innate nature of satellite technology from NTN integration gives inevitable service coverage to an area. Hence, extending the TN to NTN creates new resource provisioning benefits. Nonetheless, incorporating the NTN into 5G and 6G is the main challenge while upholding the existing critical requirements in 5G and future 6G.
The applications of machine learning in telecommunication processes are vast and diverse. However, machine learning essentially works with large volumes of data, and handling data for machine learning processes requires massive processing computations and more time. Incorporating a new process into 5G and 6G infrastructure using machine learning shall consider the time-critical applications because 6G demands a lower latency value [
7]. Based on the study in [
4,
5], an Open Radio Access Network (O-RAN) relies on non-real-time and near-real-time nodes to perform offline learning of the data and push the programmed inference to the RAN component. Although machine learning gives new propositions to the decision-making process, a comprehensive study is required to ensure the non-impairment of the latency value. In recent years, several studies have been conducted to improve the latency value, such as the placement of edge computing near the access node and the application of federated learning. Both non-exhaustive methods share the common objective of reducing the processing time. This study focuses on the manipulation of a different technique of machine learning to expedite and uphold the optimum decision from the learning process. In addition, the emergence of the non-terrestrial network co-existing with the terrestrial transport network in the end-to-end infrastructure necessitates automating the path selection process for optimum resource assignment.
This study focuses on the usability of offline data generated from a series of machine learning and linear programming works in [
8], where the clustering outcome implies the mixtures of traffic classifications that share similar attributes, and the path assignment is the outcome from the optimization solver for the resource assignment. The results for each packet are stored as an extensive list of training data for a classification task that labels the selected transport network for the assigned traffic. Based on the findings from the study in [
8], the overall clustering and optimization activity consumes a significant amount of time and computational resources. It is inapplicable for real-time operations, insinuating an investigation to adopt supervised learning to manipulate the labeled data from the clustering and optimization solver processes for classification processes.
This paper classifies path selection based on traffic attributes and assigns it to appropriate transport networks for traffic steering functions. The aim is to perform a classification that indicates the selection of transport network for each traffic. Respectively, the contributions to this study are stipulated as follows:
- i.
Introduced a traffic steering model that learns from operational data handled by the 5G nodes in a scenario of heterogeneous transport network types.
- ii.
Produced a novel traffic–transport network assignment scheme based on data generated in an area to achieve optimum resource management.
- iii.
Conducted an analysis of the timeslot for optimum classification model performance. The appropriate volume size of timeslot constituting sufficient diversity of UE traffic types helped create a good performance model.
The remainder of this study is organized as follows:
Section 2 elaborates on the related work on traffic steering approaches using various machine learning applications for classifications and predictive tasks.
Section 3 discusses the framework for the traffic-to-transport network assignment proposal.
Section 4 highlights the findings and analysis of the observations from the simulation scenario incorporated in the framework. Finally,
Section 5 describes the conclusion and future works.
2. Related Works
The utilization of machine learning in 5G for various objectives in 5G and 6G is substantial. Machine learning improvises the past communication system that relies on mathematical models [
9]. In [
9], the role of machine learning in 6G networks is classified from the physical, medium access control (MAC), network, transport, and application layer. It then elaborates on the challenges in respective domains and how various machine learning algorithms could resolve the limitations. Similarly, this study is driven to resolve the resource management issue by introducing a classification method from supervised learning.
The requirements in 6G are more complex and require highly efficient resource management. Ref. [
10] addressed the need to improve resource management from the Virtual Network Function (VNF) management in the Service Function Chain (SFC). The unpredictable value of traffic and the static resource allocation configuration are the main contributors to the inefficient resource management faced by the telecommunication service provider. In particular, the differences in the service demand create huge variations in resource allocation. Thus, the study in [
10] adopts machine learning techniques to close the gap, enabling the dynamic resource allocation for chaining the VNFs needed by the predictive method on the resource requirement. The outcome from end-to-end VNF instances instantiated in an SFC improved VNF resource allocation compared to the conventional method. A similar mission is shared from the research works in [
5], where the machine learning technique is embedded to aid the traffic steering decision by predicting the congestion on the VNFs serving URLLC traffic.
Studies in [
4] elaborated on the research from similar abrupt traffic demand problems by utilizing machine learning techniques to predict the traffic demand and enable dynamic resource management. Specifically, the study in [
4] aims to provide a guaranteed latency requirement and maximize throughput for URLLC and eMBB, respectively. It leverages the Open Radio Access Network (O-RAN) alliance platform to enable two short-term and long-term optimization solutions strategies. The short-term strategy is to resolve congestion and optimize RAN resources using inferences from historical data collected from RAN, which are learned and modeled by the machine learning process offline. Then, the long-term strategy objective is to resolve the traffic steering process, which comprises the prediction of traffic demand, bandwidth-split distribution, and flow-split variables. The findings from the study in [
4] indicate the workability of using two separate time-scale learning processes adopted in this study. The data from this study undergo a series of machine learning and optimization solver processes in offline mode, potentially inferring the learning outcome into the programmed RAN/node for execution.
A comparative study was done by Kim et al. to demonstrate the improvement of traffic steering performance using machine learning techniques [
2] against traditional methods. Ref. [
2] emphasizes the advantages of Mobile Edge Cloud (MEC) in 5G architecture because MEC handles essential resource management functions like computing, storage, and networking for last-mile connected nodes. Thus, the MEC node hosts and caches enormous transactional data that are highly useful for the machine learning process. In particular, ref. [
2] focused the research on manipulating machine learning techniques for traffic steering decision-making in radio access technology (RAT), specifically for scenarios with the connectivity of third-generation partnership program (3GPPP) radio access and non-3GPP radio access to MEC, using deep learning networks. The learning started by executing the traffic steering algorithms to recognize the network conditions. The process of learning the network conditions in [
2] is used in this study, and the mission is to capture the conditions of each transport network before the subsequent classification process. In addition, this study shifts the focus from RAT to the heterogeneity of the transport networks, composed of the terrestrial network (TN) and the non-terrestrial network (NTN); satellite and DOCSIS cable are the transport technology candidates envisioned for the 6G infrastructure.
The study into NTN cooperation with the TN network progresses towards the definition of workable architecture between both. The prominent candidate of NTN technology is satellite technology, and multiple integration types are discussed in [
11]. The 3GPP in Release 17 (R17) specified the enhanced functions for the foundational technologies that include coverage and capacity. Specifically, the integrated satellite–terrestrial network (ISTN) proposed in [
11] provides a novel ISTN architecture for different scenarios. Ref. [
11] also highlights the challenge of coordinating unified technical standards to enable ISTN because of the uncertain time of 6G commercialization and the reconciliation efforts within the satellite industry. Ref. [
12] performs a survey and highlights the challenges involved in the ISTN categorically from the network architecture, technical performance, and optimization together with the findings of key technology enablers to successfully have ISTN for 6G.
3. Network Architecture, Learning Framework, and Methodology
The evolution of network generation from 4G to 5G and beyond enables new technologies to address the requirements of multiple domains from the industry. The aspiration for 6G continued to expand and provide extensive service coverage via feasible technologies with the adoption of non-terrestrial networks like satellite technology. Moreover, based on the niche characteristics of a specific locality, the footprint of such technologies is vast and reliable. Ref. [
13] mentioned that the service coverage of Data Over Cable Service Interface Specification (DOCSIS) Cable TV services comprises 67% of total fixed broadband subscriptions. On the other hand, the satellite is the optimal candidate for “Ubiquitous Services” because of its innate capability to reach a place where standard terrestrial network technologies could not reach. Thus, the study opted to analyze a scenario of the co-existence of three different types of transport networks in overall network architecture, as shown in
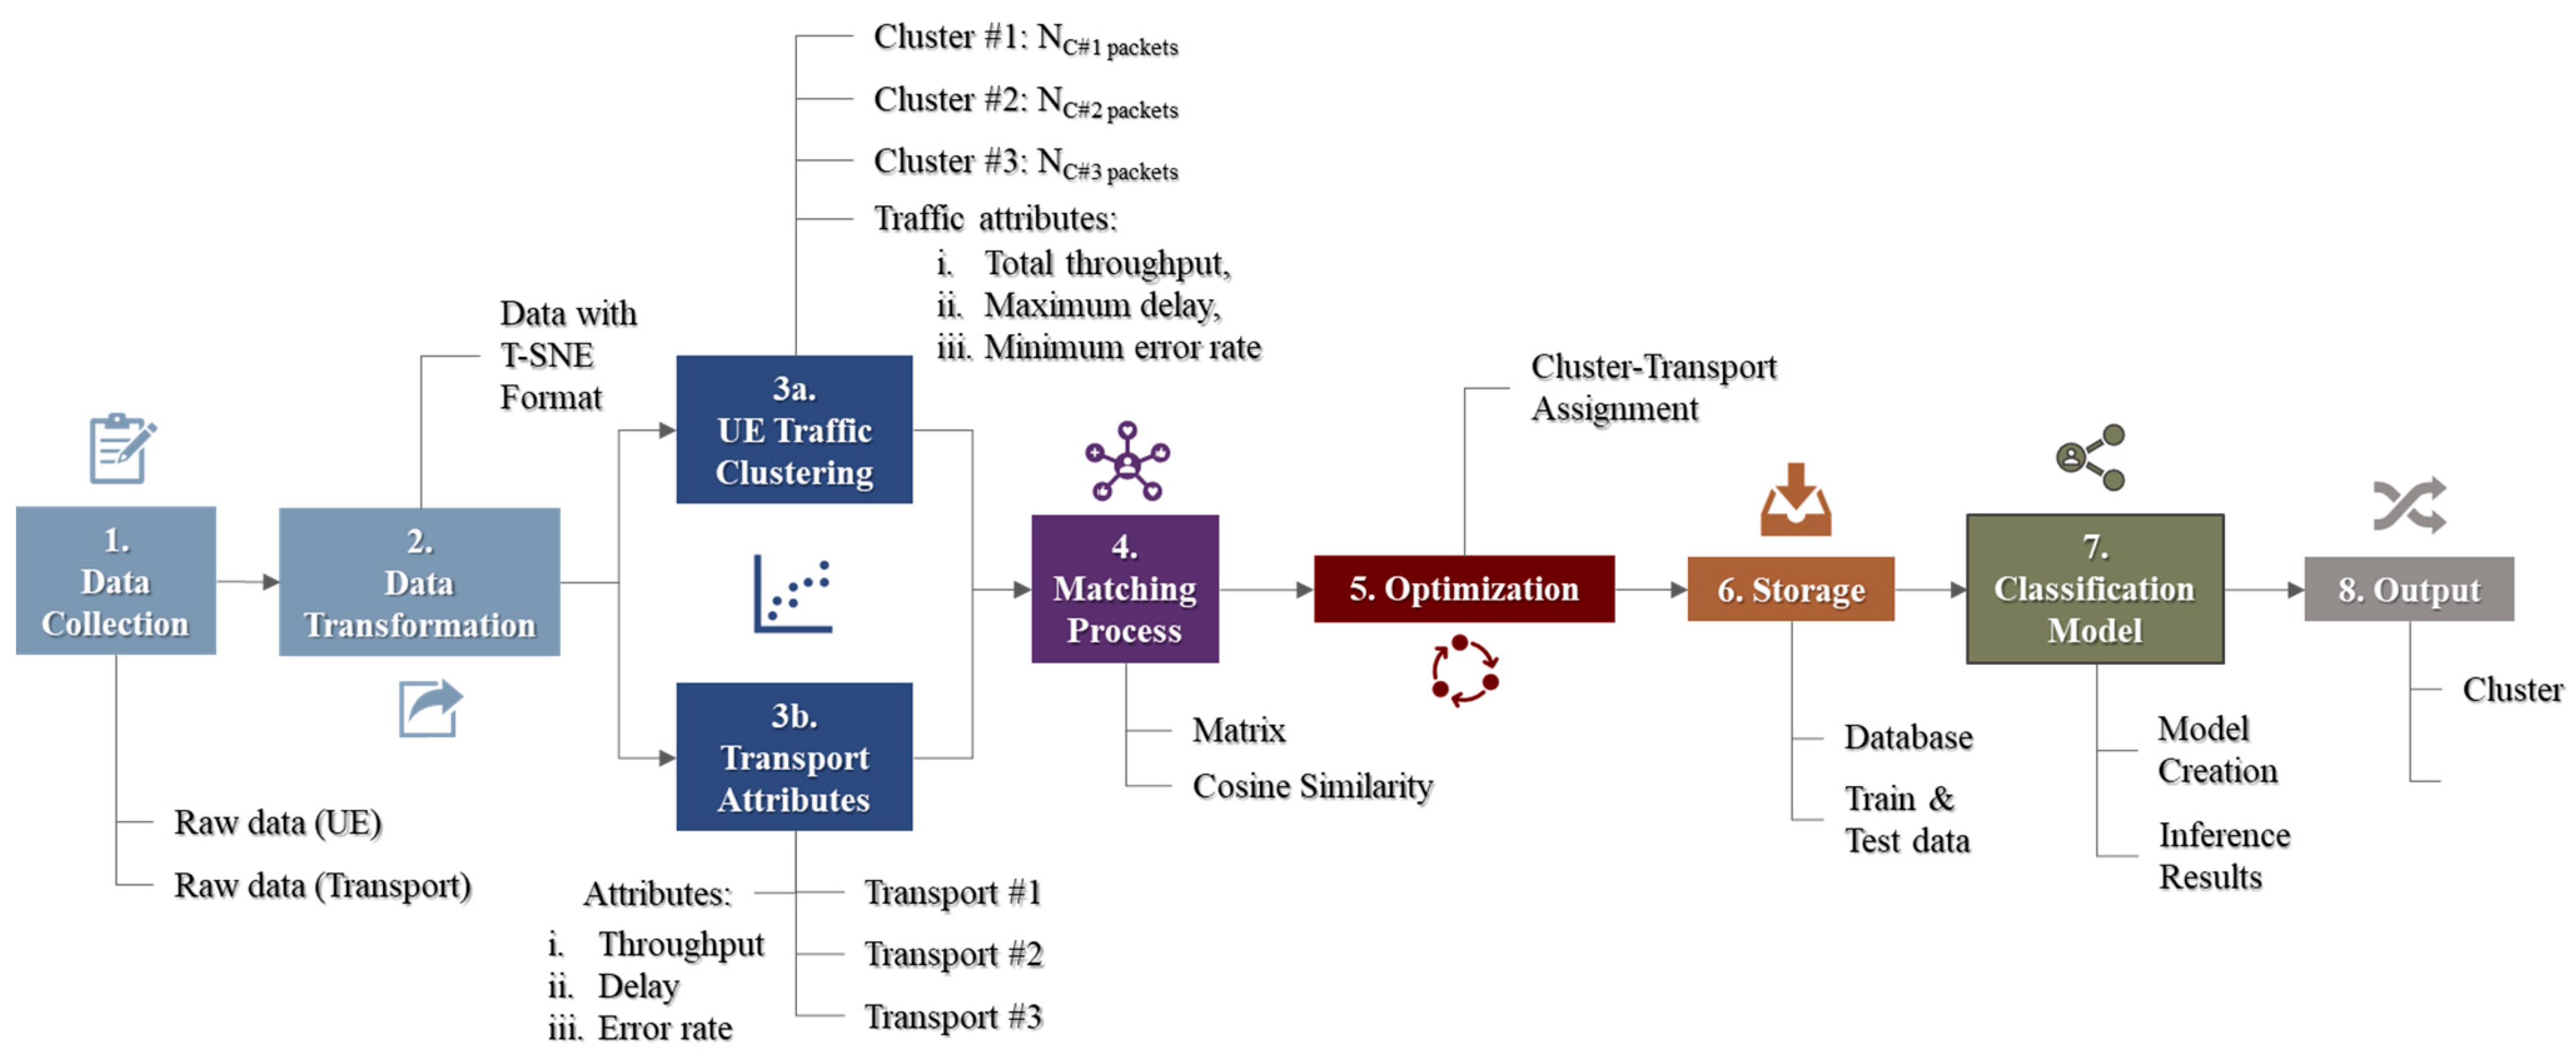
Figure 1. Then, the mechanism to enable the traffic steering function is formulated by adopting a sequential process of collecting raw data and performing data cleaning and transformation. Followed by the clustering of packets flowing to the access node, each computed cluster is assigned to the appropriate transport network that shares similar characteristics with packets in the respective clusters.
The role of the AI plane in
Figure 1 is to store the collected data from access and edge nodes, execute a series of machine learning algorithms, and create and store ML models. Based on the research work in [
8], the parameters such as download (DL), upload (UL), delay, and error rate are collected from nodes. The aggregated packets then undergo unsupervised learning to extract shared attributes and clusters into three transport network selection options for traffic steering functions. The subsequent process is optimization, which uses the mixed integer linear programming (MILP) method to identify the optimum traffic–transport assignment for each cluster. The processes classify each packet using DL/UL, delay, and error rate parameters. Then, the processes label the traffic into the cluster and the assigned transport network type. The overall process is implemented offline, and each output is stored for classification learning to produce a model that represents the niche characteristics of traffic generated in a specific area. Ultimately, the classification model is envisioned to be used in a node where the traffic is labeled and steered to the appropriate transport network. The proposed concept adopts a similar approach of assigning a bearer using the Quality of Service Flow Index (QFI). The end-to-end algorithm infers and is deliberate from the study in [
4]. The overall process is illustrated in
Figure 2 with high-level information on input and output from such activities.
The framework of this study is to explore the classification works using the data from the earlier works done in [
8], represented by Steps 1 to 5, as elaborated below. Thus, the scope of supervised learning begins from Step 6 onwards.
Data collection: raw data generated from UE’s traffic and transport network.
The data transformation process involves cleaning and transforming from multivariate to two-dimensional data using unsupervised learning, known as dimensional reduction.
Extraction of information:
UE’s generated traffic undergoes a clustering process using an unsupervised learning technique to form a defined number of clusters with attribute information for each cluster.
The extraction of attribute information for every type of transport network.
The preparation of clusters onto a transport matrix format for the subsequent matching process. The matching process runs matching algorithms to capture every pair of matching values based on clusters and transport attributes.
The execution of the optimization solver where the objective function is to find the maximum matching values between clusters and transport attributes. The outcome of the process yields a decision for the best traffic–transport assignment.
The storing process of pertinent data is based on the outcome of the prior activities.
The execution of a supervised learning process on the historical data by train and test process to create an extensive classification model. The vision of the machine learning classification model is to provide an inference to be programmed in the nodes for traffic steering decisions.
A final output comprises hyperparameters and labels results from clustering and optimization solver activities.
The machine learning algorithms rely heavily on the volume of data. 5G and beyond are data-driven architectures that utilize multiple data sources from different network functions and domains for automation, optimization, and improvement to support critical requirements, specifically in 6G [
9]. From the storage activity (Step 6) in the workflow, the UE’s generated data are used, and attributes like downlink, uplink, delay, and error rate values are captured and stored in every instance.
Table 1 indicates the parameters involved in the study. Three different datasets are captured for every defined duration in three different timeslots to demonstrate the independent relativity of the classification model.
Two new columns are added based on the output from Step 3 and Step 5 from
Figure 2, representing the cluster group of UEs and the types of transport assigned. Step 3 uses raw data as an input, transforms the data into the two-dimensional form and executes a clustering technique to identify the hidden pattern based on the density of every point tabulated on the graph. It is clustered into three defined clusters to be mapped using the total number of transport types. Subsequently, each cluster is mapped to every possible pair between cluster,
cn, and the transport network,
tn, types. The highest matching score for traffic–transport represents high similarity, and it will be selected for the traffic–transport assignment process using an optimization solver to obtain the best matching cluster–transport pair. Thus, variables,
v ϵ {
cn,
tn} and the
V is the predictive value of
v for each input of a user,
u, I; therefore,
u ϵ
I.
Table 2 enlists the activities in prior processes (from Step 1 to Step 5), and this study simplified the process to a minimum number of processes, reducing the handling time.
A Python-based program simulated the UEs and the traffic generated by the UEs. It generated various types of traffic/users scattered and served in cells converging to an access node, as in
Figure 1. In an area, the simulator emulated the generations of (1) static and mobile users and (2) the classifications of traffic produced by each user. The traffic generated by UEs followed the attributes of eMBB, URLLC, and mMTC categorized by the size of DL and UL data, packet error rate, and packet delay budget.
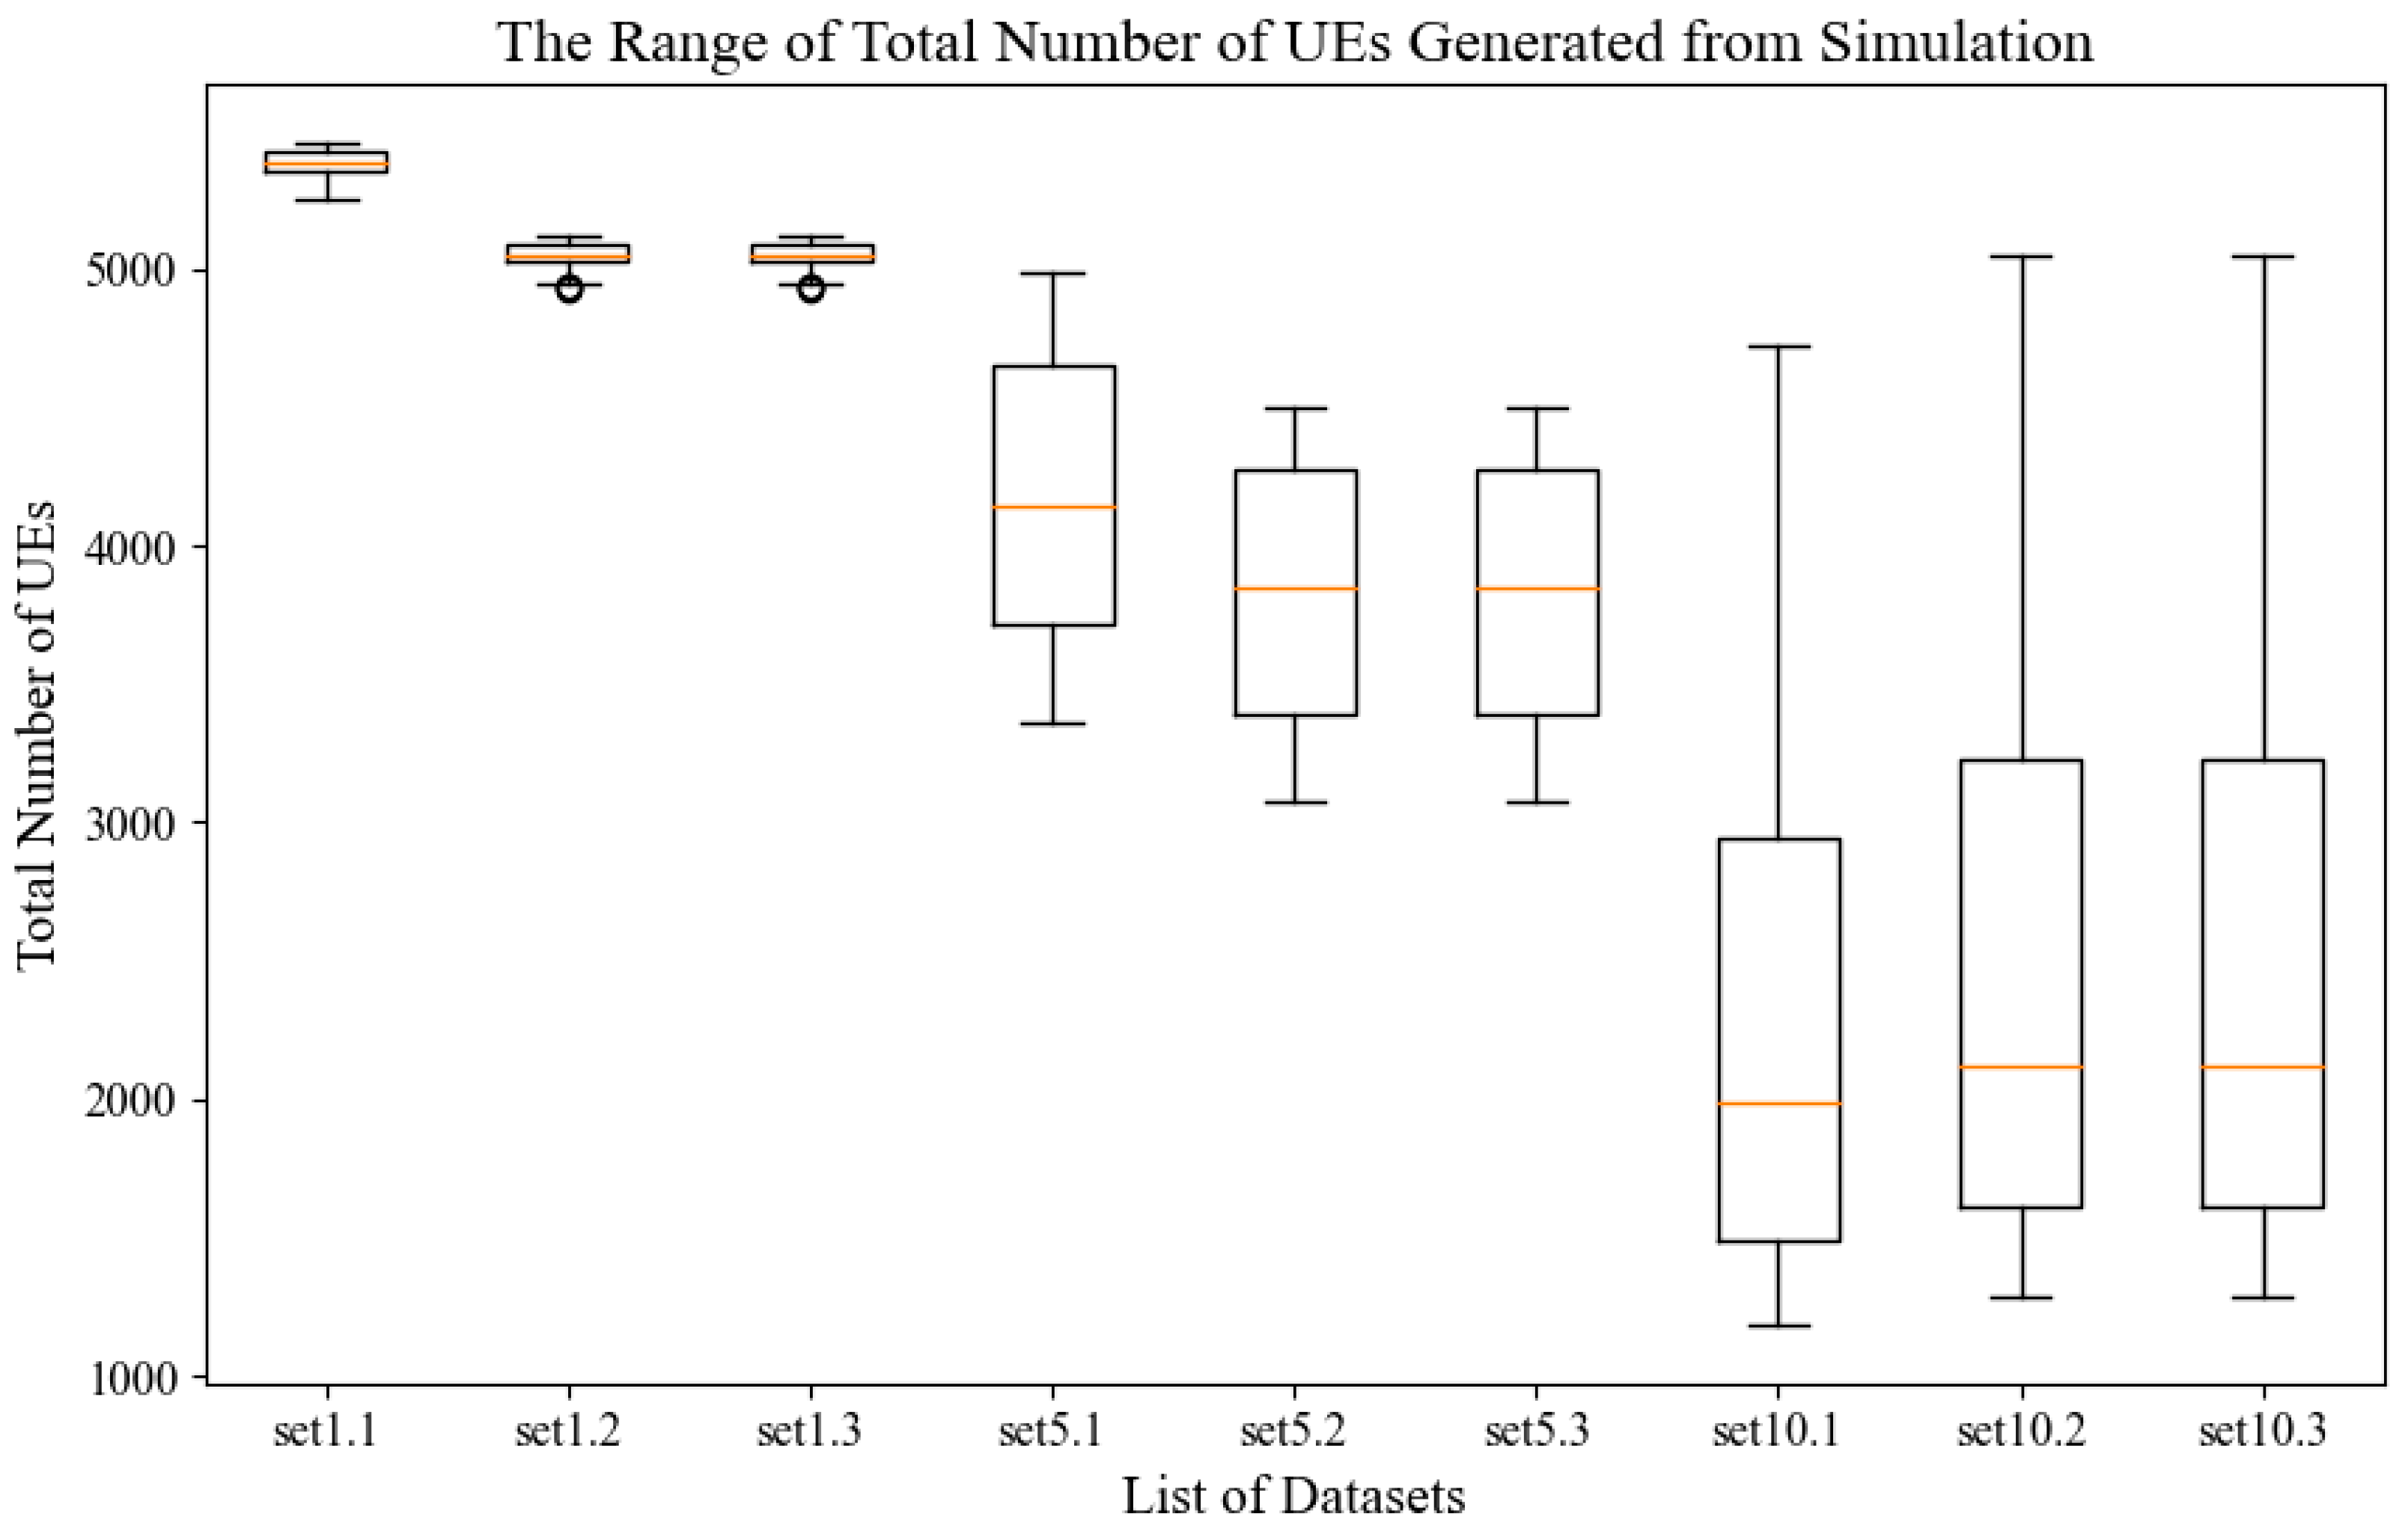
Supervised learning works with models were created from the training and test process of data. However, this study explored creating a model based on splitting the data according to the ratio in
Table 3. This step explored the granularity of the data size, where the models were developed by splitting the data based on percentages in
Table 3. The volume of each data set was determined by the duration of the recorded data and the total number of UEs in each instance. Referring to
Figure 3, the volume of each instance is huge because of the high number of UEs (more than 5000 UEs) with diverse attribute values. The multiplication of the total number of UEs with total instances in each duration tabulated in
Table 3 possesses a weightage to be measured from this perspective. Models denoted by
Mij represent the volume of data used to build the model. Subsequently, a series of
Mi4 models was used to train different data sets.
Next, the selected model
Mi4 from
Table 4 was used to classify the cluster number and the assigned transport network. Each
Mi4 represents the maximum volume of data generated in a set used to train and build a model to be used as a classifier for different datasets. The performance of the classification works will be validated by cross-checking the value from the actual clustering process (Step 3) and traffic–transport assignment (Step 5) against the multi-output classification model results.
4. Findings and Discussions
The first output (please refer to
Table 5) from the supervised learning process focused on the feasibility of model creation based on volume and the diverse values of the UE’s attributes. Partial instances (based on splitting percentage) from the entire dataset were used to train and create the classification model. The finding from this stage demonstrated that a high volume of datasets composed of durations and number of UEs produced better model accuracy. The accuracy of the multi-output classification model was determined by the percentage of the total number of wrong classification outputs against actual values from offline clustering and resource assignment processes using the MILP method. The table below stipulates the pattern showing the result of the supervised classification learning model. The model’s performance improved by producing a minimum error percentage according to the trained dataset’s expansion.
In both downlink and uplink streams, the model performs better in the increment volume of data. Subsequently, the study assesses the practicality of each created model to classify the targeted variables on the other dataset. Referring to
Table 6, the model’s performance on each dataset varies. The classification model developed from Set 1.1 consists of only 60 instances that produce a significant number of errors (unmatched output of classification model against actual), and the second classification target value, the assigned transport network, shows more than 70% unmatched output. Likewise, the classification model developed based on the massive volume of data in Set 10.1, consisting of 600 instances, produces close to 60% unmatched output.
The second model, developed with 300 instances, sits in the middle range between model Set 1.1 and Set 10.1 and shows good classification output. However, the percentage errors for the second classification target (assigned transport network) are higher than the first target output (cluster number). Overall performance of the model developed from Set 5.1 shows full accuracy when classifying the “cluster number” for downlink and uplink streams, whilst the classification for “assigned transport network” gives the average of 7.37% and 6.55%, respectively. The value translates to a scenario where in 100 traffic–transport assignment decisions, eight traffic from the downlink stream and seven traffic from the uplink stream will wrongly be assigned to the non-optimum transport network. The output from upstream links shows low variations of errors across all models developed and tested to respective datasets. The average error percentage for all datasets shows that the model developed using set 10.1 gives more than 95% classifying accuracy. Referring to the table, the highlighted red cells indicate the model’s performance against its training dataset; hence, it produces no error.
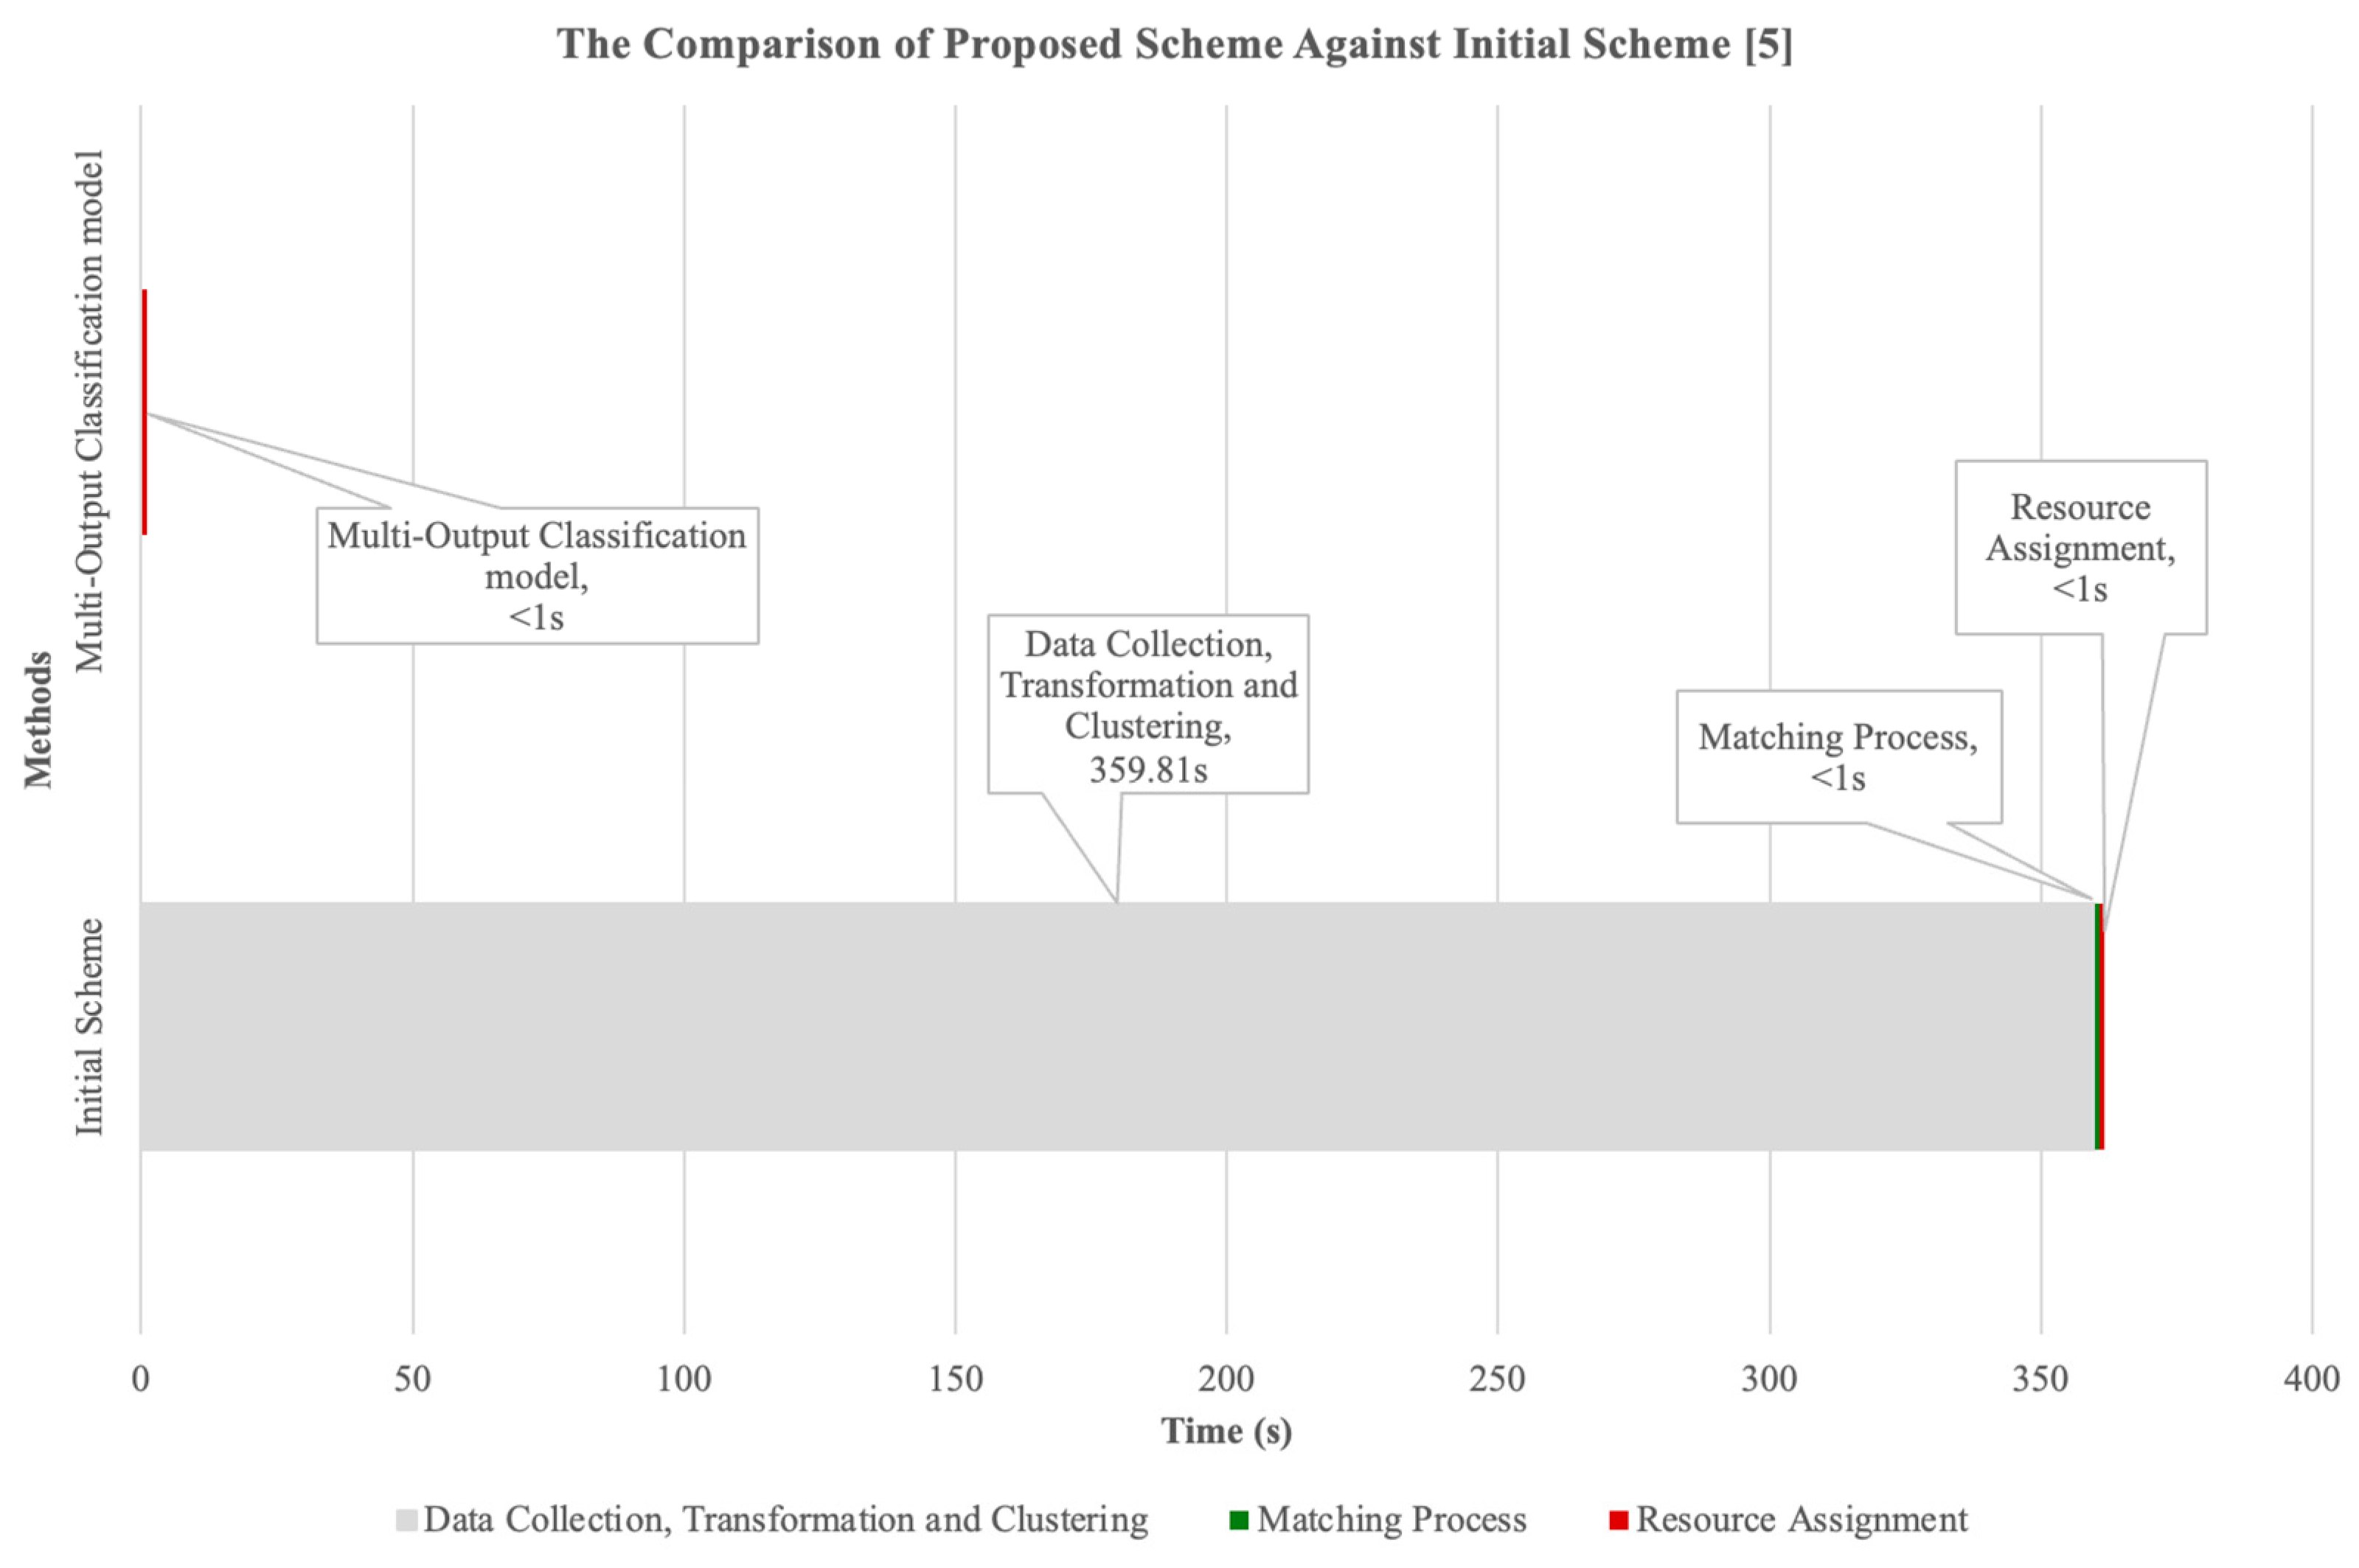
The overall process from
Figure 2 demonstrates a small task but plays a significant role in producing a feasible classification model. The data collection process begins with extensive cleansing and the transformation of raw data for subsequent machine learning use. The UE’s data produce multiple attributes that transform high-dimensional data, and hence, a dimensional reduction algorithm from unsupervised learning is required before undergoing the clustering process. A series of algorithms to process a massive volume of data, then utilizing MILP processes, requires significant handling time. Therefore, the prior processes are set to be employed offline and stored as an individual profile of a node in the area. The classification technique from supervised learning is used to learn offline data, reducing the handling time by providing instantaneous traffic labelling from steering functions.
Compared with the previous study done in [
5], the processes defined in
Figure 2 produce a base value set to represent the time taken to collect data, transform, cluster and perform the resource assignment (Steps 2 to 5), as shown in
Table 2, which is the most time needed to execute the overall processes contributed by the clustering activities.
Figure 4 illustrates the share of time required to cluster data with parameters specified in
Table 1.
5. Conclusions and Future Works
Using user traffic data for unsupervised learning and supervised learning techniques facilitates the development of feasible classification functions to achieve the optimum traffic–transport assignment. A programmed network node with the classification model shall label the traffic based on the classification output that determines the selection of transport types for the traffic. The study eventually helps to automate the selection of a path for pertinent traffic, envisioning the 6G extensive TN and NTN aspirations for optimal “service ubiquity”. Thus, the goal to enable highly efficient resource management could be realized to achieve higher performance requirements in 6G with low errors in the classification results that give more than a 90% classification accuracy score.
The study also opens an avenue to impose a classification model based on an appropriate timeslot that could determine the frequency of the provisioning of inference models to be programmed to the pertinent nodes in an area. In addition, the entire study could lead to a new opportunity where each traffic requirement in an area could be handled by specific models that are dynamically created based on local demand (traffic diversity) and capacity (bandwidth resources and the heterogeneity of transport network provision in the area).
Future studies should extend the variable from this study to determine the end-to-end flow of imposing models based on the timeslot into the programmed nodes using the O-RAN platform. The scope of this study requires the regressing steps on the models for respective timeslots to assess the performance of the classification model in a time-series format to establish the overall models’ organization. The other variable is to learn the model’s compatibility to produce and assign a highly efficient model for an area and other possible uses of the models in other areas. Lastly, there is potential for the incorporation of the organizational flow of this study in a federated learning framework. Finally, research on the workability and improvement could be harvested in the telecommunication infrastructure based on a federated learning approach.


