Article

Applied Digital Twin Concepts Contributing to Heat Transition in Building, Campus, Neighborhood, and Urban Scale

by
Ekaterina Lesnyak
1,2,*,†,
Tabea Belkot
2,†,
Johannes Hurka
3,†,
Jan Philipp Hörding
1,2,†,
Lea Kuhlmann
4,†,
Pavel Paulau
3,5,†,
Marvin Schnabel
3,5,†,
Patrik Schönfeldt
6,† and
Jan Middelberg
3
1
Faculty II—School of Computing Science, Business Administration, Economics and Law, The Carl von Ossietzky University of Oldenburg, Ammerländer Heerstraße 114-118, 26129 Oldenburg, Germany
2
OFFIS—Institute for Information Technology, Escherweg 2, 26121 Oldenburg, Germany
3
Department of Civil Engineering Geoinformation and Health Technology, Jade University of Applied Sciences Wilhelmshaven/Oldenburg/Elsfleth, Ofener Str. 16/19, 26121 Oldenburg, Germany
4
Stadt Oldenburg (Oldb), Industriestraße 1 a, 26121 Oldenburg, Germany
5
Institute for Applied Photogrammetry and Geoinformatics (IAPG), Jade University of Applied Sciences Wilhelmshaven/Oldenburg/Elsfleth, Ofener Str. 16/19, 26121 Oldenburg, Germany
6
DLR Institute of Networked Energy Systems, Carl-von-Ossietzky-Str. 15, 26129 Oldenburg, Germany
*
Author to whom correspondence should be addressed.
These authors contributed equally to this work.
Big Data Cogn. Comput. 2023, 7(3), 145; https://doi.org/10.3390/bdcc7030145
Submission received: 30 June 2023 / Revised: 14 August 2023 / Accepted: 15 August 2023 / Published: 25 August 2023
(This article belongs to the Special Issue Digital Twins for Complex Systems)

Abstract

:
The heat transition is a central pillar of the energy transition, aiming to decarbonize and improve the energy efficiency of the heat supply in both the private and industrial sectors. On the one hand, this is achieved by substituting fossil fuels with renewable energy. On the other hand, it involves reducing overall heat consumption and associated transmission and ventilation losses. In addition to refurbishment, digitalization contributes significantly. Despite substantial research on Digital Twins (DTs) for heat transition at different scales, a cross-scale perspective on heat optimization still needs to be developed. In response to this research gap, the present study examines four instances of applied DTs across various scales: building, campus, neighborhood, and urban. The study compares their objectives and conceptual frameworks while also identifying common challenges and potential synergies. The study’s findings indicate that all DT scales face similar data-related challenges, such as gathering, ownership, connectivity, and reliability. Also, hierarchical synergy is identified among the DTs, implying the need for collaboration and exchange. In response to this, the “Wärmewende” data platform, whose objectives and concepts are presented in the paper, promotes research data and knowledge exchange with internal and external stakeholders.

1. Introduction

It is crucial to limit the global temperature rise to 1.5 °C above the pre-industrial level to avert severe impacts of climate change and ensure the habitability of our planet [1]. As the 2015 Paris Agreement outlines, emissions must be reduced by 45% by 2030 and reach net zero by 2050. The energy transition plays a vital role in achieving this objective, with three pillars [2]: substituting fossil fuels, reducing consumption, and minimizing energy losses. As can be seen from Figure 1, 55 % of total final energy consumption is allocated to space heating, domestic hot water, and process heat in industry, private households, and retail, commerce, and service. Therefore, the heat transition is a crucial element of the energy turnaround and focuses on decarbonizing heat supply in residential and industrial sectors. It involves replacing fossil fuels with renewable energy sources, minimizing overall heat consumption, and reducing transmission and ventilation heat losses. Alongside building refurbishment, digitalization is a critical factor in achieving these objectives. The concept of a digital twin (DT) can assist in this regard.
While the first implementation of DT dates back to 1970 by NASA in Apollo 13 spacecraft and the first conceptualization by Grieves in 2003 [4], nowadays, it found its application in many domains. The research activities in DT are not equally distributed, with manufacturing being the predominant domain [5] due to the rapid advancements in Industry 4.0. A well-known classification of DTs by the level of integration into a digital model, digital shadow, and digital twin is given by Kritzingen [6] specifically for the manufacturing sector. Wei et al. [5] emphasize the need for a more comprehensive definition of DT that encompasses other domains. They propose a new classification system based on attributes such as connectivity, behavior, and likeness, as well as on the physical and time scale.
Nevertheless, not all practitioners and researchers adopt these proposed classifications; some prefer to tailor the definition to their specific applications [5], while others define a digital twin in a more general manner; for example, VanDerHorn and Mahadevan [7] define DT as “a digital virtual representation of a physical system […]”. However, this definition raises a question regarding why DT should replace the well-established and developed modeling concept. In response to this inquiry, Wright et al. [8] present two criteria that differentiate DT from a traditional modeling approach: “an evolving set of data relating to the object, and a means of dynamically updating or adjusting the model following the data”.
Despite the ongoing debate surrounding its definition, Digital Twins (DT) offer a potent tool for comprehending, managing, and enhancing the performance of intricate systems within a virtual environment. This capability can prove advantageous for driving a successful heat transition initiative. Given the multifaceted nature of the heat transition involving various sectors and levels, the implementation of DTs at different scales becomes essential. Within the context of the WärmewendeNorwest [9] research project, four distinct applications of DTs are devised to facilitate the transition universe sustainable heating across a building, campus, neighborhood, and urban scales. By presenting the objectives and concepts at these diverse scales, this paper creates an opportunity for comparative analysis, enabling the identification of advantages, disadvantages, challenges, and potential synergy.
The paper is structured as follows. Section 2 provides a literature review of the DTs at different scales and identifies the current research gap. Section 3 presents the objectives of DTs for heat transition on different scales. Section 4 proposes concepts of DTs able to fulfill the requirements of the given objectives and introduces the use cases under development. Section 5 discusses the challenges related to the DT implementation and limitations of the current concepts and identifies synergies between the scales, leading to the importance of the data platform for collaborative DT. Section 6 addresses the objectives and concept of a data platform that facilitates sharing research data to enable the development of the cross-scale DT for heat transition. Section 7 addresses the initial research gap and concludes the paper’s main findings.

2. Literature Review

This section presents a comprehensive literature review of Digital Twins (DTs) across various scales and leads to the identification of an existing research gap.

2.1. Building Scale DT

On the building scale, a DT can be used to simulate the thermal behavior of the building and use these properties to optimize the energy supply. Thermal behavior of the buildings encompasses roof, wall, and window surfaces with their respective thermal conductivity and heat capacities, as well as the consideration of temperatures inside and outside the building and heat sinks and sources. The modeling language Modelica [10] and the library Modelica BuildingSystems [11] provide means for the implementation of digital twins of buildings, examples of which can be found in [12,13,14].
The building DT with controllable heat sources can also provide a training environment for algorithms to optimize the control of heating and energy systems in the building. ModelicaGym [15] adds a framework for training algorithms and artificial intelligence systems. Gao et al. [16] describe the application of deep reinforcement learning on a smart building with heating, ventilation, and air conditioning (HVAC) systems. A recent overview of artificial intelligence approaches in energy self-management in smart buildings is given in [17].

2.2. Campus Scale

The optimization of energy systems in a campus setting, comprising buildings of different construction dates, diverse energy sources, and consumers, offers the potential to achieve desired objectives such as reducing the CO2 footprint and minimizing energy costs. The choice of optimization approaches depends on the maturity and complexity of the infrastructure.
First, similarly to the presented building scale, the energy system of the campus can be optimized by taking into account the thermal behavior of the buildings. Given the size of the campus, a resistor-capacitor-network (RC) model can be implemented to determine important thermal properties of the buildings, and the developed RC model can be utilized to optimize the operation of the energy system. More detailed information on resistor-capacitor-network models is provided by [18,19,20].
Second, occupant-centric optimization can be considered. Qiuchen Lu et al. [21] propose a concept of occupant-centric DT at the Cambridge campus, which focuses on optimizing the energy system based on an individual’s room temperature, humidity, motion detectors, light meters, and carbon monoxide meters. Furthermore, Zaballos et al. [22] proposed, additionally to the thermal comfort and air quality, to include in the optimization of campus such parameters as acoustic comfort and visual comfort. Kong et al. [23] conducted an experimental study to evaluate occupant-centric control for thermal comfort and air quality in commercial buildings. The results demonstrated that occupant-centric control achieved an 80% satisfaction ratio and yielded an average of 20% in energy savings.
Third, energy-centric optimization is another viable approach. A comprehensive overview of the energy management system for the campus microgrid, focusing on optimization techniques, objective functions, and modeling techniques, is presented in [24]. Although this paper primarily addresses the electrical counterpart of the campus microgrids, the same approaches and techniques can be applied to multi-energy microgrids to support sector coupling, which is fundamental for the transition universe sustainable heating systems. Additionally, Lohmeier et al. [25] provide an overview of multi-energy modeling and simulation tools.
In the following sections, we focus on the energy-centric optimization approach for the campus scale.

2.3. Urban Scale

According to Ferré-Bigorra et al. [26], the development of DTs as a digital tool for urban management started around 2018. Modeling of cities, on the other hand, has a long tradition [27].
The foundation of the urban digital twin is often defined by a 3D model. However, Bauer et al. [28] use a conceptual approach. They define urban DTs based on their purpose: data management, reaction, prediction, and forecast (“what if”). In that sense, urban DTs facilitate planning and city resilience, independent from their visual representation. Following a similar view, Tomin et al. [29] as well as Srinivasan et al. [30] even describe a black-box model created using machine learning as a digital twin.
To create an urban DT, several characteristics of cities must be included in the digital model. The characteristics of the specific urban digital twin depend on the use case. e.g., an urban DT can include information about subsystems like sewage network, mobility, electrical supply, heat supply, or water supply [26]. According to Deren et al. [31], urban DT found its application in smart cities for public epidemic services, and, flood monitoring and situation services. Ivanov et al. [32] provide a definition and an architecture of the platform, which hosts nested DT of the city, providing an advantage of cooperation between urban DTs developed for various purposes in their corresponding domains. Bauer et al. [28] formulate a process to extract information from heterogeneous data sources for a digital twin data model. An example of an urban DT with a 3D model is presented by Schrotter et al. [33]. They present an urban DT of Zurich, which is based on a 3D model, including the infrastructure for the electrical supply. Another example is a 3D model of Helsinki presented by [34].
Urban DTs provide several benefits,, e.g., easy use of data for citizens or strategic planning [26]. While an approach purely driven by energy measurement data (using machine learning) might serve the purpose of real-time energy management, this kind of DT is unsuitable for planning the improvement of building stock [35].

2.4. Research Gap

While a substantial amount of research has been conducted on DTs at different scales in various publications, only a limited portion of the literature addresses the application of DTs specifically in the heating domain. Furthermore, there needs to be more research exploring the cross-scale collaboration of DTs in the context of heat transition initiatives, which this paper aims to address.

3. Objectives of the DTs for Heat Transition

This section delineates the goals and prerequisites of DTs across various scales, from individual buildings to entire urban areas, intending to advance the transition to sustainable heating.

3.1. Building Scale

On the scale of individual buildings with live sensor data and digitally controllable building system technology, such as heat pumps, thermostatic valves, or ventilation systems, our main objective is to develop control strategies for optimizing energy efficiency while maintaining healthy and acceptable living conditions. Even between buildings of the same size and purpose, many differences exist regarding age and overall quality, room divisions and layout, construction materials, window area, orientation, etc. Also, technical building equipment and automation systems can vary greatly. Therefore, the control strategies to be developed have to be adaptive and must be able to work within different buildings and with different technologies.
In order to develop and test these algorithms, we will be using digital twins of buildings that can simulate the thermal behavior and the effects of HVAC systems and which allow for variations in all of the properties mentioned above. Nevertheless, initially, these DTs will be modeled on three selected representative buildings at the Oldenburg campus of the Jade University of Applied Sciences:
  • a new building with wooden walls, cellulose insulation, and triple glazing. Active ventilation and shading, PV-powered heat pump with heat storage tanks;
  • a 30-year-old building recently insulated. Bivalent usage of gas heating and heat pump;
  • a passively heated additional store to an even older building.
The knowledge about the physical properties of these buildings and the extensive amount of available sensor data on temperature, humidity, air quality, and the actual state of each of the technical systems makes it possible to compare the digital twins with the actual buildings to fine-tune the model.
In the following, we will mainly focus on objectives regarding the new building.
The first objective is to develop and test control strategies for PV-powered heat pumps and heat storage tanks. Different starting conditions, such as indoor and outdoor temperatures and demand profiles, directly and indirectly, influence the optimal operating schedule. The digital twin can be run multiple times with different control strategies for a given set of parameters, and the outcomes can be analyzed and compared. This objective will be covered in greater detail in Section 4.1 and was already investigated in [36].
The second objective is to optimize the operation of ventilation systems based on occupancy and demand, as well as the bivalent operation of natural gas heating and heat pump heating. In this case, the optimum can be defined as minimal energy consumption (which might favor gas heating when outside temperatures are low), minimal fossil resource consumption, or minimal total operational cost.
Since the thermal simulation of a building can be implemented in various levels of detail, a third objective for the digital twin of a given building is to compare these different models. Furthermore, by using actual sensor data as initial conditions and running the simulation for a defined time, we can validate the results against historical data. Thus, future decisions about the necessary level of detail can be supported.
In order to achieve the given objectives, these requirements have to be fulfilled:
  • Building properties are modeled (room volumes, wall and window areas, thermal properties of components);
  • Active systems such as heat pump and ventilation are modeled and controllable;
  • Sensor data are structured and organized for real-time and historical access;
  • Training environment is set up and can be connected to data streams.
Furthermore, the resulting digital twins can also be used to simulate specific situations with manually tweaked input conditions for educational purposes. This will allow for what-if scenarios like heating with open doors, replacing walls or window panes with better components, or gathering a crowd of people in a small space. In combination with virtual or artificial reality equipment and a digital 3D model of the building, training units can be devised for students, professionals, or the general public to visualize the effects of the simulated what-if scenarios.

3.2. Campus Scale

The campus scale DT has three primary objectives: enhance energy system operation and maintenance, and facilitate the proof of concept for new sustainable solutions.
The first objective focuses on improving the system’s operation, which entails reducing its CO2 footprint, enhancing overall efficiency, and minimizing operating costs. The heating, cooling, and electricity networks must be integrated into a unified multi-energy environment to accomplish this objective. Subsequently, DT should be capable of analyzing the flexibility of all network appliances in real-time, enabling optimization of their operation to achieve both efficient device performance and effective load management.
The second objective involves implementing predictive maintenance practices, which help extend the assets’ lifespan by proactively identifying maintenance needs and minimizing unexpected failures.
Finally, the DT serves as a foundation for conducting proof of concept for new sustainable solutions. This feature enables testing and validating the viability and functionality of innovative devices within the system in the design phase.

3.3. Connected Neighborhoods Scale

This urban DT aims to identify energy (esp. heat) supply options for a communal transition strategy to renewable energies. According to the definition in Section 2.3, it can be seen as a (long-term) forecast in the sense of the investigation of numerous what-if scenarios. The objective includes several sub-objectives, first quantifying the potential for energetic renovation. This question needs to be combined with possible load balancing between neighborhoods and optimized operational schemes. The latter two points call for information with a sufficiently high time resolution.
The identified supply options, including possible operational strategies, are optimized for multiple objectives, e.g., costs and resilience. For the latter, several scenarios for the boundary conditions are created, allowing to identify the possibility of the energy system to react to possible future changes.
Once identified, the different supply options will serve as a basis for early decisions and a detailed planning process. To allow the application of the method without having to create a hand-tailored digital twin for every possible municipality, the aim is to create a (semi-) automated process based on data that is (typically) easy to obtain or, preferably, publicly available.

3.4. Urban Scale

Corresponding to the above-mentioned urge for action regarding the heating sector, the federal state parliament of Lower Saxony has passed a law that requires that cities of a certain size develop and publish a heat transition strategy by the end of 2026 [37]. That process includes five specific measures derived from the strategy and the communication with involved stakeholders, such as local energy suppliers and/or grid operators, housing companies, local politicians, and private building owners [38]. The legal obligation and the envisaged challenges make it necessary to bring together the topics of energy/heat planning, digitalization, and urban development in one single tool or application. In public administration, these topics have traditionally been treated separately (or have not yet been implemented). This unification of domains will empower municipalities to derive that one city-wide heat transition strategy. The tool required for this should serve as a planning tool allowing a municipal draft planning and deriving and marking down reasonable energetic quarters/neighborhoods for further investigation. Additionally, the tool should also be usable as an information and communication tool for municipalities to address citizens and stakeholders. Individuals can orient themselves and align their investment decisions from the publicly offered and described city-wide development path toward a fossil-free heating sector. Overall, the tool should lead all stakeholders universe reasonable and coordinated investment decisions in order to avoid climate-harming path dependencies [38].
Developing and implementing an urban DT, described in Section 4.4, is a possible approach to meet the described demands. Since municipalities often lack specialists, they have to rely on products and services from the private sector. Hence another objective associated with urban DT in the context of the WärmewendeNordwest project is to scientifically assess the quality of urban DTs for the purpose of municipal heat planning by building and refining exemplary urban DTs, to derive quality criteria and standards for urban DTs for the purpose of municipal heat planning.

4. Concepts of the DTs for Heat Transition

Aligned with the objectives outlined in Section 3, this chapter introduces the use cases and presents the conceptual framework behind the ongoing development of the DTs.

4.1. Building Scale

Of the objectives shown in Section 3.1, we will exemplarily focus here on developing a control strategy for the optimal operation of a photovoltaic-driven (PV) heat pump/heat storage combination. The digital twin concept presented for this task can be utilized for other objectives as well as for modeling the other buildings and active components like ventilation systems.
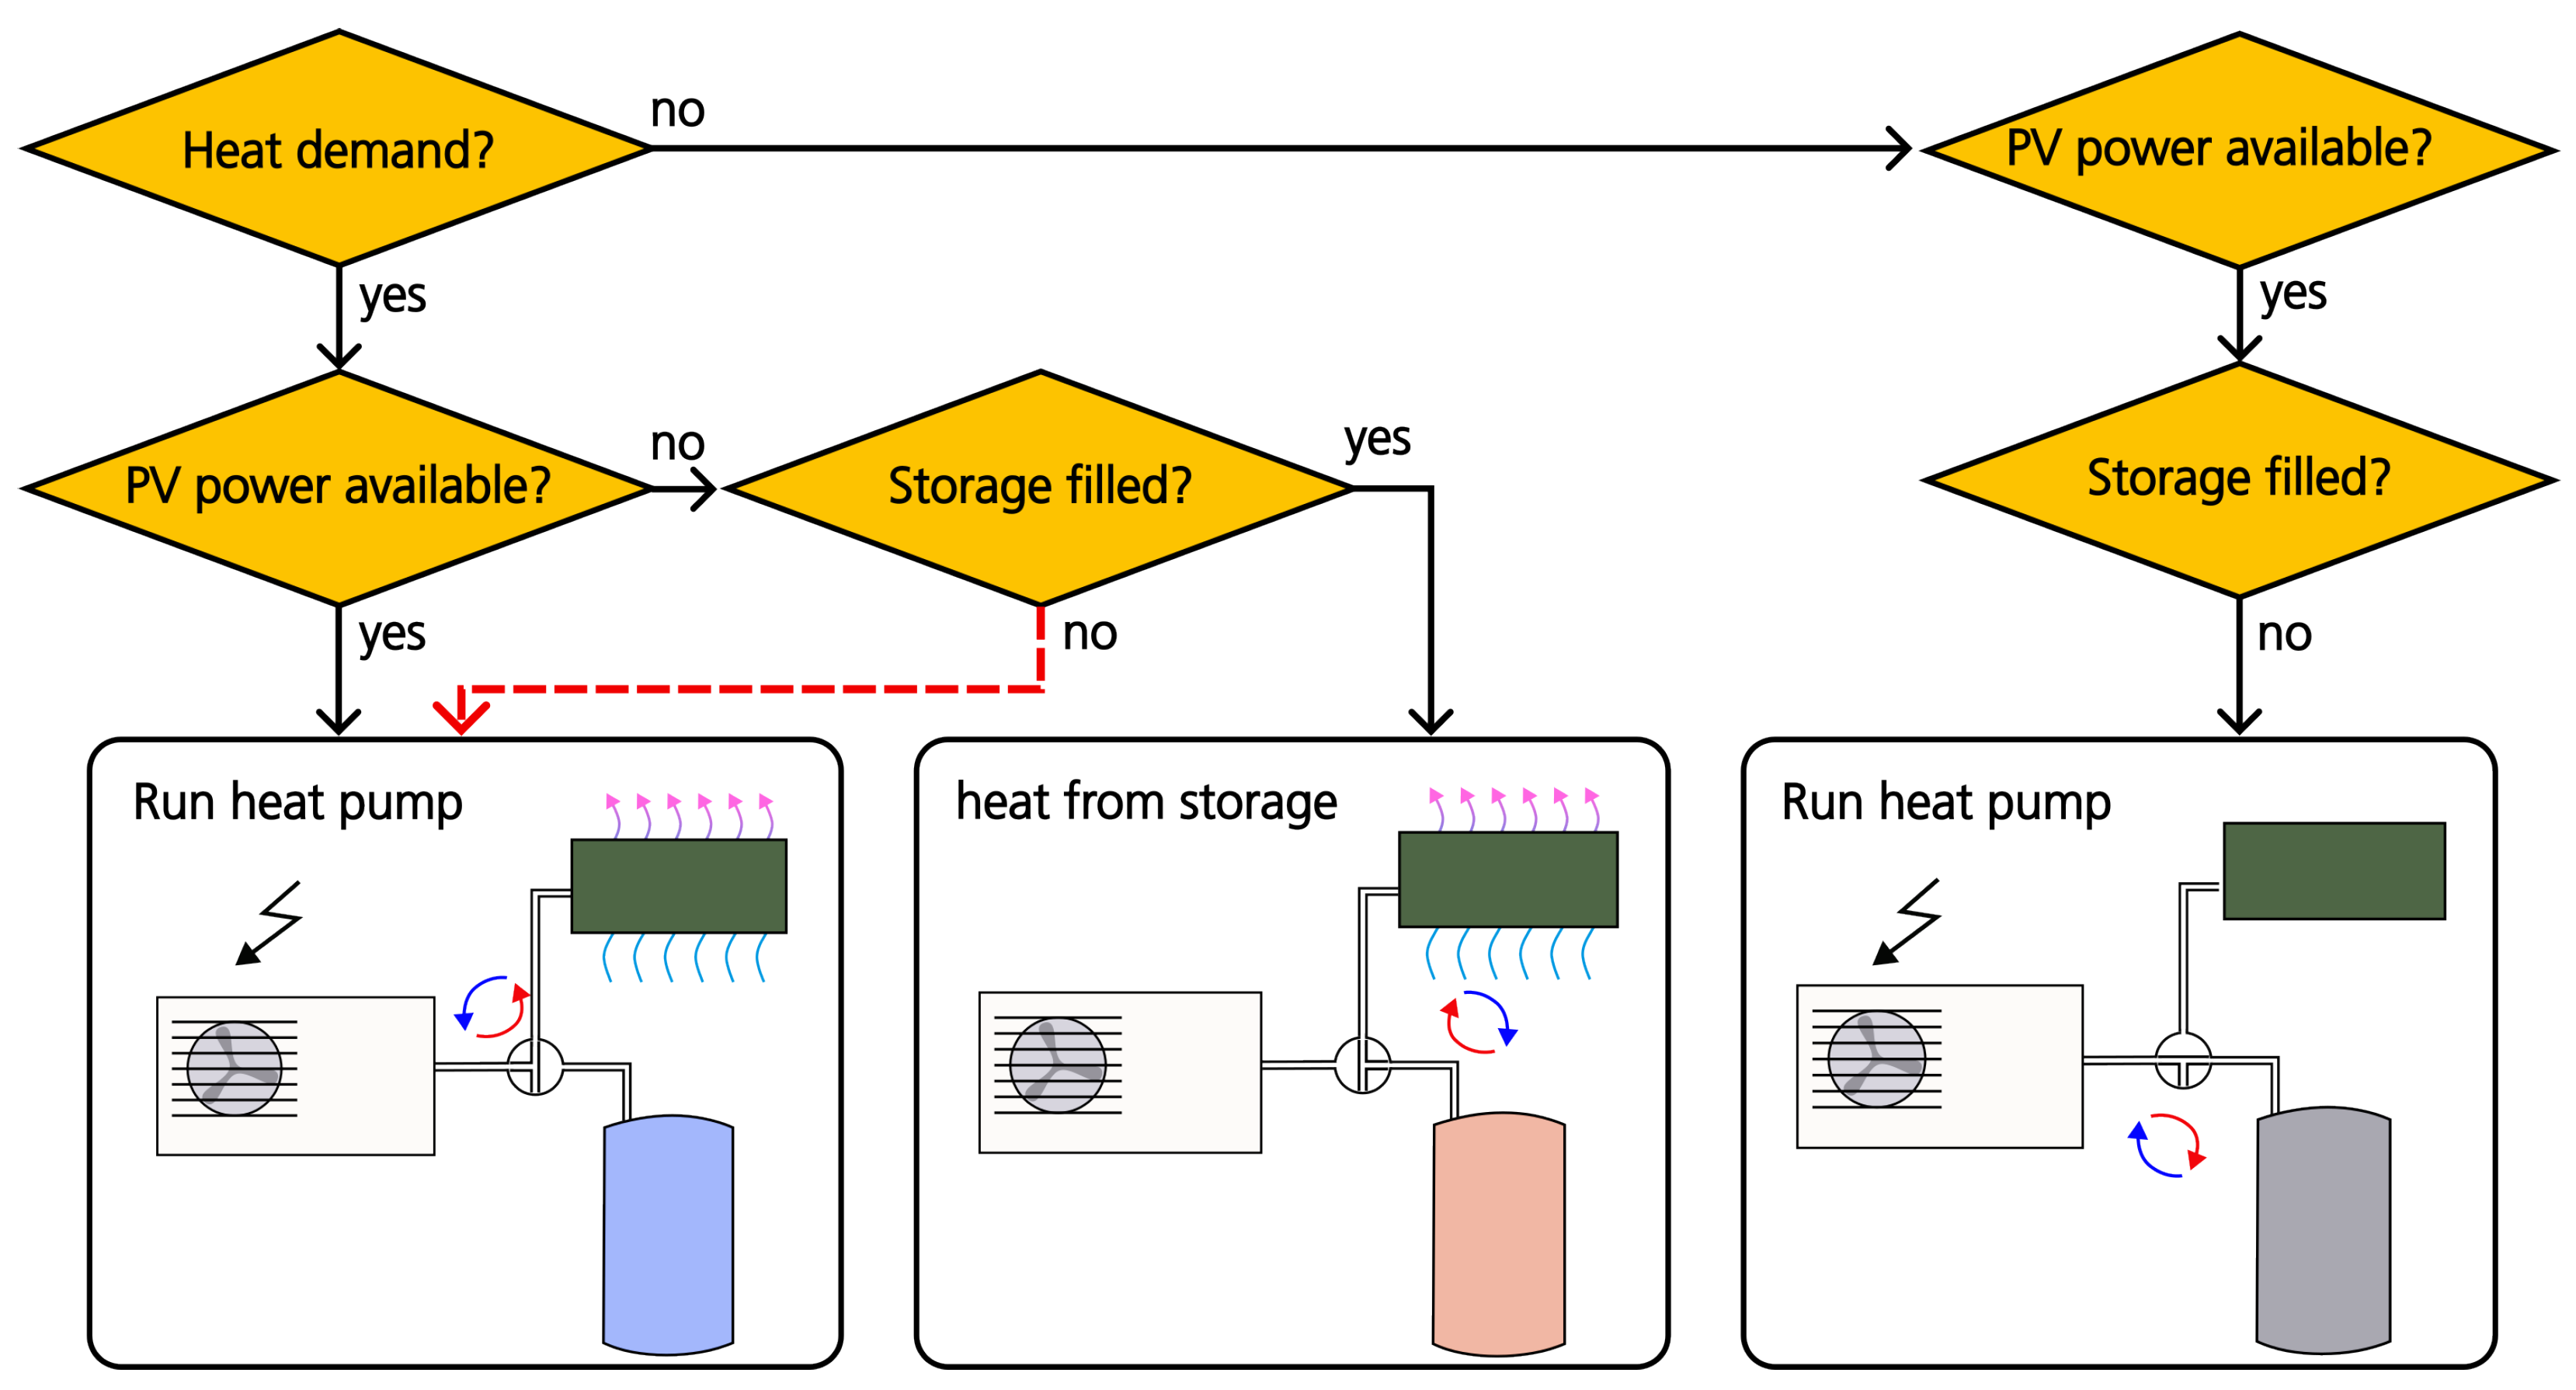
A flow chart of a simplified version of the example objective is shown in Figure 2. Depending on heat demand and availability of solar energy and stored heat, the heating system can be in one of four modes:
  • Heat pump is active to drive convector;
  • Stored heat drives convector;
  • Heat pump is active to fill storage;
  • System is inactive (not shown in the figure).
Since, in reality, the input conditions are much more differentiated than shown in the flow chart, a control strategy that reduces the need for grid electricity to a minimum has to operate on a multi-dimensional continuum of input parameters. Therefore, testing and comparing different control strategies on the building itself is not feasible. Instead, a digital twin will be used, which simulates the indoor temperature, storage temperature, and power consumption of the heat pump over a given period while allowing the control strategy under test to switch between the four states of the heating system model, which is part of the digital twin.
A proposed DT concept for this task is sketched in Figure 3. While the formulation of the digital twin itself requires specific data about the building and the heating system, each simulation run also needs initial conditions as well as externally imposed dynamics of system parameters (outdoor temperature and photovoltaic power). These inputs can consist of previously tailored data (for example, to account for extreme situations) or of genuine sensor data gathered inside and outside the building. In the latter case, the output data of the simulation runs can be analyzed in direct comparison to the buildings’ actual behavior.
This DT concept covers only a minor fraction of the possible influences and dependencies. For more realistic results, additional data have to be included. For example, PV power availability might correlate with solar heating through windows (depending on the building geometry, time of year, and time of day). Furthermore, short-term forecasts of PV power and outdoor temperature should provide possibilities for even more efficient control strategies and knowledge about future heat demands.

4.2. Campus Scale

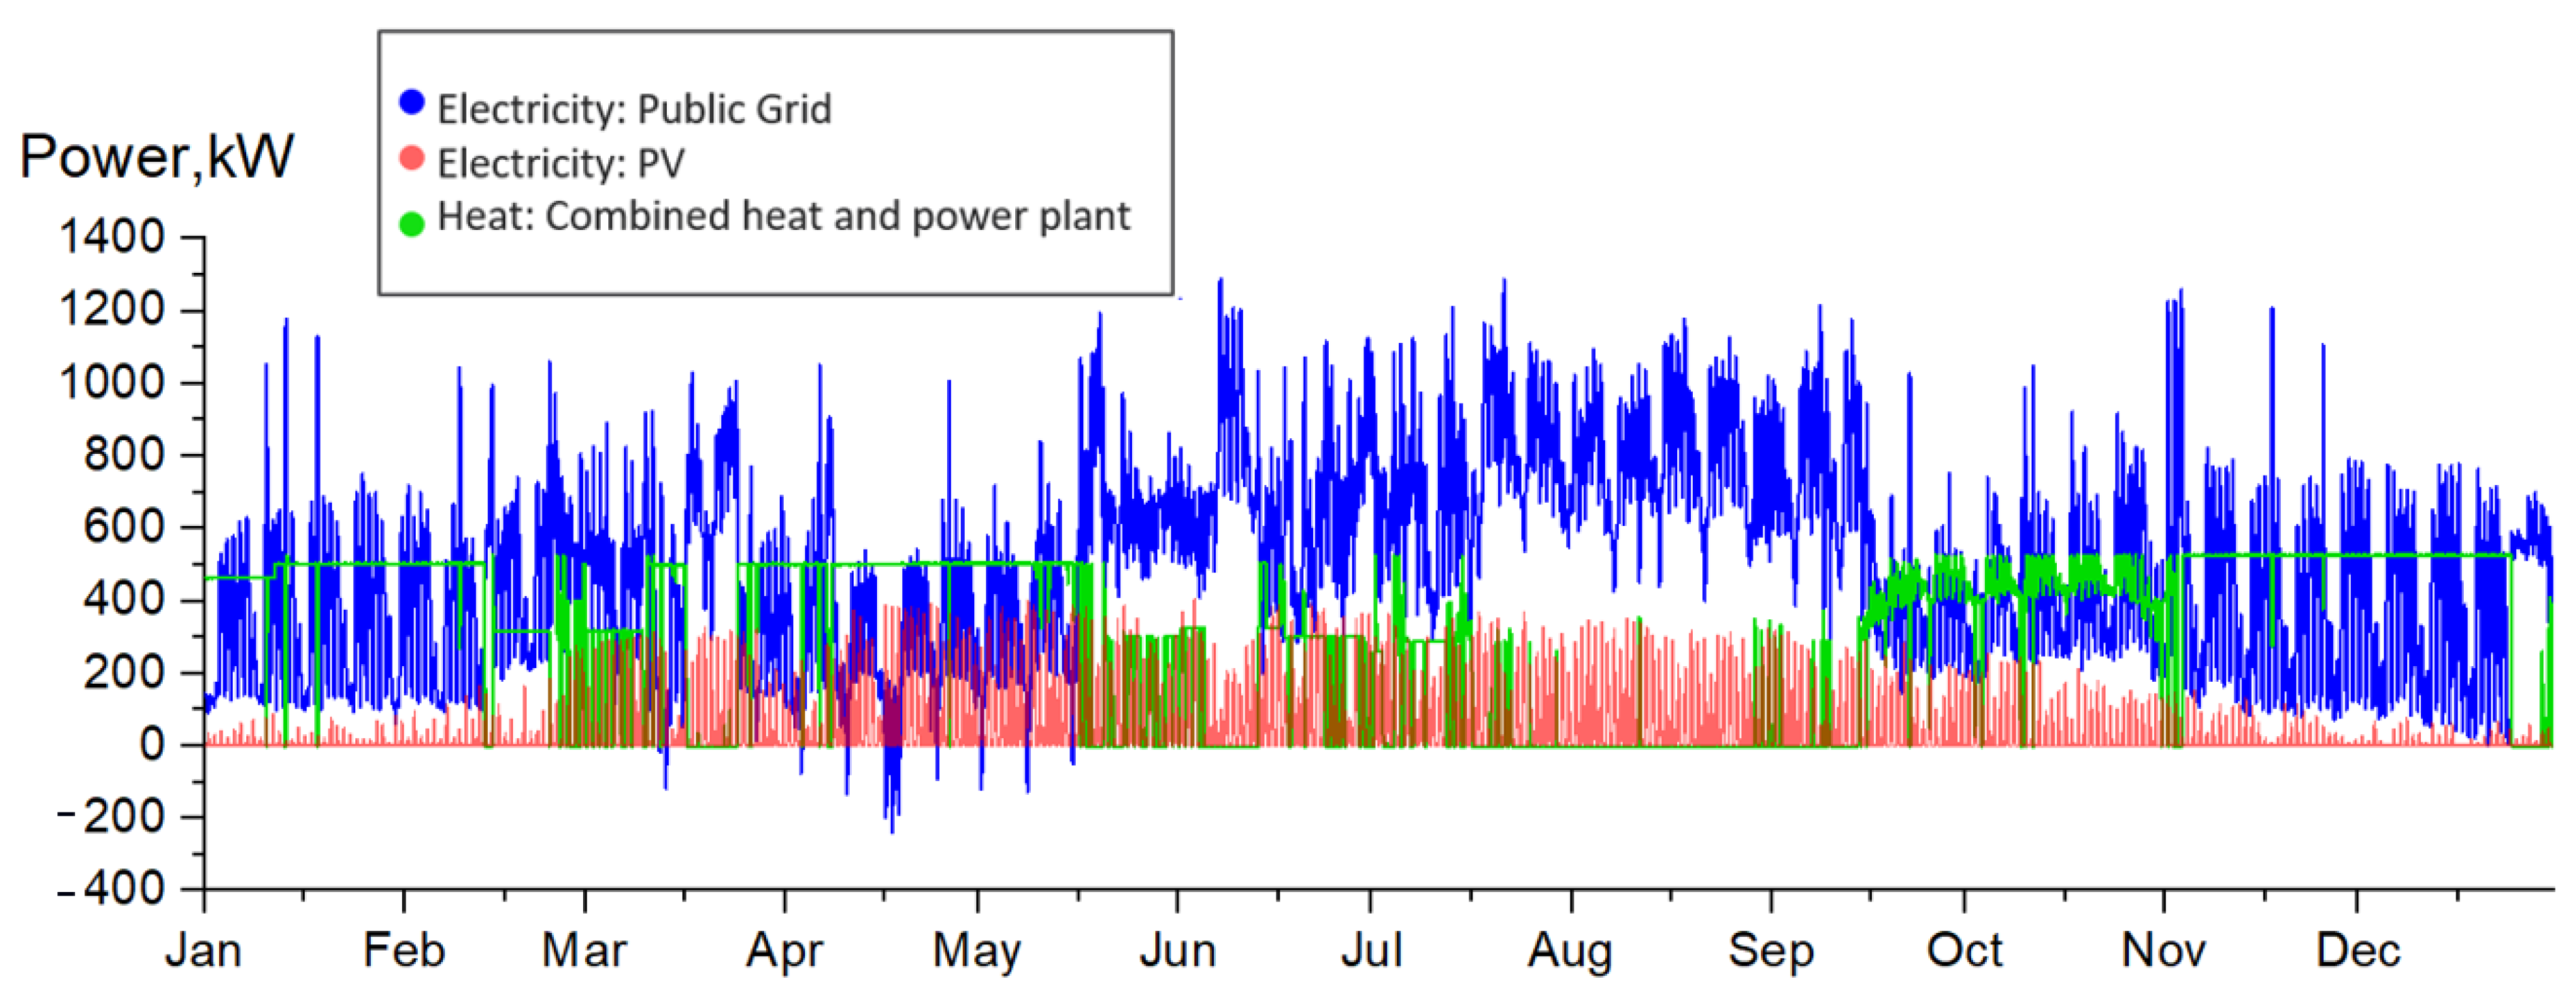
The University of Oldenburg (UOL) serves as a practical example for implementing a campus-scale DT. As shown in Figure 4, the campus of the UOL has an enormous heating, cooling, and electrical demand, which offers a variety of options for control optimization and sector coupling.
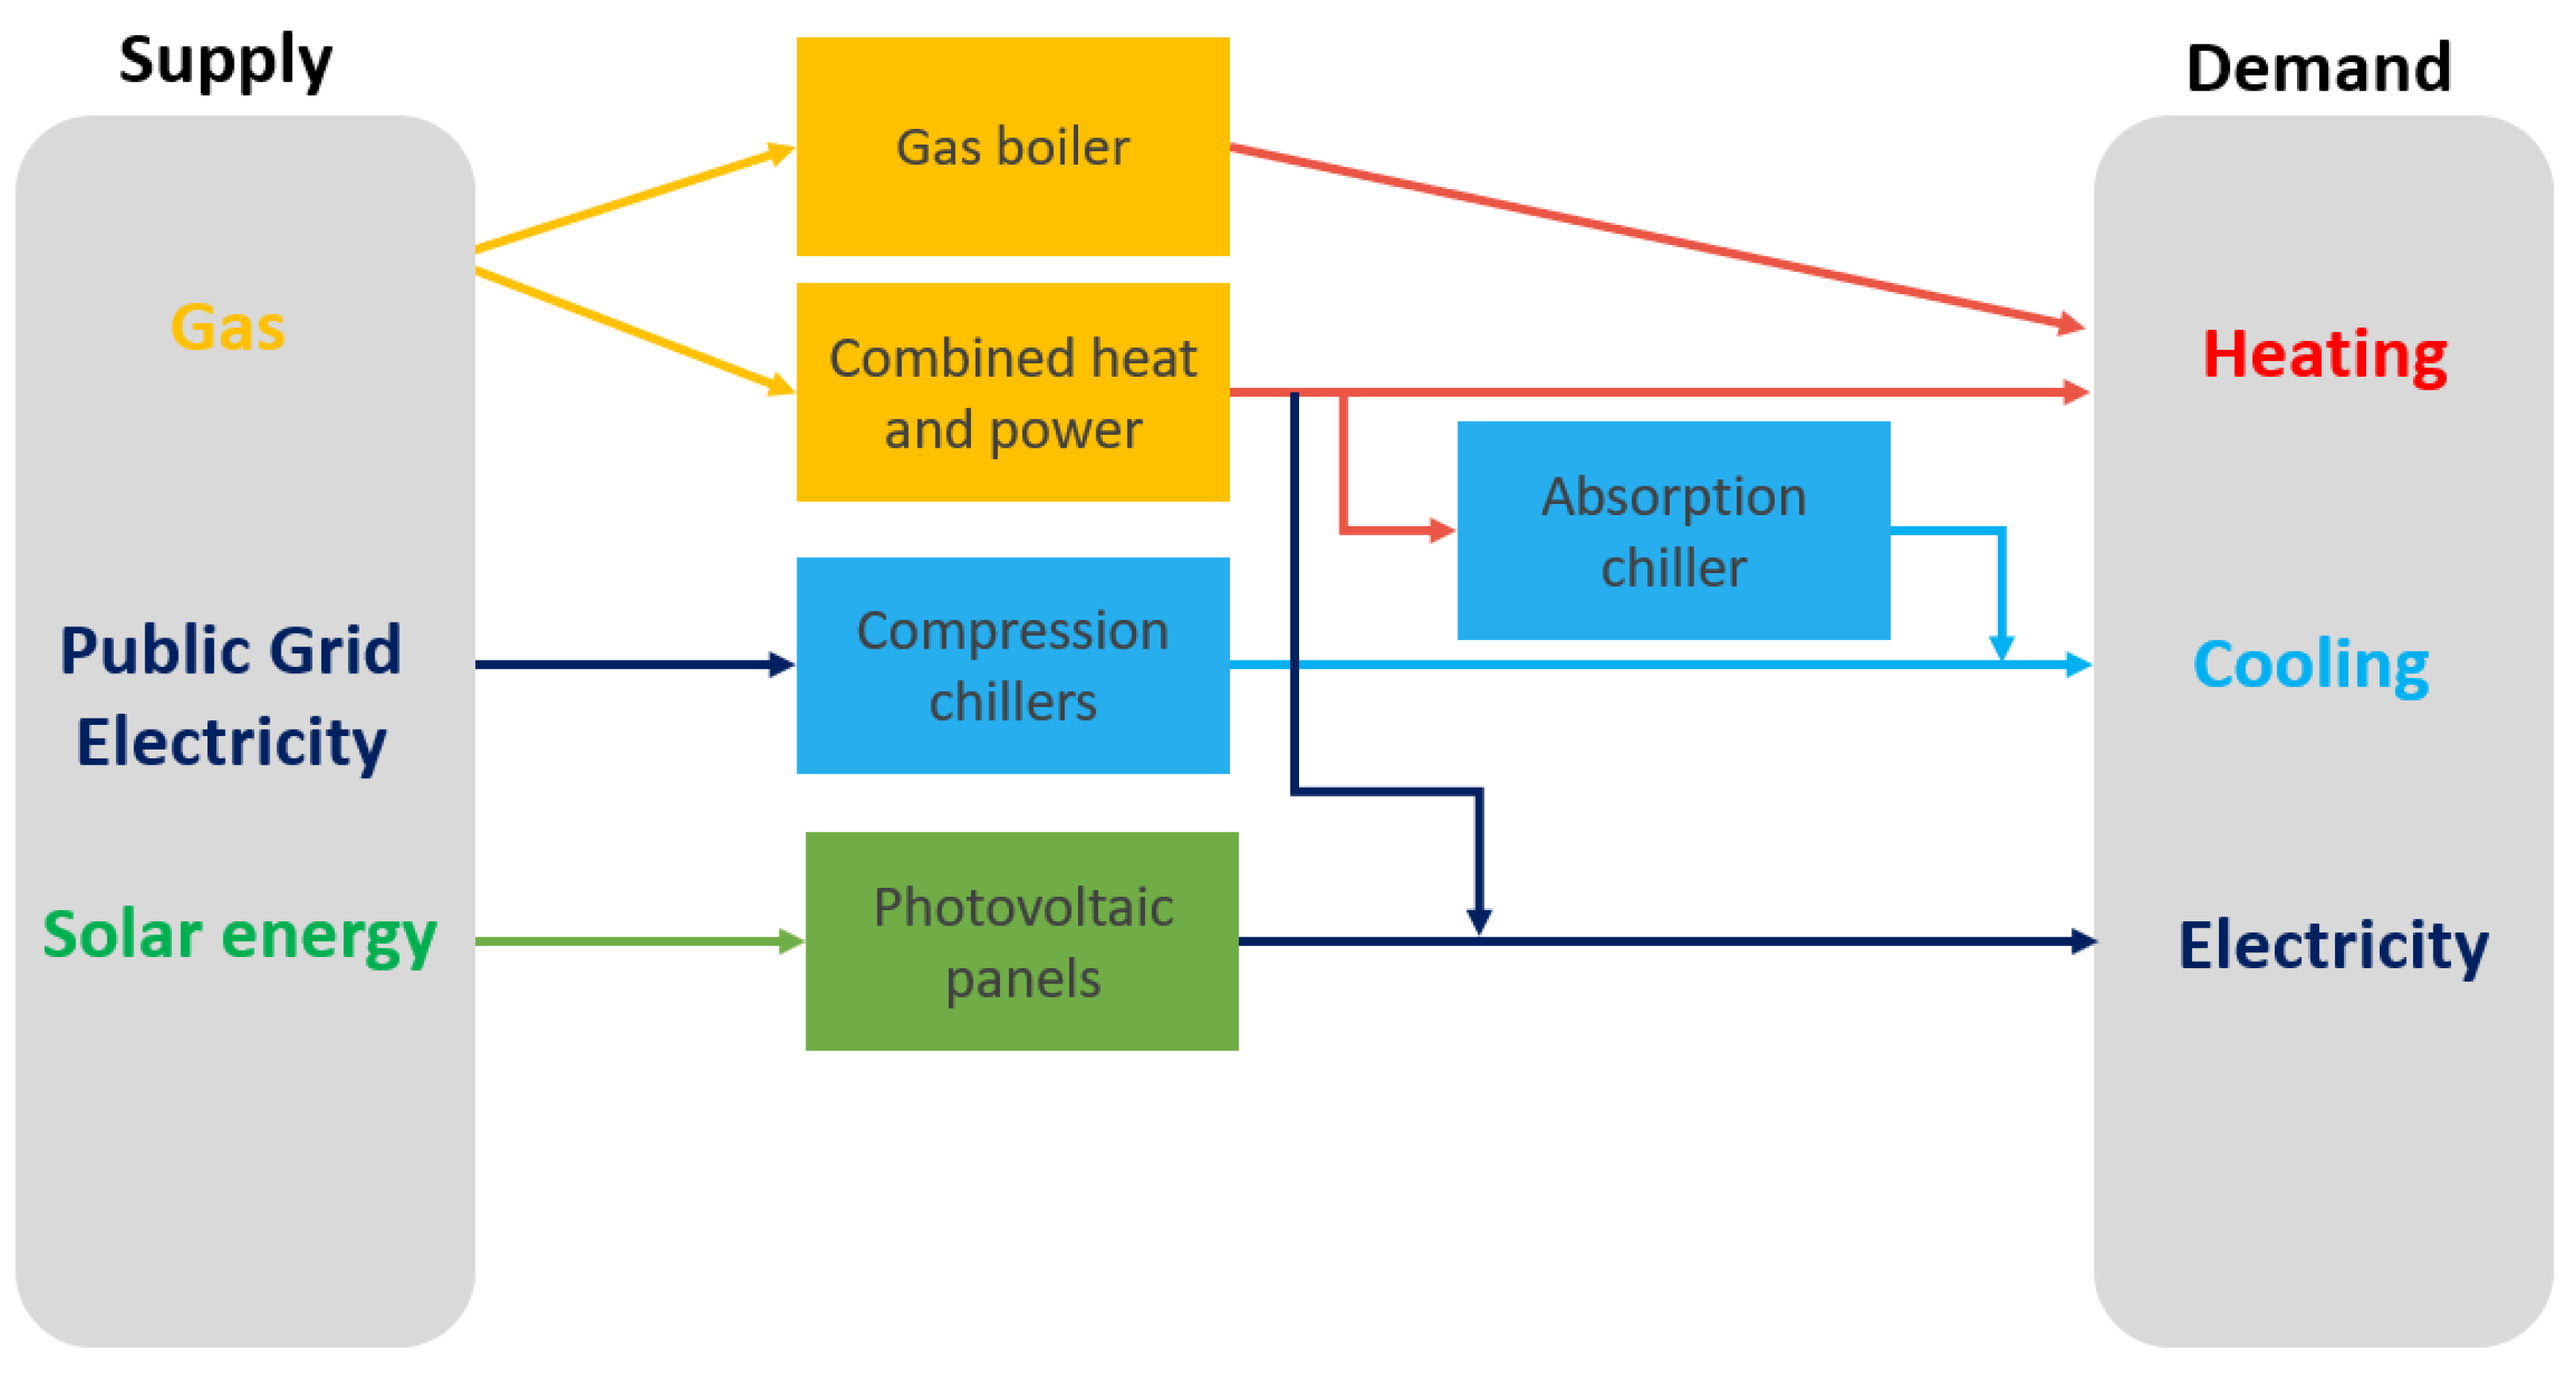
In this paper, the concept of DT is applied to model large-scale heating and cooling plants, as depicted in Figure 5. Hierarchical DT recreates the interactions between the cooling and heating networks (along with their individual plants), which were previously treated and controlled as separate entities. The goal is to enhance the understanding of the integrated system by utilizing a modeling and simulation environment that fosters a comprehensive approach.
For this purpose, the plants’ DTs are created, representing the real plants with their essential components and corresponding physical attributes. The properties of the plants’ DTs can be altered without much effort. Such configuration could ease the update of the component DTs, for example, adding new appliances, terminating the existing ones, or expanding the capacities. In addition to the plants, models of cooling and heating networks are also duplicated as DTs. The individual models of the system components and the network are integrated into a multi-energy system model consisting of hierarchical nested DTs with an assistance of a co-simulation environment.
The following briefly presents the development stages for the campus scale DT concept.
The first step is to read out measured values from the physical twins via building management software. This data compromises the operating status and the used parameters. This step provides a wide range of sensor data depending on the system. The available sensor data can also vary slightly in the level of detail. The University of Oldenburg has around 600 electrical and 50 thermal sensors. Historical values are also available for a given period.
Second, each DT is now proposed as a digital model of a physical device within the energy network of the campus. It indicates a copy of the actual device with an information flow from the hardware device to the DT. With this software model, which is supplemented by data from the physical twin, the unit can be reproduced with a certain degree of abstraction. Each digital twin is used for simulating and testing different control and operating scenarios. As mentioned before, the available data varies slightly in accuracy and timestep, so it is essential to have a simulation environment that can use models and simulators of different types and preciseness. This feature leads to the purpose of implementation of a co-simulation framework.
Now—in the third step—different DTs represent different campus facilities. These different digital twin models are now coupled within a network. This network includes a cooling and heating network and energy supplies in the form of electricity and gas from outside. For the network, a DT representation simulates the geographical conditions. Connections are modeled in terms of pipeline material, shape, and length.
The fourth step is to combine all the DTs and the net into a composite twin, which is performed with the help of a co-simulation environment [39]. The co-simulation allows the coupling of different subsystems into an overall energetic simulation. All the simulations themselves are performed in a distributed way. During the simulation, all the different models exchange their data over the co-simulation framework. Therefore, it is possible to merge the different representations of plants and networks into one simulation [40].
The DTs are used for tests in the simulated environment. They are not used for controlling the system itself, as this is performed with the help of distributed, agent-based approaches in a subsequent step. However, as a part of the simulation with easily changeable parameters, DTs are a valuable part of the simulation. With the help of this simulation, digital operation management strategies can be implemented in a further step for the intelligent control of the components in an overall network. Also, to analyze the developed simulated controllers and provide recommendations.
Along with optimizing the system control, predictive maintenance is another advantage of a DT of an energy system. On the one hand, devices could be operated at the desired conditions to prolong their lifespan and maximize reliability. While all the devices offer flexibility in their operation, it is expected that only certain operating conditions are desirable for minimizing the aging effect. These conditions can be taken into account by a system controller. On the other hand, rather than adhering to strictly fixed preventative maintenance schedules for the appliances, a more practical approach would be to schedule maintenance based on actual operating hours, operating temperature, and partial load operation. This data-driven maintenance approach allows for more accurate and efficient maintenance planning.
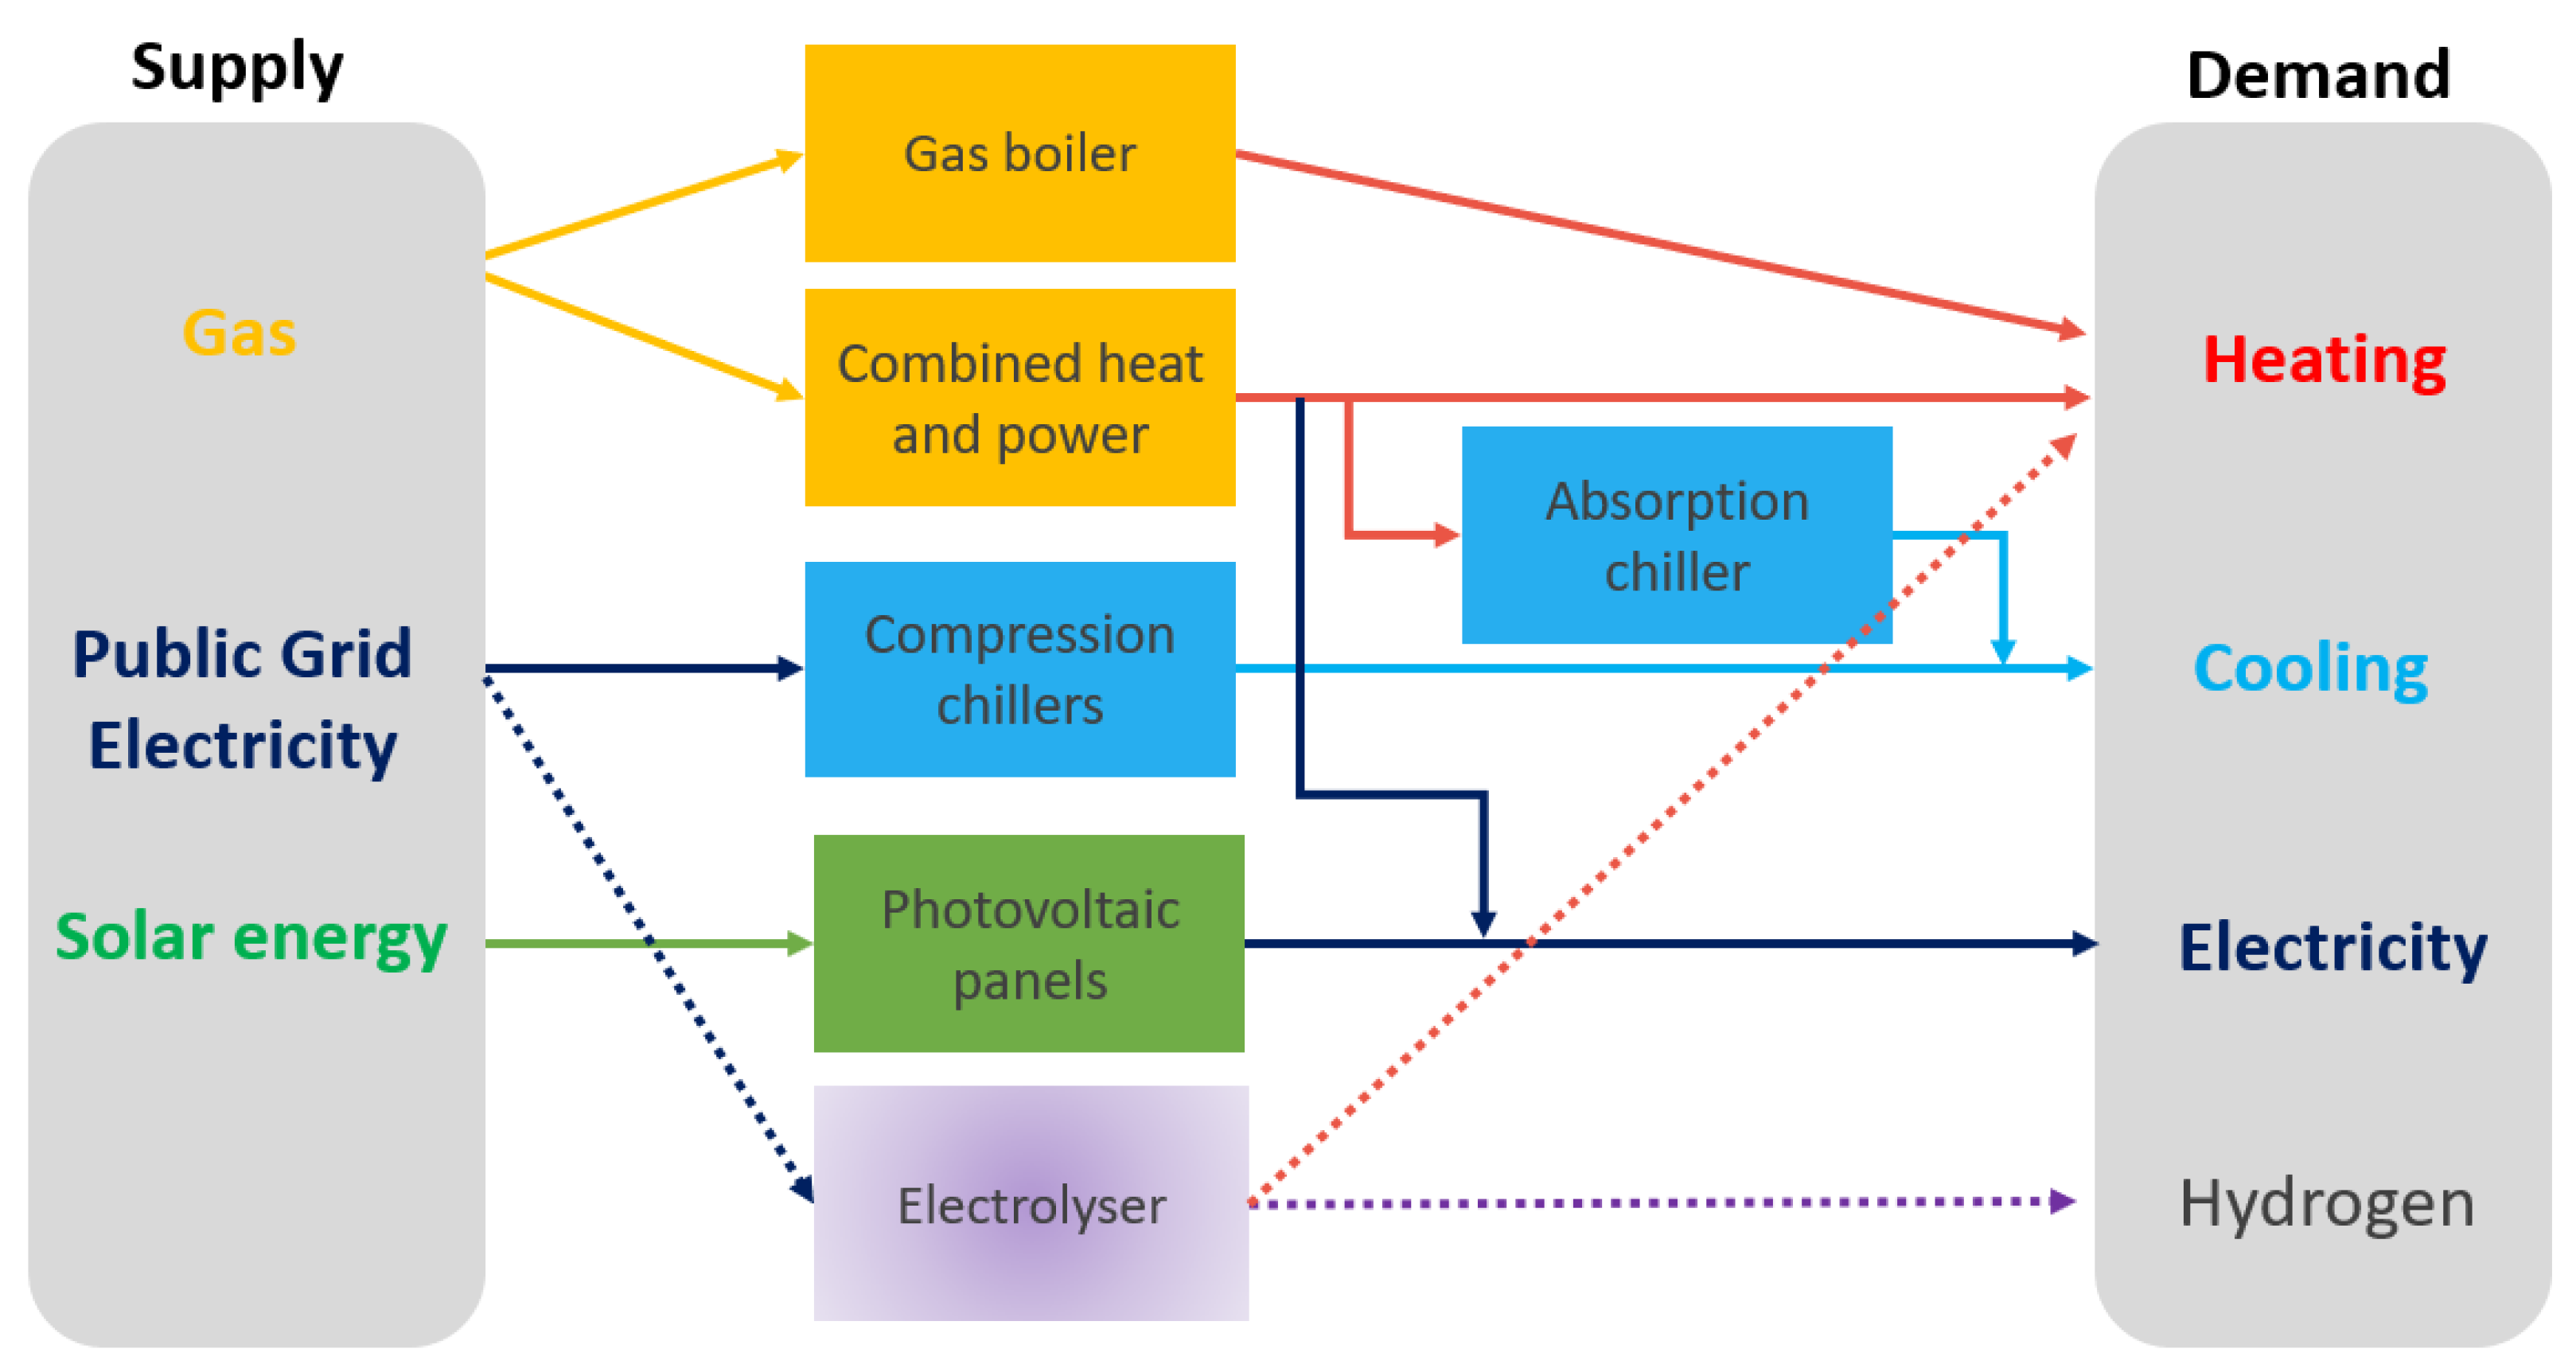
Another added value of the developed DT is that it can serve as a basis for validating the feasibility of integrating new sustainable solutions on the campus energy system, for example, sector-coupling appliances. As depicted in Figure 6, the water electrolyzer generates hydrogen while emitting a substantial amount of waste heat, which could be a valuable energy source for meeting the campus’s heating requirements. By leveraging the digital replica of the campus and historical operational data, we can establish a proof of concept for the water electrolyzer in the campus area, addressing crucial technical and economic inquiries.

4.3. Connected Neighborhoods Scale

A core function of an energy supply system is to balance energy demand and supply. Due to the stochastic nature of both energy demand and the production of renewable energy, this task becomes easier if different locations are interconnected. Balancing is of particular interest if (nearby) areas show differences. Note that optimizing what-if scenarios of a detailed DT takes computational time, so spatial aggregation [41] is applied. With reduced spatial resolution, also the requirements for temporal resolution is decreased as stochastic effects average out.
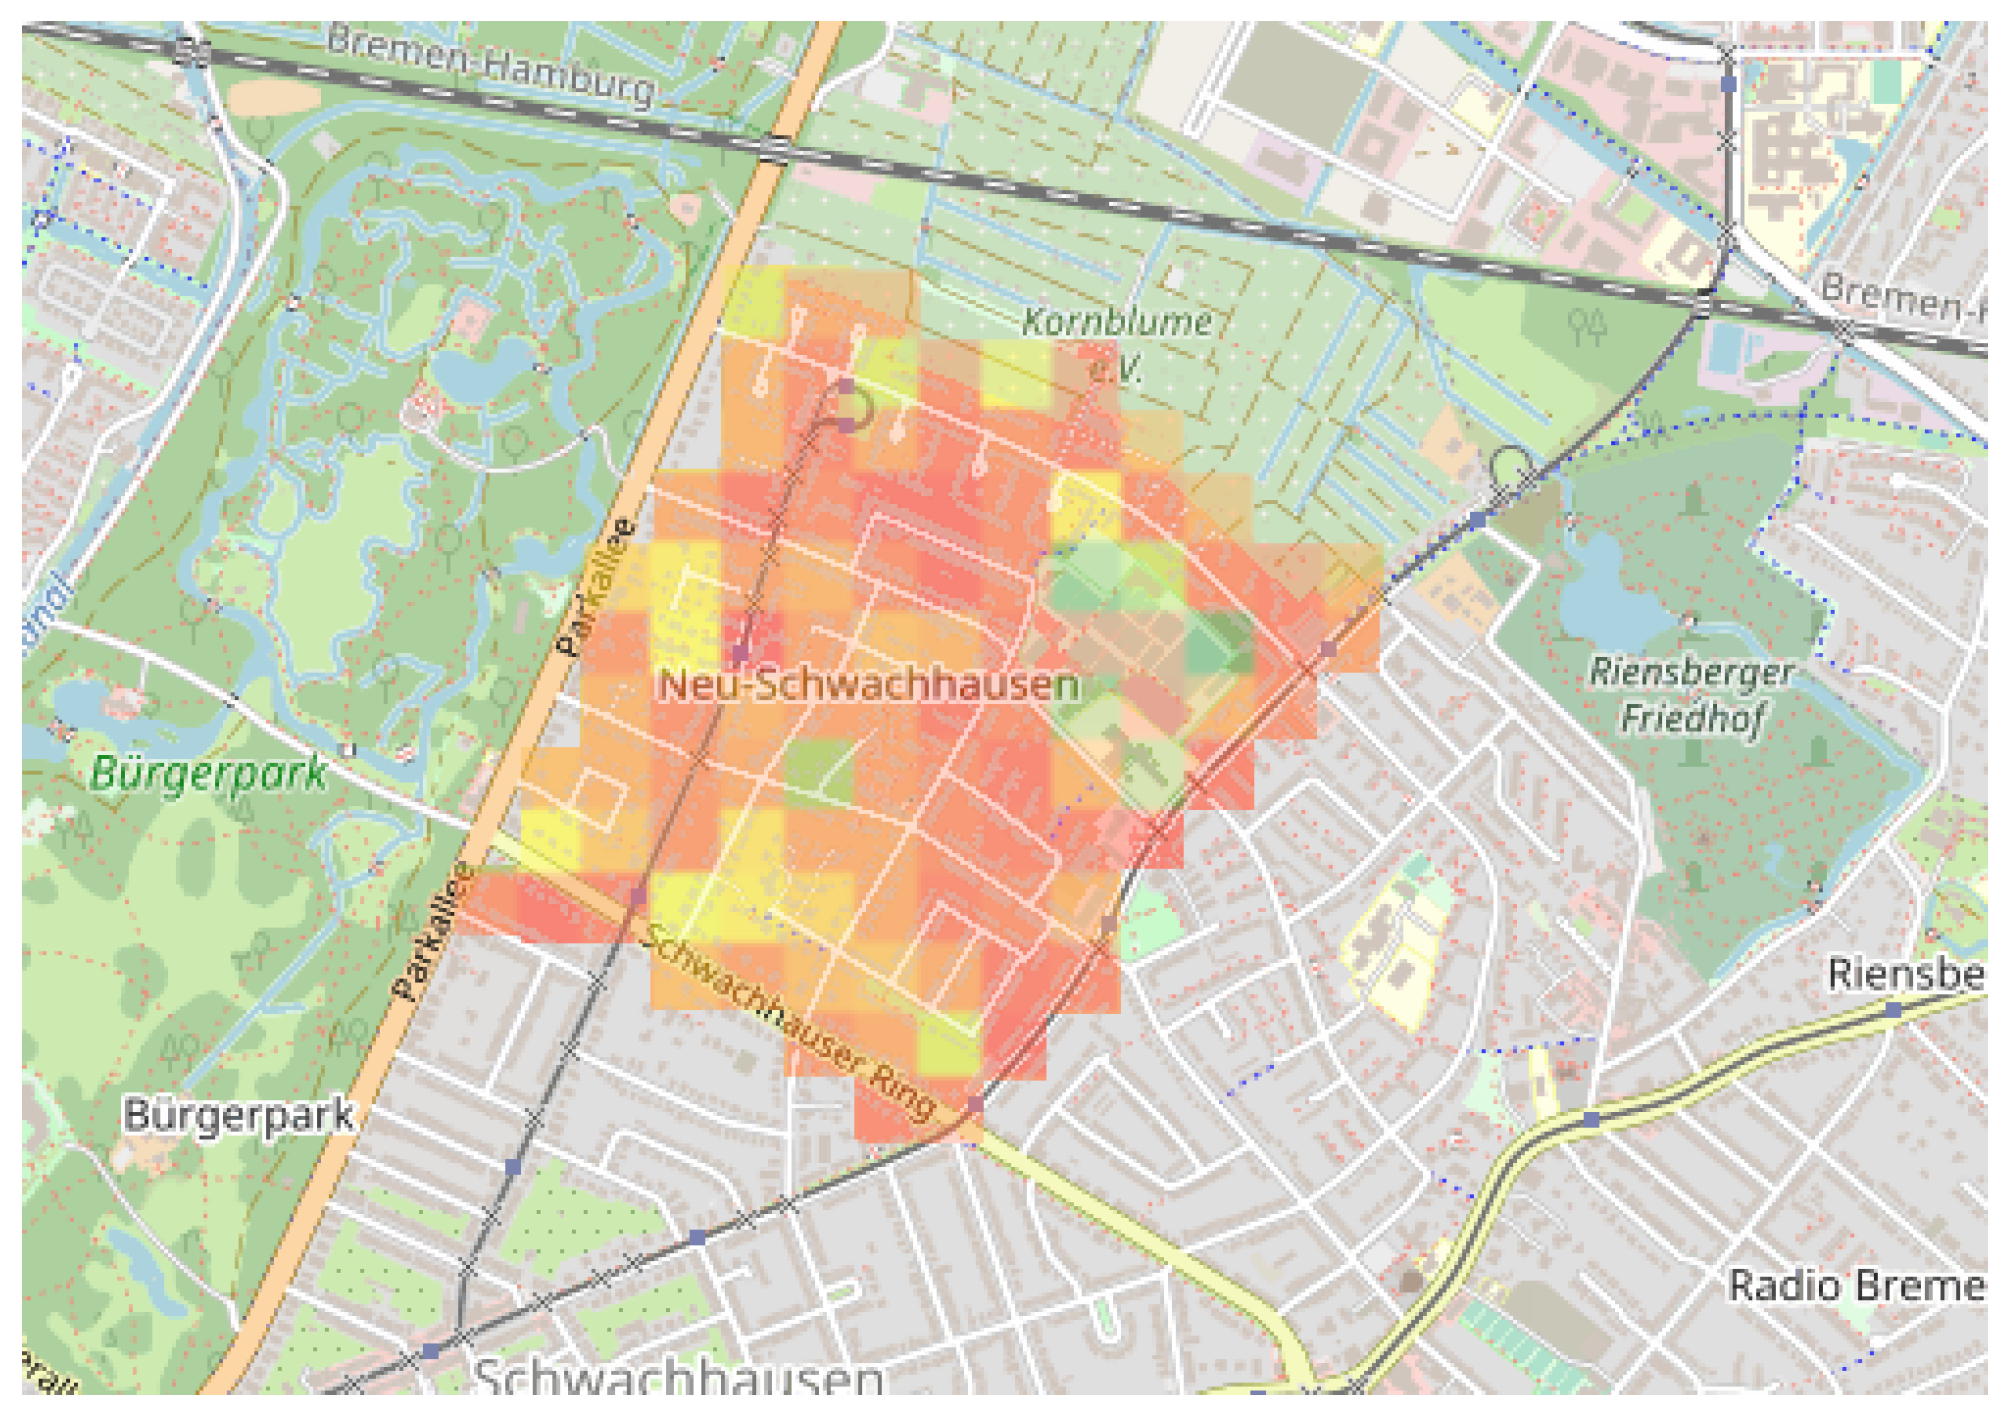
To find suitable districts for the study, a map of the city of Bremen has been overlaid with several data layers, e.g., annual heat demand or “Sinus-Milieus” [42]. It has been found that the urban district of Neu-Schwachhausen is an excellent candidate for the development of the neighborhood scale DT. It lies in the northern part of the city of Bremen, has an area of 2.92 km 2 and almost 6000 inhabitants [43]. In that district, both the age of the building and the distribution of wealth show a gradual development, which leaves room for choice regarding the subdivision into smaller digital twins of single neighborhoods.
The current status of the urban DT is the collection of the several data layers on the map of the city of Bremen. In addition to the aforementioned annual heat demand (see Figure 7, [44]) and “Sinus-Milieus”, there is data for the potential renewable energies, i.e., solar radiation plus available roof area [45] and geothermal potential [46], and information on the age of the buildings as well as their building class (e.g., multi-family home or commercial). As a detailed modeling of all buildings in the selected area is not feasible, but information on the building level is still helpful, representative buildings inside the neighborhoods are selected. These are approximated using data from the TABULA building typology [47].
The temporal profile of the heat demand can be obtained using implementations of the TABULA models, available in aixlib [48]. This way, also potential energetic convocation can be taken into account. As the neighborhoods are sufficiently large, the temporal profile of the electricity demand is expressed by a standard load profile (c.f. [49]). Thirdly, temporal profiles for the generation of renewable energies are tightly connected to weather data. This data is publicly available at different resolutions, from three hourly climate models (CORDEX, to consider possible future weather) down to 10 min for historical data [50].
Demands, including potential reduction by energetic renovation, as well as the potential for renewable energies are connected using the graph-based energy system model template MTRESS [51,52], which is based on oemof.solph [53]. In the last step, the urban DT will be used in combination with machine learning to explore the possible states of the energy system [54], finding advantages and disadvantages of different supply options.

4.4. Urban Scale

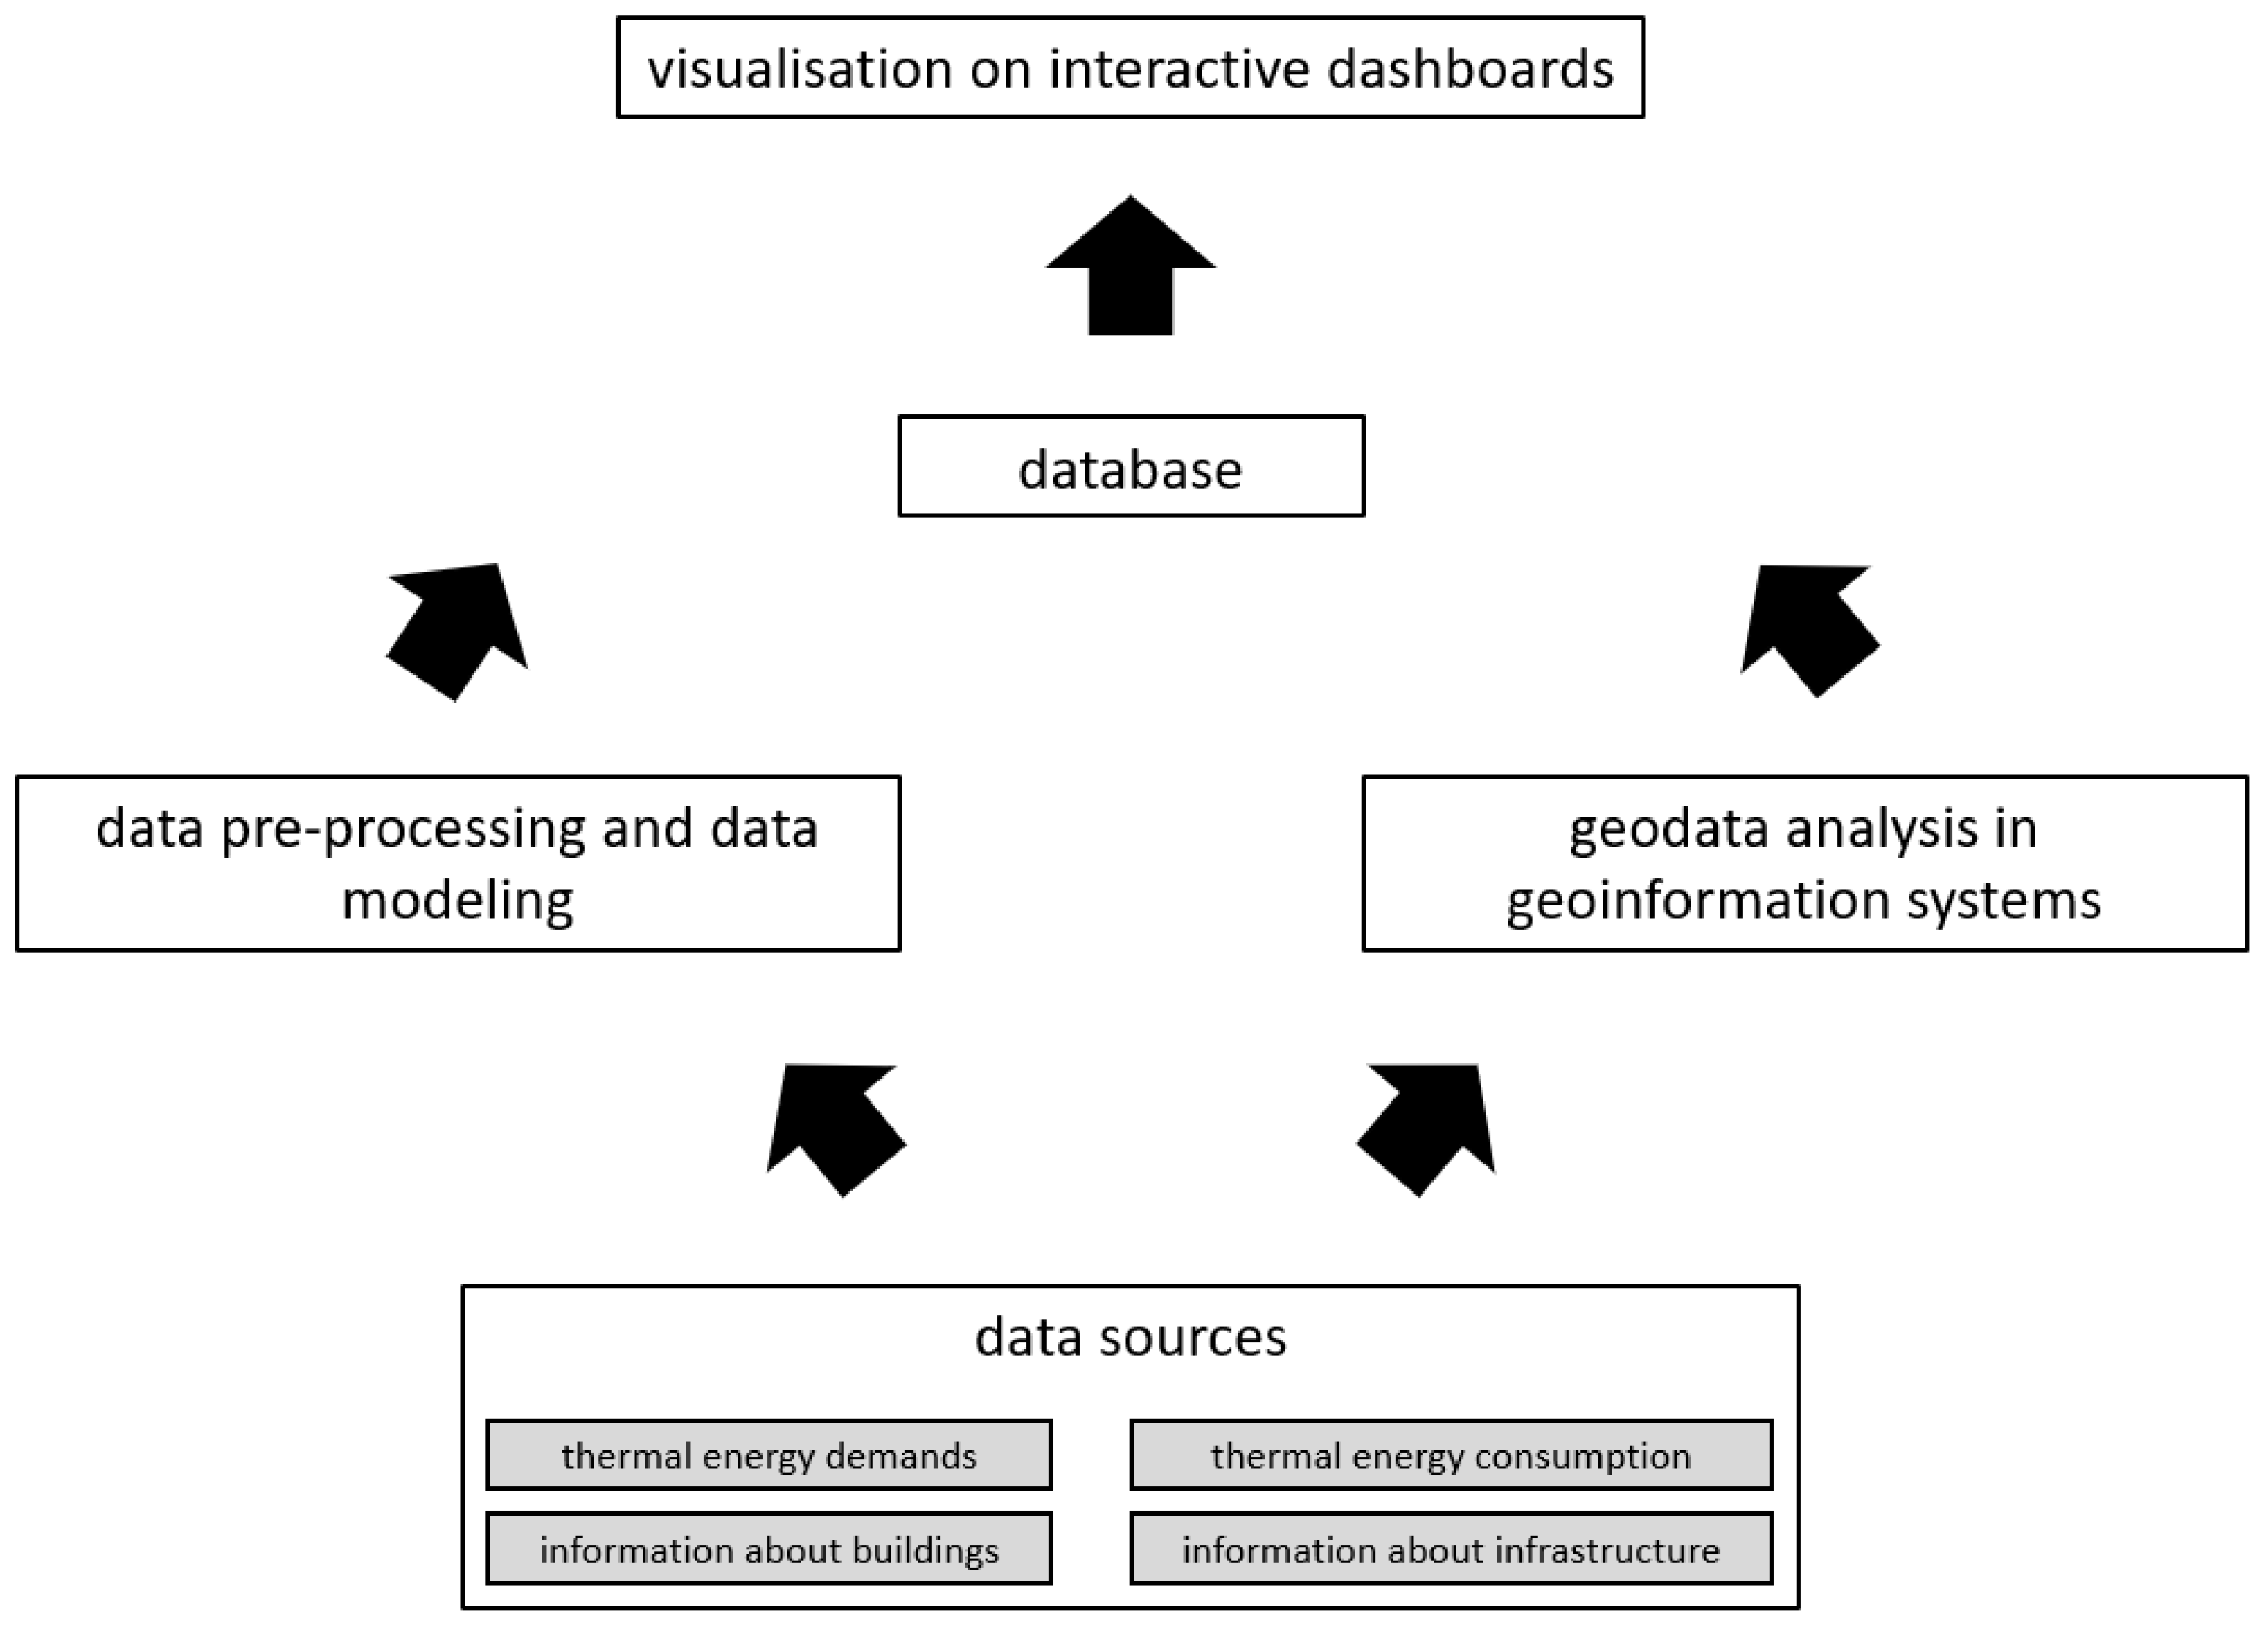
For the presented concept of an urban DT for regional thermal energy planning, a lot of information must be collected. The needed information includes thermal energy demand, energy infrastructure, and information about buildings [55].
Several data sources exist, for example, grid operators, energy suppliers, municipalities, or chimney sweeper guilds. The information must be collected from these different sources. In addition to actual data, modeled data can be used. An example is the thermal energy demands of residential buildings. The thermal energy demand can differ from the real thermal energy consumption since actual thermal energy consumption can be strongly influenced by individual users’ behavior, vacancy of the building, or weather conditions. Grid operators or energy suppliers can deliver information on actual thermal energy consumption.
The individual address is the connecting point for the different data sets. When the data are collected, data pre-processing and data modeling is performed. Further analyses with Geographis Information Systems(GIS) can be performed to calculate the potential of renewable energy exploitation. Examples of renewable energy that can be used are geothermal energy or solar thermal energy [56]. Also, the potential to reduce the heat demand has to be calculated to anticipate the thermal energy demands of the future [56]. Another part of the pre-processing is the calculation of indicators. An example of an indicator is the heat line density, which is an important indicator to describe the suitability of heat networks [57]. The data are stored in a database after the pre-processing, modeling, and geodata analysis. The data workflow is presented in Figure 8.
The data stored in the database is visualized on an interactive and user-friendly dashboard with a map in its center. The map consists of two layers, a building and a grid, which store the gathered data [55,58]. The data can be aggregated with the grid, or indicators can be calculated for the grid cells. A dashboard user can select or filter the data on the dashboards to analyze the database. The main goal of the dashboard is to provide the plan to support the transformation of the thermal energy supply infrastructure. The dashboard can also be used to support the communication between the regional thermal energy planning stakeholders. Lastly, another crucial feature is an update of the underlying dataset as a whole or individual component of the data set via a data mask, which is required for the evolution of the urban DT. Based on the exchanged data, calculations are automatically updated, making the urban DT more precise over time.

5. Discussion

The discussion section covers challenges related to data, such as gathering, ownership, reliability, and the connectivity of the DTs. It also explores the current research gap of the proposed DTs, the potential for synergy, practical value, and the significance of a robust data platform for research exchange and transfer.

5.1. Data Challenges

This section examines the data-related challenges of implementing DTs at different scales.

5.1.1. Building Scale

The first challenge on the building scale is related to gathering technical information. To set up a DT of a single building and its technical systems, the physical properties and construction details of the building have to be available, as well as the specifications of the systems and their interfaces. Often, these data only exist on paper and have to be transferred manually.
The second challenge imposed on building scale DT is the sensor infrastructure. Even if it turns out that the number of sensors used in the buildings described in Section 3.1 is not necessary for a working DT, many buildings have too few or even no sensors at all.
Additionally, data protection issues have to be taken into account whenever the data could be used to derive personal information. As an example, air quality measurements in office rooms can reveal when a room is occupied, which in turn could be used to control the employees’ working schedules.

5.1.2. Campus Scale

In addition to the challenges already mentioned in Section 5.1.1, the challenges in the campus area mainly lie in different data reliability, the different ages of the systems, and the data quality. The facilities on the campus differ in age, available data, and data about their intern components. The connected sensors are also not identical in age and are from different manufacturers. The reason is that the entire system was not built all at once but has grown historically. Therefore, it must be taken into account that the data quality varies. This relates specifically to fluctuating sensor values, for example, due to an imprecise time resolution.
Regarding the data security topic, data used for DT must not allow any conclusions to be drawn about individual users. At the current stage, the campus area energy system is presented as an energy-centric DT with electricity, heating, and cooling demand addressed by their total number, from which seminar or office room consumption cannot be derived. However, an occupant-centric approach would be challenging to be implemented, as data related to seminar attendance or office room occupancy must be tracked for its implementation.

5.1.3. Urban Scale

The first challenge of the urban DT lies in gathering real data with its underlying data security concerns. Presently, the EU data protection law—General Data Protection Regulation—ties the transfer of personal data to many conditions, such as limited duration of storage, usage exclusively for specified purposes, and security of data processing and storage [59]. While these regulations are important and not disputable for real personal data, they can create difficulties if data are mistakenly qualified as personal. In Germany, data protection is often named as a reason not to pass on actual consumption data, for, e.g., scientific research, because consumption data might be personal. Being recorded for billing purposes and qualified as personal data by energy suppliers (hence exclusively usable for that specified purpose), (annual) energy demand data are typically unavailable. Even if the situation is unclear, the possibility of legal conflicts implies a hurdle, that can be solved by clarifying legislation such as the amended Niedersächsisches Klimagesetz (NKlimaG) for Lower Saxony which comes into effect in 2024. However, that amendment only enables municipalities to demand that data from energy suppliers, not research institutes.
One further topic around data security poses another challenge to urban DT—data reliability. Due to the lack of available actual data, research efforts toward urban DT and municipal heat planning rely to a large extent on modeled data, e.g., modeled consumption data, age, and type of building. A characteristic of modeled data is that data are based on assumptions, abstractions, and a condensed representation of reality. Thus, the urban DT is coupled with uncertainty regarding parts of the underlying data that have to be interpreted and used accordingly.
Lastly, the data gathering for the urban DT can also be challenging in terms of synchronizing involved actors as well as data format and quality since building an urban DT is based on gathering data from several stakeholders, as described in Section 3.4.

5.2. Connectivity of the DTs

Digitalization plays a pivotal role in achieving the objective of transitioning to sustainable heating. Within the WärmewendeNordwest project, the development of DTs has identified two key elements: sensors and actuators.
On the one hand, the availability of real consumption, and in some use cases even actual live data, is advantageous for future infrastructure planning, as well as identifying synergies and optimizing existing infrastructure. At the urban scale, there is currently a lack of dynamic data. However, especially for strategic planning, it would be beneficial to not only use annual values. At the building scale, it is a common issue that there is a lack of sensors or no sensors at all. On the opposite, the campus scale deals with managing the vast amount of data that is not ultimately sufficient to meet all of the desired objectives.
On the other hand, the implementation of smart control strategies relies on sufficient actuators within the energy system and building management software that enables their execution. This is particularly significant for optimizing the operation of generation units and managing the load side. While this paper highlights the potential of heat management through a bi-directional connection, it acknowledges that the infrastructure’s maturity is not yet prepared to implement such a system.

5.3. Limitations

This section describes the topics that are limiting the introduced concepts.

5.3.1. Building Scale

Even the digital twin of a single building will always contain generalizations that can lead to its deviations from the physical twin. For example, structural inhomogeneities of construction parts or the effect of reflections in the treatment of solar heating through windows are neglected. Furthermore, some existing heat sources (for example, the active electrical components) are neglected.
Regarding the use case described in Section 3.1, a topic not covered in the developed DT concept is the time-dependent composition from different sources of grid electricity. In Germany, with data from [60], this composition could be analyzed in order to avoid grid electricity when it has a high amount of fossil sources.

5.3.2. Campus Scale

The developed concept of campus-scale DT does not address the topics of the aging of devices and occupant-centric optimization. Also, the aspect of predictive maintenance is only partially covered by the controller.
The current sensors infrastructure does not have any data related to individual parts of the campus, and therefore, only the total heating, cooling, and electricity consumptions of the buildings are considered in the DT. Further data about temperature, humidity, and occupancy of the rooms are not available but could be utilized for an occupant-centric optimization approach.
The aging of heating devices can significantly impact their energy efficiency over time, and this aspect ideally should be covered by updating its DT, given the aging of its physical counterpart. However, given the scale and complexity of campus-scale infrastructure, the aging of the DT is currently not feasible to implement but could be a topic of future work.
As already discussed in Section 4.2, predictive maintenance could be an economically and technically beneficial aspect for the operation of the energy system. The implementation problem lies in the availability of required sensors and their live connection. For example, the combined-heat plant could be well-maintained by monitoring the condition of its counterparts. However, the building management software of the campus only captures the inlet and outlet temperatures and heat and electricity generation. In the current concept of the DT, the aspect of predictive maintenance is implemented in the state-estimator part of the controller, which analyses deviations of measured input from expected output and can forecast the expected failure.

5.3.3. Urban Scale

The underlying, partially modeled data makes the urban DT suitable for identifying quarters for further investigation but not for deriving reliable neighborhood concepts, which is part of subsequent work [61]. Reasons for that are, among other things, on the one hand, the above-mentioned imprecision of modeled data and, on the other hand, that the urban DT mainly works with static annual data that does not take into account daily or seasonal fluctuations. As demonstrated in Figure 4, the University of Oldenburg has a high heat demand even in summer, which is rather unusual and not visible in the annual static data, although it would be crucial information in terms of developing a heat or energy supply concept for the campus and the areas nearby. There are technologies that produce a considerable amount of waste heat, as demonstrated in Figure 6 with the example of water-electrolyzer technology, and its construction near buildings with all-year-round heat demand, which has potential.

5.4. Synergy of the DTs

There is a synergy between building and campus-scale DTs. On one side, the building scale focuses on the investigation of the building’s thermal behavior and how the operation of the energy system could be improved in an occupant-centric approach. On the other side, campus scale aims at a larger scale system optimization on a multi-energy system level. The research outcomes of both DTs form a synergy, which in turn offers a higher energy-efficiency potential but possibly demands a more extensive computational effort that needs to be considered.
As mentioned in Section 5.3.3 the static annual data of an urban DT limits the information value for detailed analysis. This is where the different DTs complement each other. The data for the specific buildings of the urban DT can either be verified by comparing it with the buildings or campus DT’s aggregated data; or value can be added by connecting the DT’s concepts (e.g., via the “Wärmewende” platform) and thereby enrich the urban DT by dynamic data. The advantage of the latter is that the planning process would not have to stop by identifying neighborhoods for further investigation, but planners would be enabled to execute that investigation.
On the other side, the urban DT could also be a valuable information source for the buildings or campus DT when it comes to deriving energy supply concepts since it contains information about surrounding infrastructure and shows the potential of renewable energy sources and available space.

5.5. Practical Value

This research paper presents four distinct concepts of DTs designed explicitly for the purpose of heat transition. These concepts cover various topics of heat transition and they can be transferred to similar use cases. At the building scale, the research investigates the thermal behavior of various representative buildings and how these variations can be modeled. Campus scale covers optimization of the multi-energy system, from control strategies to proof of concept for new sustainable appliances. The neighborhood scale aims to provide a semi-automatic representation of the heating demand within a specific neighborhood Neu-Schwachhausen, which framework can then be extrapolated to other areas. Lastly, the urban scale encompasses the entire city of Oldenburg and offers strategic planning tools for decision-makers.

6. “Wärmewende” Platform for Cross-Scale DT

Addressing the research gap of cross-scale DTs for heat transition and the identified synergy potential among them, the “Wärmewende” platform serves as a central exchange platform, enabling internal collaboration and data sharing between the scales while also providing a public access to data and services. In the following section, the objectives and concept of the platform, enabling the development of cross-scale DT, are described.

6.1. Objectives of the “Wärmewende” Platform

The implementation of the “Wärmewende” platform” follows the FAIR guiding principles for research data management in order to make data findable, accessible, interoperable, and reusable. The integration, management, and storage of research data from the digital twins in the “Wärmewende” platform shall enable the partners to discover, access, integrate or merge DT data with additional information. Thus, the goal is not to map DTs as a whole but to integrate and store their generated data. Furthermore, the platform will incorporate additional tools to enhance data processing, analysis, and visualization capabilities. The use of the “Wärmewende” platform and its stored data will be controlled via security mechanisms and authorization regulations.

6.2. Concept of the “Wärmewende” Platform

The“WärmewendeNordwest” project consists of six research fields in which the project partners explore different aspects of the heat transition at different levels, from building to the entire city area. The “Wärmewende” platform addresses the challenge of maximizing synergies and collaborations between these research fields. DT data from the research fields should be shared and found on the platform so that the importance of certain DT data with different foci can be recognized and classified for their own research fields. This will enable an extension of own purposes, further processing, and reuse of DT data, promoting synergies between the research fields. A suitable data architecture and research data management are necessary to meet this challenge. In this context, high-quality data should be made available on the “Wärmewende” platform already during the project run for project-internal exchange and transfer. Applying FAIR principles to the data should enable the provision of findable, accessible, interoperable, and reusable data on the platform. In terms of ensuring optimal integration of DT data, transfer, and sharing of knowledge and data, consideration of both a technical and organizational solution is essential.
Intra-consortia research data management (ICRDM) enables sharing between researchers by making results discoverable and reusable during the project [62]. In order to create a suitable ICRDM that considers technical and organizational aspects, Data Mesh is applied as a solution approach for the “Wärmewende” platform. Data Mesh is a decentralized socio-technical approach to sharing, accessing, and managing data in complex, large-scale environments [63]. It is characterized by a decentralized data architecture and distributed domain-driven responsibility, with organization and processes governed by federated control. To implement technical and organizational requirements, Data Mesh is based on four principles: Domain Ownership, Data as a Product, Self-Service Data Platform, and Federated Governance.
“Domain Ownership” distributes responsibility and ownership of the data among the domains. This gives the data provided a high quality through the expertise of the domains. In addition, the product idea is applied to the data (“Data as a Product”) to gain added value by providing data as products. The so-called Data Products are created uniformly, managed securely and independently, and are evidence of high quality and trustworthiness. This saves time in data collection and promotes the reusability of the Data Products in the project. The “Self-Service Data Platform” provides storage, processing, orchestration, visualization, software development, and machine learning tools. “Federated Governance” regulates the interoperability and security of data through global guidelines and standards in the project. This way, processes are structured and standardized [64].
By applying the Data Mesh to the data architecture of the “Wärmewende” platform, the Data Mesh principles are also transferred to the project partners so that they all participate in managing the research data. In this way, the six research fields gain ownership over their DT data and the creation and provision of selected data as Data Products on the platform. The research fields create Data Products using their technical infrastructure and tools or with the functions of the self-services on the “Wärmewende” platform. The Data Products are then integrated into the platform and stored in the database. In a data catalog, all created Data Products and their metadata are registered to make them addressable and findable for all project partners to support exchange and reuse.
Authorization and authentication security mechanisms ensure that only authorized participants can access the “Wärmewende” platform, DT Data Products, and information. Authorization and access controls restrict participants in their rights on the platform and in their handling of data. In addition, guidelines and standards are defined to implement uniform processes and procedures for standardizing the Data Products. Legal restrictions such as licenses of use are also considered when creating and maintaining the Data Products.

6.3. “Wärmewende” Platform for Cross-Scale DT

Due to the socio-technical approach and the decentralized data architecture of the “Wärmewende” platform, DT data products can be easily integrated to support the transfer and exchange in the project. Through standardization and preparation of the Data Products, they are already made available on the platform during the project run in a findable, accessible, interoperable, and reusable way. Accordingly, the project partners can discover, process, link, and reuse useful, high-quality Data Products to identify synergies and promote cooperation. Likewise, concepts from other DTs, especially those on the same scale, can be applied to their own object of investigation.
In addition to the purely project-internal exchange of DT Data Products, selected datasets and results will also be made available to the public as Open Data so that other researchers, projects, students, and citizens can benefit from the DT data, results, insights, and concepts for the heat transition.

7. Conclusions

Considerable research has been devoted to exploring DTs at multiple levels. Despite this, it is essential to note that the present literature lacks emphasis on the heating domain, and notably overlooks investigations concerning the convergence of DTs at different scales for enabling heating transitions. The present study investigates four distinct scales and their respective use cases, namely: Building-scale DT, which centers on optimizing energy systems based on building thermal behavior, necessitating individualized treatment for buildings of varying construction dates; Campus-scale DT, which delves into the operation and maintenance of centralized heating and cooling supply systems for expansive campuses; and neighborhood- and urban-scale DT, which is concerned with strategic heating planning in these areas. An important finding from the study is the interdependent relationship among these concepts, implying their combined effectiveness in achieving enhanced outcomes in heat transition initiatives. To enhance internal collaboration and promote external data and knowledge exchange, the paper presents the Wärmewende data platform with its objectives and concept. The paper also identifies pertinent issues related to data, encompassing gathering, reliability, connectivity, and ownership. This comparative investigation of DTs for heat transition at different scales underscores the potential of collaborative DTs as catalysts for advancing the field of heating transitions.

Author Contributions

Building Scale, J.H., P.P. and J.M.; Campus Scale, E.L. and J.P.H.; Urban Scale, L.K., M.S. and P.S.; Data Platform, T.B.; Discussion Section E.L., T.B., J.H., J.P.H., L.K., P.P., M.S. and P.S.; Editing and review, E.L. All authors have read and agreed to the published version of the manuscript.

Funding

This research was funded by the German Federal Ministry of Education and Research in the framework of the project WaermewendeNordwest (grant number 03SF0624).

Institutional Review Board Statement

Not applicable.

Informed Consent Statement

Not applicable.

Data Availability Statement

The data presented in this study in Figure 4 are available on request from the corresponding author. The data are not publicly available due to data ownership regulations.

Acknowledgments

The presented contents have been developed within the framework of the project “WärmewendeNordwest—Digitalisierung zur Umsetzung von Wärmewende- und Mehrwertanwendungen für Gebäude, Campus, Quartiere und Kommunen im Nordwesten”, funded by the Federal Ministry of Education and Research (BMBF). We thank Sascha Koch, Sebastian Lehnhoff and Astrid Nieße for the support and Christine Rosinger for reviewing.

Conflicts of Interest

The authors declare no conflict of interest.

References

  1. International Energy Agency (IEA). Net Zero by 2050; License: CC BY 4.0. 2021. Available online: https://www.iea.org/reports/net-zero-by-2050 (accessed on 30 May 2023).
  2. Lachal, B. Energy Transition; Wiley: Hoboken, NJ, USA, 2019. [Google Scholar] [CrossRef]
  3. Anwendungsbilanzen zur Energiebilanz Deutschland: Detaillierte Anwendungsbilanzen der Endenergiesektoren für 2020 und 2021 Sowie Zusammenfassende Zeitreihen zum Endenergieverbrauch nach Energieträgern und Anwendungszwecken für Jahre von 2011 bis 2021. 2022. Available online: https://ag-energiebilanzen.de/wp-content/uploads/2023/01/AGEB_21p2_V3_20221222.pdf (accessed on 28 May 2023).
  4. Grieves, M. Digital Twin: Manufacturing Excellence through Virtual Factory Replication. White Paper: 2014. Available online: https://www.researchgate.net/publication/275211047 (accessed on 14 August 2023).
  5. Yu, W.; Patros, P.; Young, B.; Klinac, E.; Walmsley, T.G. Energy digital twin technology for industrial energy management: Classification, challenges and future. Renew. Sustain. Energy Rev. 2022, 161, 112407. [Google Scholar] [CrossRef]
  6. Kritzinger, W.; Karner, M.; Traar, G.; Henjes, J.; Sihn, W. Digital Twin in manufacturing: A categorical literature review and classification. IFAC-PapersOnLine 2018, 51, 1016–1022. [Google Scholar] [CrossRef]
  7. VanDerHorn, E.; Mahadevan, S. Digital Twin: Generalization, characterization and implementation. Decis. Support Syst. 2021, 145, 113524. [Google Scholar] [CrossRef]
  8. Wright, L.; Davidson, S. How to tell the difference between a model and a digital twin. Adv. Model. Simul. Eng. Sci. 2020, 7, 13. [Google Scholar] [CrossRef]
  9. WärmewendeNordwest Project Homepage. Mit Digitalisierung die Wärmewende im Nordwesten Schaffen. Available online: https://www.waermewende-nordwest.de (accessed on 30 June 2023).
  10. Modelica® Language Specification Version 3.6, 5/4/2023. Available online: https://specification.modelica.org/maint/3.6/MLS.html (accessed on 5 April 2023).
  11. Nytsch-Geusen, C.; Huber, J.; Ljubijankic, M.; Rädler, J. Modelica BuildingSystems—Eine Modellbibliothek zur Simulation komplexer energietechnischer Gebäudesysteme. Bauphysik 2013, 35, 21–29. [Google Scholar] [CrossRef]
  12. Der digitale Zwilling in der Energetischen Gebäude-und Anlagensimulation. 2018. Available online: https://modelica-buildingsystems.de/pub/bausim2018_p1151.pdf (accessed on 30 June 2023).
  13. Nytsch-Geusen, C.; Kaul, W.; Rädler, J.; Westermann, L.; Shenoy, V.; Balekai, P. The digital twin as a base for the design of building control strategies. In Proceedings of the Building Simulation Conference, Rome, Italy, 2–4 September 2019; Volume 6. [Google Scholar] [CrossRef]
  14. Chakrabarty, A.; Maddalena, E.; Qiao, H.; Laughman, C. Scalable Bayesian optimization for model calibration: Case study on coupled building and HVAC dynamics. Energy Build. 2021, 253, 111460. [Google Scholar] [CrossRef]
  15. Lukianykhin, O.; Bogodorova, T. ModelicaGym. In Proceedings of the EOOLT’19: Proceedings of the 9th International Workshop on Equation-Based Object-Oriented Modeling Languages and Tools, Berlin, Germany, 5 November 2019; pp. 27–36. [CrossRef]
  16. Gao, G.; Li, J.; Wen, Y. DeepComfort:Energy-Efficient Thermal Comfort Control in Smart Buildings via Deep Reinforcement Learning. IEEE Internet Things J. 2019, 7, 8472–8484. [Google Scholar] [CrossRef]
  17. Aguilar, J.; Garces-Jimenez, A.; R-Moreno, M.D.; García, R. A systematic literature review on the use of artificial intelligence in energy self-management in smart buildings. Renew. Sustain. Energy Rev. 2021, 151, 111530. [Google Scholar] [CrossRef]
  18. Wang, Z.; Chen, Y.; Li, Y. Development of RC model for thermal dynamic analysis of buildings through model structure simplification. Energy Build. 2019, 195, 51–67. [Google Scholar] [CrossRef]
  19. Belic, F.; Hocenski, Z.; Sliskovic, D. Thermal modeling of buildings with RC method and parameter estimation. In Proceedings of the 2016 International Conference on Smart Systems and Technologies (SST), Osijek, Croatia, 12–14 October 2016; IEEE: Piscataway, NJ, USA, 2016; pp. 19–25. [Google Scholar] [CrossRef]
  20. Boodi, A.; Beddiar, K.; Amirat, Y.; Benbouzid, M. Simplified Building Thermal Model Development and Parameters Evaluation Using a Stochastic Approach. Energies 2020, 13, 2899. [Google Scholar] [CrossRef]
  21. Qiuchen Lu, V.; Parlikad, A.K.; Woodall, P.; Ranasinghe, G.D.; Heaton, J. Developing a Dynamic Digital Twin at a Building Level: Using Cambridge Campus as Case Study. In Proceedings of the International Conference on Smart Infrastructure and Construction 2019 (ICSIC), Cambridge, UK, 8–10 July 2019; DeJong, M.J., Schooling, J.M., Viggiani, G.M., Eds.; ICE Publishing: London, UK, 2019; pp. 67–75. [Google Scholar] [CrossRef]
  22. Zaballos, A.; Briones, A.; Massa, A.; Centelles, P.; Caballero, V. A Smart Campus’ Digital Twin for Sustainable Comfort Monitoring. Sustainability 2020, 12, 9196. [Google Scholar] [CrossRef]
  23. Kong, M.; Dong, B.; Zhang, R.; O’Neill, Z. HVAC energy savings, thermal comfort and air quality for occupant-centric control through a side-by-side experimental study. Appl. Energy 2022, 306, 117987. [Google Scholar] [CrossRef]
  24. Muqeet, H.A.; Munir, H.M.; Javed, H.; Shahzad, M.; Jamil, M.; Guerrero, J.M. An Energy Management System of Campus Microgrids: State-of-the-Art and Future Challenges. Energies 2021, 14, 6525. [Google Scholar] [CrossRef]
  25. Lohmeier, D.; Cronbach, D.; Drauz, S.R.; Braun, M.; Kneiske, T.M. Pandapipes: An Open-Source Piping Grid Calculation Package for Multi-Energy Grid Simulations. Sustainability 2020, 12, 9899. [Google Scholar] [CrossRef]
  26. Ferré-Bigorra, J.; Casals, M.; Gangolells, M. The adoption of urban digital twins. Cities 2022, 131, 103905. [Google Scholar] [CrossRef]
  27. Batty, M. Fifty Years of Urban Modeling: Macro-Statics to Micro-Dynamics. In The Dynamics of Complex Urban Systems: An Interdisciplinary Approach; Albeverio, S., Andrey, D., Giordano, P., Vancheri, A., Eds.; Physica-Verlag HD: Heidelberg, Germany, 2008; Volume 69, pp. 1–20. [Google Scholar] [CrossRef]
  28. Bauer, M.; Cirillo, F.; Fürst, J.; Solmaz, G.; Kovacs, E. Urban Digital Twins—A FIWARE-based model. Automatisierungstechnik 2021, 69, 1106–1115. [Google Scholar] [CrossRef]
  29. Tomin, N.; Kurbatsky, V.; Borisov, V.; Musalev, S. Development of Digital Twin for Load Center on the Exle of Distribution Network of an Urban District. E3S Web Conf. 2020, 209, 02029. [Google Scholar] [CrossRef]
  30. Srinivasan, R.S.; Manohar, B.; Issa, R.R.A. Urban Building Energy CPS (UBE-CPS): Real-Time Demand Response Using Digital Twin. In Cyber-Physical Systems in the Built Environment; Anumba, C.J., Roofigari-Esfahan, N., Eds.; Springer International Publishing: Cham, Switzerland, 2020; pp. 309–322. [Google Scholar] [CrossRef]
  31. Deren, L.; Wenbo, Y.; Zhenfeng, S. Smart city based on digital twins. Comput. Urban Sci. 2021, 1, 4. [Google Scholar] [CrossRef]
  32. Ivanov, S.; Nikolskaya, K.; Radchenko, G.; Sokolinsky, L.; Zymbler, M. Digital Twin of City: Concept Overview. In Proceedings of the 2020 Global Smart Industry Conference (GloSIC), Chelyabinsk, Russia, 17–19 November 2020; IEEE: Piscataway, NJ, USA, 2020; pp. 178–186. [Google Scholar] [CrossRef]
  33. Schrotter, G.; Hürzeler, C. The Digital Twin of the City of Zurich for Urban Planning. PFG—J. Photogramm. Remote Sens. Geoinf. Sci. 2020, 88, 99–112. [Google Scholar] [CrossRef]
  34. Ruohomaki, T.; Airaksinen, E.; Huuska, P.; Kesaniemi, O.; Martikka, M.; Suomisto, J. Smart City Platform Enabling Digital Twin. In Proceedings of the 2018 International Conference on Intelligent Systems (IS), Funchal, Portugal, 25–27 September 2018; IEEE: Piscataway, NJ, USA, 2018; pp. 155–161. [Google Scholar] [CrossRef]
  35. Francisco, A.; Mohammadi, N.; Taylor, J.E. Smart City Digital Twin–Enabled Energy Management: Toward Real-Time Urban Building Energy Benchmarking. J. Manag. Eng. 2020, 36, 04019045. [Google Scholar] [CrossRef]
  36. Grensemann, T. Abschätzungen des Energiebedarfes des EEP-Gebäudes unter verschiedenen Betriebsbedingungen durch ein digitalisiertes Gebäudemodell. Bachelor’s Thesis, Jade University of Applied Sciences, Wilhelmshaven, Germany, 2022. [Google Scholar]
  37. Lower Saxon State Parliament. §20 NKlimaG, Niedersächsisches Gesetz zur Förderung des Klimaschutzes und zur Minderung der Folgen des Klimawandels (Niedersächsisches Klimagesetz—NKlimaG). 2022. Available online: https://voris.wolterskluwer-online.de/browse/document/19af7ff8-34fe-3d7a-9b35-6852cccd6dce (accessed on 30 June 2023).
  38. Robert Riechel, J.W. Kurzgutachten Kommunale Wärmeplanung. 2022. Available online: https://wordpress.wohnungswirtschaft-heute.de/wp-content/uploads/2022/04/kurzgutachten_kommunale_waermeplanung.pdf (accessed on 23 May 2023).
  39. Schloegl, F.; Rohjans, S.; Lehnhoff, S.; Velasquez, J.; Steinbrink, C.; Palensky, P. Towards a classification scheme for co-simulation approaches in energy systems. In Proceedings of the 2015 International Symposium on Smart Electric Distribution Systems and Technologies (EDST), Vienna, Austria, 8–11 September 2015; pp. 516–521. [Google Scholar] [CrossRef]
  40. Steinbrink, C.; Lehnhoff, S.; Rohjans, S.; Strasser, T.I.; Widl, E.; Moyo, C.; Lauss, G.; Lehfuss, F.; Faschang, M.; Palensky, P.; et al. Simulation-Based Validation of Smart Grids—Status Quo and Future Research Trends. In Proceedings of the Industrial Applications of Holonic and Multi-Agent Systems, Lyon, France, 28–30 August 2017; Mařík, V., Wahlster, W., Strasser, T., Kadera, P., Eds.; Springer International Publishing: Cham, Switzerland, 2017; pp. 171–185. [Google Scholar]
  41. Marquant, J.; Omu, A.; Evins, R.; Carmeliet, J. Application of spatial-temporal clustering to facilitate energy system modelling. In Proceedings of the Building Simulation, Hyderabad, India, 7–9 December 2015. [Google Scholar]
  42. Flaig, B.B.; Barth, B. Die Sinus-Milieus® 3.0—Hintergründe und Fakten zum aktuellen Sinus-Milieu-Modell. In Zielgruppen im Konsumentenmarketing: Segmentierungsansätze—Trends–Umsetzung; Halfmann, M., Ed.; Springer Fachmedien Wiesbaden: Wiesbaden, Germany, 2014; pp. 105–120. [Google Scholar] [CrossRef]
  43. Statistisches Jahrbuch Bremen. Technical Report; Statistisches Landesamt Bremen: Bremen, Germany, 2010. [Google Scholar]
  44. Erstellung eines Wärmeatlas für Bremen und Bremerhaven; Technical Report; Wesernetz Bremen GmbH: Bremen, Germany, 2021; Available online: https://www.wesernetz.de/fuer-mein-zuhause/nachhaltiges-zuhause/fernwaerme/fernwaermenetz-bremen/waermeatlas (accessed on 30 June 2023).
  45. Solarkaster Bremen. Technical Report; Geo Bremen and Freie Hansestadt Bremen: Bremen, Germany, 2023; Available online: https://www.solarkataster-bremen.de/ (accessed on 30 June 2023).
  46. NIBIS. Nidersächsisches Bodeninformationssystem. 2023. Available online: https://nibis.lbeg.de/cardomap3/ (accessed on 30 June 2023).
  47. Loga, T.; Stein, B.; Diefenbach, N. TABULA building typologies in 20 European countries—Making energy-related features of residential building stocks comparable. Energy Build. 2016, 132, 4–12. [Google Scholar] [CrossRef]
  48. Müller, D.; Lauster, M.; Constantin, A.; Fuchs, M.; Remmen, P. AixLib—An Open-Source Modelica Library within the IEA-EBC Annex 60 Framework. In Proceedings of the BauSIM 2016, Dresden, Germany, 14–16 September 2016; pp. 3–6. [Google Scholar]
  49. Proedrou, E. A Comprehensive Review of Residential Electricity Load Profile Models. IEEE Access 2021, 9, 12114–12133. [Google Scholar] [CrossRef]
  50. Deutscher Wetterdienst. DWD Open Data. 2023. Available online: https://opendata.dwd.de/climate_environment/CDC/observations_germany/climate/ (accessed on 30 June 2023).
  51. Schönfeldt, P.; Grimm, A.; Neupane, B.; Torio, H.; Duran, P.; Klement, P.; Hanke, B.; Maydell, K.V.; Agert, C. Simultaneous optimization of temperature and energy in linear energy system models. In Proceedings of the 2022 Open Source Modelling and Simulation of Energy Systems (OSMSES), Aachen, Germany, 4–5 April 2022; pp. 1–6. [Google Scholar] [CrossRef]
  52. Schönfeldt, P.; Schlüters, S.; Oltmanns, K. MTRESS 3.0—Modell Template for Residential Energy Supply Systems. arXiv 2022, arXiv:2211.14080. [Google Scholar]
  53. Krien, U.; Schönfeldt, P.; Launer, J.; Hilpert, S.; Kaldemeyer, C.; Pleßmann, G. oemof.solph—A model generator for linear and mixed-integer linear optimisation of energy systems. Softw. Impacts 2020, 6, 100028. [Google Scholar] [CrossRef]
  54. Schmeling, L.; Schönfeldt, P.; Klement, P.; Vorspel, L.; Hanke, B.; von Maydell, K.; Agert, C. A generalised optimal design methodology for distributed energy systems. Renew. Energy 2022, 200, 1223–1239. [Google Scholar] [CrossRef]
  55. Peters, M.; Steidle, T.; Böhnisch, H. Kommunale Wärmeplanung Leitfaden. 2020. Available online: https://um.baden-wuerttemberg.de/fileadmin/redaktion/m-um/intern/Dateien/Dokumente/2_Presse_und_Service/Publikationen/Energie/Leitfaden-Kommunale-Waermeplanung-barrierefrei.pdf (accessed on 24 May 2023).
  56. Böhnisch, H.; Peters, M.; Steidle, T.; Droin, A.; Wurm, M.; Schillings, C.; Sperber, E. Entwicklung Eines Standardisierten Analyse- und Ergebnisrasters für Wärmepläne zur Umsetzung der Energiewende im Kommunalen Bereich. 2022. Available online: https://www.kea-bw.de/fileadmin/user_upload/Waermewende/Wissensportal/ANSWER-Kommunal_Ergebnisbericht.pdf (accessed on 30 June 2023).
  57. Knies, J. Räumliche Integration Industrieller Abwärme in Zukünftige Wärmeversorgungsoptionen. AGIT—J. FüR Angew. Geoinformatik 2017, 3, 98–108. [Google Scholar]
  58. Schnabel, M.; Gravenhorst, T.; Belkot, T.; Friebe, F.; Erdmann, S.; Koch, S. Visual Data Discovery im Kontext der geodaten-basierten Wärmeleitplanung. Gis. Sci. 2022, 2, 63–74. [Google Scholar]
  59. European Union. Datenschutz-Grundverordnung. Art. 5, 6, 13, 14. 2018. Available online: https://dsgvo-gesetz.de/ (accessed on 26 May 2023).
  60. Bundesnetzagentur|SMARD.DE. Available online: https://www.smard.de (accessed on 21 June 2023).
  61. Klimaschutz- und Energieagentur Niedersachsen. Leitfaden Kommunale Wärmeplanung. 2023. Available online: https://www.klimaschutz-niedersachsen.de/_downloads/FaktenpapiereLeitfaeden/LeifadeKommWaermeplanung/2023_04_Leitfaden-Waermeplanung_gesamt.pdf (accessed on 26 May 2023).
  62. Schröder, M.; LeBlanc, H.; Spors, S.; Krüger, F. Intra-consortia data sharing platforms for interdisciplinary collaborative research projects. IT-Inf. Technol. 2020, 62, 19–28. [Google Scholar] [CrossRef]
  63. Dehghani, Z. Data Mesh: Delivering Data-Driven Value at Scale; O’Reilly Media, Inc.: Sebastopol, CA, USA, 2022. [Google Scholar]
  64. Dehghani, Z. Data Mesh Principles and Logical Architecture. 2020. Available online: https://martinfowler.com/articles/data-mesh-principles.html (accessed on 18 April 2023).
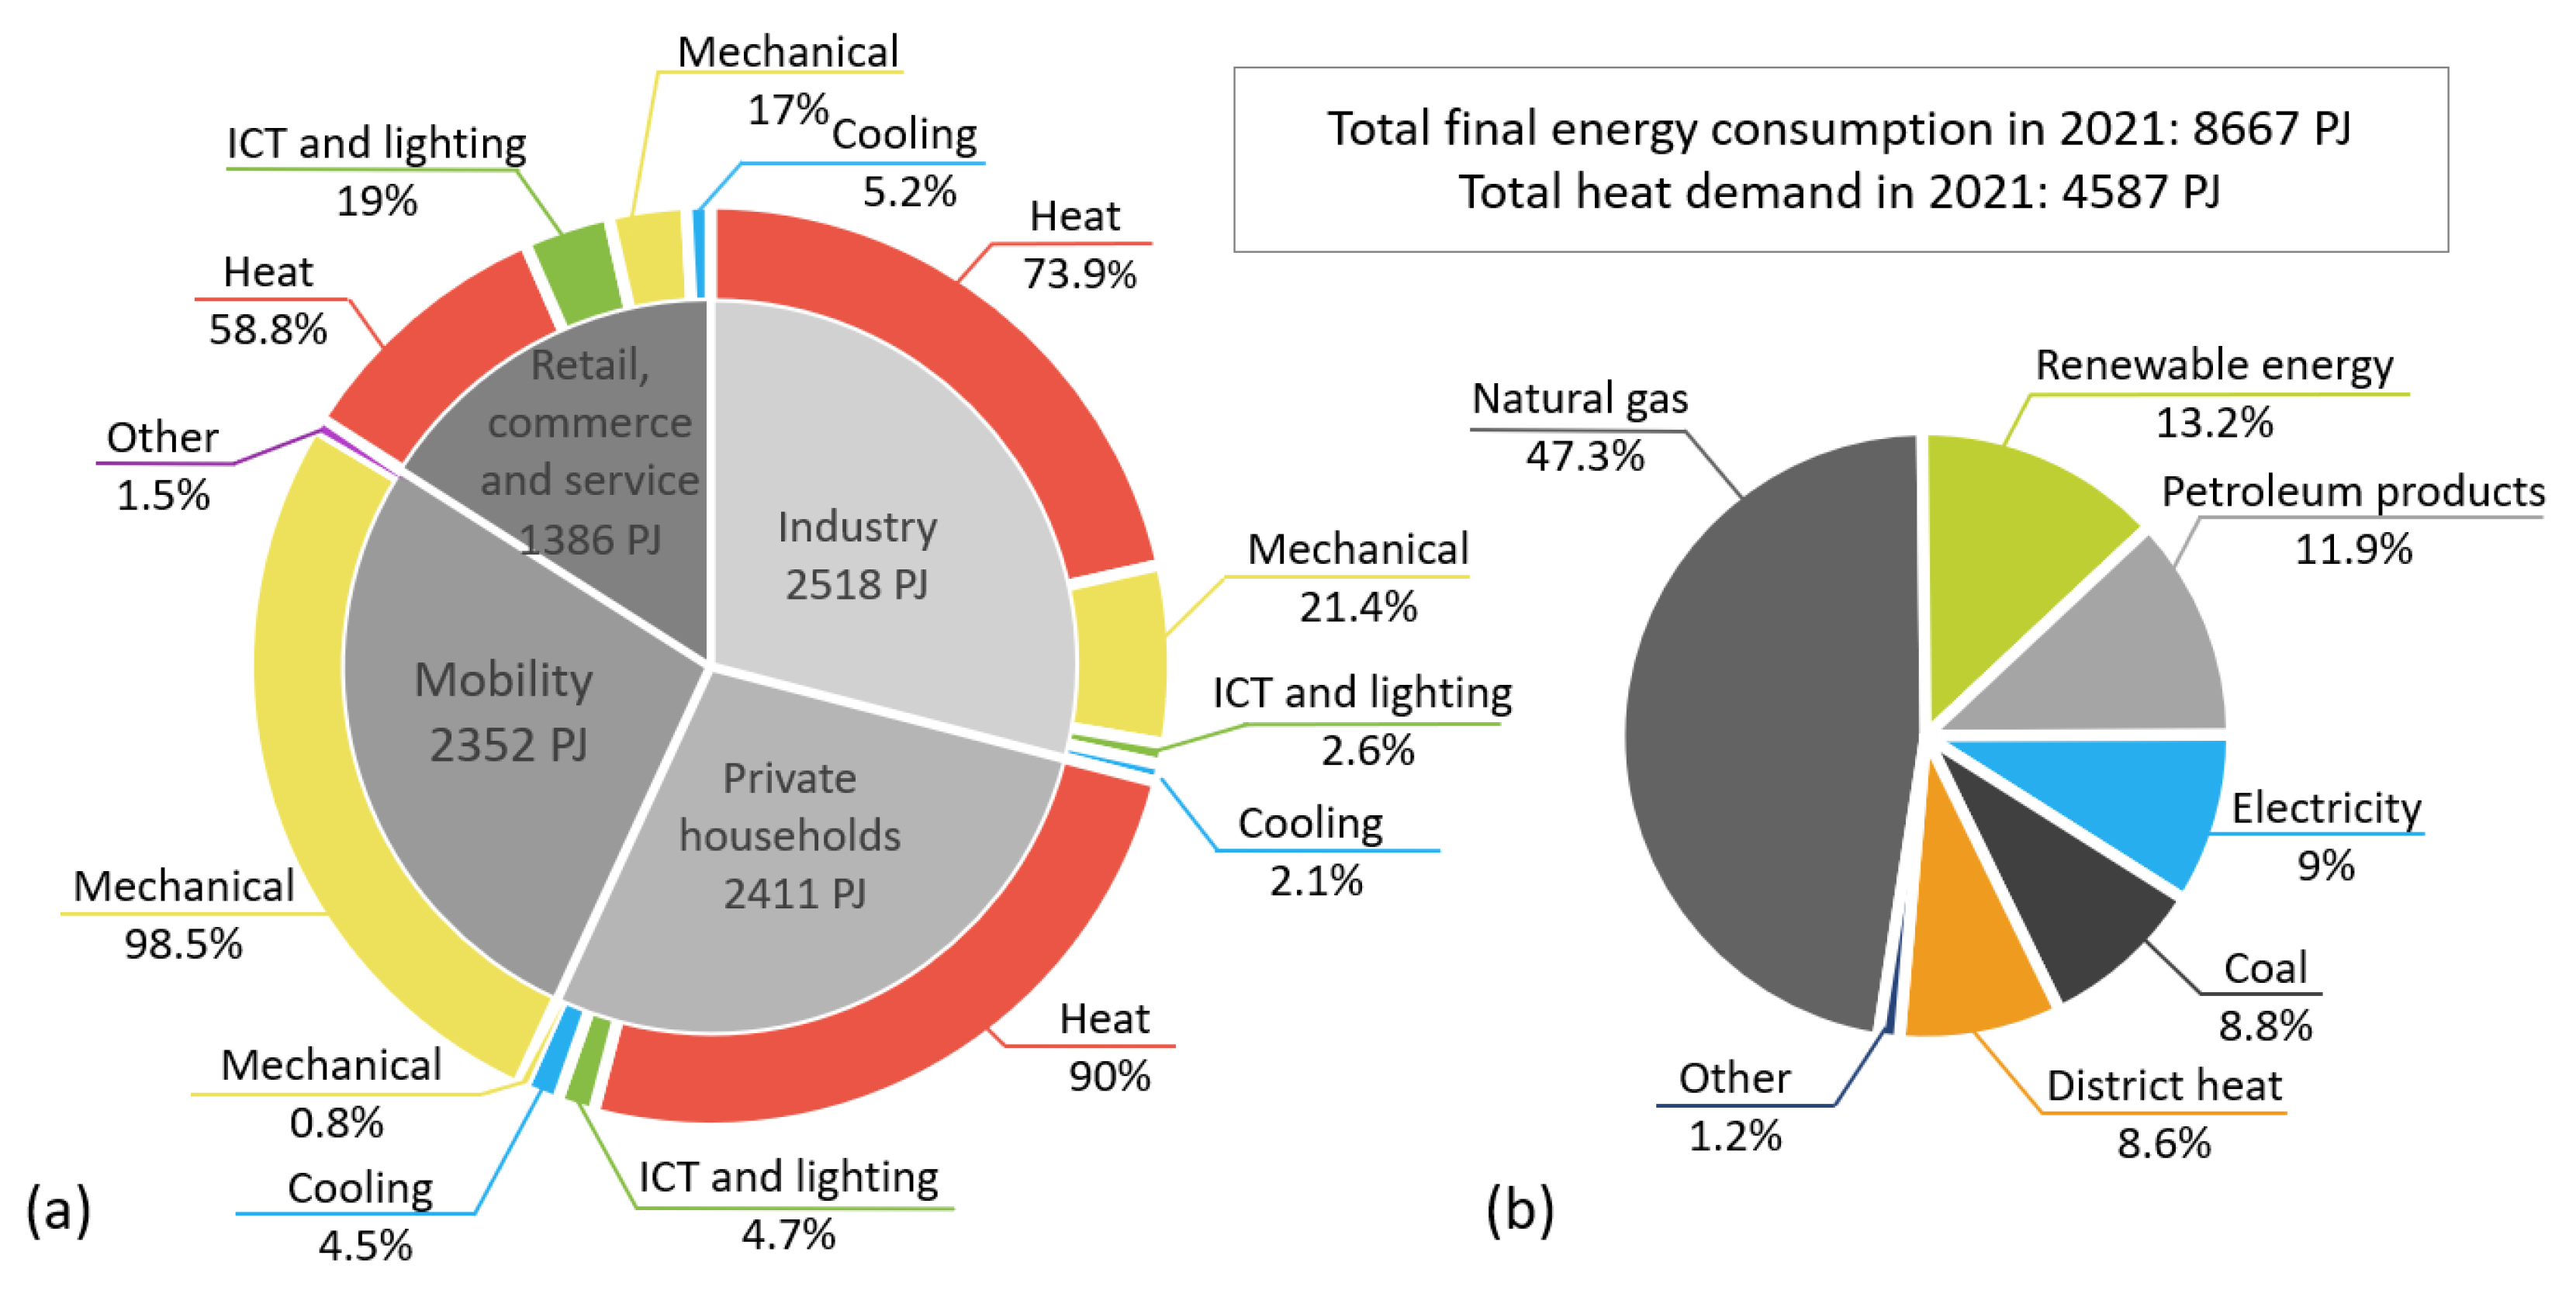
Figure 1. Own representation of final energy breakdown in Germany in 2021 based on statistics from AG Energiebilanzen e.V. [3]: (a) Final energy breakdown by sector and use. (b) Final energy for heating purposes breakdown by energy source.
Bdcc 07 00145 g001
Figure 2. Simplified flow chart of an example objective on the building scale: a heat pump in combination with a hot water storage tank heats the building via a convection heater. Preferably, heat pump operation should only occur when solar energy is present. The sought-for control strategy minimizes the heat pump operation on grid electricity (dashed red connection). In reality, the input conditions are not binary but can take on continuous values (e.g., storage temperature).
Bdcc 07 00145 g002
Figure 3. Minimal concept of a digital twin of a single building, suitable for simulating the heat pump/heat storage optimization objective. While the simulation is running, the control strategy can influence the behavior of the heating system inside the digital twin.
Bdcc 07 00145 g003
Figure 4. Energy demand at UOL Haarentor Campus in 2022.
Bdcc 07 00145 g004
Figure 5. Heating and cooling network of the UOL.
Bdcc 07 00145 g005
Figure 6. A proof of concept for integration of potential appliances. Example of a water electrolyzer.
Bdcc 07 00145 g006
Figure 7. Map of Bremen, the area of Neu-Schwachhausen is overlaid by a colored grid representing the annual heat demand per grid cell (Map: OpenStreetMap contributors, heat layer from [44]).
Bdcc 07 00145 g007
Figure 8. Data work flow for an urban digital twin based on [58].
Bdcc 07 00145 g008
Disclaimer/Publisher’s Note: The statements, opinions and data contained in all publications are solely those of the individual author(s) and contributor(s) and not of MDPI and/or the editor(s). MDPI and/or the editor(s) disclaim responsibility for any injury to people or property resulting from any ideas, methods, instructions or products referred to in the content.