Abstract
This paper aims to address the issue of evaluating the operation of electric vehicle charging stations (EVCSs). Previous studies have commonly employed the method of constructing comprehensive evaluation systems, which greatly relies on manual experience for index selection and weight allocation. To overcome this limitation, this paper proposes an evaluation method based on natural language models for assessing the operation of charging stations. By utilizing the proposed SimCSEBERT model, this study analyzes the operational data, user charging data, and basic information of charging stations to predict the operational status and identify influential factors. Additionally, this study compared the evaluation accuracy and impact factor analysis accuracy of the baseline and the proposed model. The experimental results demonstrate that our model achieves a higher evaluation accuracy (operation evaluation accuracy = 0.9464; impact factor analysis accuracy = 0.9492) and effectively assesses the operation of EVCSs. Compared with traditional evaluation methods, this approach exhibits improved universality and a higher level of intelligence. It provides insights into the operation of EVCSs and user demands, allowing for the resolution of supply–demand contradictions that are caused by power supply constraints and the uneven distribution of charging demands. Furthermore, it offers guidance for more efficient and targeted strategies for the operation of charging stations.
1. Introduction
Due to the escalating issues of energy scarcity and environmental pollution, electric vehicles (EVs) have received significant attention due to their advantages of high efficiency, low carbon emissions, and cleanliness. Governments around the world have implemented policies to promote the popularization of EVs. China has implemented the New Energy Vehicle Industry Development Plan (2021–2035). The plan highlights China’s dedication towards implementing a national strategy for the development of new energy vehicles and fostering high-quality growth in the new energy vehicle industry. By the end of 2022, the number of new energy vehicles in China reached 13.1 million, with pure EVs comprising 10.45 million, accounting for 79.78% of the total. However, the number of public and private charging piles was 5.21 million, resulting in a comprehensive vehicle-to-pile ratio of approximately 2.5. Despite a declining trend in this ratio over the years, a significant gap still exists between the number of charging piles and the charging demands. In addition, the inadequate planning of the charging station locations and the insufficient provision of charging piles further aggravate the imbalance between charging supply and demand at specific times or locations. The 2022 White Paper on Charging Behavior of Electric Vehicle Users in China revealed that user satisfaction with the completeness of the charging network construction was only 63.06% [1]. The key factors restricting satisfaction include limited charging network coverage, unreasonable charging station layouts, and inadequate charging piles. In this context, it is imperative to conduct a comprehensive evaluation and optimization of operation strategies for electric vehicle charging stations (EVCSs) to solve the supply–demand dilemma [2].
However, most of the existing charging station operation assessments adopt the methods of constructing multi-criteria decision-making methods and simulation assessment models [3,4]. Through a comparative analysis of the literature, it was found that the multi-criteria decision-making method would be affected by subjective factors such as personal preference during the process of indicator selection and weight determination; meanwhile, it is difficult for the simulation model assessment method to simulate and restore the complex real scene. To address these challenges, this paper proposes an evaluation method with a higher level of automation and better generalization capability. Because large-scale EV charging data is in line with the characteristics of big data, this paper argues that the operation evaluation of charging stations can apply big data processing and analysis methods, which is regarded as a classification task. Because charging station operation assessment is closely related to user charging data [5], charging station operation data [6], and charging station basic data [7], these factors are used as inputs for the data analysis. Furthermore, by recognizing that the operational performance of charging stations may vary, a hierarchical assessment method is employed to measure these differences and capture the fundamental characteristics that are associated with different operational levels. To address these objectives, this paper introduces a comparative learning approach that leverages natural language modeling. Based on the BERT model, the SimCSE method is used to solve the problem of heterogeneity among the charging station assessment indicators and to realize the comprehensive assessment of charging stations and the analysis of influencing factors.
After analyzing the prevailing charging behaviors and charging station operations, we constructed a comprehensive EVCS dataset. Subsequently, the dataset was employed to perform evaluation experiments utilizing a range of natural language models. The experimental results reveal that the BERT model with contrastive learning achieved the highest evaluation accuracy. This may be because the pre-trained models based on bidirectional transformers with complex architecture have a stronger ability to capture long-range dependencies and analyze the dependencies between data. In summary, the contributions of this paper are as follows:
- (1)
- By inputting evaluation indicators into the model in textual form, it is possible to uncover implicit information within the indicators and explore the essential factors that impact the operation of EVCSs.
- (2)
- Based on a series of natural language models, this paper proposes a new evaluation model of EVCSs. The model demonstrates the ability to analyze heterogeneous data, which enhances the automation and intelligence of the operation evaluation of EVCSs.
- (3)
- Compared with other natural language models, the model proposed in this paper exhibits superior evaluation accuracy. It can offer a vital reference for formulating and optimizing the operation strategy of EVCSs.
The rest of the paper is organized as follows: In Section 2, we review the related studies that are guided by the research questions. Section 3 introduces the model design. Then, Section 4 conducts the empirical experiment and presents the experimental results. In Section 5, we conduct the confusion matrix analysis to compare the performance of our proposed model with other models that are commonly used in text classification tasks. Finally, Section 6 concludes this study.
2. Related Work
2.1. Operation Strategy Evaluation of EVCSs
Currently, the evaluation of charging station operation strategies in related studies have primarily employed two methods: the multi-criteria decision-making method and the simulation model evaluation method. The multi-criteria decision-making method involves first identifying evaluation indexes, then determining the weight assigned to each index, and finally scoring the EVCS based on the evaluation system. Various methods can be employed in the process of determining the evaluation indexes, such as literature research, expert interviews, and field research [8]. Similarly, different methods, including the entropy weight method, expert evaluation, analytic hierarchy process, and mixed weighting, can be employed to determine the weight of each index. Moreover, different evaluation methods, such as the gray relational analysis, matter-element extension evaluation model, and data envelopment analysis method, can be utilized in the operation strategy evaluation.
To enhance the objectivity of the evaluation of EVCSs, many studies have employed the multi-criteria decision-making method (MCDM) to construct comprehensive evaluation models [9]. The analytic hierarchy process was used to identify six primary indicators and twenty secondary indicators. After determining the weight of each indicator and the correlation between them using expert scoring, an evaluation system for charging stations was constructed [10]. The entropy weight method was combined with an improved multi-objective particle swarm optimization (MOPSO) algorithm to address the problem of charging station location selection. A set of Pareto-optimal solutions was calculated using the particle swarm optimization algorithm, and the final solution was selected from Pareto-optimal solutions using the entropy weight method [11]. Yan et al. integrated the order relation method, entropy weight method, and improved matter-element extension model to construct a comprehensive evaluation model for EVCSs [3]. In other evaluation scenarios, Xu et al. determined the weight of assessment indicators using the revised integrated weight method, which was evaluated using the gray relational analysis; the authors verified the results using the fuzzy evaluation method, and they ultimately constructed a comprehensive evaluation system [12].
The fundamental steps of the simulation model evaluation method involve initially constructing a simulation model, which is followed by gathering input data for the model. Subsequently, simulation experiments are conducted to simulate the functioning of charging stations under various scenarios. Finally, the operational evaluation of charging stations is accomplished by analyzing the simulation results. A dynamic co-evolution model was developed to assess the relationship between the quantity of regional charging stations and charging demands [13]. Yu et al. presented an EVCS planning and evaluation method that considered the service range [14]. The authors selected constraints and employed the particle swarm optimization algorithm to solve the model. Then, they introduced new evaluation indexes to accomplish the evaluation. Charging stations were evaluated using charging duration and waiting time in the queue. The Monte Carlo method was employed to simulate user behavior according to the queuing model, and charging stations in urban, suburban, and rural areas were analyzed [15]. A comprehensive evaluation model for charging stations was constructed that considered the operator’s profits and waiting time. It was suggested that by establishing appropriate charging prices, the waiting time in the queue can be reduced and the profits of operators can be increased [16].
Furthermore, few studies have integrated deep learning models into the operation strategy evaluation of EVCSs. However, deep learning models have been widely employed in other operation scenarios, such as insales forecasting and marketing audits. These models are trained on historical data and yield precise prediction and user portraits. For example, a reinforcement learning-based deep attention network was introduced to address the challenge of balancing the risk and return in stock trading investment strategies [17]. LSTM networks were employed for financial time series prediction, which predicted the trends of constituent stocks [18]. A deep learning method of collaborative recommender systems (DLCRS) was presented, which significantly improved the performance compared with traditional recommendation algorithms [19]. Based on the contrast learning approach, Wu et al. introduced Contrastive Learning for Sentence Representations (CLEAR), which utilizes a range of sentence-level enhancement strategies to acquire noise-invariant sentence representations [20]. In the domain of sales forecasting, Schmidt et al. employed multiple machine learning models to forecast sales figures for a medium-sized restaurant [21]; Ma et al. employed a deep learning model for an operational promotion task and juxtaposed it against a conventional approach that utilized traditional statistics and econometrics [22]. In order to more visually analyze and compare the existing research methods, a comprehensive comparative analysis table was summarized as shown in the Table 1.

Table 1.
Comparative analysis table of charging operation evaluation methods.
In general, the following limitations remain in the current research on the evaluation of charging station operational strategies: (1) The selection of indicators and determination of weights rely on human expertise, which may introduce individual bias and subjectivity; (2) the evaluation process may involve the participation of experts, EV users, and researchers at various stages, which requires a significant amount of manpower and time costs; (3) in the operation of charging stations, there are complex relationships and interactions among different factors. Traditional evaluation methods are unable to fully explore the underlying connections between these factors; and (4) the inability to accurately replicate complex real-world environments in simulations. With the advancement of deep learning technology, deep learning models have demonstrated impressive performance in various fields. These models have the ability to automatically extract meaningful feature representations from raw data, learn through end-to-end training methods, and adaptively adjust based on the input data features. However, their potential has not been fully utilized in the research of charging station operation strategy evaluation. In this context, this paper presents a contrastive learning-based evaluation method for the evaluation of charging stations, and it integrates the deep learning model with the evaluation strategy. It solves the challenge of comprehensive evaluation caused by index heterogeneity and improves the evaluation accuracy.
2.2. Operation Impact Factors of EVCSs
Previous studies on the operation impact factors of EVCSs reveal that the operation of EVCSs involves a wide range of factors. Consideration should be given not only to various stakeholders, including the operator of the charging station and EV users, but also to government subsidy policies, the technological level, and the external environment. Many studies have discussed the influence of single or multiple factors on the operation of EVCSs. For example, the location of charging stations is related to the entire life cycle of charging stations and will affect many aspects such as capital costs, service levels, and charging demand, thereby affecting the operation of charging stations [23]. Under three different charging infrastructure construction subsidy models (i.e., total investment subsidies, power subsidies, and construction and operation subsidies), the charging service fees and charging station utilization rates are the main factors that affect the operating efficiency of charging stations [24]. Dynamic pricing strategies can affect users’ charging behavior and stimulate the optimization of power grid load distribution, thereby improving the safety and stability of power grids during the operation of charging stations [25]. Dynamic pricing strategies can also improve the operating efficiency of charging stations [26]. Safety management is one of the impact factors in the operation of charging stations [27]. Effective risk control can maintain network security at the lowest cost and reduce economic losses caused by risks. Charging monitoring systems also have an important impact on the operation of charging stations [28]. Han et al. established an objective function to estimate the maximum net benefit of the charging station [29]. The objective function considered parameters such as charging price, charging service charge, subsidy income, initial investment cost, and operation and maintenance cost. Zenginis et al. evaluated the operation performance of charging stations based on the operator’s profits and customers’ waiting time in the queue [16].
Furthermore, several studies have conducted a comprehensive and systematic analysis of the impact factors and their interdependencies. The key factors affecting the operation of charging stations were divided into direct and indirect factors, and the interaction between them was analyzed [30]. Among them, the direct factors include the charging demand, charging price, maintenance cost, electricity price, and location, among other factors. The indirect factors include battery technology, technologies of the charging infrastructure, policies on plug-in electric vehicles (PEVs), and more. A multilevel hierarchical system of impact factors was constructed using the Delphi method [31]. The top-level factors encompass charging price, gasoline price, electric vehicle battery, reliability of power supply, and spare parts management. The second-level factors encompass the charging monitoring system and safety management. The third level encompasses the charging station’s address, charging station’s scale, regional power grid situation, government policy, and more. The fourth level is the number of electric vehicles, which represents the most basic factor influencing the operation of EVCSs.
In general, the operation impact factors of EVCSs are inherently complex and diverse with varying degrees of impact. A comprehensive understanding and consideration of these factors can aid operators and policymakers in optimizing the operational effectiveness.
2.3. Text Classification Model
Text classification is an important task in natural language processing, and it aims to assign text data to a fixed number of predefined categories. The earliest methods include the naive Bayes classifier, support vector machine, decision tree classifier, maximum entropy model, and more. In recent years, with the development of deep learning, neural network models have a remarkable performance in text classification tasks.
TextCNN utilizes convolutional and pooling layers to capture local features from text [32]. This method offers the advantages of a simple structure, ease of implementation, and the ability to deal with short text data. However, its performance diminishes when confronted with longer text sequences. TextRNN utilizes RNN to process sequential data [33]. It offers the advantage of being able to process longer text sequences. However, it is constrained by the structure of RNN and has the vanishing gradient and gradient explosion problem when processing long sequences. TextRNN Attention introduces the attention mechanism based on the TextRNN model, allowing for adaptive focus on different parts of the input sequence [34]. The advantage of TextRNN Attention is that it can effectively capture key information when dealing with long text data despite its high computational complexity. FastText utilizes character-based n-grams to learn word embeddings and a linear classifier for text classification [35]. It stands out for its fast-training speed and effectiveness with larger text datasets, although its performance diminishes when dealing with long text data. DPCNN employs a deep pyramid structure to enhance feature extraction and representation capabilities [36]; it performs admirably when processing lengthy text data. Its advantage lies in it capturing local and global features at multiple scales, which allow it to perform well when dealing with long text data. TextRCNN utilizes both RNN and CNN to process text data, which allow for the simultaneous capture of contextual information and local features in the text [33]. It is capable of handling long text data but entails high computational complexity. Transformers utilize the self-attention mechanism and positional encoding to encode an input sequence [37]. They demonstrate excellent performance in dealing with long text data. However, this method requires larger models and training datasets. BERT employs bidirectional transformer encoders, pre-trained technology to learn the contextual information, and fine-tuning technology to adapt to different text classification tasks [38]. BERT’s advantage is its competence for various complex text classification tasks and its favorable processing performance.
2.4. Contrastive Learning
Contrastive learning is a method that is aimed at enhancing the quality of representation learning by learning the differences between samples. It was initially proposed in the field of computer vision, and the early research was primarily based on the context of descriptive geometry. Later on, contrastive learning was introduced into neural networks. Hadsell et al. proposed momentum contrast, a simple contrastive learning framework, and performed experiments on multiple computer vision datasets [39]. Typical contrastive learning methods such as the simple framework for contrastive learning of visual representations [40], bootstrap your own latent, swapping assignments between multiple views of the same image [41], and simple Siamese networks [42] are based on the Siamese neural network architecture. Deep contrastive learning compares and calculates a large number of positive and negative samples, which further enhances the feature extraction capability of the neural network model. Contrastive predictive coding [43] serves as the fundamental work of deep contrastive learning, and the proposed InfoNCE loss has found extensive utilization in contrastive learning research. Gunel et al. [44] proposed the supervised contrastive learning loss, which extends the idea of contrastive learning to supervised learning. Chen et al. designed a semi-supervised contrastive learning algorithm and transferred knowledge of the pre-trained model to the new model using distillation learning [45]. Qi et al. proposed a self-supervised reinforcement learning method that was aimed at optimizing fuel efficiency in hybrid electric vehicles [46]. This method exhibits accelerated training convergence and lower fuel consumption compared with conventional strategies, allowing for a near-global optimum fuel economy under the newly proposed driving cycle. Corinaldesi C et al. introduced an optimization algorithm to enhance electric vehicle and stationary battery storage [47]. Furthermore, the authors applied this method to a real case scenario, utilizing measured data and demonstrating the effectiveness of a linear relationship.
Contrastive learning has gained widespread adoption in the field of computer vision. For instance, contrastive learning is employed to learn feature representations with strong generalization performance from extensive unlabeled data; this process is known as self-supervised contrastive learning [40]. Moreover, contrastive learning can enhance both the accuracy and robustness of models in tasks such as object detection and image segmentation. In the field of natural language processing, contrastive learning can be used to learn the similarity between words, sentences, or documents, thereby enhancing the semantic comprehension capability of models. In the field of recommendation systems, contrastive learning can be utilized to learn the similarity between users and items, thus improving the recommendation accuracy of recommendation systems.
In view of the success of contrastive learning in many fields, this paper intends to further construct a better operation evaluation method of EVCSs through contrastive learning.
3. Materials and Methods
Deep learning models can emulate human rating thinking, comprehend the underlying meaning of each evaluation index, and then accomplish the task of the comprehensive grade evaluation of heterogeneity indexes. However, applying deep learning models to the field of EVCS grade evaluation encounters the following problems:
- Input standardization problem: Deep learning models require standardized input forms, whereas evaluation indexes manifest in diverse types and forms. The first problem we intend to solve is how to reconcile different types of evaluation indexes into the format required for the deep learning model without losing their original meaning.
- Index comprehension problem: Given the multitude of evaluation indexes in terms of both the quantity and type, each index possesses distinct modes of understanding. Consequently, the evaluation index comprehension is the second problem we intend to address.
- Comprehensive grade evaluation problem: In view of the heterogeneity of different types of evaluation indexes, it is a significant challenge to comprehensively investigate different indexes, distinguish the characteristics of index data of different charging stations, and ultimately attain precise evaluation results. This is the third problem we intend to solve.
Addressing the aforementioned three crucial issues, we have devised solutions for each. Firstly, we designed a text normalization-based input method. Next, we developed a comprehensive grade evaluation model leveraging the bidirectional self-attention mechanism. Lastly, we introduced an evaluation model training approach that uses contrastive learning and multiple impact factors. Building upon these advancements, we present SimCSEBERT, an evaluation model that incorporates bidirectional self-attention and contrastive learning and allows for a comprehensive grade evaluation of EVCSs.
3.1. Text Normalization-Based Input Method
During the comprehensive evaluation of EVCSs, the evaluation index dataset D comprises two components: the evaluation index attribute set and the attribute value set , where and is the mapping between the attributes and their respective values. Due to the diversity of evaluation index attributes, the attribute values that are associated with different attributes exhibit significant variations. For instance, charging quantity is typically expressed as a numerical value, whereas opening hours is denoted as a period. Therefore, we chose to utilize the text form to ensure a consistent representation of the different features of various evaluation indexes. This approach offers the advantages of making full use of the richness of language expression and preserving the implicit information in the original evaluation indexes to the maximum extent.
To enhance the model’s comprehension of the correspondence between attributes and attribute values in the text representation, we normalized the text language by employing the “evaluation index attribute-attribute value” key-value pair. Specifically, we expressed the evaluation index dataset D as a sequence of text key-value pairs , where each text key-value pair is represented as follows:
where represents the attribute name of the i key-value pair and represents the attribute value of the i key-value pair. Table 2 displays examples of inputs for evaluation indicators.
Table 2.
The example of an evaluation index input.
All text key-value pairs are delineated by commas to form a comprehensive text sequence:
This text representation offers the advantage of a consistent representation of different characteristics of different evaluation indexes. It can utilize the richness of language expression to maximize the retention of implicit information from the original evaluation indexes. In addition, the utilization of text key-value pairs allows the model to enhance its comprehension of the correspondence between attribute names and attribute values, thereby facilitating a more precise capture of the meaning underlying the indexes. In other words, the utilization of text key-value pairs enhances the model’s semantic interpretation ability, consequently improving both its accuracy and interpretability.
3.2. Comprehensive Grade Evaluation Model Based on Bidirectional Self-Attention Mechanism
Given the multitude of evaluation attribute inputs, the model necessitates robust language comprehension capability. The bidirectional self-attention mechanism allows the model to comprehend the contextual relationship of the index text input and focus on the strengths and weaknesses of each index. In pursuit of this objective, we intended to employ BERT, a typical pre-trained model, as the comprehension model to extract features from the evaluation index data text and transform them into high-dimensional feature representations.
BERT is a pre-trained language model based on the Transformer structure. As a well-known model in natural language processing, it has the following advantages:
Contextual understanding: BERT is a pre-trained language model with powerful contextual understanding capabilities. By learning from a large corpus of text data, it captures the associations between words and sentences, allowing for the better comprehension and handling of charging station-related factors.
Pre-training advantage: BERT’s pre-training on a large-scale corpus allows it to develop rich language representations. This allows it to better analyze the underlying logical relationships in the text of factors for charging station evaluations. BERT provides contextual representations that enhance the accuracy and prediction capabilities in this domain.
Transfer learning capability: After pre-training, BERT can be fine-tuned for specific tasks. This transfer learning ability allows it to adapt better to charging station evaluations with minimal labeled data. This approach saves labor and time while improving the accuracy and efficiency of the evaluation process.
Multi-domain applicability: BERT has demonstrated excellent performance across different domains, which allows it to be used for charging station evaluation. BERT serves as a robust foundation for modeling.
After acquiring a text sequence, the model converts each word into embedding vectors and consolidates them into an embedding matrix, which serves as the input of the model. Specifically, the BERT model processes the input text sequence to obtain token embedding, segment embedding, and position embedding for each word. These are subsequently added to yield the final embedding vector. The representation of the input text and three embeddings is shown in Figure 1.
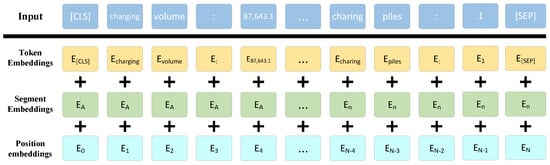
Figure 1.
The process of text input into the BERT model.
Token embedding represents the semantic information of each word. They map each word to a vector representation through an embedding layer. Assuming a vocabulary size of V, with each word being represented by a one-hot vector, the token embedding matrix is defined as:
where represents the embedding vector of i word and d represents the dimension of the embedding vector.
Segment embedding represents different paragraph information in the input text; its purpose is to differentiate between different sentences or paragraphs in the input text. In the BERT model, the input sequence typically comprises multiple sentences or paragraphs. The inclusion of segment embedding allows the model to distinguish different sentences or paragraphs more effectively. Assuming there are S unique paragraphs in the input sequence, the segment embedding matrix is defined as:
where represents the embedding vector of i paragraph.
Position embedding represents the position information of each word in the sequence. It can assist the model in better comprehending the order of information in the input sequence. In the BERT model, the position embedding of each word is calculated by a position encoder. Assuming the length of input sequence is L, the position embedding matrix is defined as:
where represents the position embedding vector of i word, which is calculated by the position encoder:
where represents the original position embedding vector of i position; j represents the dimension of the position embedding vector; and k represents the layer of the position embedding vector. In the BERT model, the position encoder employs a combination of sine and cosine functions, which enhances the model’s ability to learn the position information in the input sequence.
The embedding matrix that is obtained by summing the token embeddings, segment embeddings, and position embeddings can be expressed as:
where L represents the length of the input sequence and d represents the dimension of the embedding vector.
This input structure enhances the model’s representation ability by effectively representing the semantic information of text sequences. Given the consideration of multiple evaluation indexes and the diverse perspectives on comprehensive scores, refined scoring is impractical. Therefore, we chose grade evaluation as the method for the comprehensive evaluation. To achieve a grade evaluation of the model, we intended to employ the method of text classification by connecting two linear layers, a multi-classification layer and a multi-label classification layer, in the output section of the BERT model. Specifically, the output of the multi-classification layer is the evaluation grade category of the EVCS, whereas the output of the multi-label layer is the impact factor category. The detailed framework is shown in Figure 2.
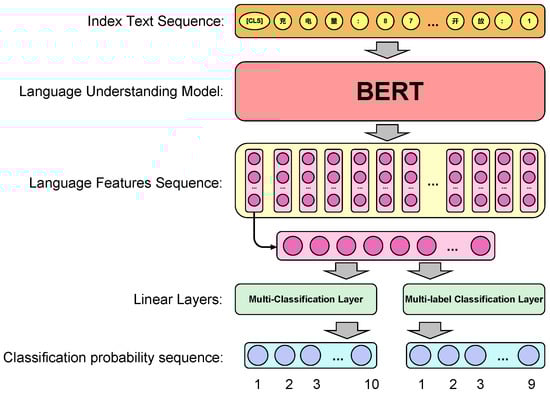
Figure 2.
The comprehensive grade evaluation model based on the bidirectional self-attention mechanism (The meaning of the Chinese character in “Index Text Sequence” is: “Charge: 87,643.1, …, Open: 1”).
3.3. Evaluation Model Training Method Based on Contrastive Learning and Multiple Impact Factors
The evaluation indexes for charging stations are heterogeneous. To address the challenge of comprehensive evaluation that is caused by index heterogeneity, we proposed employing contrastive learning. This approach allows the model to compare and analyze the differences between feature representations of evaluation indexes for different grades and uncover the underlying patterns across various grade classifications. In addition to simply predicting the evaluation indexes based on EV charging data, we incorporated a framework for predicting the “impact factor”, which could identify the main impact factors that significantly impact the evaluation of EVCSs. The main impact factors vary among different charging stations. For instance, users in urban areas prioritize charging stations with superior services and features, whereas remote locations give more importance to the location.
SimCSE is a straightforward and efficient method for the contrastive learning of sentence embeddings [48]. The main idea is to learn the embedded representation of sentences by contrasting similar and dissimilar sentences. Specifically, this method aims to acquire a compact and semantically rich representation of evaluation indexes by maximizing the similarity among synonymous sentences and minimizing the similarity among non-synonymous sentences.
Specifically, the contrastive learning method extends the original BERT evaluation model’s single evaluation index text input from to , where represents similar evaluation index text input and represents dissimilar evaluation index text input.
where represents the evaluation probability vector of ; represents the BERT evaluation model.
To achieve training for the classification and contrasting of the evaluation model, we adopted two loss calculation methods: cross-entropy loss and contrastive learning loss. The cross-entropy loss is calculated by:
where M represents the grade category count; P represents the grade predicted value; and Q represents the grade true value. The contrastive learning loss is calculated by:
where N represents a small batch sample size; represents the temperature coefficient; and represents the cosine similarity calculation function. In addition to contrastive learning and the basic evaluation classification task, we incorporated the objective of multi-label classification for the impact factors. Each input text sequence would be associated with an impact factor with multiple labels. The loss function that is commonly used for multi-label classification problems is binary cross-entropy. Assume that there are N samples, each with K labels, where the true value of label k is and the predicted value from the model output is . Therefore, the binary cross-entropy loss function can be formulated as:
where the first term represents the loss of the positive sample and the second term represents the loss of negative sample; log represents the natural logarithm.
This loss function means that, for each sample, the gap between the predicted value and the true value for each label is calculated, and then the gap is averaged across all labels. The loss function equals 0 when the predicted and true value are perfectly aligned; conversely, a large gap between the predicted and true value results in a large loss function. Finally, during the model loss calculation process, we combined the classification cross-entropy loss, contrastive learning loss, and binary cross-entropy classification loss to derive the final function, which is as follows:
where represents the cross-entropy loss function; represents the multi-label classification loss function with a boundary; and and represent two different linear layers.
3.4. Bidirectional Self-Attention Evaluation Model Based on Contrastive Learning
The SimCSEBERT model is a general contrastive learning evaluation model that is based on the text input, the general language model BERT, and the contrastive learning method SimCSE. To address the issue of heterogeneity among evaluation indexes, the SimCSEBERT model employs the BERT model to conduct representation learning on the evaluation index text. Furthermore, it utilizes a simple linear layer to convert the evaluation representation into a grade probability sequence. Subsequently, the SimCSEBERT model uses the contrastive learning method for training, in which the grade probability sequences of similar data and dissimilar data are used as references. Simultaneously, by incorporating real label data, the model calculates its loss and subsequently performs backward propagation to adjust the model parameters. This iterative process facilitates the training and evaluation of the model. Specifically, the training process of the SimCSEBERT model is shown in Figure 3.
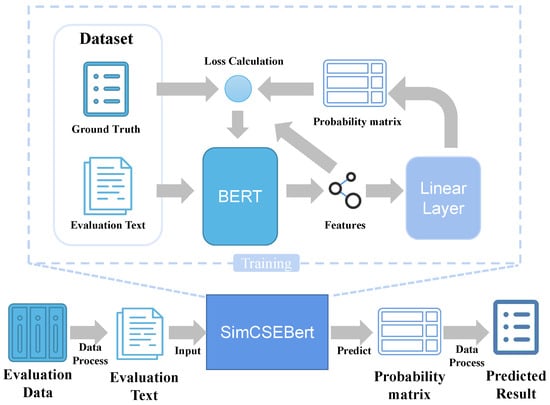
Figure 3.
The flowchart of SimCSEBERT.
Firstly, representation learning is conducted on the evaluation index text:
where represents the i evaluation index text; represents its representation vector.
Then, the representation vector is transformed into a grade probability sequence using a linear layer:
where W and b represent the weight and bias of the linear layer; represents the grade probability sequence of the i evaluation index.
Subsequently, the SimCSEBERT model employs a contrastive learning method to train the model. Specifically, for each evaluation index, we randomly selected a similar evaluation index and a dissimilar evaluation index and calculated their grade probability sequences, respectively:
where j represents the similar evaluation index; k represents the dissimilar evaluation index; and and represent their representation vectors, respectively.
Next, the SimCSEBERT model calculates the difference between the grade probability sequences of similar and dissimilar data as the loss function and combines it with the cross-entropy classification loss and binary cross-entropy classification loss:
where N represents the evaluation index count.
The prediction process of the SimCSEBERT model is straightforward, where the final grade prediction is determined by maximizing the grade prediction probability:
where M represents the grade count; represents the j garde’s prediction probability of the i evaluation index.
The flowchart of the SimCSEBERT model is shown in Figure 3. The SimCSEBERT model exhibits high accuracy and interpretability.
4. Experiment and Results
4.1. Data Collection and Processing
During the data collection phase, we collected equipment and operation information from Wuhan State Grid charging stations along with partial data on the user charging behavior between the first and second quarters of 2021 and the first quarter of 2022. By integrating user charging data, we obtained charging information for a total of 97 State Grid charging stations over a period of 271 days, which resulted in a cumulative count of 26,287 records.
In the data processing phase, we employed various evaluation criteria for manual grade evaluation, including the daily charging volume, charging fee, service fee, and average user charging percentage, as well as location, surrounding charging stations, and opening hours of each charging station. The grading scale ranged from 1 to 10. Furthermore, we incorporated the main impact factors of each charging station as indexes for multi-label classification. For example, factors such as fast charging have a significantly larger influence in urban centers compared with suburban areas that have limited charging stations. We treated the daily charging information text of each charging station, along with its associated grade and relevant impact factors, as a unit sample to construct the training and evaluation datasets.
4.2. Baseline Models
The grade evaluation process for EVCSs can be viewed as a text classification task. To tackle this challenge, we selected widely used text classification models as baseline models, including the TextCNN, TextRNN Attention, TextRCNN, FastText, DPCNN, self-attention model Transformer, and BERT models.
TextCNN is a CNN-based model that utilizes multiple convolutional kernels to extract features of different lengths, which effectively captures local information in the text. It offers high computing efficiency and performs well in certain text classification tasks.
BiLSTM is a model that is based on RNN. It is capable of processing variable-length sequence data and capturing long-term dependencies in the sequence. TextRNN is a fundamental BiLSTM model. TextRNN Attention integrates the attention mechanism to augment the model’s representational capability. TextRCNN leverages the advantages of LSTM and CNN [33]; it utilizes bidirectional LSTM for extracting sequence features and subsequently captures global information from the text through pooling and concatenation operations.
FastText is a rapid text classification model that relies on both the bag-of-words model and n-gram model, and it demonstrates commendable performance in certain tasks.
DPCNN is a deep text classification model based on CNN that captures multi-level information in the text by utilizing multiple convolutional and pooling layers, and it achieves efficient text classification.
Transformer is a neural network model that utilizes a self-attention mechanism and has shown remarkable performance in machine translation and text classification tasks. The Transformer model computes relationships between different positions in the text by using the self-attention mechanism.
BERT, a pre-trained language model based on Transformer, has achieved significant success in NLP by learning language representations through a combination of pre-training and fine-tuning processes. It demonstrates good performance in text classification tasks and other domains.
4.3. Experimental Results
According to the experimental results presented in Table 3, the SimCSEBERT and BERT models achieved high accuracy in both the evaluation and impact factor analysis tasks, with both exceeding values of 0.9 and significantly surpassing other models.
Table 3.
The comparison of each model’s accuracy.
Particularly, the SimCSEBERT model achieved the highest accuracy in both tasks with scores of 0.9464 and 0.9492, respectively, which were considerably higher than those obtained by other typical text classification models. These results indicate that SimCSEBERT has outstanding performance and holds significant potential in the domains of the performance evaluation and main impact factor analysis of EVCSs. Furthermore, both the SimCSEBERT and BERT models, which are based on pre-trained techniques, exhibited remarkable performance compared with other models. This superiority could be attributed to the adoption of a transfer learning strategy in the pre-trained models of BERT and SimCSEBERT. By undergoing pre-training on extensive corpora, these models acquire comprehensive language knowledge, which is then fine-tuned for specific tasks. This strategy allows the models to leverage the knowledge acquired during pre-training and enhance their performance on downstream tasks, demonstrating the advantages of employing the transfer learning strategy. Moreover, it establishes the significant research value of such methods in the field of EVCS evaluation and analysis. SimCSEBERT, compared with the original BERT model, exhibits superior performance due to the incorporation of a contrastive learning method. This outcome validates the effectiveness of contrastive learning in capturing similarities and dissimilarities among various evaluation indexes of EVCSs, thereby enhancing the overall model performance.
5. Comparisons and Discussion
To further analyze the details of the comprehensive evaluation of each model for EVCSs, we conducted the confusion matrix analysis of each model in the evaluation task. Additionally, we performed the analysis of precision, recall, and F1 score in the impact factor analysis task.
5.1. Confusion Matrix Analysis
Through the confusion matrix analysis of each model evaluated in Figure 4, we found the outstanding performance of SimCSEBERT in the evaluation process.
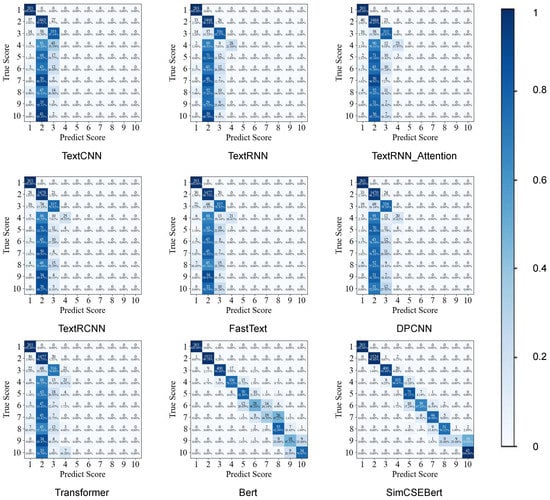
Figure 4.
The confusion matrix of each model. Thevertical axis represents the true value, the horizontal axis represents the predicted value, and the depth of the cell represents the level of the predicted hit rate. The deeper the cell is, the higher the hit rate is, and vice versa.
Specifically, SimCSEBERT accurately hit the target evaluation values in the majority of evaluations. Even in cases of certain deviations, the deviations were mostly within the range of the target evaluation values, with variations of not more than one grade. Upon scrutinizing the confusion matrix, the other models, except for BERT and SimCSEBERT, demonstrated relatively accurate evaluations solely for the first three categories. This occurrence stemmed from the imbalanced distribution of data, with the dataset primarily consisting of data from these three categories [49]. In dealing with imbalanced, multi-label classification problems, traditional natural language processing algorithms often struggle to fully capture the deep semantic information of samples, which leads to the identification of only the most frequent categories within the sample set. However, the BERT model, based on its larger architecture and semantic learning approach using bidirectional attention mechanisms, exhibits strong generalization capabilities, even with limited sample data. SimCSEBERT and BERT exhibited a higher overall proportion of correctly hit grades, which mostly could hit the correct grade accurately. This result indicates the relatively superior ability of these kinds of pre-trained models in mitigating the challenges posed by imbalanced data distribution. Notably, SimCSEBERT had an improvement in the overall hit rate compared with BERT. These findings show that SimCSEBERT is capable of superior adaptability to the evaluation scope, heightened evaluation accuracy, and an effective utilization of contrastive learning to comprehend the similarity between text pairs.
In comparison witho the BERT model, SimCSEBERT possesses the advantage of leveraging a larger volume of data for learning, thereby enhancing the model’s generalization capability. The incorporation of the contrastive learning method allows for the exploration of similarities across diverse text pairs. It leads to the acquisition of more comprehensive and precise representations. Consequently, SimCSEBERT can make better use of the information in data, better adapt the evaluation range, and improve the evaluation accuracy. The results of the confusion matrix experiments for each model are individually detailed in Appendix A.
5.2. Performance Comparison of Each Model in the Impact Factor Analysis Task
Table 4 illustrates the comparative experimental results of each model in the main impact factor analysis task. From the table, it can be observed that, except for SimCESBERT and BERT, the other models only demonstrated satisfactory analytical performance for factors 1, 2, 3, and 6; however, they encountered challenges when attempting to accurately analyze the remaining factors. This limitation could be attributed to the infrequent occurrence of these factors in the dataset and the imbalanced distribution of positive and negative samples. In contrast, SimCSEBERT and BERT exhibited superior adaptability to such imbalanced distributions. These results indicate the models’ ability to effectively learn the underlying relationships between these less frequent factors and the corresponding grade evaluation rules. The comparative analysis between SimCSEBERT and BERT reveals that SimCSEBERT outperforms BERT in predicting various factors, thereby highlighting the efficacy of contrastive learning.
Table 4.
The comparison of model performance in impact factor analysis tasks. Nan represents that the model has never predicted this impact factor. Impact factors 1–9 represent the “number of fast charging piles”, “number of slow charging piles”, “payment method”, “charging fee”, “service fee”, “opening hours”, “charging volume”, “charging percentage”, and “number of low-battery-EVs in the vicinity”, respectively.
5.3. Practical Implications
This paper demonstrates that analyzing charging station operation data through natural language models can accurately predict charging station operation and impact factors and provide insights for operation evaluation. The prediction results can assist practitioners or policymakers in the field of EVCSs to better understand the operations. Based on our findings, we propose the following recommendations for practitioners or policymakers:
- (1)
- The operation evaluation and impact factor analysis can provide valuable information to policymakers. The insights gained from this analysis can guide policy decisions that are related to the expansion of charging infrastructure and the promotion of electric vehicle adoption. Policymakers can use this information to develop targeted policies and incentives that support the growth of charging infrastructure.
- (2)
- Different charging stations are affected by different impact factors, and their operational strategy design would also be different. The results of our impact factor analysis can provide a directional reference for practitioners or policymakers to design and optimize operational strategies. For instance, through the impact factor analysis, it was found that service fee is the main factor affecting the operation of a certain charging station. Practitioners can use this information to design pricing strategies that incentivize optimal usage patterns, thus improving the economic benefits of this charging station.
6. Conclusions
Through the in-depth exploration of the operation of EVCSs, we constructed an EVCS dataset. Next, we utilized NLP models to learn and analyze charging data, and we achieved a grade evaluation of EVCSs and an analysis of the main impact factors.
This paper innovatively applies deep learning-based NLP models to the field of EVCSs operation. By analyzing the charging data using natural language models and by incorporating contrastive learning, we predicted the operation performance. This approach facilitates the evaluation of their operation status and the identification of the main impact factors. The experimental results show that the BERT model, which incorporates contrastive learning, achieves superior evaluation and analysis accuracy. This exploration of EVCSs operation problems holds significant importance, and the methods and technologies employed have broad application prospects. By employing NLP technology for the analysis and prediction of charging data, a comprehensive understanding of market demands and user preferences can be acquired. This technology facilitates operators in developing more effective and targeted strategies for operating EVCSs. Additionally, the NLP models utilized in this paper can be extended to tackle marketing challenges in diverse business domains.
In conclusion, this study provides a new insight and method to address EVCS operation problems. Furthermore, it serves as a practical case for the application of NLP models in the business domain within the field of deep learning. It is expected that this research will inspire researchers in relevant fields and make a valuable contribution to the growth and dissemination of the market of EVCSs.
Regarding the limitations of this study, on the one hand, we did not fully access the comprehensive feature information about the charging station operations, such as incorporating environmental data; the analysis of influencing factors could be more insightful with the inclusion of this data. On the other hand, in terms of model selection, this paper did not assess the experimental effectiveness of large-scale language models (e.g., ChatGPT) in the field of charging station operation evaluation. For future research, we plan to incorporate more relevant information about charging stations to comprehensively evaluate and analyze the factors influencing the operational effectiveness of charging stations. These factors may include the proximity and congestion of traffic around the charging stations, the distribution of commercial and residential areas nearby, the branding of the charging stations, and the rate of facility malfunctions. Additionally, we intend to explore the application of large-scale language models in such evaluative tasks. For instance, we aim to use the ChatGPT model to extract feature factors and leverage the model’s understanding of general knowledge to enhance its comprehension of feature semantics, thereby improving the model’s performance.
Author Contributions
Conceptualization, Z.-Y.T.; methodology, Q.-B.H. and Y.-B.C.; software, L.H., Q.-B.H. and Y.-W.L.; validation, Y.-B.C. and Y.-J.L.; formal analysis, L.H.; investigation, Y.-W.L.; resources, Z.-Y.T.; data curation, Q.-B.H.; writing—original draft preparation, Z.-Y.T.; writing—review and editing, Q.-B.H.; visualization, L.H.; supervision, Y.-B.C.; project administration, Y.-J.L.; funding acquisition, Z.-Y.T. All authors have read and agreed to the published version of the manuscript.
Funding
This work was funded by the National Natural Science Foundation of China (72074171), and the State Grid Hubei Electric Power Co., Ltd. (B3153221001D).
Data Availability Statement
Not applicable.
Conflicts of Interest
The authors declare no conflict of interest.
Appendix A

Figure A1.
The confusion matrix of TextCNN (L) and TextRNN (R).

Figure A2.
The confusion matrix of TextRNN_Attention (L) and TextRCNN (R).

Figure A3.
The confusion matrix of FastText (L) and DPCNN (R).

Figure A4.
The confusion matrix of Transformer (L) and BERT (R).

Figure A5.
The confusion matrix of SimCSEBERT.
References
- The 2022 White Paper on Charging Behavior of Electric Vehicle Users in China. Available online: https://xueqiu.com/S/SH516590/243818840 (accessed on 12 February 2023).
- He, L.; He, J.; Zhu, L.; Huang, W.; Wang, Y.; Yu, H. Comprehensive evaluation of electric vehicle charging network under the coupling of traffic network and power grid. PLoS ONE 2022, 17, e0275231. [Google Scholar] [CrossRef]
- Yan, Q.; Dong, H.; Zhang, M. Service evaluation of electric vehicle charging station: An application of improved matter-element extension method. Sustainability 2021, 13, 7910. [Google Scholar] [CrossRef]
- Carra, M.; Maternini, G.; Barabino, B. On sustainable positioning of electric vehicle charging stations in cities: An integrated approach for the selection of indicators. Sustain. Cities Soc. 2022, 85, 104067. [Google Scholar] [CrossRef]
- Almaghrebi, A.; Aljuheshi, F.; Rafaie, M.; James, K.; Alahmad, M. Data-driven charging demand prediction at public charging stations using supervised machine learning regression methods. Energies 2020, 13, 4231. [Google Scholar] [CrossRef]
- Powell, S.; Cezar, G.V.; Apostolaki-Iosifidou, E.; Rajagopal, R. Large-scale scenarios of electric vehicle charging with a data-driven model of control. Energy 2022, 248, 123592. [Google Scholar] [CrossRef]
- Hasan, K.N.; Preece, R.; Milanović, J.V. Probabilistic Modelling of Electric Vehicle Charging Demand based on Charging Station Data. In Proceedings of the 2022 17th International Conference on Probabilistic Methods Applied to Power Systems (PMAPS), Manchester, UK, 12–15 June 2022; pp. 1–6. [Google Scholar]
- Karolemeas, C.; Tsigdinos, S.; Tzouras, P.; Nikitas, A.; Bakogiannis, E. Determining electric vehicle charging station location suitability: A qualitative study of greek stakeholders employing thematic analysis and analytical hierarchy process. Sustainability 2021, 13, 2298. [Google Scholar] [CrossRef]
- Zhang, L.; Zhao, Z.; Yang, M.; Li, S. A multi-criteria decision method for performance evaluation of public charging service quality. Energy 2020, 195, 116958. [Google Scholar] [CrossRef]
- Sun, Y.; Wang, J.; Li, C.; Liu, K. Competitiveness Evaluation of Electric Bus Charging Services Based on Analytic Hierarchy Process. World Electr. Veh. J. 2022, 13, 81. [Google Scholar] [CrossRef]
- Liu, Q.; Liu, J.; Liu, D. Intelligent multi-objective public charging station location with sustainable objectives. Sustainability 2018, 10, 3760. [Google Scholar] [CrossRef]
- Xu, Q.; Xu, K. Mine safety assessment using gray relational analysis and bow tie model. PLoS ONE 2018, 13, e0193576. [Google Scholar] [CrossRef]
- Hayajneh, H.S.; Zhang, X. Evaluation of electric vehicle charging station network planning via a co-evolution approach. Energies 2019, 13, 25. [Google Scholar] [CrossRef]
- Yu, R.; Gao, Z.; Chen, Z.; Liu, D.; Wang, C.; Hu, Q.; Wu, Y.; Wang, Y. Planning and Evaluation of Electric Vehicle Charging Stations Considering the Service Range. In Proceedings of the 2021 IEEE/IAS Industrial and Commercial Power System Asia (I&CPS Asia), Chengdu, China, 18–21 July 2021; pp. 953–957. [Google Scholar]
- Ucer, E.; Koyuncu, I.; Kisacikoglu, M.C.; Yavuz, M.; Meintz, A.; Rames, C. Modeling and analysis of a fast charging station and evaluation of service quality for electric vehicles. IEEE Trans. Transp. Electrif. 2019, 5, 215–225. [Google Scholar] [CrossRef]
- Zenginis, I.; Vardakas, J.; Zorba, N.; Verikoukis, C. Performance evaluation of a multi-standard fast charging station for electric vehicles. IEEE Trans. Smart Grid 2017, 9, 4480–4489. [Google Scholar] [CrossRef]
- Wang, J.; Zhang, Y.; Tang, K.; Wu, J.; Xiong, Z. Alphastock: A buying-winners-and-selling-losers investment strategy using interpretable deep reinforcement attention networks. In Proceedings of the 25th ACM SIGKDD International Conference on Knowledge Discovery & Data Mining, New York, NY, USA, 25 July 2019; pp. 1900–1908. [Google Scholar]
- Fischer, T.; Krauss, C. Deep learning with long short-term memory networks for financial market predictions. Eur. J. Oper. Res. 2018, 270, 654–669. [Google Scholar] [CrossRef]
- Aljunid, M.F.; Dh, M. An efficient deep learning approach for collaborative filtering recommender system. Procedia Comput. Sci. 2020, 171, 829–836. [Google Scholar] [CrossRef]
- Wu, Z.; Wang, S.; Gu, J.; Khabsa, M.; Sun, F.; Ma, H. Clear: Contrastive learning for sentence representation. arXiv 2020, arXiv:2012.15466. [Google Scholar]
- Schmidt, A.; Kabir, M.W.U.; Hoque, M.T. Machine learning based restaurant sales forecasting. Mach. Learn. Knowl. Extr. 2022, 4, 105–130. [Google Scholar] [CrossRef]
- Ma, L.; Sun, B. Machine learning and AI in marketing–Connecting computing power to human insights. Int. J. Res. Mark. 2020, 37, 481–504. [Google Scholar] [CrossRef]
- Hosseini, S.; Sarder, M. Development of a Bayesian network model for optimal site selection of electric vehicle charging station. Int. J. Electr. Power Energy Syst. 2019, 105, 110–122. [Google Scholar] [CrossRef]
- Yang, M.; Zhang, L.; Dong, W. Economic benefit analysis of charging models based on differential electric vehicle charging infrastructure subsidy policy in China. Sustain. Cities Soc. 2020, 59, 102206. [Google Scholar] [CrossRef]
- Moghaddam, Z.; Ahmad, I.; Habibi, D.; Masoum, M.A. A coordinated dynamic pricing model for electric vehicle charging stations. IEEE Trans. Transp. Electrif. 2019, 5, 226–238. [Google Scholar] [CrossRef]
- Wolbertus, R.; Gerzon, B. Improving electric vehicle charging station efficiency through pricing. J. Adv. Transp. 2018, 2018, 4831951. [Google Scholar] [CrossRef]
- Wang, B.; Dehghanian, P.; Wang, S.; Mitolo, M. Electrical safety considerations in large-scale electric vehicle charging stations. IEEE Trans. Ind. Appl. 2019, 55, 6603–6612. [Google Scholar] [CrossRef]
- García-Triviño, P.; Torreglosa, J.P.; Fernández-Ramírez, L.M.; Jurado, F. Control and operation of power sources in a medium-voltage direct-current microgrid for an electric vehicle fast charging station with a photovoltaic and a battery energy storage system. Energy 2016, 115, 38–48. [Google Scholar] [CrossRef]
- Han, X.; Liang, Y.; Ai, Y.; Li, J. Economic evaluation of a PV combined energy storage charging station based on cost estimation of second-use batteries. Energy 2018, 165, 326–339. [Google Scholar] [CrossRef]
- Zhang, Q.; Li, H.; Zhu, L.; Campana, P.E.; Lu, H.; Wallin, F.; Sun, Q. Factors influencing the economics of public charging infrastructures for EV–A review. Renew. Sustain. Energy Rev. 2018, 94, 500–509. [Google Scholar] [CrossRef]
- Liang, Y.; Wang, H.; Zhao, X. Analysis of factors affecting economic operation of electric vehicle charging station based on DEMATEL-ISM. Comput. Ind. Eng. 2022, 163, 107818. [Google Scholar] [CrossRef]
- Chen, Y. Convolutional Neural Network for Sentence Classification. Master’s Thesis, University of Waterloo, Waterloo, ON, Canada, 2015. [Google Scholar]
- Liu, P.; Qiu, X.; Huang, X. Recurrent neural network for text classification with multi-task learning. arXiv 2016, arXiv:1605.05101. [Google Scholar]
- Zhou, P.; Shi, W.; Tian, J.; Qi, Z.; Li, B.; Hao, H.; Xu, B. Attention-based bidirectional long short-term memory networks for relation classification. In Proceedings of the 54th Annual Meeting of the Association for Computational Linguistics (Volume 2: Short Papers), Berlin, Germany, 7–12 August 2016; pp. 207–212. [Google Scholar]
- Joulin, A.; Grave, E.; Bojanowski, P.; Mikolov, T. Bag of tricks for efficient text classification. arXiv 2016, arXiv:1607.01759. [Google Scholar]
- Johnson, R.; Zhang, T. Deep pyramid convolutional neural networks for text categorization. In Proceedings of the 55th Annual Meeting of the Association for Computational Linguistics (Volume 1: Long Papers), Vancouver, BC, Canada, 8–11 July 2017; pp. 562–570. [Google Scholar]
- Vaswani, A.; Shazeer, N.; Parmar, N.; Uszkoreit, J.; Jones, L.; Gomez, A.N.; Kaiser, Ł.; Polosukhin, I. Attention is all you need. arXiv 2017, arXiv:1706.03762. [Google Scholar]
- Devlin, J.; Chang, M.W.; Lee, K.; Toutanova, K. Bert: Pre-training of deep bidirectional transformers for language understanding. arXiv 2018, arXiv:1810.04805. [Google Scholar]
- Hadsell, R.; Chopra, S.; LeCun, Y. Dimensionality reduction by learning an invariant mapping. In Proceedings of the 2006 IEEE Computer Society Conference on Computer Vision and Pattern Recognition (CVPR’06), New York, NY, USA, 17–22 June 2006; pp. 1735–1742. [Google Scholar]
- He, K.; Fan, H.; Wu, Y.; Xie, S.; Girshick, R. Momentum contrast for unsupervised visual representation learning. In Proceedings of the IEEE/CVF Conference on Computer Vision and Pattern Recognition, Seattle, WA, USA, 13–19 June 2020; pp. 9729–9738. [Google Scholar]
- Li, D.; Tian, Y. Survey and experimental study on metric learning methods. Neural Netw. 2018, 105, 447–462. [Google Scholar] [CrossRef]
- Maji, S.; Rahtu, E.; Kannala, J.; Blaschko, M.; Vedaldi, A. Fine-grained visual classification of aircraft. arXiv 2013, arXiv:1306.5151. [Google Scholar]
- Oord, A.V.D.; Li, Y.; Vinyals, O. Representation learning with contrastive predictive coding. arXiv 2018, arXiv:1807.03748. [Google Scholar]
- Gunel, B.; Du, J.; Conneau, A.; Stoyanov, V. Supervised contrastive learning for pre-trained language model fine-tuning. arXiv 2020, arXiv:2011.01403. [Google Scholar]
- Chen, T.; Kornblith, S.; Swersky, K.; Norouzi, M.; Hinton, G.E. Big self-supervised models are strong semi-supervised learners. Adv. Neural Inf. Process. Syst. 2020, 33, 22243–22255. [Google Scholar]
- Qi, C.; Zhu, Y.; Song, C.; Cao, J.; Xiao, F.; Zhang, X.; Xu, Z.; Song, S. Self-supervised reinforcement learning-based energy management for a hybrid electric vehicle. J. Power Sources 2021, 514, 230584. [Google Scholar] [CrossRef]
- Corinaldesi, C.; Lettner, G.; Schwabeneder, D.; Ajanovic, A.; Auer, H. Impact of Different Charging Strategies for Electric Vehicles in an Austrian Office Site. Energies 2020, 13, 5858. [Google Scholar] [CrossRef]
- Gao, T.; Yao, X.; Chen, D. Simcse: Simple contrastive learning of sentence embeddings. arXiv 2021, arXiv:2104.08821. [Google Scholar]
- Madabushi, H.T.; Kochkina, E.; Castelle, M. Cost-sensitive BERT for generalisable sentence classification with imbalanced data. arXiv 2020, arXiv:2003.11563. [Google Scholar]
Disclaimer/Publisher’s Note: The statements, opinions and data contained in all publications are solely those of the individual author(s) and contributor(s) and not of MDPI and/or the editor(s). MDPI and/or the editor(s) disclaim responsibility for any injury to people or property resulting from any ideas, methods, instructions or products referred to in the content. |
© 2023 by the authors. Licensee MDPI, Basel, Switzerland. This article is an open access article distributed under the terms and conditions of the Creative Commons Attribution (CC BY) license (https://creativecommons.org/licenses/by/4.0/).