
Privacy-Enhancing Digital Contact Tracing with Machine Learning for Pandemic Response: A Comprehensive Review


Abstract
1. Introduction
- We provide a general overview and propose a new taxonomy of DCT strategies. DCT strategies are categorized into three groups: Forward contact tracing, backward contact tracing, and proactive contact tracing.
- We overview several DCT apps specifically targeted toward mitigating the impacts of the COVID-19 pandemic and categorize them based on their tracing methods.
- We formulate three computational epidemiology subproblems related to DCT and present a comprehensive review of machine learning techniques to address the subproblems. We provide a detailed theoretical and empirical analysis for each learning method and summarise the corresponding contact tracing datasets.
- We highlight specific challenges of current machine learning techniques for DCT and provide potential solutions for how to overcome these challenges.
2. Background and Related Work
2.1. Related Reviews
2.2. Strategies of Digital Contact Tracing
2.3. Existing COVID-19 Digital Contact Tracing Applications
2.4. Related Work
- Many existing techniques in FCT primarily focus on identifying direct contacts, often overlooking other potential transmission routes. Utilizing a novel network model to represent social contacts typically relies on existing datasets, which may be impractical in certain situations. Additionally, even when employing graph traversal algorithms, there is still a need for scalable, efficient, and accurate algorithm designs to determine contacts effectively.
- In BCT, numerous existing methods utilize approximate algorithms for infection source identification, which could lead to a less-than-ideal accuracy performance. Certain approaches require supplementary personal private information or hard-to-obtain data, such as precise timestamps of transmission events, limiting the feasibility and practicality in real-world applications.
- For risk estimation in PCT, most existing methods focus on specialized applications or are heavily dependent on specific feature types. This may constrain the adaptability and efficacy across a broad range of infectious diseases and diverse populations.
3. Methods
3.1. Scope Identification
- Contact Graph Construction: As the underlying contact tracing network in FCT is usually unknown, how to construct such a network efficiently starting from a given index case?
- Infection Source Estimation (Source Attribution): Given the contact tracing network data from FCT, how to accurately and efficiently identify the best source estimator in BCT?
- Risk of Infectious Exposure Prediction: How to reasonably quantify and estimate the risk of infectious exposure for non-close contacts in PCT?
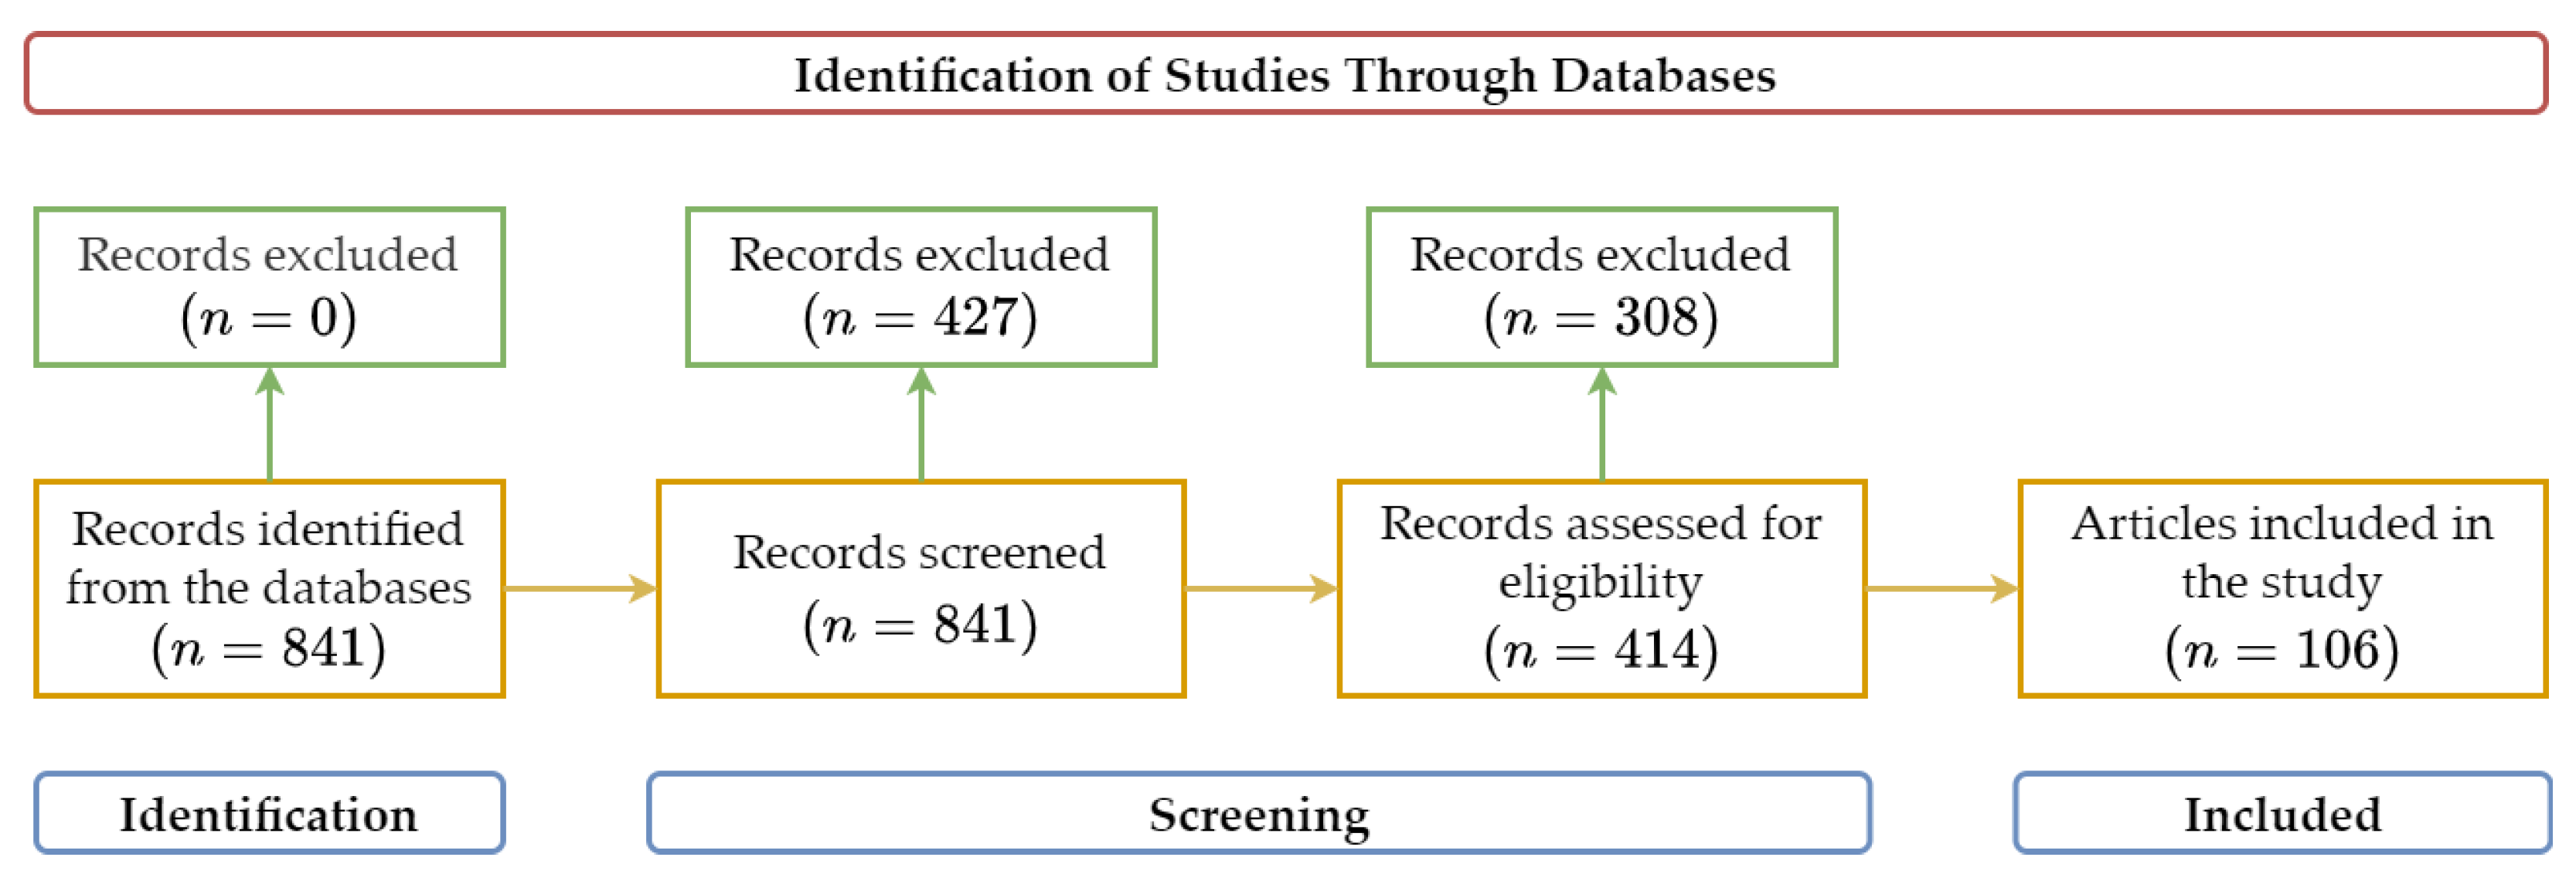
3.2. Search Strategy
- Study design: Was the study designed and conducted using appropriate methods that align with its objectives?
- Sample size and data quality: Were the datasets employed in the study sufficiently large to draw meaningful conclusions?
- Machine learning techniques: Were the machine learning algorithms and techniques used in the study clearly described and justified with respect to the DCT strategy being investigated, and was the mathematical basis of the models presented in a comprehensible and evaluable manner?
- Performance evaluation: Were the performance metrics used to evaluate the machine learning techniques relevant, valid, and clearly reported?
- Validation and generalizability: Were the study findings validated using external datasets or cross-validation techniques, and do the results have the potential for generalization to broader contexts?
4. Privacy-Preserving Machine Learning-Based Digital Contact Tracing
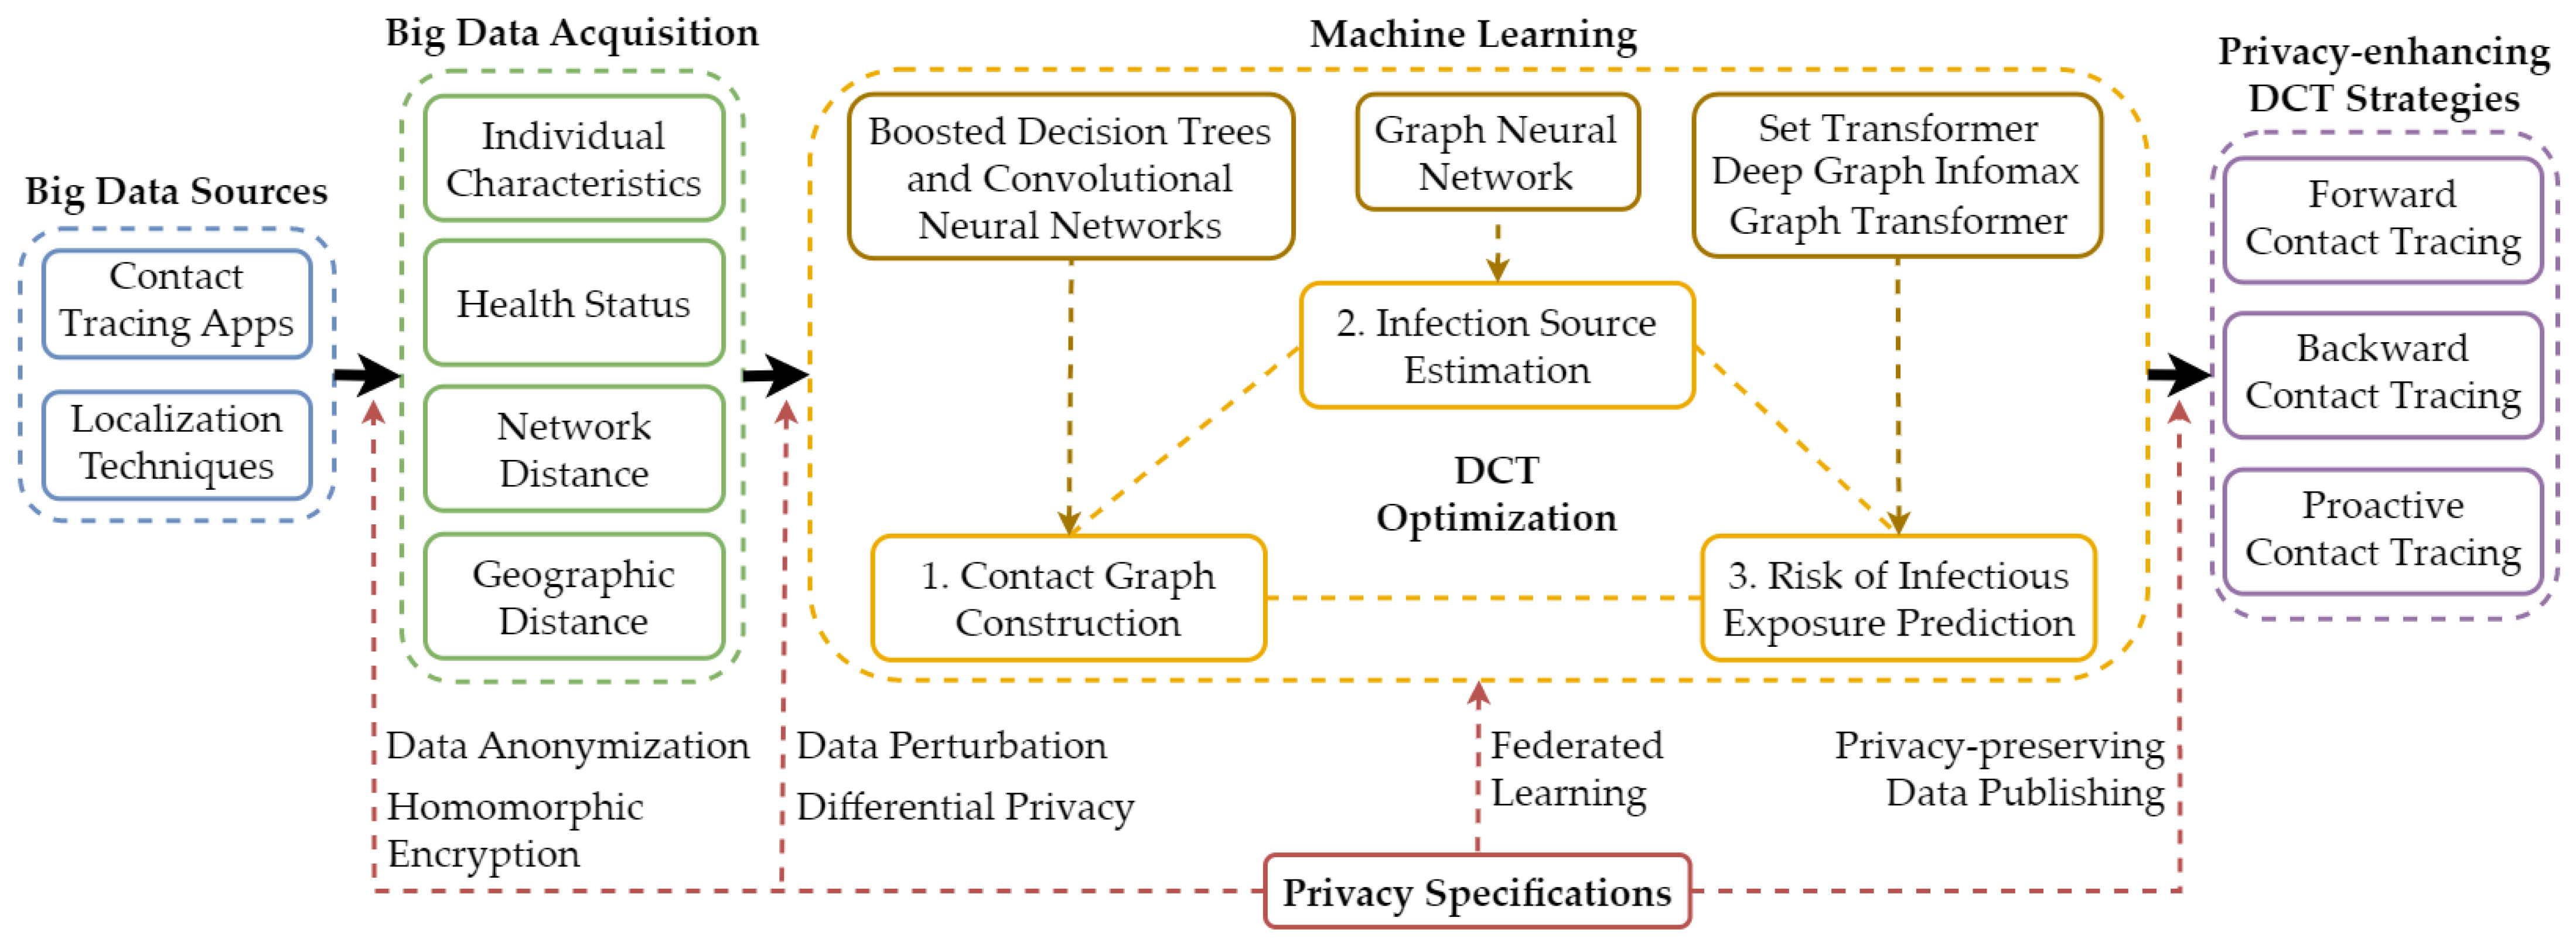
4.1. Privacy Specifications
- Privacy-preserving data acquisition: The acquisition of large-scale contact tracing data should adhere to strict privacy standards. Data anonymization and homomorphic encryption are two methods that uphold these protocols. Anonymization eliminates personal identifiers from data, while homomorphic encryption enables calculations on encrypted data without decryption, thus maintaining privacy.
- Differential privacy and data perturbation in model training: During the machine learning model training phase, differential privacy and data perturbation techniques can be used to ensure privacy. Differential privacy adds a calculated amount of noise to the data or the queries, offering a mathematical guarantee of privacy by ensuring that the removal or addition of a single database item does not significantly affect the outcome of any analysis. Data perturbation, on the other hand, modifies the data slightly so that individual’s private data cannot be identified or inferred, yet the overall statistical characteristics of the data remain accurate for model training.
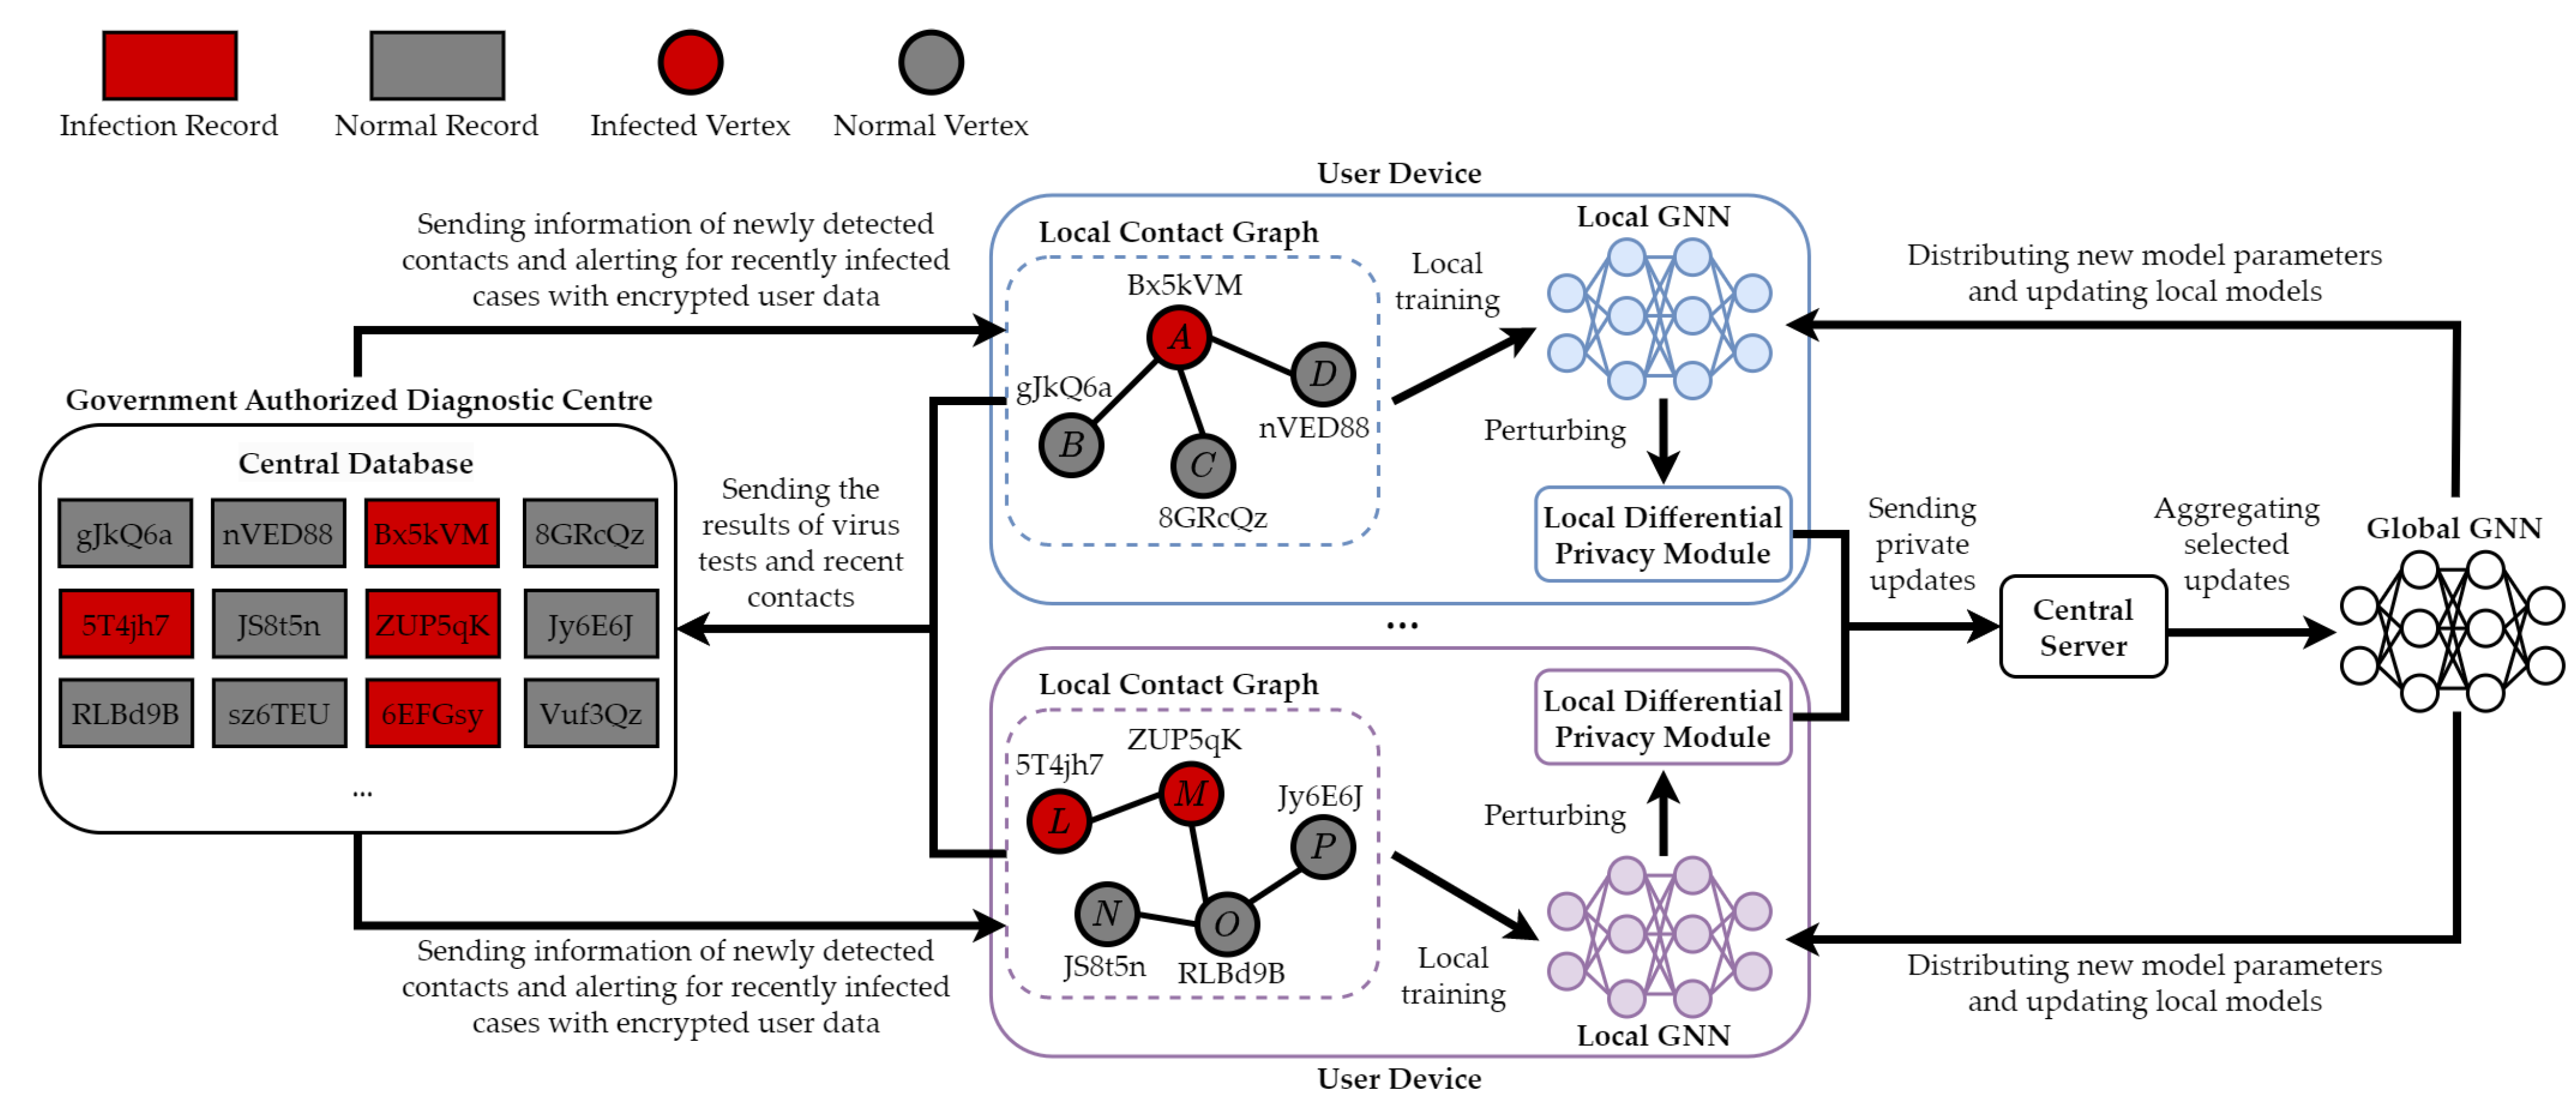
- Federated learning: This technique offers a decentralized approach to machine learning where the model is trained across multiple decentralized devices or servers holding local data samples without exchanging their data. It ensures data privacy as all the raw data remains on the local device, and only model updates are communicated back to a central server for aggregation (see details in Section 6.1).
- Privacy-preserving data publishing: This privacy specification is aimed at protecting privacy when disseminating information derived from the DCT system. Techniques under this specification ensure that the data released for public consumption (e.g., statistics, graphs, reports) does not allow the re-identification of individuals or reveal any sensitive information.
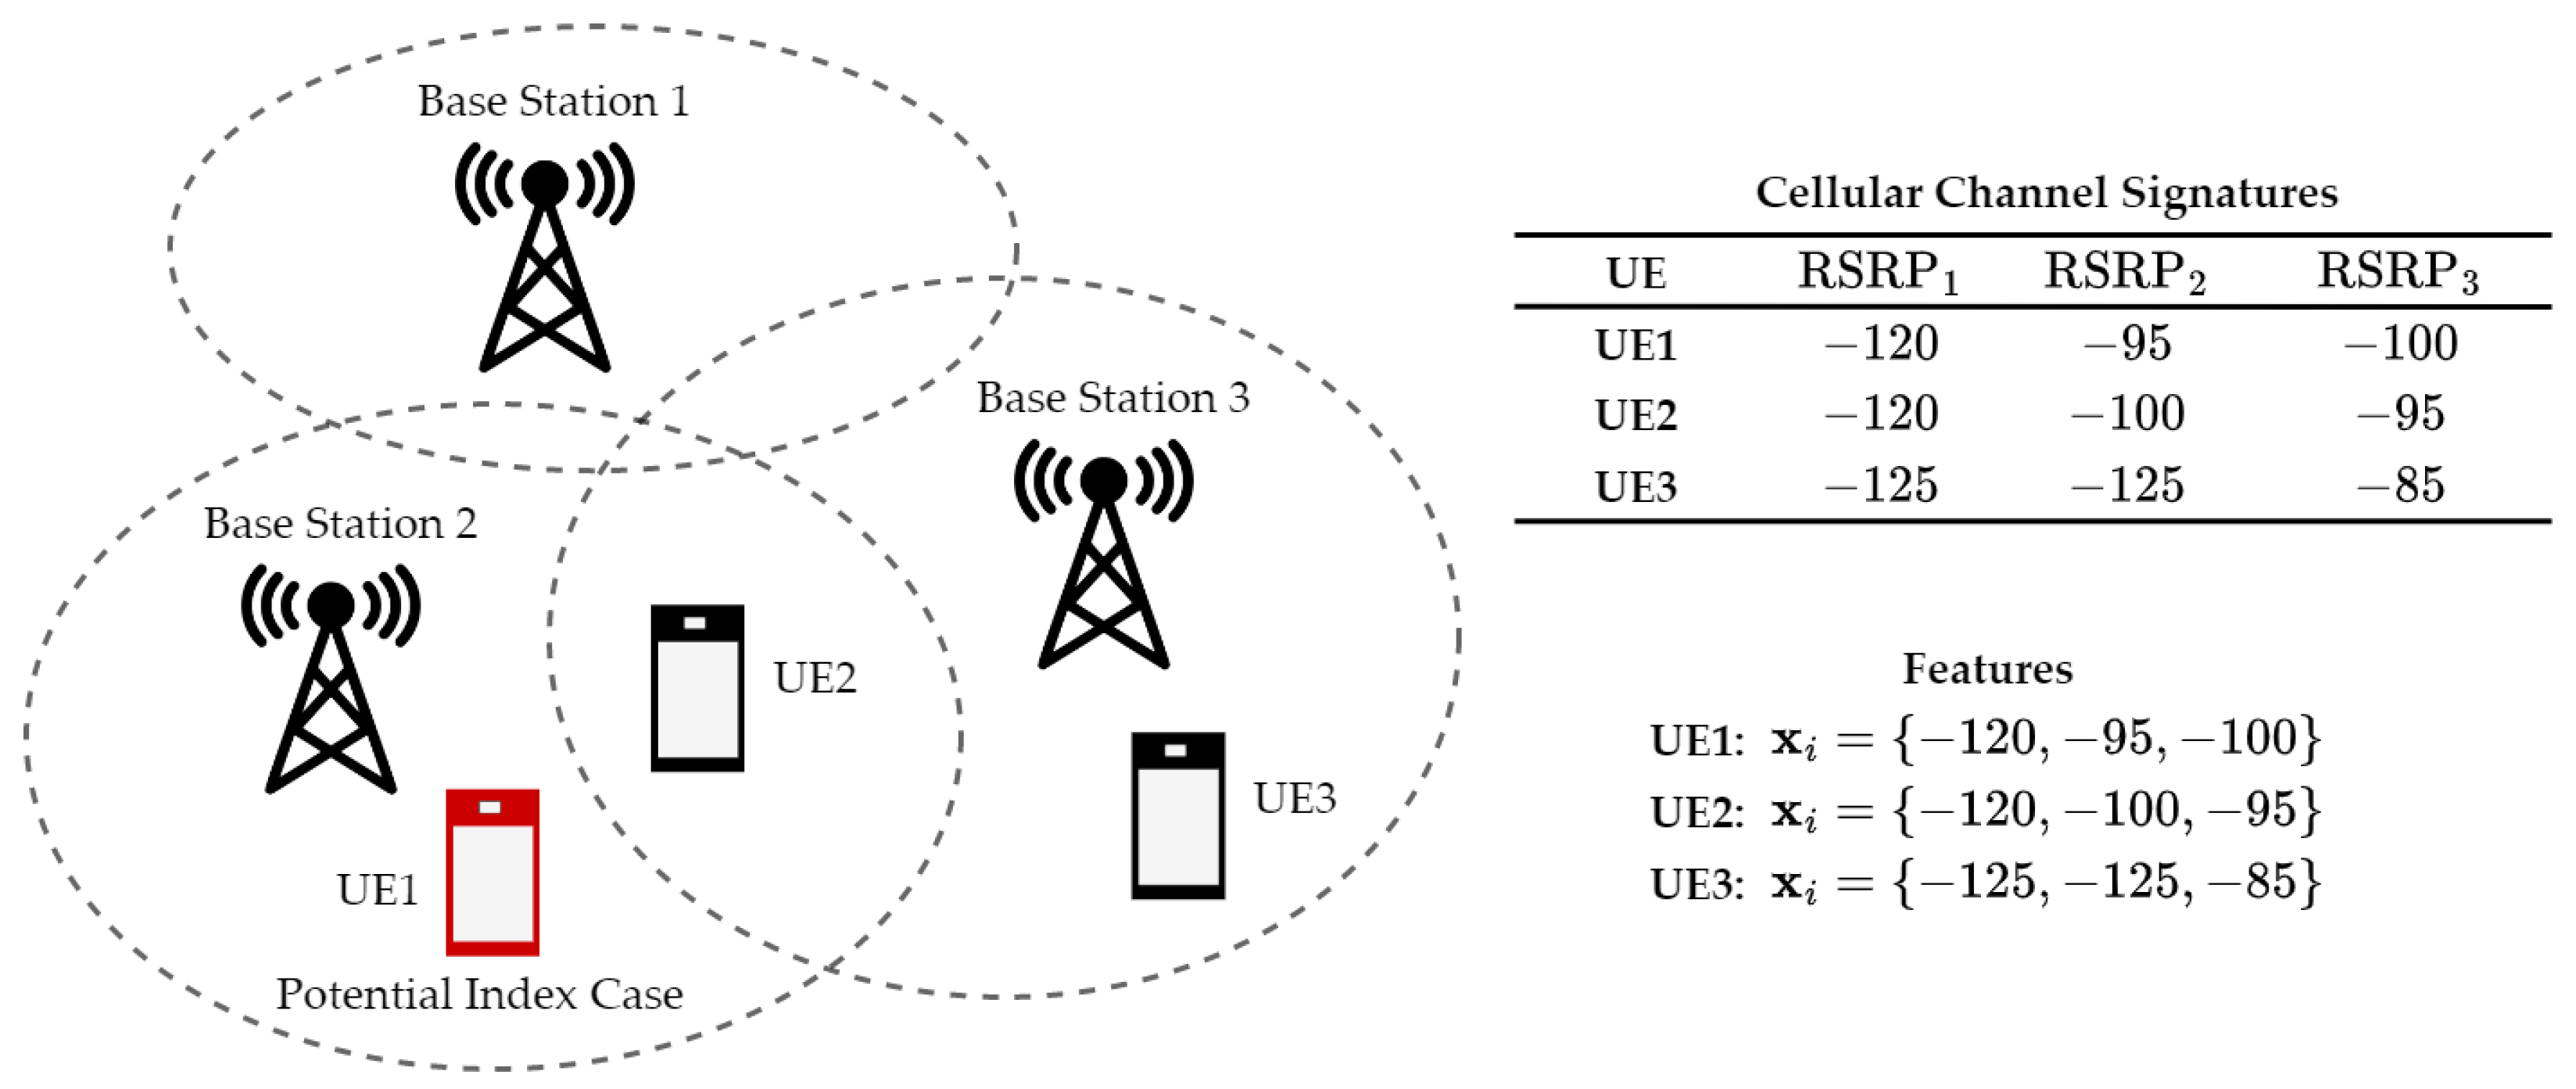
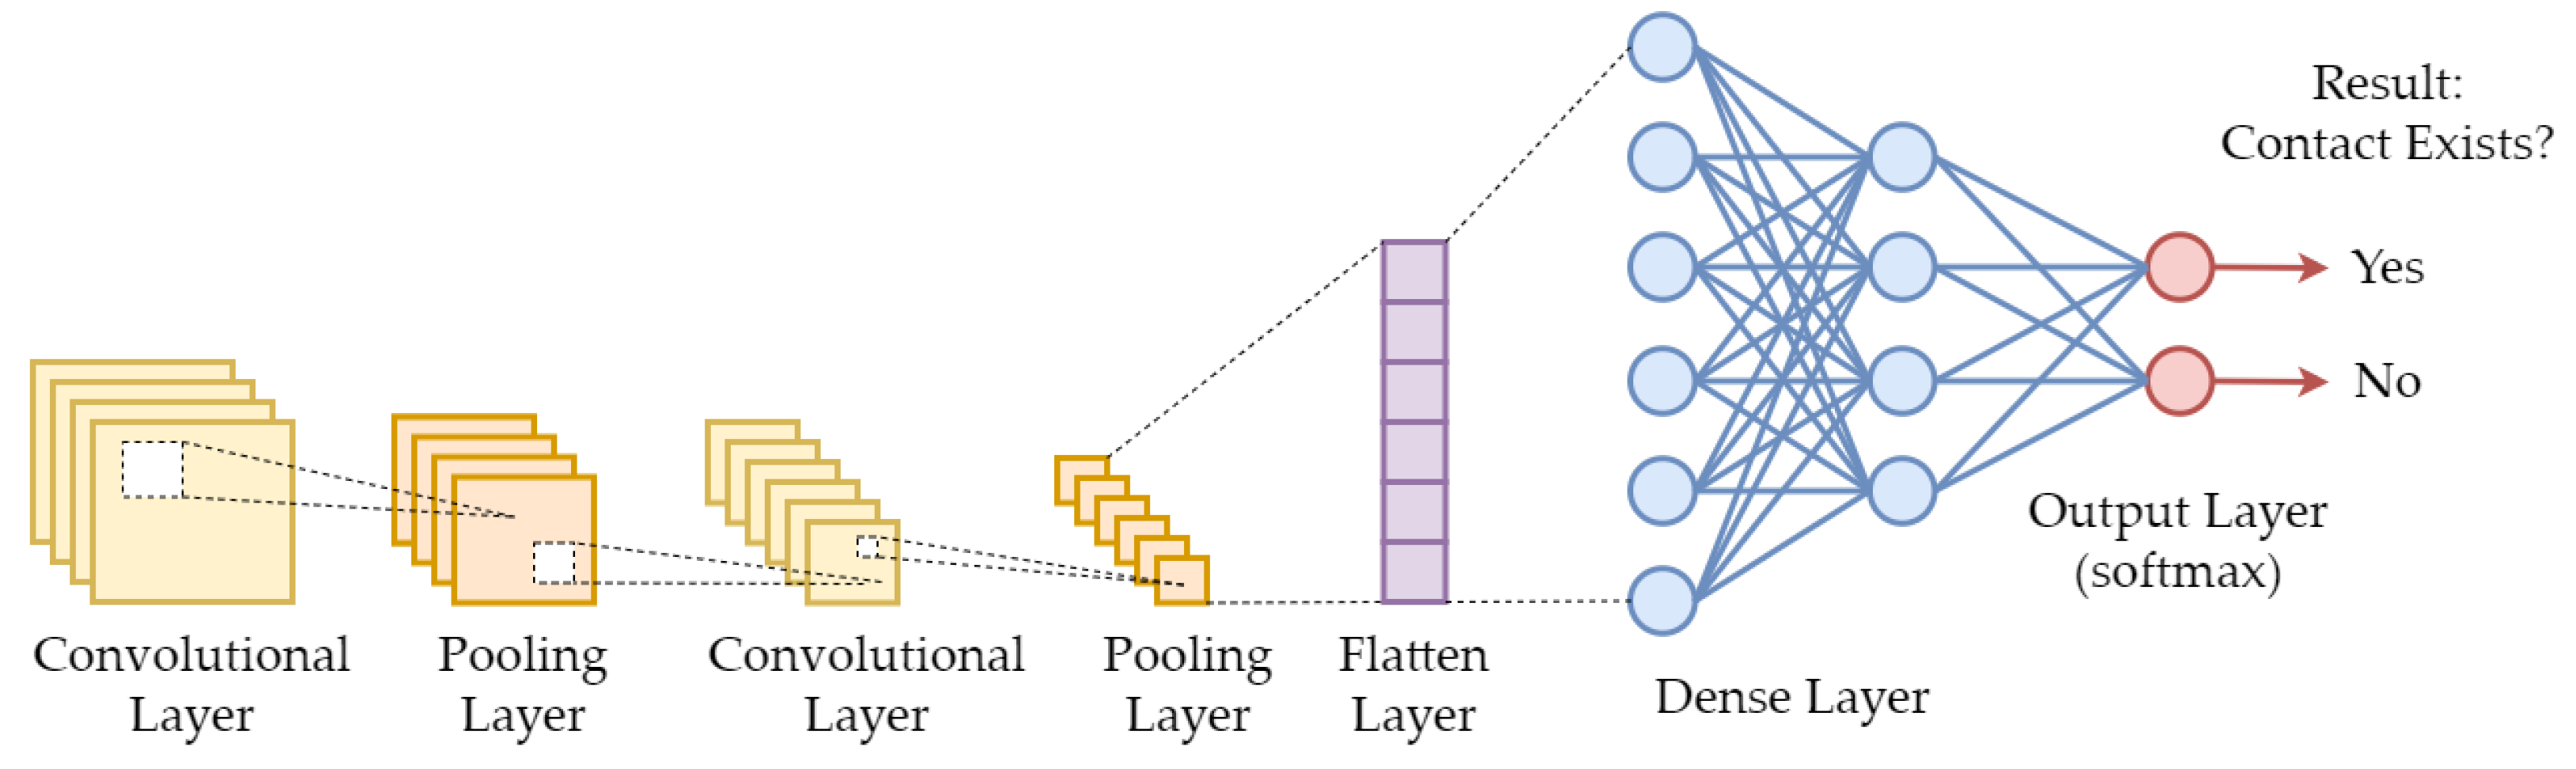
4.2. Contact Graph Construction
- Wireless signal signatures such as indoor WiFi signal angle of arrival (AoA) measurements with respect to multiple nearby access points have been studied to localize user equipment (UE) [74].
- LTE signal fingerprinting measures the channel signatures in different locations to form a database. A UE is localized by matching the user’s fingerprints (channel signatures measurements) to the database [75].
4.3. Infection Source Estimation (Source Attribution)
4.3.1. Network Centrality Approach
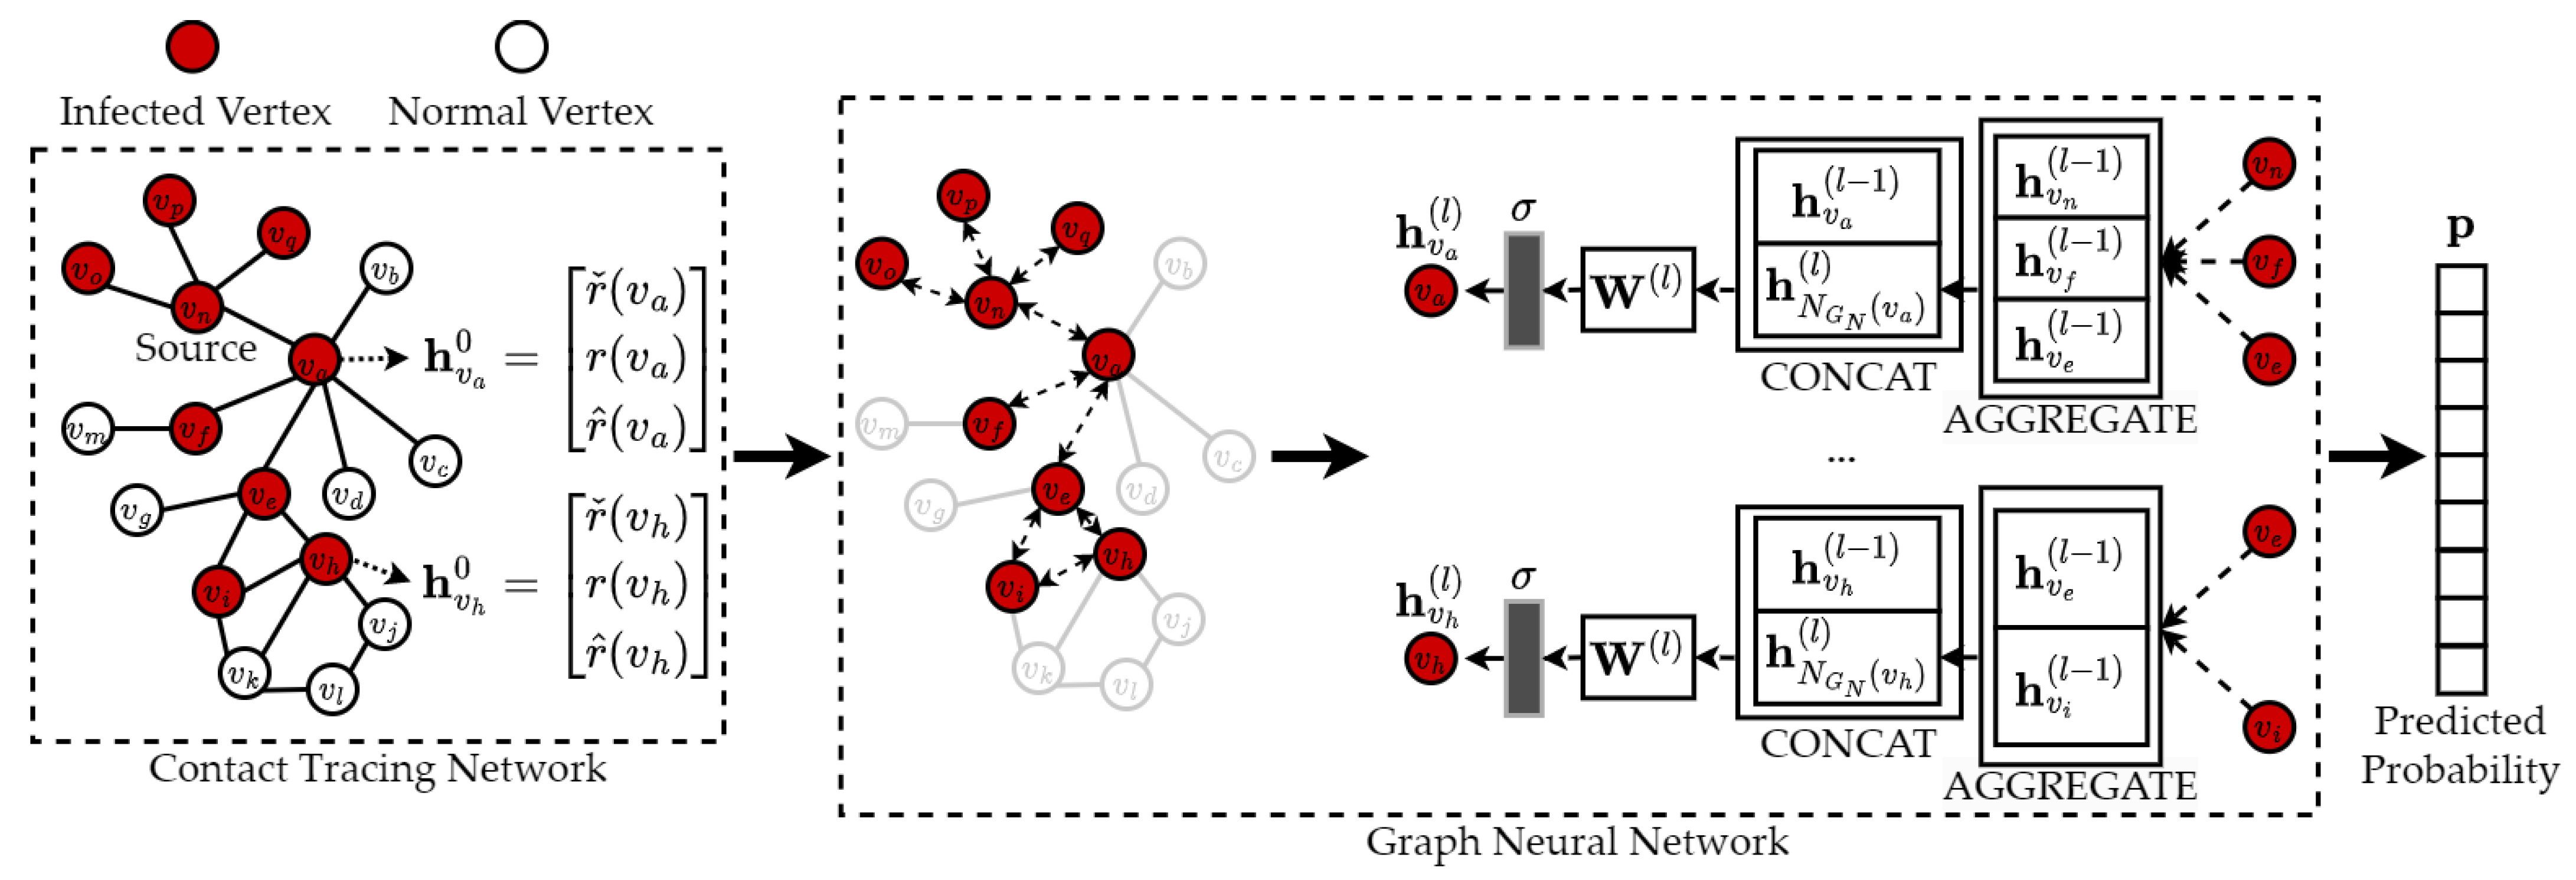
4.3.2. Graph Neural Network Approach
4.4. Risk of Infectious Exposure Prediction
4.4.1. Feature-Based Approach
- Individual characteristics:
- -
- Age: Older individuals are often considered to be more vulnerable to infections, and they may need tailored recommendations for disease prevention.
- -
- Gender: Certain risk factors may be specific to gender and could affect an individual’s likelihood of infection.
- -
- Pre-existing health conditions: The health conditions, such as asthma or diabetes, can increase an individual’s risk of developing severe illness if infected.
- -
- Lifestyle habits: Bad habits, such as smoking, can have various negative impacts on an individual’s health, including a weakened immune system and a higher risk of developing respiratory infections.
- Health status:
- -
- Symptoms: The symptoms, such as fever, cough, and loss of taste or smell, are common indicators for estimating an individual’s risk of infection.
- -
- Test results: The results of virus tests can indicate if an individual has an active infection and can help estimate their risk of spreading the virus to others.
4.4.2. Network-Based Approach
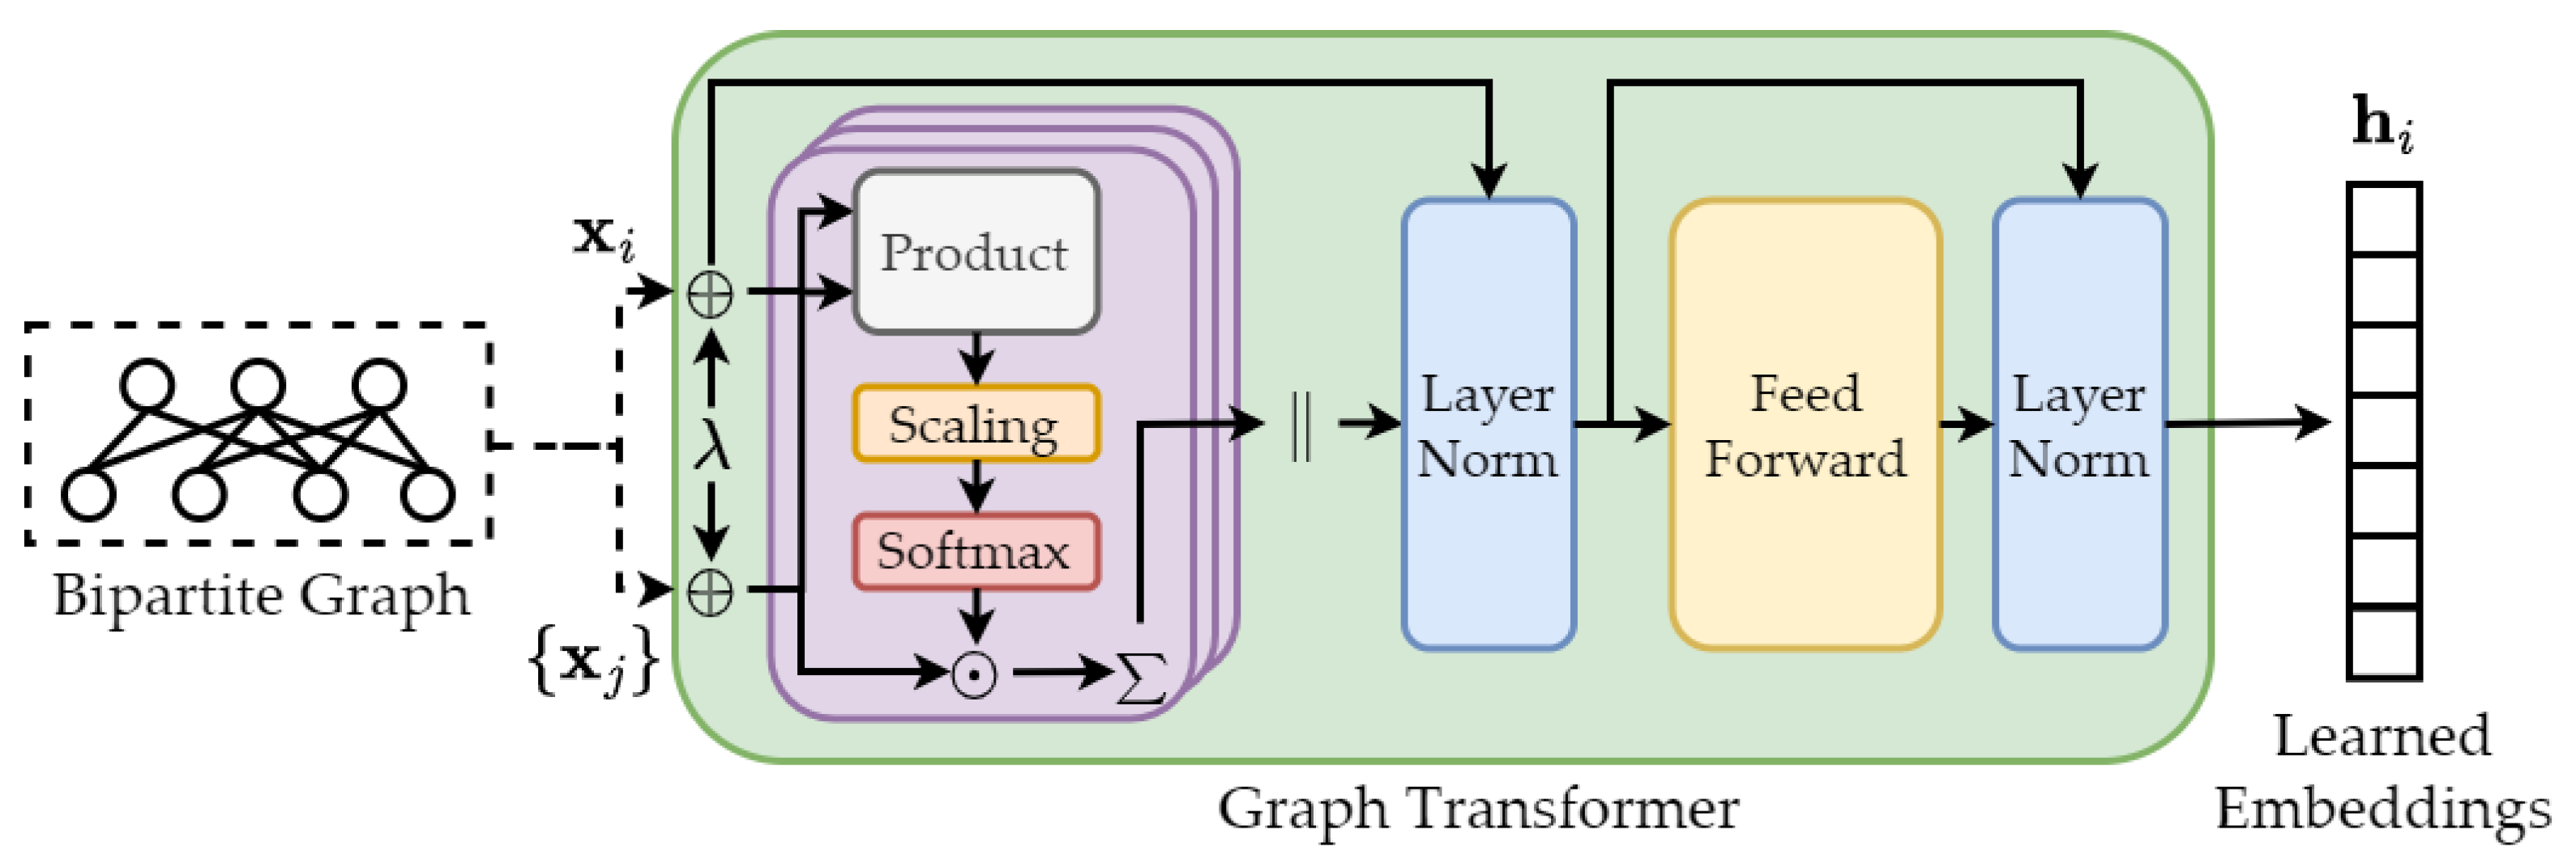
4.4.3. Rank-Based Approach
5. Results and Analysis
6. Challenges of Digital Contact Tracing
6.1. Privacy and Security
6.2. Data Availability
7. Case Study
- Background: A new infectious disease outbreak has occurred in a densely populated urban area. Public health authorities are in need of implementing a DCT system that can aid in mitigating the spread of the infection.
- DCT strategy selection and app development: Authorities decide to employ a combination of FCT, BCT, and PCT strategies to maximize the efficacy of the DCT system. An app is developed that incorporates these DCT strategies and leverages machine learning techniques to optimize the system’s performance.
- Privacy considerations: To address privacy concerns, the DCT system adopts privacy-preserving techniques, such as data anonymization, encryption, and federated learning with differential privacy. These approaches enable the system to learn from decentralized data sources while preserving individual privacy.
- Data collection and management: The DCT system collects and manages data, including contact tracing data and supplementary information (e.g., demographic factors and health status), to improve the accuracy of machine learning models. Privacy-preserving techniques are employed to protect users’ personal information.
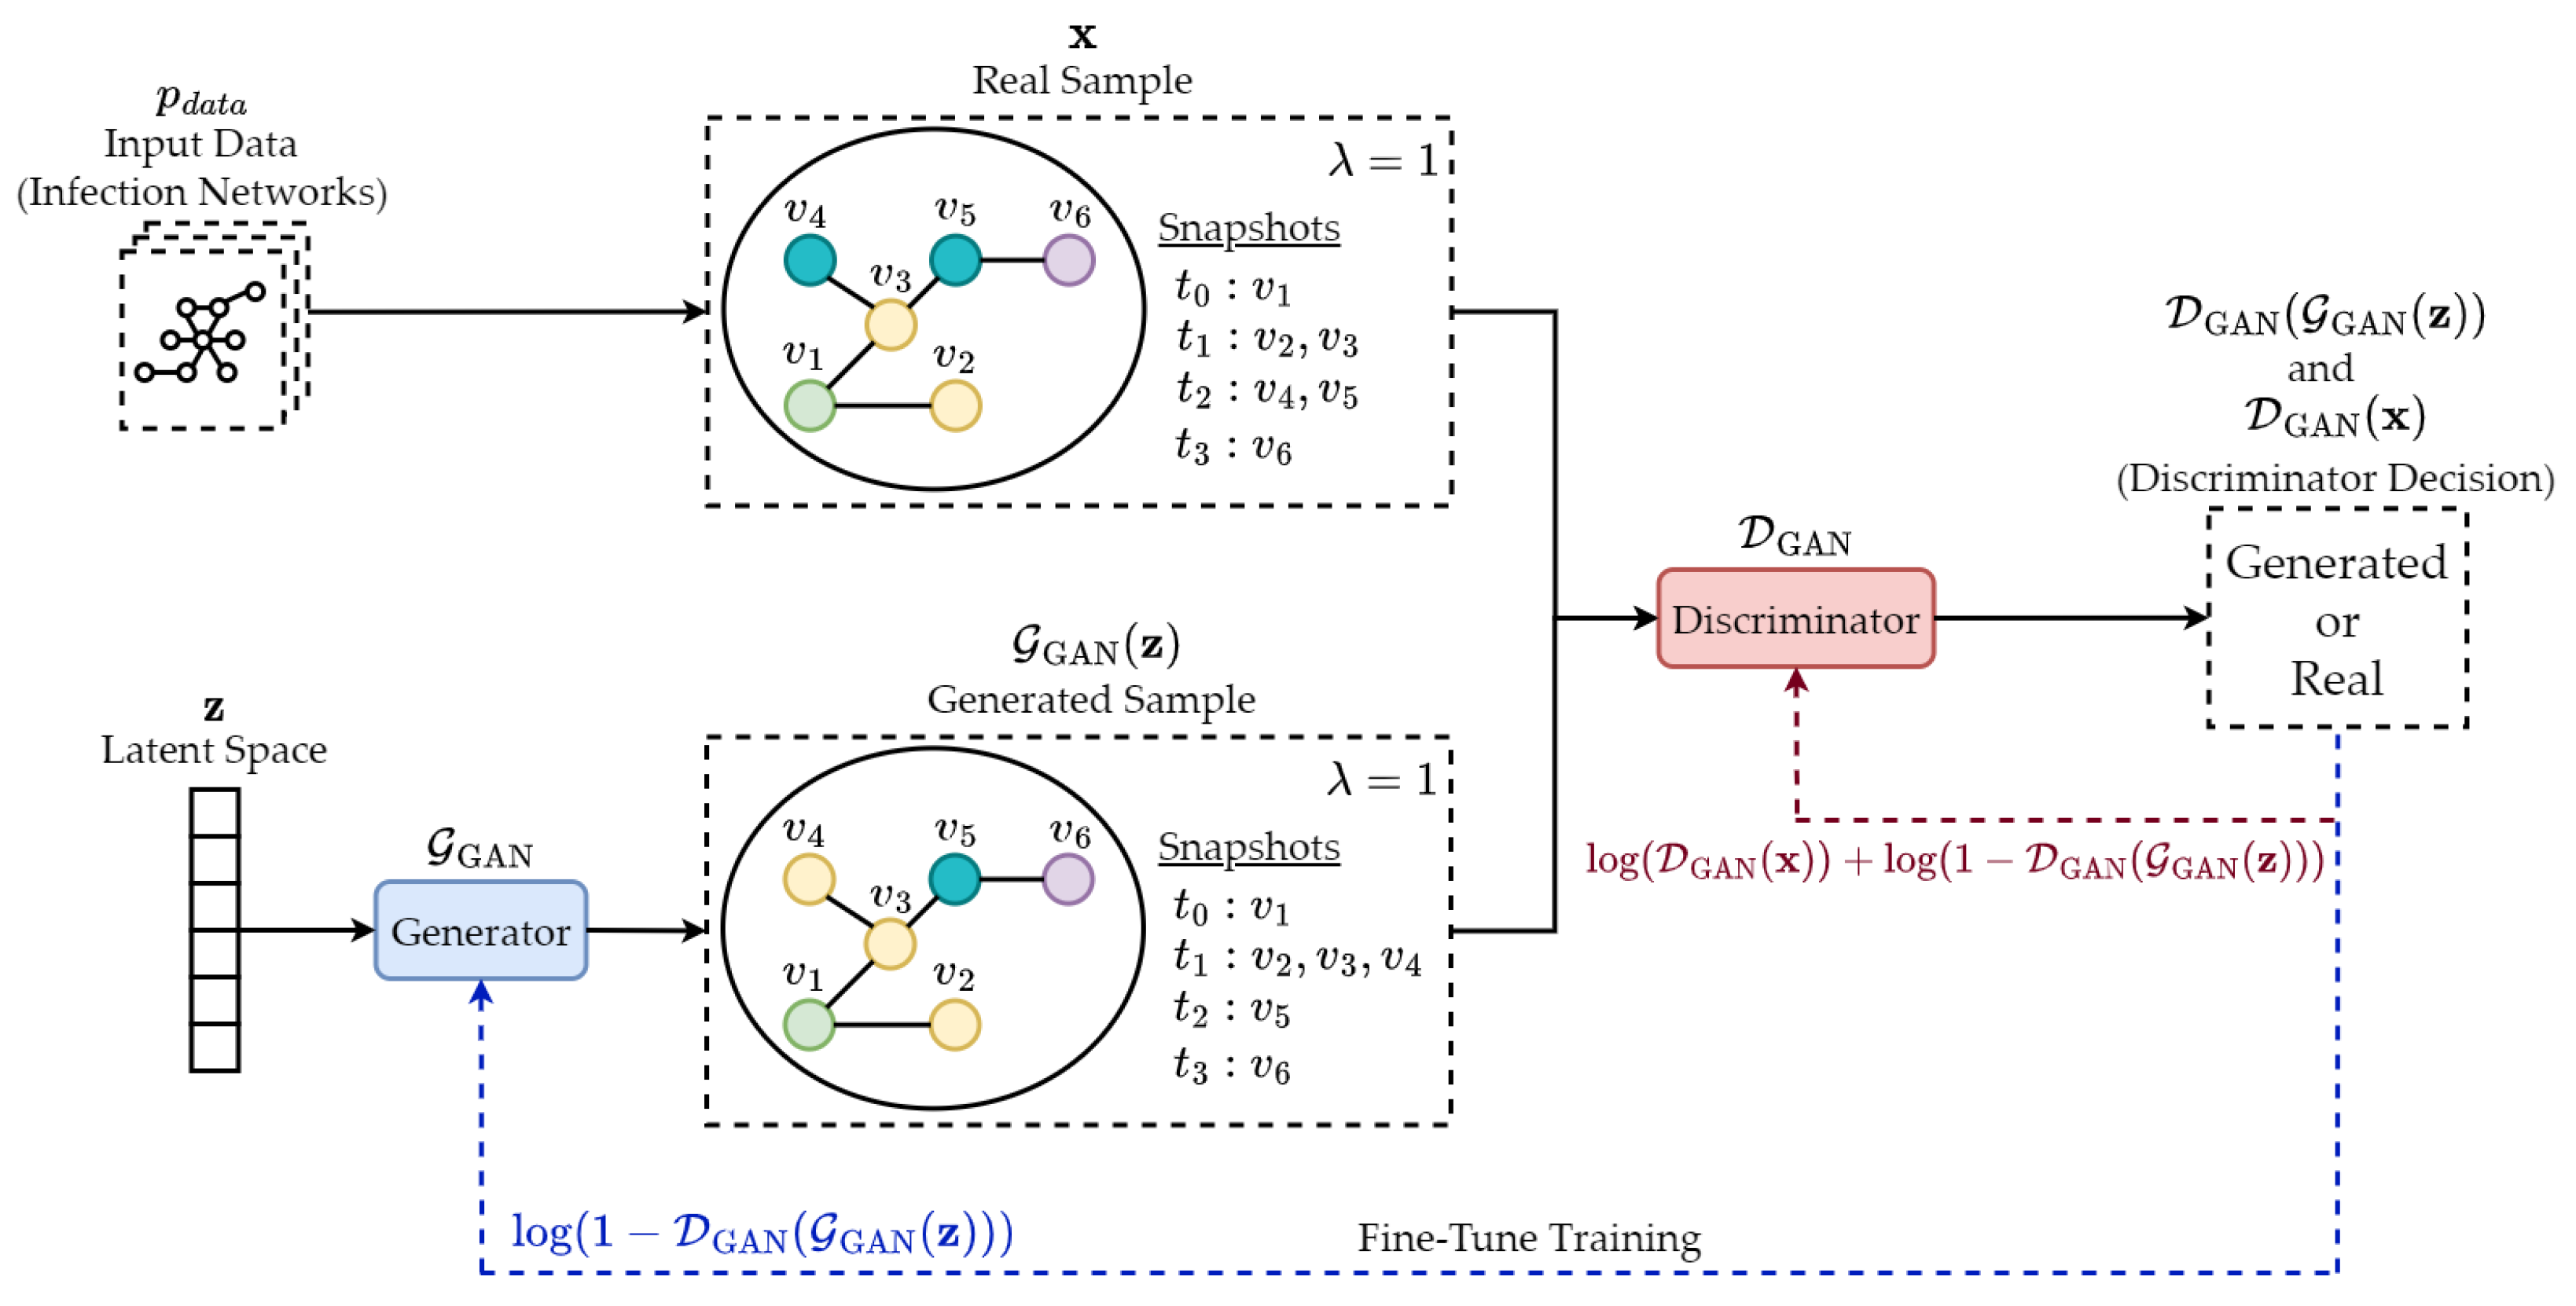
- Data availability enhancement: Data scarcity may arise during a pandemic due to factors such as insufficient testing, reporting delays, or inconsistent data collection. To mitigate this issue, advanced data augmentation techniques, such as synthetic data generation, can help improve the available dataset for DCT systems. By combining synthetic data with existing data, more effective learning can occur, leading to improved performance of the DCT system, even in cases where data availability is limited.
- Implementation and evaluation: The DCT app is deployed in the affected area, and its effectiveness is evaluated using various performance metrics, such as infection detection rates, contact tracing efficiency, and false quarantine recommendations. The evaluation process also assesses the system’s ability to maintain user privacy.
- Continuous improvement: As the pandemic situation evolves, researchers continue to investigate novel machine learning techniques and strategies to enhance the DCT system’s performance. These efforts aim to improve the accuracy, efficiency, and adaptability of the DCT system in response to the changing dynamics of infectious disease outbreaks.
8. Discussion
8.1. Limitations
- Machine learning techniques: The machine learning techniques emphasized in this study are primarily graph-based learning models, as the focus is on contact tracing network data. This may limit the scope of the review, as other machine learning techniques might be relevant and applicable to DCT systems.
- Experimental evaluations: The proposed approaches in the study lack detailed experimental evaluations to validate their effectiveness and applicability in real-world DCT systems. Future work should include thorough experimental evaluations to ensure the viability of these approaches.
- Pandemic response strategies: Our review mainly focuses on applying machine learning techniques to optimize DCT strategies, which might exclude other important public health interventions and strategies that can be employed during a pandemic.
8.2. Future Research Directions
- Blockchain technology: The integration of blockchain technology in DCT systems can provide enhanced security, privacy, and trust [172,173,174]. Blockchain’s decentralized and tamper-proof nature could offer a reliable means to store and share contact tracing data while preserving user privacy and ensuring data integrity. Future research could investigate novel approaches to combine blockchain with machine learning techniques for more secure and efficient DCT systems.
- Large language models: Advanced large language models [175], such as ChatGPT, can be leveraged to improve communication and information dissemination in DCT applications [176]. These models can potentially be used to develop user-friendly interfaces, provide personalized risk information, and answer user queries regarding contact tracing or health recommendations [177]. Future work could focus on adapting and fine-tuning these models specifically for DCT applications to enhance their effectiveness and user experience.
- Obfuscation techniques: The incorporation of obfuscation techniques in DCT systems can further enhance security and privacy. Obfuscation methods, such as data perturbation or anonymization, can help protect sensitive user information by adding noise or altering data in a controlled manner. This approach can make it difficult for adversaries to re-identify individuals or infer sensitive information from the shared data. Future research could explore the development of advanced obfuscation techniques in machine learning-based DCT systems, aiming to strike a balance between data utility and privacy protection.
- Adversarial learning methods: Investigating the application of adversarial learning methods in DCT systems can potentially improve the robustness and generalizability of machine learning models. By training models to withstand adversarial attacks, such as crafted input perturbations designed to mislead the model, they may become more resilient and effective in real-world scenarios. Future research could focus on developing advanced adversarial training techniques tailored to the unique challenges of machine learning-based DCT systems, enhancing their performance and security.
- Cross-disciplinary collaboration: DCT is a complex field that requires expertise from multiple disciplines, such as public health, computer science, and social science. Future research should promote cross-disciplinary collaboration to develop more effective DCT solutions that consider the technical, ethical, and social aspects of the problem.
9. Conclusions
Author Contributions
Funding
Institutional Review Board Statement
Informed Consent Statement
Data Availability Statement
Conflicts of Interest
References
- Gates, B. Responding to Covid-19—A once-in-a-century pandemic? N. Engl. J. Med. 2020, 382, 1677–1679. [Google Scholar] [CrossRef]
- World Health Organization. WHO Coronavirus (COVID-19) Dashboard. Available online: https://covid19.who.int/ (accessed on 20 April 2023).
- Chinazzi, M.; Davis, J.T.; Ajelli, M.; Gioannini, C.; Litvinova, M.; Merler, S.; Piontti, A.P.Y.; Mu, K.; Rossi, L.; Sun, K.; et al. The effect of travel restrictions on the spread of the 2019 novel coronavirus (COVID-19) outbreak. Science 2020, 368, 395–400. [Google Scholar] [CrossRef]
- Flaxman, S.; Mishra, S.; Gandy, A.; Unwin, H.J.T.; Mellan, T.A.; Coupland, H.; Whittaker, C.; Zhu, H.; Berah, T.; Eaton, J.W.; et al. Estimating the effects of non-pharmaceutical interventions on COVID-19 in Europe. Nature 2020, 584, 257–261. [Google Scholar] [CrossRef]
- Ma, Q.; Liu, Y.Y.; Olshevsky, A. Optimal lockdown for pandemic control. arXiv 2020, arXiv:2010.12923. [Google Scholar]
- Fernandes, N. Economic effects of coronavirus outbreak (COVID-19) on the world economy. IESE Business School Working Paper No. WP-1240-E; 2020. Available online: https://papers.ssrn.com/sol3/papers.cfm?abstract_id=3557504 (accessed on 20 April 2023).
- Anderson, R.M.; Heesterbeek, H.; Klinkenberg, D.; Hollingsworth, T.D. How will country-based mitigation measures influence the course of the COVID-19 epidemic? Lancet 2020, 395, 931–934. [Google Scholar] [CrossRef] [PubMed]
- Rossi, R.; Socci, V.; Talevi, D.; Mensi, S.; Niolu, C.; Pacitti, F.; Di Marco, A.; Rossi, A.; Siracusano, A.; Di Lorenzo, G. COVID-19 pandemic and lockdown measures impact on mental health among the general population in Italy. Front. Psychiatry 2020, 11, 790. [Google Scholar] [CrossRef]
- Mandel, A.; Veetil, V. The economic cost of COVID lockdowns: An out-of-equilibrium analysis. Econ. Disasters Clim. Chang. 2020, 4, 431–451. [Google Scholar] [CrossRef]
- Firth, J.A.; Hellewell, J.; Klepac, P.; Kissler, S.; Kucharski, A.J.; Spurgin, L.G. Using a real-world network to model localized COVID-19 control strategies. Nat. Med. 2020, 26, 1616–1622. [Google Scholar] [CrossRef]
- Kwok, K.O.; Tang, A.; Wei, V.W.; Park, W.H.; Yeoh, E.K.; Riley, S. Epidemic models of contact tracing: Systematic review of transmission studies of severe acute respiratory syndrome and Middle East respiratory syndrome. Comput. Struct. Biotechnol. J. 2019, 17, 186–194. [Google Scholar] [CrossRef] [PubMed]
- Müller, J.; Kretzschmar, M. Contact tracing—Old models and new challenges. Infect. Dis. Model. 2021, 6, 222–231. [Google Scholar] [CrossRef] [PubMed]
- He, X.; Lau, E.H.; Wu, P.; Deng, X.; Wang, J.; Hao, X.; Lau, Y.C.; Wong, J.Y.; Guan, Y.; Tan, X.; et al. Temporal dynamics in viral shedding and transmissibility of COVID-19. Nat. Med. 2020, 26, 672–675. [Google Scholar] [CrossRef]
- Ferretti, L.; Wymant, C.; Kendall, M.; Zhao, L.; Nurtay, A.; Abeler-Dörner, L.; Parker, M.; Bonsall, D.; Fraser, C. Quantifying SARS-CoV-2 transmission suggests epidemic control with digital contact tracing. Science 2020, 368, eabb6936. [Google Scholar] [CrossRef]
- Barrat, A.; Cattuto, C.; Kivelä, M.; Lehmann, S.; Saramäki, J. Effect of manual and digital contact tracing on COVID-19 outbreaks: A study on empirical contact data. J. R. Soc. Interface 2021, 18, 20201000. [Google Scholar] [CrossRef]
- Braithwaite, I.; Callender, T.; Bullock, M.; Aldridge, R.W. Automated and partly automated contact tracing: A systematic review to inform the control of COVID-19. Lancet Digit. Health 2020, 2, e607–e621. [Google Scholar] [CrossRef] [PubMed]
- Meister, M.; Kleinberg, J. Optimizing the order of actions in a model of contact tracing. PNAS Nexus 2023, 2, pgad003. [Google Scholar] [CrossRef]
- Landau, S. People Count: Contact-Tracing Apps and Public Health; MIT Press: Cambridge, MA, USA, 2021. [Google Scholar]
- Rodríguez, P.; Graña, S.; Alvarez-León, E.E.; Battaglini, M.; Darias, F.J.; Hernán, M.A.; López, R.; Llaneza, P.; Martín, M.C.; Ramirez-Rubio, O.; et al. A population-based controlled experiment assessing the epidemiological impact of digital contact tracing. Nat. Commun. 2021, 12, 587. [Google Scholar] [CrossRef] [PubMed]
- Anglemyer, A.; Moore, T.H.; Parker, L.; Chambers, T.; Grady, A.; Chiu, K.; Parry, M.; Wilczynska, M.; Flemyng, E.; Bero, L. Digital contact tracing technologies in epidemics: A rapid review. Cochrane Database Syst. Rev. 2020, 8, CD013699. [Google Scholar]
- Kleinman, R.A.; Merkel, C. Digital contact tracing for COVID-19. CMAJ 2020, 192, E653–E656. [Google Scholar] [CrossRef] [PubMed]
- Trivedi, A.; Vasisht, D. Digital contact tracing: Technologies, shortcomings, and the path forward. ACM SIGCOMM Comput. Commun. Rev. 2020, 50, 75–81. [Google Scholar] [CrossRef]
- Loh, P.S.; Bershteyn, A.; Yee, S.K. Lessons learned in piloting a digital personalized COVID-19 “Radar” on a university campus. Public Health Rep. 2022, 137, 76S–82S. [Google Scholar] [CrossRef]
- Trivedi, A.; Zakaria, C.; Balan, R.; Becker, A.; Corey, G.; Shenoy, P. WiFiTrace: Network-based contact tracing for infectious diseases using passive WiFi sensing. Proc. ACM Interact. Mob. Wearable Ubiquitous Technol. 2021, 5, 1–26. [Google Scholar] [CrossRef]
- Wang, S.; Ding, S.; Xiong, L. A new system for surveillance and digital contact tracing for COVID-19: Spatiotemporal reporting over network and GPS. JMIR mHealth uHealth 2020, 8, e19457. [Google Scholar] [CrossRef] [PubMed]
- Zhao, Q.; Wen, H.; Lin, Z.; Xuan, D.; Shroff, N. On the accuracy of measured proximity of Bluetooth-based contact tracing apps. In Proceedings of the International Conference on Security and Privacy in Communication Systems, Washington, DC, USA, 21–23 October 2020; pp. 49–60. [Google Scholar]
- Hatke, G.F.; Montanari, M.; Appadwedula, S.; Wentz, M.; Meklenburg, J.; Ivers, L.; Watson, J.; Fiore, P. Using Bluetooth Low Energy (BLE) signal strength estimation to facilitate contact tracing for COVID-19. arXiv 2020, arXiv:2006.15711. [Google Scholar]
- Bengio, Y.; Janda, R.; Yu, Y.W.; Ippolito, D.; Jarvie, M.; Pilat, D.; Struck, B.; Krastev, S.; Sharma, A. The need for privacy with public digital contact tracing during the COVID-19 pandemic. Lancet Digit. Health 2020, 2, e342–e344. [Google Scholar] [CrossRef]
- Alsdurf, H.; Belliveau, E.; Bengio, Y.; Deleu, T.; Gupta, P.; Ippolito, D.; Janda, R.; Jarvie, M.; Kolody, T.; Krastev, S.; et al. COVI white paper. arXiv 2020, arXiv:2005.08502. [Google Scholar]
- Xu, H.; Zhang, L.; Onireti, O.; Fang, Y.; Buchanan, W.J.; Imran, M.A. BeepTrace: Blockchain-enabled privacy-preserving contact tracing for COVID-19 pandemic and beyond. IEEE Internet Things J. 2020, 8, 3915–3929. [Google Scholar] [CrossRef]
- Troncoso, C.; Payer, M.; Hubaux, J.P.; Salathé, M.; Larus, J.; Bugnion, E.; Lueks, W.; Stadler, T.; Pyrgelis, A.; Antonioli, D.; et al. Decentralized privacy-preserving proximity tracing. arXiv 2020, arXiv:2005.12273. [Google Scholar] [CrossRef]
- Troncoso, C.; Bogdanov, D.; Bugnion, E.; Chatel, S.; Cremers, C.; Gürses, S.; Hubaux, J.P.; Jackson, D.; Larus, J.R.; Lueks, W.; et al. Deploying decentralized, privacy-preserving proximity tracing. Commun. ACM 2022, 65, 48–57. [Google Scholar] [CrossRef]
- Li, J.; Guo, X. COVID-19 contact-tracing apps: A survey on the global deployment and challenges. arXiv 2020, arXiv:2005.03599. [Google Scholar]
- Yu, P.D.; Tan, C.W.; Fu, H.L. Epidemic source detection in contact tracing networks: Epidemic centrality in graphs and message-passing algorithms. IEEE J. Sel. Top. Signal Process. 2022, 16, 234–249. [Google Scholar] [CrossRef]
- Tan, C.W.; Yu, P.D. Contagion source detection in epidemic and infodemic outbreaks: Mathematical analysis and network algorithms. Found. Trends® Netw. 2023, 13, 107–251. [Google Scholar]
- Fei, Z.; Ryeznik, Y.; Sverdlov, A.; Tan, C.W.; Wong, W.K. An overview of healthcare data analytics with applications to the COVID-19 pandemic. IEEE Trans. Big Data 2021, 8, 1463–1480. [Google Scholar] [CrossRef]
- Bengio, Y.; Gupta, P.; Maharaj, T.; Rahaman, N.; Weiss, M.; Deleu, T.; Muller, E.B.; Qu, M.; Schmidt, V.; St-Charles, P.-L.; et al. Predicting infectiousness for proactive contact tracing. In Proceedings of the 9th International Conference on Learning Representations (ICLR), Virtual Conference, 3–7 May 2021. [Google Scholar]
- Gupta, P.; Maharaj, T.; Weiss, M.; Rahaman, N.; Alsdurf, H.; Sharma, A.; Minoyan, N.; Harnois-Leblanc, S.; Schmidt, V.; Charles, P.L.S.; et al. COVI-AgentSim: An agent-based model for evaluating methods of digital contact tracing. arXiv 2020, arXiv:2010.16004. [Google Scholar]
- Ojokoh, B.A.; Aribisala, B.; Sarumi, O.A.; Gabriel, A.J.; Omisore, O.; Taiwo, A.E.; Igbe, T.; Chukwuocha, U.M.; Yusuf, T.; Afolayan, A.; et al. Contact tracing strategies for COVID-19 prevention and containment: A scoping review. Big Data Cogn. Comput. 2022, 6, 111. [Google Scholar] [CrossRef]
- Mondal, M.R.H.; Bharati, S.; Podder, P. Diagnosis of COVID-19 using machine learning and deep learning: A review. Curr. Med. Imaging 2021, 17, 1403–1418. [Google Scholar] [PubMed]
- Agbehadji, I.E.; Awuzie, B.O.; Ngowi, A.B.; Millham, R.C. Review of big data analytics, artificial intelligence and nature-inspired computing models towards accurate detection of COVID-19 pandemic cases and contact tracing. Int. J. Environ. Res. Public Health 2020, 17, 5330. [Google Scholar] [CrossRef] [PubMed]
- Mbunge, E. Integrating emerging technologies into COVID-19 contact tracing: Opportunities, challenges and pitfalls. Diabetes Metab. Syndr. Clin. Res. Rev. 2020, 14, 1631–1636. [Google Scholar] [CrossRef]
- Lalmuanawma, S.; Hussain, J.; Chhakchhuak, L. Applications of machine learning and artificial intelligence for Covid-19 (SARS-CoV-2) pandemic: A review. Chaos Solitons Fractals 2020, 139, 110059. [Google Scholar] [CrossRef] [PubMed]
- Altmann, S.; Milsom, L.; Zillessen, H.; Blasone, R.; Gerdon, F.; Bach, R.; Kreuter, F.; Nosenzo, D.; Toussaert, S.; Abeler, J. Acceptability of app-based contact tracing for COVID-19: Cross-country survey study. JMIR mHealth uHealth 2020, 8, e19857. [Google Scholar] [CrossRef]
- Ahmed, N.; Michelin, R.A.; Xue, W.; Ruj, S.; Malaney, R.; Kanhere, S.S.; Seneviratne, A.; Hu, W.; Janicke, H.; Jha, S.K. A survey of COVID-19 contact tracing apps. IEEE Access 2020, 8, 134577–134601. [Google Scholar] [CrossRef]
- Alanzi, T. A review of mobile applications available in the App and Google Play stores used during the COVID-19 outbreak. J. Multidiscip. Healthc. 2021, 14, 45–57. [Google Scholar] [CrossRef]
- Allen, W.E.; Altae-Tran, H.; Briggs, J.; Jin, X.; McGee, G.; Shi, A.; Raghavan, R.; Kamariza, M.; Nova, N.; Pereta, A.; et al. Population-scale longitudinal mapping of COVID-19 symptoms, behaviour and testing. Nat. Hum. Behav. 2020, 4, 972–982. [Google Scholar] [CrossRef] [PubMed]
- NHSx. Risk-Scoring Algorithm (Interim): Technical Information. 2020. Available online: https://www.gov.uk/government/collections/nhs-covid-19-app (accessed on 20 April 2023).
- Loh, P.S. Flipping the perspective in contact tracing. arXiv 2020, arXiv:2010.03806. [Google Scholar]
- Freifeld, C.C.; Chunara, R.; Mekaru, S.R.; Chan, E.H.; Kass-Hout, T.; Ayala Iacucci, A.; Brownstein, J.S. Participatory epidemiology: Use of mobile phones for community-based health reporting. PLoS Med. 2010, 7, e1000376. [Google Scholar] [CrossRef] [PubMed]
- Hellewell, J.; Abbott, S.; Gimma, A.; Bosse, N.I.; Jarvis, C.I.; Russell, T.W.; Munday, J.D.; Kucharski, A.J.; Edmunds, W.J.; Sun, F.; et al. Feasibility of controlling COVID-19 outbreaks by isolation of cases and contacts. Lancet Glob. Health 2020, 8, e488–e496. [Google Scholar] [CrossRef]
- Aleta, A.; Martin-Corral, D.; y Piontti, A.P.; Ajelli, M.; Litvinova, M.; Chinazzi, M.; Dean, N.E.; Halloran, M.E.; Longini, I.M., Jr.; Merler, S.; et al. Modelling the impact of testing, contact tracing and household quarantine on second waves of COVID-19. Nat. Hum. Behav. 2020, 4, 964–971. [Google Scholar] [CrossRef]
- Hinch, R.; Probert, W.J.M.; Nurtay, A.; Kendall, M.; Wymant, C.; Hall, M.; Lythgoe, K.; Bulas Cruz, A.; Zhao, L.; Stewart, A.; et al. OpenABM-Covid19—An agent-based model for non-pharmaceutical interventions against COVID-19 including contact tracing. PLoS Comput. Biol. 2021, 17, 1–26. [Google Scholar] [CrossRef]
- Grantz, K.H.; Lee, E.C.; D’Agostino McGowan, L.; Lee, K.H.; Metcalf, C.J.E.; Gurley, E.S.; Lessler, J. Maximizing and evaluating the impact of test-trace-isolate programs: A modeling study. PLoS Med. 2021, 18, 1–16. [Google Scholar] [CrossRef]
- Tan, C.W.; Yu, P.D.; Chen, S.; Poor, H.V. DeepTrace: Learning to optimize contact tracing in epidemic networks with Graph Neural Networks. arXiv 2022, arXiv:2211.00880. [Google Scholar]
- Endo, A.; Leclerc, Q.J.; Knight, G.M.; Medley, G.F.; Atkins, K.E.; Funk, S.; Kucharski, A.J. Implication of backward contact tracing in the presence of overdispersed transmission in COVID-19 outbreaks. Wellcome Open Res. 2020, 5, 239. [Google Scholar] [CrossRef]
- Müller, J.; Kretzschmar, M. Forward thinking on backward tracing. Nat. Phys. 2021, 17, 555–556. [Google Scholar] [CrossRef]
- Kojaku, S.; Hébert-Dufresne, L.; Mones, E.; Lehmann, S.; Ahn, Y.Y. The effectiveness of backward contact tracing in networks. Nat. Phys. 2021, 17, 652–658. [Google Scholar] [CrossRef]
- Raymenants, J.; Geenen, C.; Thibaut, J.; Nelissen, K.; Gorissen, S.; Andre, E. Empirical evidence on the efficiency of backward contact tracing in COVID-19. Nat. Commun. 2022, 13, 4750. [Google Scholar] [CrossRef]
- Ginsberg, J.; Mohebbi, M.H.; Patel, R.S.; Brammer, L.; Smolinski, M.S.; Brilliant, L. Detecting influenza epidemics using search engine query data. Nature 2009, 457, 1012–1014. [Google Scholar] [CrossRef]
- Gallotti, R.; Valle, F.; Castaldo, N.; Sacco, P.; De Domenico, M. Assessing the risks of `infodemics’ in response to COVID-19 epidemics. Nat. Hum. Behav. 2020, 4, 1285–1293. [Google Scholar] [CrossRef] [PubMed]
- Briers, M.; Charalambides, M.; Holmes, C. Risk scoring calculation for the current NHSx contact tracing app. arXiv 2020, arXiv:2005.11057. [Google Scholar]
- Herbrich, R.; Rastogi, R.; Vollgraf, R. CRISP: A probabilistic model for individual-level COVID-19 infection risk estimation based on contact data. arXiv 2020, arXiv:2006.04942. [Google Scholar]
- Leung, K.; Wu, J.T.; Leung, G.M. Real-time tracking and prediction of COVID-19 infection using digital proxies of population mobility and mixing. Nat. Commun. 2021, 12, 1501. [Google Scholar] [CrossRef]
- Baker, A.; Biazzo, I.; Braunstein, A.; Catania, G.; Dall’Asta, L.; Ingrosso, A.; Krzakala, F.; Mazza, F.; Mézard, M.; Muntoni, A.P.; et al. Epidemic mitigation by statistical inference from contact tracing data. Proc. Natl. Acad. Sci. USA 2021, 118, e2106548118. [Google Scholar] [CrossRef]
- Murphy, K.; Kumar, A.; Serghiou, S. Risk score learning for COVID-19 contact tracing apps. In Proceedings of the 6th Machine Learning for Healthcare Conference, Virtual, 6–7 August 2021; pp. 373–390. [Google Scholar]
- Fenton, N.E.; McLachlan, S.; Lucas, P.; Dube, K.; Hitman, G.A.; Osman, M.; Kyrimi, E.; Neil, M. A Bayesian network model for personalised COVID19 risk assessment and contact tracing. medRxiv 2021. [Google Scholar] [CrossRef]
- Lorch, L.; Kremer, H.; Trouleau, W.; Tsirtsis, S.; Szanto, A.; Schölkopf, B.; Gomez-Rodriguez, M. Quantifying the effects of contact tracing, testing, and containment measures in the presence of infection hotspots. ACM Trans. Spat. Algorithms Syst. 2022, 8, 1–28. [Google Scholar] [CrossRef]
- Rivest, R.; Schiefelbein, M.C.; Zissman, M.A.; Bay, J.; Bugnion, E.; Finnerty, J.; Liccardi, I.; Nelson, B.; Norige, A.S.; Shen, E.H.; et al. Automated Exposure Notification for COVID-19; Lincoln Laboratory Technical Report; TR-1288; MIT: Cambridge, MA, USA, 2023. [Google Scholar]
- Gupta, P.; Maharaj, T.; Weiss, M.; Rahaman, N.; Alsdurf, H.; Minoyan, N.; Harnois-Leblanc, S.; Merckx, J.; Williams, A.; Schmidt, V.; et al. Proactive contact tracing. PLoS Digit. Health 2023, 2, e0000199. [Google Scholar] [CrossRef] [PubMed]
- Feng, T.; Song, S.; Xia, T.; Li, Y. Contact tracing and epidemic intervention via deep reinforcement learning. ACM Trans. Knowl. Discov. Data 2023, 17, 1–24. [Google Scholar] [CrossRef]
- Goodfellow, I.; Bengio, Y.; Courville, A. Deep Learning; MIT Press: Cambridge, MA, USA, 2016. [Google Scholar]
- Page, M.J.; McKenzie, J.E.; Bossuyt, P.M.; Boutron, I.; Hoffmann, T.C.; Mulrow, C.D.; Shamseer, L.; Tetzlaff, J.M.; Akl, E.A.; Brennan, S.E.; et al. The PRISMA 2020 statement: An updated guideline for reporting systematic reviews. Int. J. Surg. 2021, 88, 105906. [Google Scholar] [CrossRef]
- Kotaru, M.; Joshi, K.; Bharadia, D.; Katti, S. SpotFi: Decimeter level localization using WiFi. In Proceedings of the 2015 ACM Conference on Special Interest Group on Data Communication, London, UK, 17–21 August 2015; pp. 269–282. [Google Scholar]
- Margolies, R.; Becker, R.; Byers, S.; Deb, S.; Jana, R.; Urbanek, S.; Volinsky, C. Can you find me now? Evaluation of network-based localization in a 4G LTE network. In Proceedings of the IEEE INFOCOM 2017—IEEE Conference on Computer Communications, Atlanta, GA, USA, 1–4 May 2017; pp. 1–9. [Google Scholar]
- Tsai, Y.Z.; Chen, J. Network-side 5G mmWave channel signatures for pandemic contact tracing. In Proceedings of the ICC 2022—IEEE International Conference on Communications, Seoul, Republic of Korea, 16–20 May 2022; pp. 3598–3603. [Google Scholar]
- Ke, G.; Meng, Q.; Finley, T.; Wang, T.; Chen, W.; Ma, W.; Ye, Q.; Liu, T.Y. LightGBM: A highly efficient gradient boosting decision tree. Adv. Neural Inf. Process. Syst. 2017, 30, 3146–3154. [Google Scholar]
- Ye, J.; Chow, J.H.; Chen, J.; Zheng, Z. Stochastic gradient boosted distributed decision trees. In Proceedings of the 18th ACM Conference on Information and Knowledge Management, Hong Kong, China, 2–6 November 2009; pp. 2061–2064. [Google Scholar]
- Coadou, Y. Boosted decision trees and applications. In Proceedings of the EPJ Web of Conferences, Autrans, France, 28 May–2 June 2012. [Google Scholar]
- Gu, J.; Wang, Z.; Kuen, J.; Ma, L.; Shahroudy, A.; Shuai, B.; Liu, T.; Wang, X.; Wang, G.; Cai, J.; et al. Recent advances in convolutional neural networks. Pattern Recognit. 2018, 77, 354–377. [Google Scholar] [CrossRef]
- O’Shea, K.; Nash, R. An introduction to convolutional neural networks. arXiv 2015, arXiv:1511.08458. [Google Scholar]
- Albawi, S.; Mohammed, T.A.; Al-Zawi, S. Understanding of a convolutional neural network. In Proceedings of the 2017 International Conference on Engineering and Technology (ICET), Antalya, Turkey, 21–23 August 2017; pp. 1–6. [Google Scholar]
- Shah, D.; Zaman, T. Rumors in a network: Who’s the culprit? IEEE Trans. Inf. Theory 2011, 57, 5163–5181. [Google Scholar] [CrossRef]
- Gomez-Rodriguez, M.; Leskovec, J.; Krause, A. Inferring networks of diffusion and influence. ACM Trans. Knowl. Discov. Data 2012, 5, 1–37. [Google Scholar]
- Yu, P.D.; Tan, C.W.; Fu, H.L. Averting cascading failures in networked infrastructures: Poset-constrained graph algorithms. IEEE J. Sel. Top. Signal Process. 2018, 12, 733–748. [Google Scholar] [CrossRef]
- Shah, D.; Zaman, T. Detecting sources of computer viruses in networks: Theory and experiment. In Proceedings of the ACM SIGMETRICS International Conference on Measurement and Modeling of Computer Systems, New York, NY, USA, 14–18 June 2010; pp. 203–214. [Google Scholar]
- Zhu, K.; Ying, L. Information source detection in the SIR model: A sample-path-based approach. IEEE/ACM Trans. Netw. 2016, 24, 408–421. [Google Scholar] [CrossRef]
- Hamilton, W.L.; Ying, Z.; Leskovec, J. Inductive representation learning on large graphs. In Proceedings of the International Conference on Neural Information Processing Systems, Long Beach, CA, USA, 4–9 December 2017; pp. 1025–1035. [Google Scholar]
- Zheng, L.; Tan, C.W. A probabilistic characterization of the rumor graph boundary in rumor source detection. In Proceedings of the 2015 IEEE International Conference on Digital Signal Processing (DSP), Singapore, 21–24 July 2015; pp. 765–769. [Google Scholar]
- Eagle, N.; Pentland, A.; Lazer, D. Inferring friendship network structure by using mobile phone data. Proc. Natl. Acad. Sci. USA 2009, 106, 15274–15278. [Google Scholar] [CrossRef] [PubMed]
- Zaheer, M.; Kottur, S.; Ravanbakhsh, S.; Poczos, B.; Salakhutdinov, R.R.; Smola, A.J. Deep Sets. Adv. Neural Inf. Process. Syst. 2017, 30, 3391–3401. [Google Scholar]
- Lee, J.; Lee, Y.; Kim, J.; Kosiorek, A.; Choi, S.; Teh, Y.W. Set Transformer: A framework for attention-based permutation-invariant neural networks. In Proceedings of the 36th International Conference on Machine Learning, Long Beach, CA, USA, 10–15 June 2019; pp. 3744–3753. [Google Scholar]
- Edwards, H.; Storkey, A. Towards a neural statistician. arXiv 2016, arXiv:1606.02185. [Google Scholar]
- Xu, D. Modeling of network based digital contact tracing and testing strategies, including the pre-exposure notification system, for the COVID-19 pandemic. Math. Biosci. 2021, 338, 108645. [Google Scholar] [CrossRef]
- Zhang, B.; Wang, R.; Xu, H.; Zhang, X.; Zhang, L. DISTERNING: Distance estimation using machine learning approach for COVID-19 contact tracing and beyond. IEEE J. Sel. Areas Commun. 2022, 40, 3207–3223. [Google Scholar] [CrossRef]
- Yi, F.; Xie, Y.; Jamieson, K. Cellular-Assisted, Deep learning based COVID-19 contact tracing. Proc. ACM Interact. Mob. Wearable Ubiquitous Technol. 2022, 6, 1–27. [Google Scholar] [CrossRef]
- Veličković, P.; Fedus, W.; Hamilton, W.L.; Liò, P.; Bengio, Y.; Hjelm, R.D. Deep Graph Infomax. In Proceedings of the 7th International Conference on Learning Representations (ICLR), New Orleans, LA, USA, 6–9 May 2019. [Google Scholar]
- Wong, A.K.; You, M. Entropy and distance of random graphs with application to structural pattern recognition. IEEE Trans. Pattern Anal. Mach. Intell. 1985, PAMI-7, 599–609. [Google Scholar] [CrossRef]
- Chen, H.; Friedman, J.H. A new graph-based two-sample test for multivariate and object data. J. Am. Stat. Assoc. 2017, 112, 397–409. [Google Scholar] [CrossRef]
- Lopez-Paz, D.; Oquab, M. Revisiting classifier two-sample tests. arXiv 2016, arXiv:1610.06545. [Google Scholar]
- Liu, X.; Fu, L.; Wang, X.; Zhou, C. On the similarity between von Neumann graph entropy and structural information: Interpretation, computation, and applications. IEEE Trans. Inf. Theory 2022, 68, 2182–2202. [Google Scholar] [CrossRef]
- Wu, X.; Liu, Z. How community structure influences epidemic spread in social networks. Phys. A Stat. Mech. Its Appl. 2008, 387, 623–630. [Google Scholar] [CrossRef]
- Kuo, C.Y.; Hang, C.N.; Yu, P.D.; Tan, C.W. Parallel counting of triangles in large graphs: Pruning and hierarchical clustering algorithms. In Proceedings of the 2018 IEEE High Performance Extreme Computing Conference (HPEC), Waltham, MA, USA, 25–27 September 2018; pp. 1–6. [Google Scholar]
- Preciado, V.M.; Zargham, M.; Enyioha, C.; Jadbabaie, A.; Pappas, G. Optimal vaccine allocation to control epidemic outbreaks in arbitrary networks. In Proceedings of the 52nd IEEE Conference on Decision and Control, Firenze, Italy, 10–13 December 2013; pp. 7486–7491. [Google Scholar]
- Jalili, M.; Perc, M. Information cascades in complex networks. J. Complex Netw. 2017, 5, 665–693. [Google Scholar] [CrossRef]
- Eubank, S.; Guclu, H.; Anil Kumar, V.; Marathe, M.V.; Srinivasan, A.; Toroczkai, Z.; Wang, N. Modelling disease outbreaks in realistic urban social networks. Nature 2004, 429, 180–184. [Google Scholar] [CrossRef]
- Newman, M.E. Spread of epidemic disease on networks. Phys. Rev. E 2002, 66, 016128. [Google Scholar] [CrossRef]
- Bhapkar, H.; Mahalle, P.N.; Dhotre, P.S. Virus graph and COVID-19 pandemic: A graph theory approach. In Big Data Analytics and Artificial Intelligence against COVID-19: Innovation Vision and Approach; Springer: Cham, Switzerland, 2020; pp. 15–34. [Google Scholar]
- Page, L.; Brin, S.; Motwani, R.; Winograd, T. The PageRank Citation Ranking: Bringing Order to the Web; Technical Report; Stanford InfoLab: Stanford, CA, USA, 1999. [Google Scholar]
- Negahban, S.; Oh, S.; Shah, D. Iterative ranking from pair-wise comparisons. Adv. Neural Inf. Process. Syst. 2012, 25, 2474–2482. [Google Scholar]
- Karger, D.; Oh, S.; Shah, D. Iterative learning for reliable crowdsourcing systems. Adv. Neural Inf. Process. Syst. 2011, 24, 1953–1961. [Google Scholar]
- Sun, K.; Chen, J.; Viboud, C. Early epidemiological analysis of the coronavirus disease 2019 outbreak based on crowdsourced data: A population-level observational study. Lancet Digit. Health 2020, 2, e201–e208. [Google Scholar] [CrossRef] [PubMed]
- He, X.; Gao, M.; Kan, M.Y.; Wang, D. BiRank: Towards ranking on bipartite graphs. IEEE Trans. Knowl. Data Eng. 2016, 29, 57–71. [Google Scholar] [CrossRef]
- Yang, K.C.; Aronson, B.; Ahn, Y.Y. BiRank: Fast and flexible ranking on bipartite networks with R and Python. J. Open Source Softw. 2020, 5, 2315. [Google Scholar] [CrossRef] [PubMed]
- Chung, F.; Horn, P.; Tsiatas, A. Distributing antidote using PageRank vectors. Internet Math. 2009, 6, 237–254. [Google Scholar] [CrossRef]
- Vaswani, A.; Shazeer, N.; Parmar, N.; Uszkoreit, J.; Jones, L.; Gomez, A.N.; Kaiser, Ł.; Polosukhin, I. Attention is all you need. Adv. Neural Inf. Process. Syst. 2017, 30, 5998–6008. [Google Scholar]
- Haug, N.; Geyrhofer, L.; Londei, A.; Dervic, E.; Desvars-Larrive, A.; Loreto, V.; Pinior, B.; Thurner, S.; Klimek, P. Ranking the effectiveness of worldwide COVID-19 government interventions. Nat. Hum. Behav. 2020, 4, 1303–1312. [Google Scholar] [CrossRef] [PubMed]
- Tang, S.; Hu, X.; Atlas, L.; Khanzada, A.; Pilanci, M. Hierarchical multi-modal transformer for automatic detection of COVID-19. In Proceedings of the 2022 5th International Conference on Signal Processing and Machine Learning, Dalian, China, 4–6 August 2022; pp. 197–202. [Google Scholar]
- Ahmad, K.; Alam, F.; Qadir, J.; Qolomany, B.; Khan, I.; Khan, T.; Suleman, M.; Said, N.; Hassan, S.Z.; Gul, A.; et al. Global user-level perception of COVID-19 contact tracing applications: Data-driven approach using natural language processing. JMIR Form. Res. 2022, 6, e36238. [Google Scholar] [CrossRef]
- Ying, C.; Cai, T.; Luo, S.; Zheng, S.; Ke, G.; He, D.; Shen, Y.; Liu, T.Y. Do transformers really perform badly for graph representation? Adv. Neural Inf. Process. Syst. 2021, 34, 28877–28888. [Google Scholar]
- Zhang, J.; Zhang, H.; Xia, C.; Sun, L. GRAPH-BERT: Only attention is needed for learning graph representations. arXiv 2020, arXiv:2001.05140. [Google Scholar]
- Dwivedi, V.P.; Bresson, X. A generalization of transformer networks to graphs. arXiv 2020, arXiv:2012.09699. [Google Scholar]
- Yun, S.; Jeong, M.; Kim, R.; Kang, J.; Kim, H.J. Graph transformer networks. Adv. Neural Inf. Process. Syst. 2019, 32, 11983–11993. [Google Scholar]
- Rampášek, L.; Galkin, M.; Dwivedi, V.P.; Luu, A.T.; Wolf, G.; Beaini, D. Recipe for a general, powerful, scalable graph transformer. arXiv 2022, arXiv:2205.12454. [Google Scholar]
- Joshi, C. Transformers are graph neural networks. The Gradient 2020. Available online: https://graphdeeplearning.github.io/post/transformers-are-gnns/ (accessed on 20 April 2023).
- Xu, B.; Gutierrez, B.; Mekaru, S.; Sewalk, K.; Goodwin, L.; Loskill, A.; Cohn, E.L.; Hswen, Y.; Hill, S.C.; Cobo, M.M.; et al. Epidemiological data from the COVID-19 outbreak, real-time case information. Sci. Data 2020, 7, 106. [Google Scholar] [CrossRef]
- Adam, D.C.; Wu, P.; Wong, J.Y.; Lau, E.H.; Tsang, T.K.; Cauchemez, S.; Leung, G.M.; Cowling, B.J. Clustering and superspreading potential of SARS-CoV-2 infections in Hong Kong. Nat. Med. 2020, 26, 1714–1719. [Google Scholar] [CrossRef]
- Serafino, M.; Monteiro, H.S.; Luo, S.; Reis, S.D.; Igual, C.; Lima Neto, A.S.; Travizano, M.; Andrade, J.S., Jr.; Makse, H.A. Digital contact tracing and network theory to stop the spread of COVID-19 using big-data on human mobility geolocalization. PLoS Comput. Biol. 2022, 18, e1009865. [Google Scholar] [CrossRef] [PubMed]
- Moosa, J.; Awad, W.; Kalganova, T. COVID-19 contact-tracing networks datasets. In Proceedings of the 2023 International Conference on IT Innovation and Knowledge Discovery (ITIKD), Manama, Bahrain, 8–9 March 2023; pp. 1–4. [Google Scholar]
- Konečnỳ, J.; McMahan, H.B.; Yu, F.X.; Richtárik, P.; Suresh, A.T.; Bacon, D. Federated learning: Strategies for improving communication efficiency. arXiv 2016, arXiv:1610.05492. [Google Scholar]
- Yang, Q.; Liu, Y.; Chen, T.; Tong, Y. Federated machine learning: Concept and applications. ACM Trans. Intell. Syst. Technol. (TIST) 2019, 10, 1–19. [Google Scholar] [CrossRef]
- Li, T.; Sahu, A.K.; Talwalkar, A.; Smith, V. Federated learning: Challenges, methods, and future directions. IEEE Signal Process. Mag. 2020, 37, 50–60. [Google Scholar] [CrossRef]
- Nguyen, H.T.; Sehwag, V.; Hosseinalipour, S.; Brinton, C.G.; Chiang, M.; Poor, H.V. Fast-convergent federated learning. IEEE J. Sel. Areas Commun. 2020, 39, 201–218. [Google Scholar] [CrossRef]
- Kairouz, P.; McMahan, H.B.; Avent, B.; Bellet, A.; Bennis, M.; Bhagoji, A.N.; Bonawitz, K.; Charles, Z.; Cormode, G.; Cummings, R.; et al. Advances and open problems in federated learning. Found. Trends® Mach. Learn. 2021, 14, 1–210. [Google Scholar] [CrossRef]
- Dwork, C. Differential privacy. In Proceedings of the 33rd International Colloquium on Automata, Languages, and Programming (ICALP), Venice, Italy, 10–14 July 2006; pp. 1–12. [Google Scholar]
- Dwork, C. Differential privacy: A survey of results. In Proceedings of the 5th International Conference on Theory and Applications of Models of Computation (TAMC), Xi’an, China, 25–29 April 2008; pp. 1–19. [Google Scholar]
- Dwork, C.; Roth, A. The algorithmic foundations of differential privacy. Found. Trends® Theor. Comput. Sci. 2014, 9, 211–407. [Google Scholar] [CrossRef]
- Hsu, H.; Martinez, N.; Bertran, M.; Sapiro, G.; Calmon, F.P. A survey on statistical, information, and estimation—Theoretic views on privacy. IEEE BITS Inf. Theory Mag. 2021, 1, 45–56. [Google Scholar] [CrossRef]
- Abadi, M.; Chu, A.; Goodfellow, I.; McMahan, H.B.; Mironov, I.; Talwar, K.; Zhang, L. Deep learning with differential privacy. In Proceedings of the 2016 ACM SIGSAC Conference on Computer and Communications Security, Vienna, Austria, 24–28 October 2016; pp. 308–318. [Google Scholar]
- Sarwate, A.D.; Chaudhuri, K. Signal processing and machine learning with differential privacy: Algorithms and challenges for continuous data. IEEE Signal Process. Mag. 2013, 30, 86–94. [Google Scholar] [CrossRef]
- Ji, Z.; Lipton, Z.C.; Elkan, C. Differential privacy and machine learning: A survey and review. arXiv 2014, arXiv:1412.7584. [Google Scholar]
- Zhu, T.; Ye, D.; Wang, W.; Zhou, W.; Philip, S.Y. More than privacy: Applying differential privacy in key areas of artificial intelligence. IEEE Trans. Knowl. Data Eng. 2020, 34, 2824–2843. [Google Scholar] [CrossRef]
- Blanco-Justicia, A.; Sánchez, D.; Domingo-Ferrer, J.; Muralidhar, K. A critical review on the use (and misuse) of differential privacy in machine learning. ACM Comput. Surv. 2022, 55, 1–16. [Google Scholar] [CrossRef]
- Bun, M.; Steinke, T. Concentrated differential privacy: Simplifications, extensions, and lower bounds. In Proceedings of the 14th Theory of Cryptography Conference (TCC), Beijing, China, 31 October–3 November 2016; pp. 635–658. [Google Scholar]
- Kairouz, P.; McMahan, B.; Song, S.; Thakkar, O.; Thakurta, A.; Xu, Z. Practical and private (deep) learning without sampling or shuffling. In Proceedings of the 38th International Conference on Machine Learning, Virtual, 18–24 July 2021; pp. 5213–5225. [Google Scholar]
- Konečnỳ, J.; McMahan, H.B.; Ramage, D.; Richtárik, P. Federated optimization: Distributed machine learning for on-device intelligence. arXiv 2016, arXiv:1610.02527. [Google Scholar]
- McMahan, B.; Moore, E.; Ramage, D.; Hampson, S.; y Arcas, B.A. Communication-efficient learning of deep networks from decentralized data. In Proceedings of the 20th International Conference on Artificial Intelligence and Statistics, Ft. Lauderdale, FL, USA, 20–22 April 2017; pp. 1273–1282. [Google Scholar]
- Arachchige, P.C.M.; Bertok, P.; Khalil, I.; Liu, D.; Camtepe, S.; Atiquzzaman, M. Local differential privacy for deep learning. IEEE Internet Things J. 2019, 7, 5827–5842. [Google Scholar] [CrossRef]
- Bonawitz, K.; Kairouz, P.; McMahan, B.; Ramage, D. Federated learning and privacy: Building privacy-preserving systems for machine learning and data science on decentralized data. Queue 2021, 19, 87–114. [Google Scholar] [CrossRef]
- McMahan, B.; Thakurta, A. Federated Learning with Formal Differential Privacy Guarantees. Available online: https://ai.googleblog.com/2022/02/federated-learning-with-formal.html (accessed on 20 April 2023).
- Wu, C.; Wu, F.; Lyu, L.; Qi, T.; Huang, Y.; Xie, X. A federated graph neural network framework for privacy-preserving personalization. Nat. Commun. 2022, 13, 3091. [Google Scholar] [CrossRef]
- Truex, S.; Liu, L.; Chow, K.H.; Gursoy, M.E.; Wei, W. LDP-Fed: Federated learning with local differential privacy. In Proceedings of the Third ACM International Workshop on Edge Systems, Analytics and Networking, Heraklion, Greece, 27 April 2020; pp. 61–66. [Google Scholar]
- Balle, B.; Kairouz, P.; McMahan, B.; Thakkar, O.; Guha Thakurta, A. Privacy amplification via random check-ins. Adv. Neural Inf. Process. Syst. 2020, 33, 4623–4634. [Google Scholar]
- McMahan, H.B.; Ramage, D.; Talwar, K.; Zhang, L. Learning differentially private recurrent language models. arXiv 2017, arXiv:1710.06963. [Google Scholar]
- Ramaswamy, S.; Thakkar, O.; Mathews, R.; Andrew, G.; McMahan, H.B.; Beaufays, F. Training production language models without memorizing user data. arXiv 2020, arXiv:2009.10031. [Google Scholar]
- Thakkar, O.; Ramaswamy, S.; Mathews, R.; Beaufays, F. Understanding unintended memorization in federated learning. arXiv 2020, arXiv:2006.07490. [Google Scholar]
- Bonawitz, K.; Eichner, H.; Grieskamp, W.; Huba, D.; Ingerman, A.; Ivanov, V.; Kiddon, C.; Konečný, J.; Mazzocchi, S.; McMahan, B.; et al. Towards federated learning at scale: System design. Proc. Mach. Learn. Syst. 2019, 1, 374–388. [Google Scholar]
- Knott, B.; Venkataraman, S.; Hannun, A.; Sengupta, S.; Ibrahim, M.; van der Maaten, L. Crypten: Secure multi-party computation meets machine learning. Adv. Neural Inf. Process. Syst. 2021, 34, 4961–4973. [Google Scholar]
- Kanagavelu, R.; Li, Z.; Samsudin, J.; Yang, Y.; Yang, F.; Goh, R.S.M.; Cheah, M.; Wiwatphonthana, P.; Akkarajitsakul, K.; Wang, S. Two-phase multi-party computation enabled privacy-preserving federated learning. In Proceedings of the 2020 20th IEEE/ACM International Symposium on Cluster, Cloud and Internet Computing (CCGRID), Melbourne, Australia, 11–14 May 2020; pp. 410–419. [Google Scholar]
- Zhang, C.; Li, S.; Xia, J.; Wang, W.; Yan, F.; Liu, Y. BatchCrypt: Efficient homomorphic encryption for cross-silo federated learning. In Proceedings of the 2020 USENIX Annual Technical Conference (USENIX ATC 2020), Virtual, 15–17 July 2020. [Google Scholar]
- Goodfellow, I.; Pouget-Abadie, J.; Mirza, M.; Xu, B.; Warde-Farley, D.; Ozair, S.; Courville, A.; Bengio, Y. Generative adversarial networks. Commun. ACM 2020, 63, 139–144. [Google Scholar] [CrossRef]
- Salimans, T.; Goodfellow, I.; Zaremba, W.; Cheung, V.; Radford, A.; Chen, X. Improved techniques for training GANs. Adv. Neural Inf. Process. Syst. 2016, 29, 2234–2242. [Google Scholar]
- Zhang, H.; Goodfellow, I.; Metaxas, D.; Odena, A. Self-attention generative adversarial networks. In Proceedings of the 36th International Conference on Machine Learning, Long Beach, CA, USA, 10–15 June 2019; pp. 7354–7363. [Google Scholar]
- Mao, X.; Li, Q.; Xie, H.; Lau, R.Y.; Wang, Z.; Paul Smolley, S. Least squares generative adversarial networks. In Proceedings of the IEEE International Conference on Computer Vision, Venice, Italy, 22–29 October 2017; pp. 2794–2802. [Google Scholar]
- Mirza, M.; Osindero, S. Conditional generative adversarial nets. arXiv 2014, arXiv:1411.1784. [Google Scholar]
- Wang, Y. A mathematical introduction to generative adversarial nets (GAN). arXiv 2020, arXiv:2009.00169. [Google Scholar]
- Tao, C.; Chen, L.; Henao, R.; Feng, J.; Duke, L.C. Chi-square generative adversarial network. In Proceedings of the 35th International Conference on Machine Learning, Stockholm, Sweden, 10–15 July 2018; pp. 4887–4896. [Google Scholar]
- Ho, J.; Ermon, S. Generative adversarial imitation learning. Adv. Neural Inf. Process. Syst. 2016, 29, 4565–4573. [Google Scholar]
- Guo, X.; Hong, J.; Lin, T.; Yang, N. Relaxed Wasserstein with applications to GANs. In Proceedings of the ICASSP 2021—2021 IEEE International Conference on Acoustics, Speech and Signal Processing (ICASSP), Toronto, ON, Canada, 6–11 June 2021; pp. 3325–3329. [Google Scholar]
- Yoon, J.; Jarrett, D.; Van der Schaar, M. Time-series generative adversarial networks. Adv. Neural Inf. Process. Syst. 2019, 32, 5508–5518. [Google Scholar]
- Bojchevski, A.; Shchur, O.; Zügner, D.; Günnemann, S. NetGAN: Generating graphs via random walks. In Proceedings of the 35th International Conference on Machine Learning, Stockholm, Sweden, 10–15 July 2018; pp. 610–619. [Google Scholar]
- Klaine, P.V.; Zhang, L.; Zhou, B.; Sun, Y.; Xu, H.; Imran, M. Privacy-preserving contact tracing and public risk assessment using blockchain for COVID-19 pandemic. IEEE Internet Things Mag. 2020, 3, 58–63. [Google Scholar] [CrossRef]
- Peng, Z.; Xu, C.; Wang, H.; Huang, J.; Xu, J.; Chu, X. P2B-Trace: Privacy-preserving blockchain-based contact tracing to combat pandemics. In Proceedings of the 2021 International Conference on Management of Data, Virtual, 20–25 June 2021; pp. 2389–2393. [Google Scholar]
- Idrees, S.M.; Nowostawski, M.; Jameel, R. Blockchain-based digital contact tracing apps for COVID-19 pandemic management: Issues, challenges, solutions, and future directions. JMIR Med. Inform. 2021, 9, e25245. [Google Scholar] [CrossRef] [PubMed]
- Sallam, M. ChatGPT utility in healthcare education, research, and practice: Systematic review on the promising perspectives and valid concerns. Healthcare 2023, 11, 887. [Google Scholar] [CrossRef] [PubMed]
- Kung, T.H.; Cheatham, M.; Medenilla, A.; Sillos, C.; De Leon, L.; Elepaño, C.; Madriaga, M.; Aggabao, R.; Diaz-Candido, G.; Maningo, J.; et al. Performance of ChatGPT on USMLE: Potential for AI-assisted medical education using large language models. PLoS Digit. Health 2023, 2, e0000198. [Google Scholar] [CrossRef] [PubMed]
- Oniani, D.; Wang, Y. A qualitative evaluation of language models on automatic question-answering for COVID-19. In Proceedings of the 11th ACM International Conference on Bioinformatics, Computational Biology and Health Informatics, Virtual, 21–24 September 2020; pp. 1–9. [Google Scholar]


| Tracing Strategy | Computational Epidemiology Subproblem/Challenge | Machine Learning Technique | Model Type | Task Type | Reference |
|---|---|---|---|---|---|
| Forward | Contact Graph Construction | Boosted Decision Trees and Convolutional Neural Networks | Discriminative | Upstream | Section 4.2 |
| Backward | Infection Source Estimation (Source Attribution) | Graph Neural Network | Discriminative | Downstream | Section 4.3.2 |
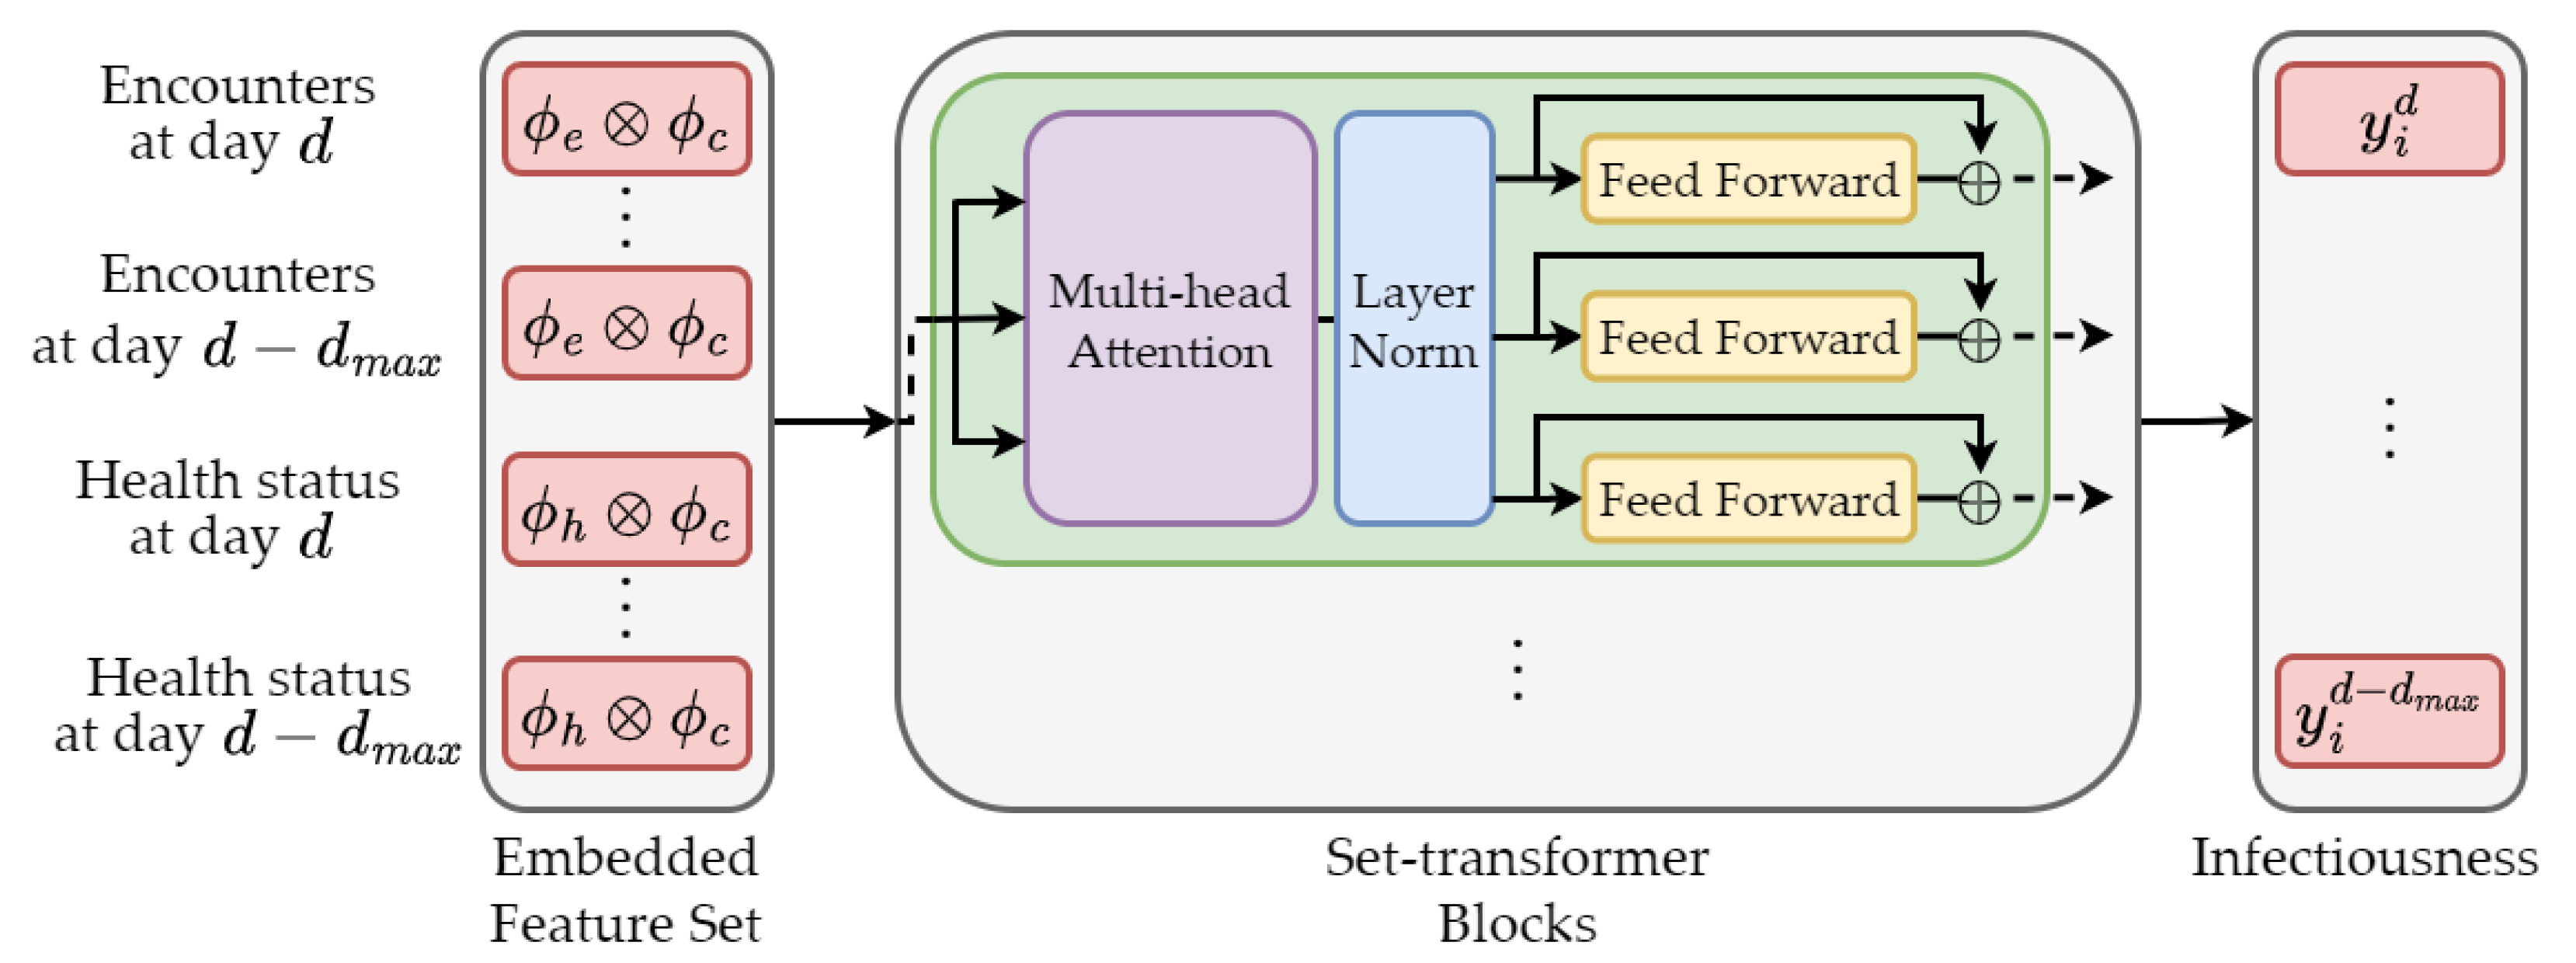
| Proactive | Risk of Infectious Exposure Prediction | Set Transformer | Discriminative | Downstream | Section 4.4.1 |
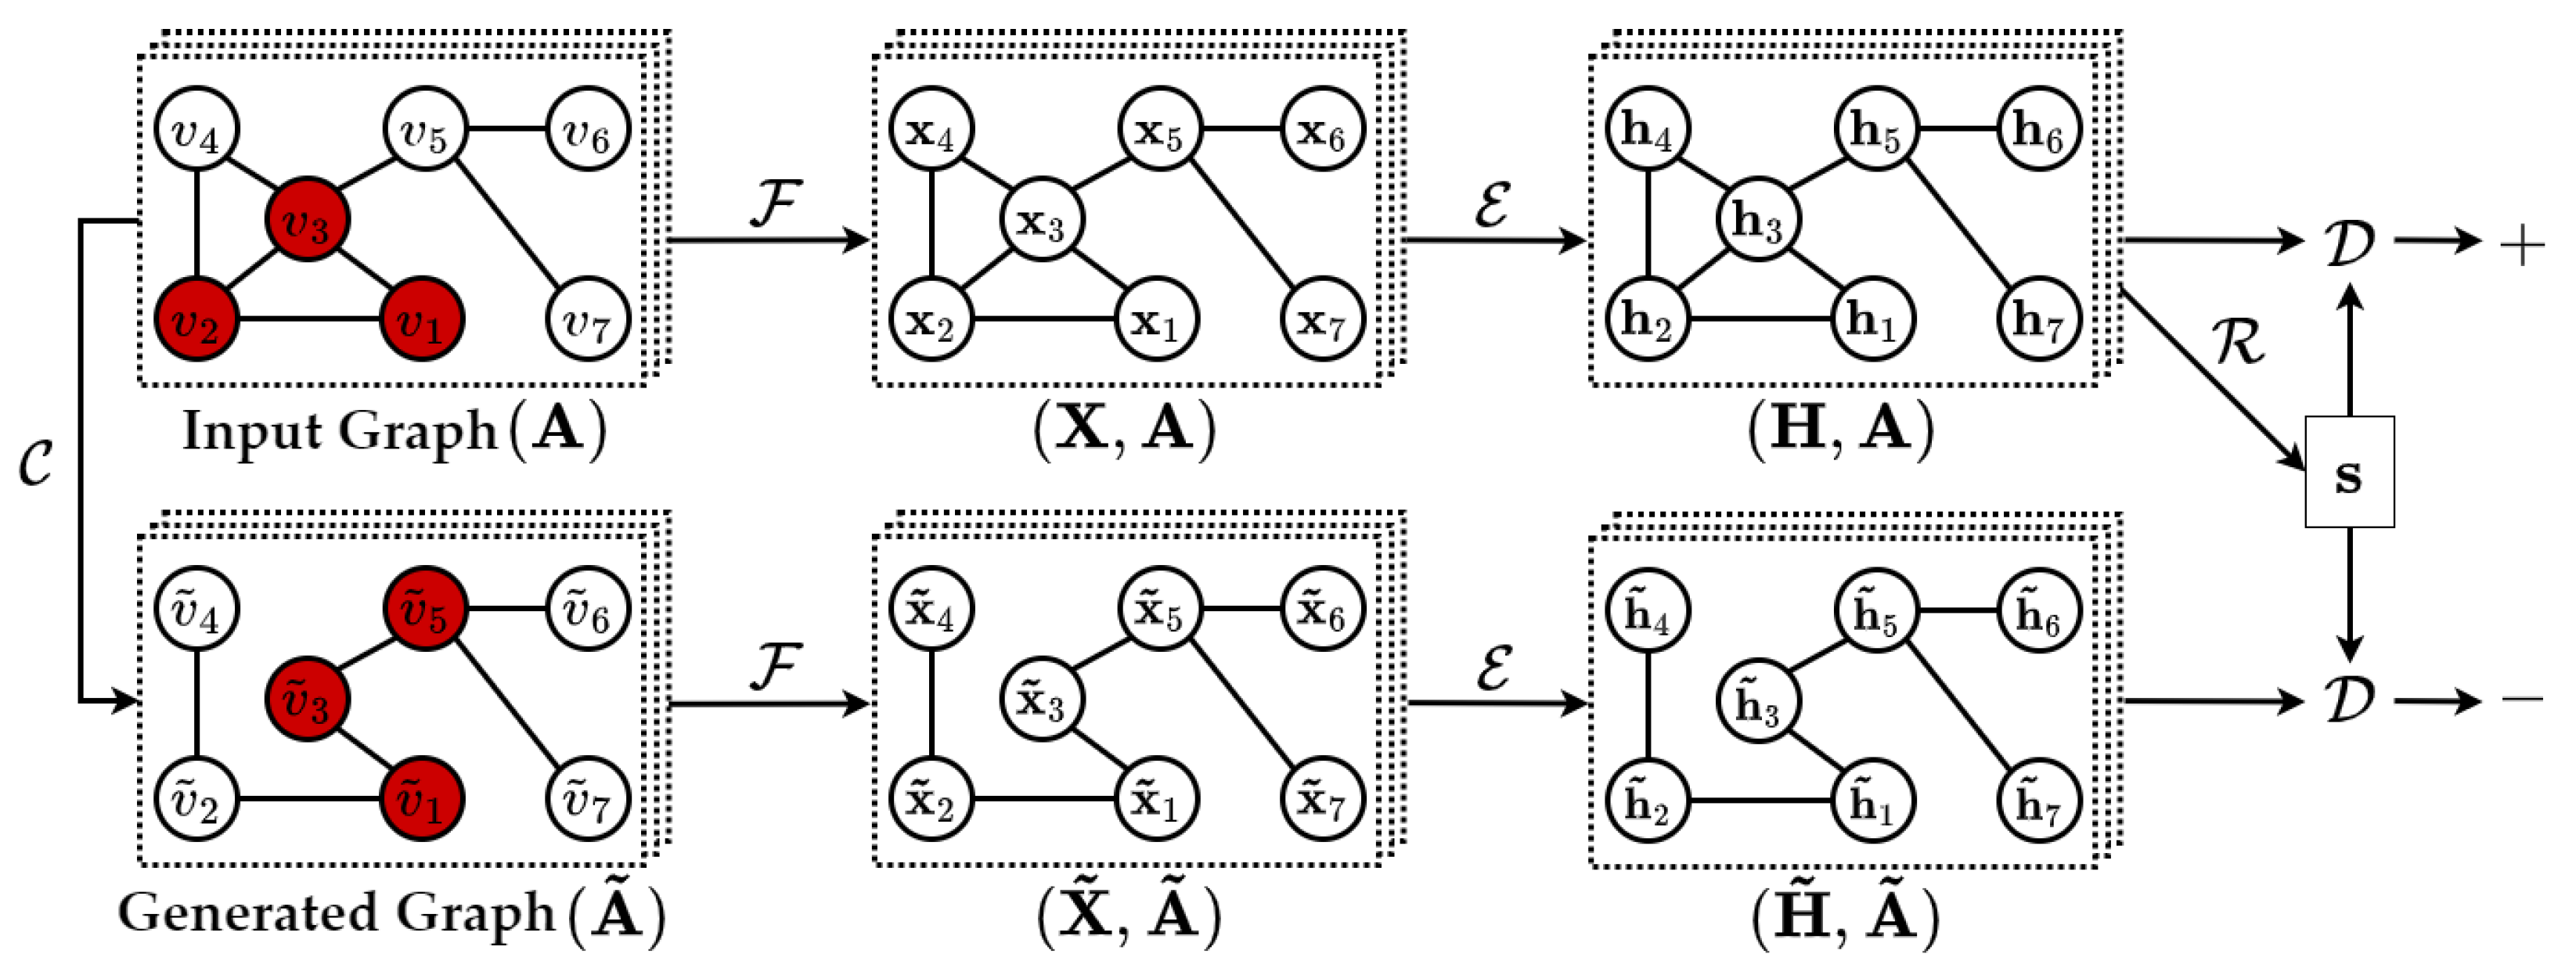
| Deep Graph Infomax | Generative | Upstream | Section 4.4.2 | ||
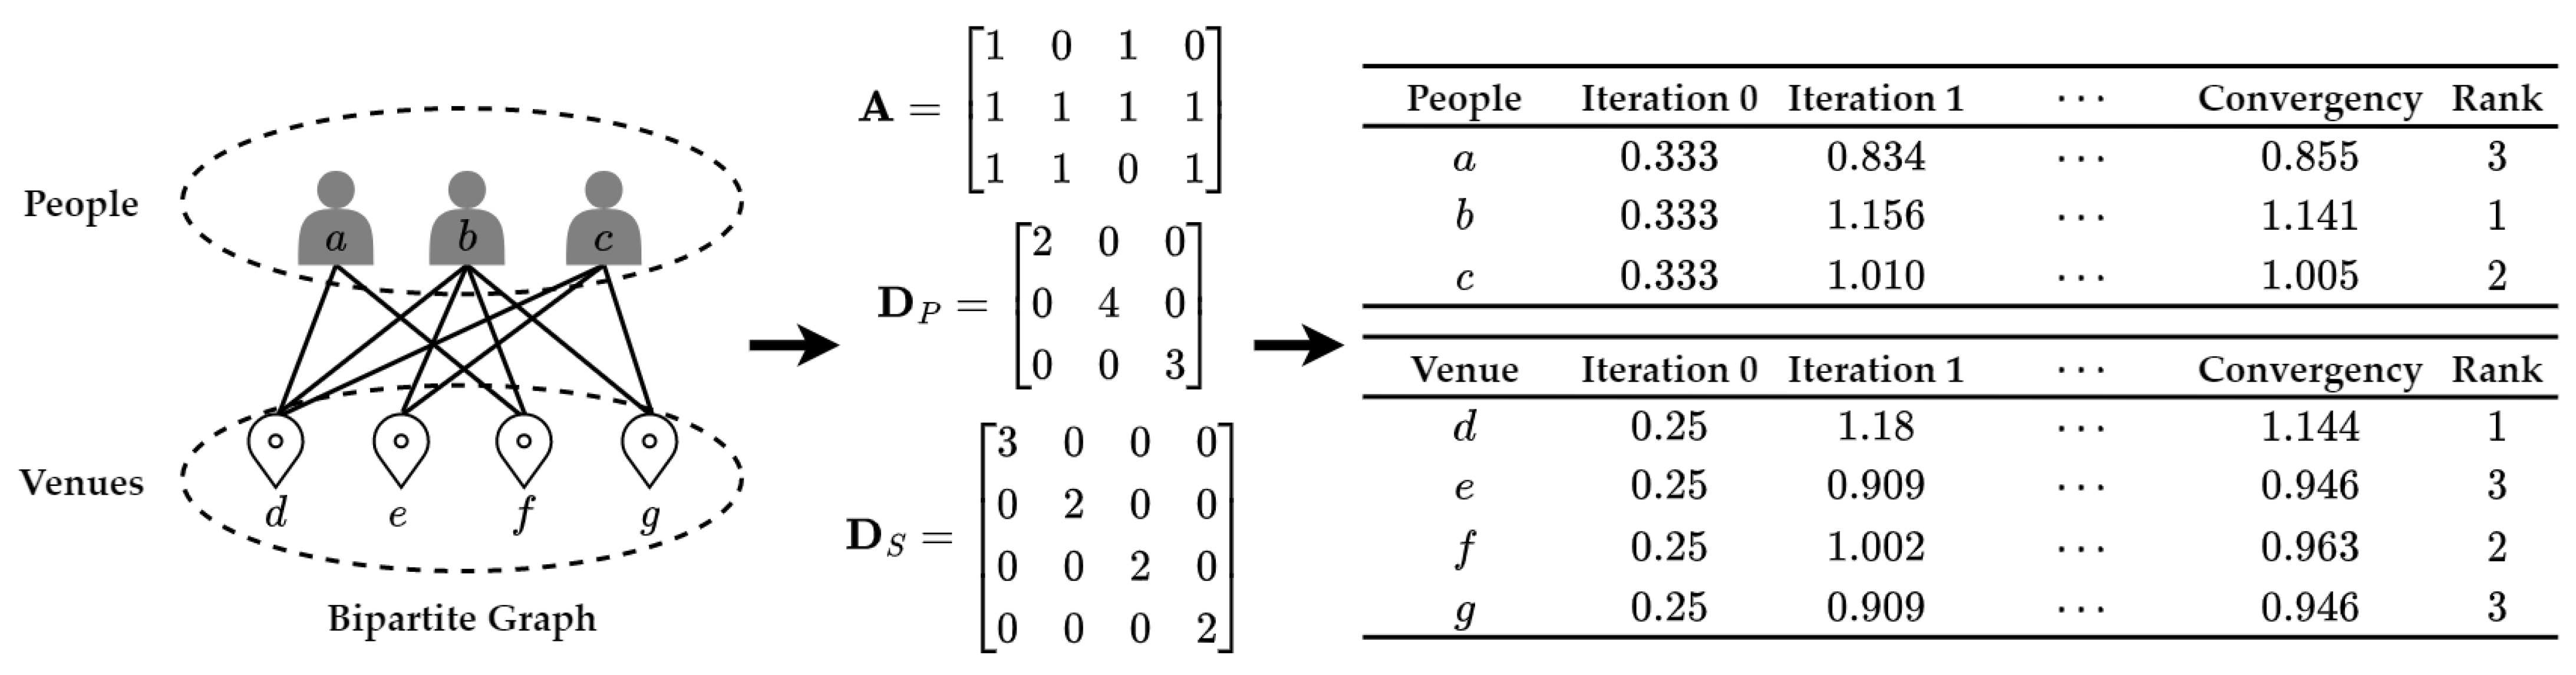
| Graph Transformer | Generative | Upstream | Section 4.4.3 | ||
| Forward, Backward, and Proactive | Privacy and Security | Federated Graph Learning with Differential Privacy | Discriminative | Downstream | Section 6.1 |
| Forward, Backward, and Proactive | Data Availability | Generative Adversarial Network | Generative | Upstream | Section 6.2 |
| Reference | Year | Research Domain | Technological Aspect | Dataset | |||
|---|---|---|---|---|---|---|---|
| DCT | COVID-19 | Big Data | AI | Mobile App | |||
| Lalmuanawma et al. [43] | 2020 | ✓ | ✓ | ✗ | ✓ | ✓ | ✗ |
| Agbehadji et al. [41] | 2020 | ✓ | ✓ | ✓ | ✓ | ✗ | ✗ |
| Mbunge [42] | 2020 | ✓ | ✓ | ✓ | ✓ | ✓ | ✗ |
| Altmann et al. [44] | 2020 | ✓ | ✓ | ✗ | ✗ | ✓ | ✗ |
| Ahmed et al. [45] | 2020 | ✓ | ✓ | ✗ | ✗ | ✓ | ✗ |
| Mondal et al. [40] | 2021 | ✗ | ✓ | ✓ | ✓ | ✗ | ✗ |
| Alanzi [46] | 2021 | ✓ | ✓ | ✗ | ✗ | ✓ | ✗ |
| Ojokoh et al. [39] | 2022 | ✓ | ✓ | ✗ | ✓ | ✓ | ✗ |
| This Study | 2023 | ✓ | ✓ | ✓ | ✓ | ✓ | ✓ |
| Tracing App | Location | Government App | Mandatory Use | Tracing Strategy |
|---|---|---|---|---|
| How We Feel App | United States | ✗ | ✗ | Proactive |
| LeaveHomeSafe App | Hong Kong | ✓ | ✓ | Forward |
| NHS COVID-19 App | England and Wales | ✓ | ✗ | Proactive |
| NOVID App | United States | ✗ | ✗ | Proactive |
| Outbreaks Near Me App | United States, Canada, and Mexico | ✗ | ✗ | Proactive |
| Taiwan Social Distancing App | Taiwan | ✓ | ✗ | Forward |
| TousAntiCovid App | France | ✓ | ✗ | Forward |
| TraceTogether App | Singapore | ✓ | ✓ | Forward |
| Tracing Strategy | Year | Related Work |
|---|---|---|
| Forward | 2020 | Hellewell et al. [51], Aleta et al. [52] |
| 2021 | Hinch et al. [53], Grantz et al. [54] | |
| 2022 | Yu et al. [34], Tan et al. [55] | |
| Backward | 2020 | Endo et al. [56] |
| 2021 | Müller et al. [57], Kojaku et al. [58] | |
| 2022 | Tan et al. [55], Raymenants et al. [59] | |
| Proactive | 2009 | Ginsberg et al. [60] |
| 2020 | Gupta et al. [38], Gallotti et al. [61], Briers et al. [62], Herbrich et al. [63] | |
| 2021 | Leung et al. [64], Bengio et al. [37], Baker et al. [65], Murphy et al. [66], Fenton et al. [67] | |
| 2022 | Lorch et al. [68] | |
| 2023 | Rivest et al. [69], Gupta et al. [70], Feng et al. [71] |
| Machine Learning Model | Year | GitHub Repository |
|---|---|---|
| DGI [97] | 2019 | https://github.com/PetarV-/DGI |
| Graph Transformer [122] | 2020 | https://github.com/graphdeeplearning/graphtransformer |
| Set Transformer [37] | 2020 | https://github.com/mila-iqia/COVI-ML |
| GNN [55] | 2022 | https://github.com/convexsoft/deeptrace |
| Reference | Year | Data Category | Dataset | Link |
|---|---|---|---|---|
| Xu et al. [126] | 2020 | Health Profile | Individual-level Epidemiological Data for COVID-19 Outbreak | https://github.com/beoutbreakprepared/nCoV2019 |
| Gupta et al. [38] | 2020 | Health Profile | COVID-19 Mobility and Characteristics Simulation Dataset | https://github.com/mila-iqia/COVI-AgentSim |
| Firth et al. [10] | 2020 | Contact Graph | COVID-19 Infectious Disease Social Interaction Dataset | https://github.com/skissler/haslemere |
| Adam et al. [127] | 2020 | Contact Graph | COVID-19 Superspreading in Hong Kong | https://github.com/dcadam/covid-19-sse |
| Serafino et al. [128] | 2022 | Contact Graph | COVID-19 Digital Contact Tracing Geolocalized Human Mobility Dataset | https://github.com/makselab/COVID19 |
| Moosa et al. [129] | 2023 | Contact Graph | COVID-19 Contact Tracing Networks | https://ieee-dataport.org/documents/covid-19-contact-tracing-networks |
| This Study | 2023 | Contact Graph | Digital Contact Tracing Dataset | https://dctracing.shinyapps.io/DCTracing/ |
Disclaimer/Publisher’s Note: The statements, opinions and data contained in all publications are solely those of the individual author(s) and contributor(s) and not of MDPI and/or the editor(s). MDPI and/or the editor(s) disclaim responsibility for any injury to people or property resulting from any ideas, methods, instructions or products referred to in the content. |
© 2023 by the authors. Licensee MDPI, Basel, Switzerland. This article is an open access article distributed under the terms and conditions of the Creative Commons Attribution (CC BY) license (https://creativecommons.org/licenses/by/4.0/).
Share and Cite
Hang, C.-N.; Tsai, Y.-Z.; Yu, P.-D.; Chen, J.; Tan, C.-W. Privacy-Enhancing Digital Contact Tracing with Machine Learning for Pandemic Response: A Comprehensive Review. Big Data Cogn. Comput. 2023, 7, 108. https://doi.org/10.3390/bdcc7020108
Hang C-N, Tsai Y-Z, Yu P-D, Chen J, Tan C-W. Privacy-Enhancing Digital Contact Tracing with Machine Learning for Pandemic Response: A Comprehensive Review. Big Data and Cognitive Computing. 2023; 7(2):108. https://doi.org/10.3390/bdcc7020108
Chicago/Turabian StyleHang, Ching-Nam, Yi-Zhen Tsai, Pei-Duo Yu, Jiasi Chen, and Chee-Wei Tan. 2023. "Privacy-Enhancing Digital Contact Tracing with Machine Learning for Pandemic Response: A Comprehensive Review" Big Data and Cognitive Computing 7, no. 2: 108. https://doi.org/10.3390/bdcc7020108
APA StyleHang, C.-N., Tsai, Y.-Z., Yu, P.-D., Chen, J., & Tan, C.-W. (2023). Privacy-Enhancing Digital Contact Tracing with Machine Learning for Pandemic Response: A Comprehensive Review. Big Data and Cognitive Computing, 7(2), 108. https://doi.org/10.3390/bdcc7020108