
Service Oriented R-ANN Knowledge Model for Social Internet of Things


Abstract
:1. Introduction
- Proposed semantic rule based feature selection method to the existing Artificial Neural Network (ANN) model called Relationship-ANN (R-ANN) for SIoT.
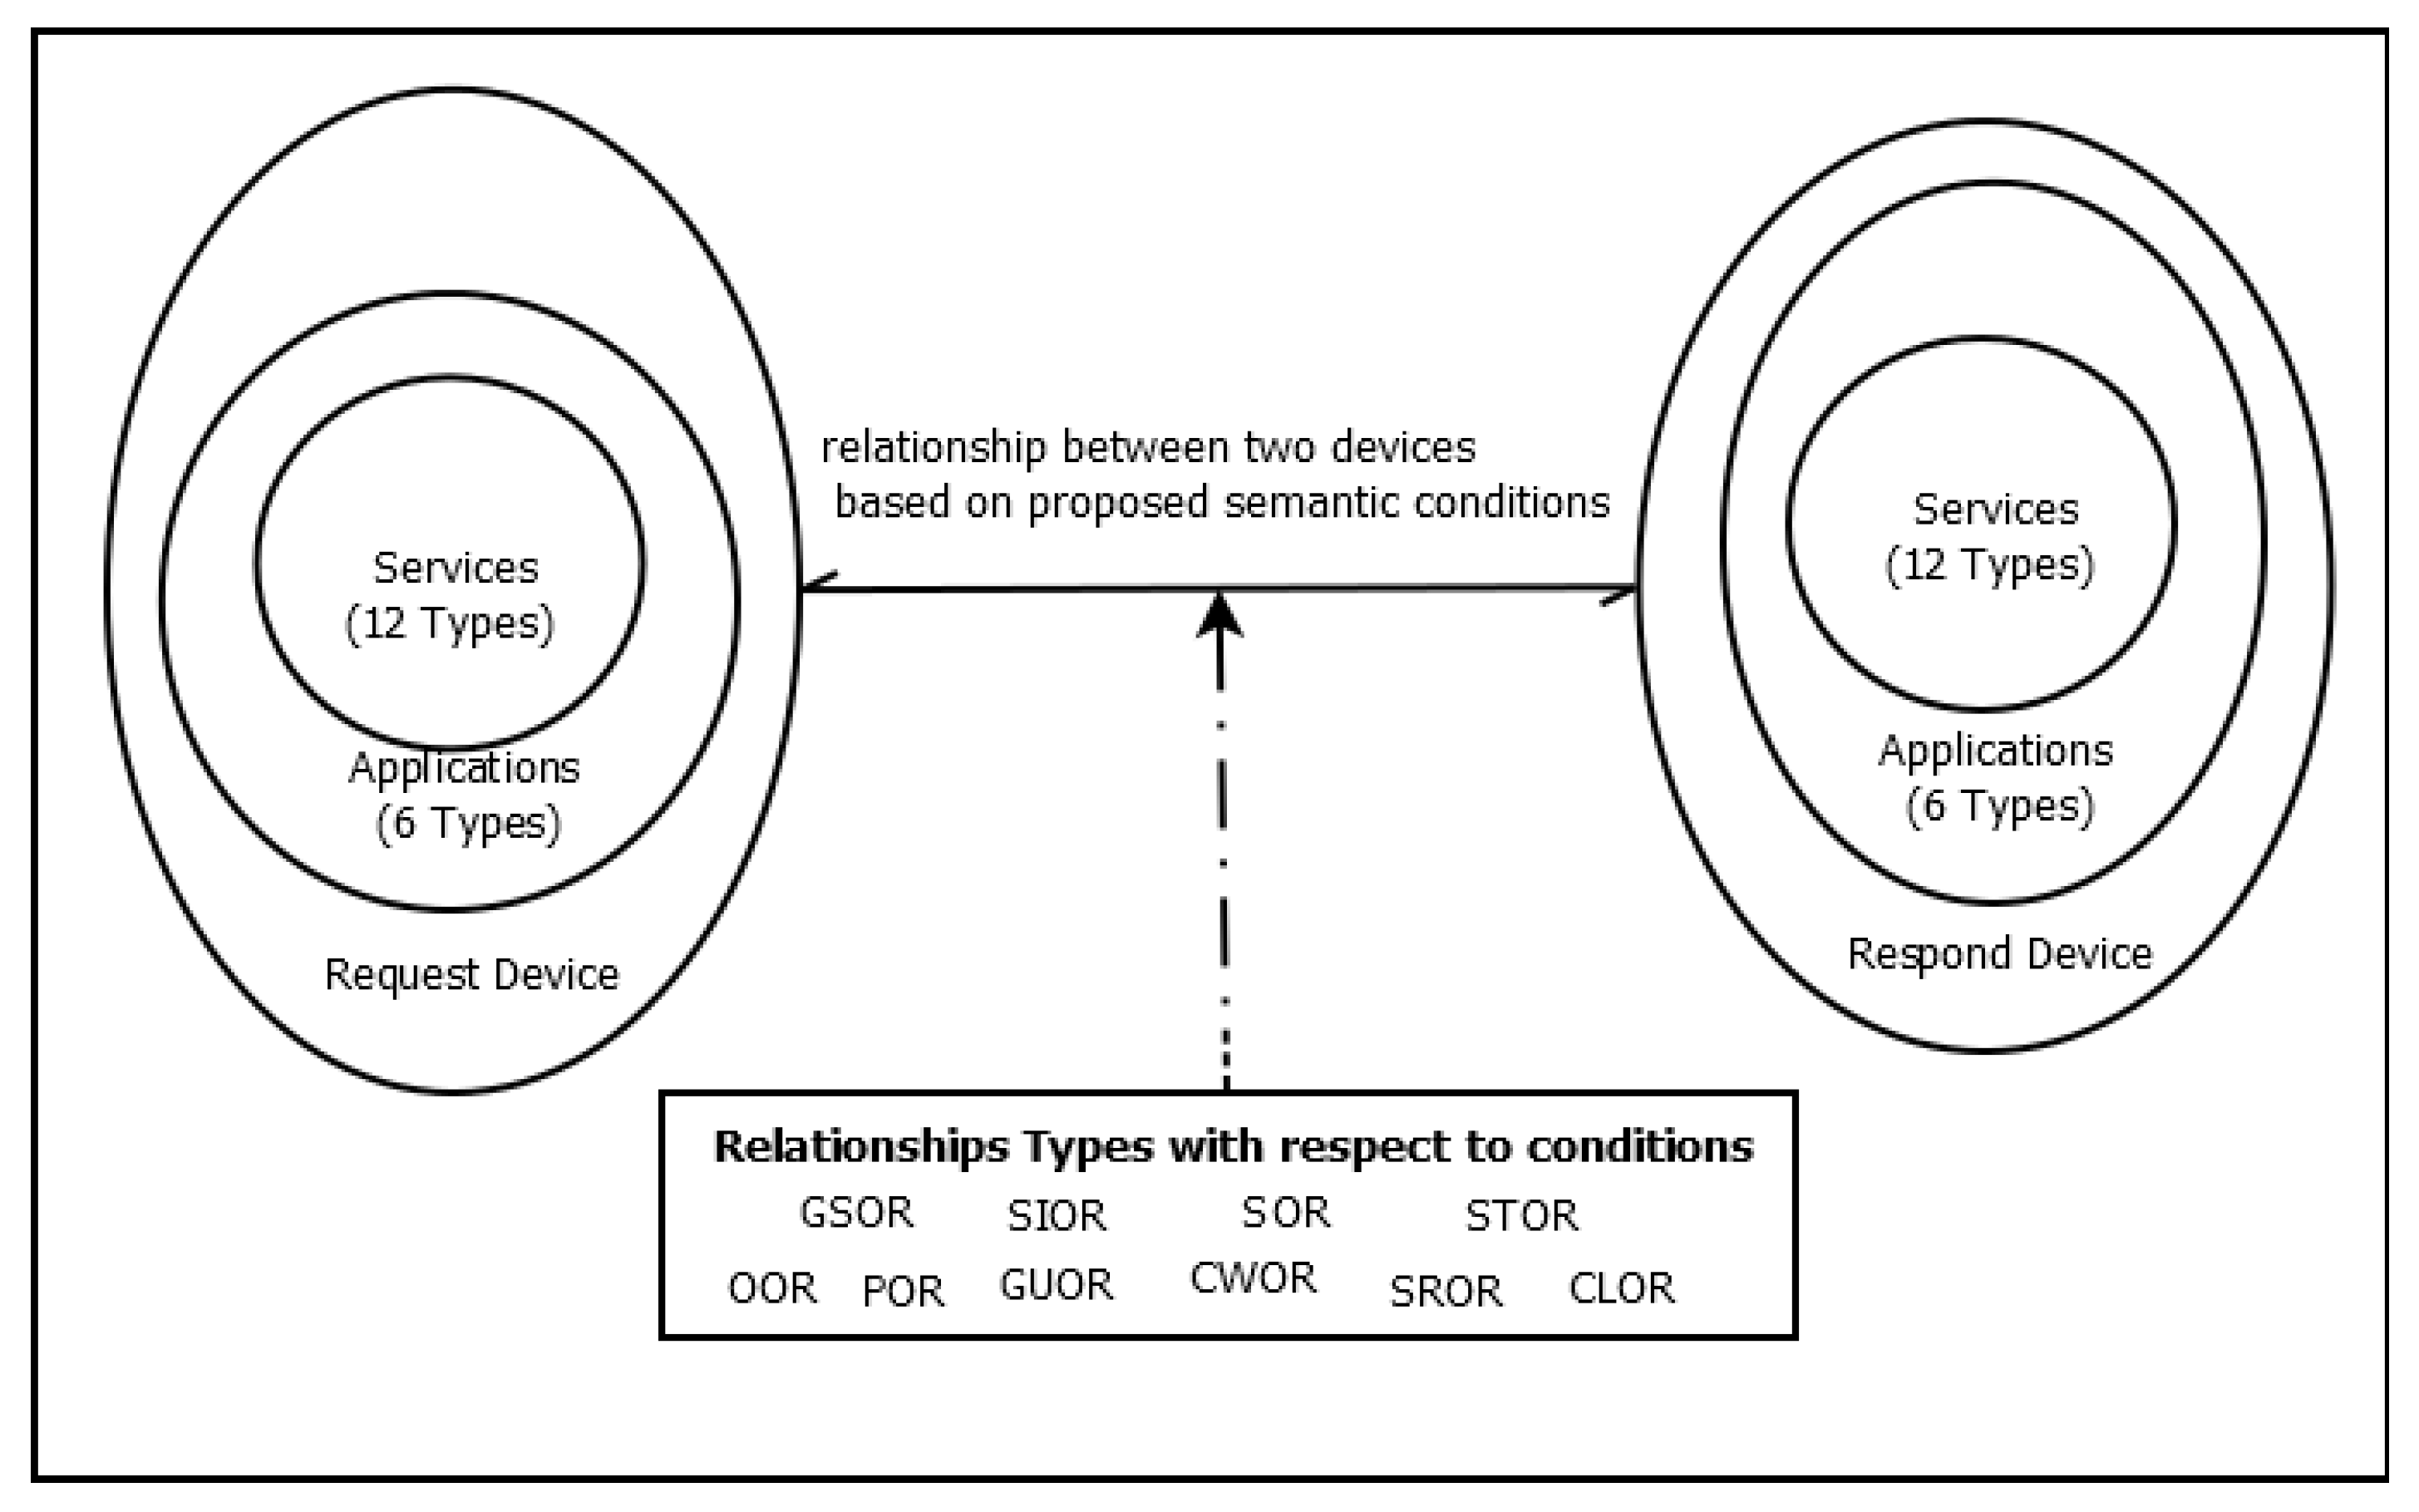
- Defined the ten types of relationships between the devices and evaluated the proposed R-ANN algorithm.
- Proposed service oriented Knowledge model to classify services in SIoT-based smart-city applications.
2. Related Work
State of the Art
3. Problem Statement
4. System Model
Problem Formulation
5. Proposed Relationship Artificial Neural Network (R-ANN) Knowledge Model for Smart City Applications
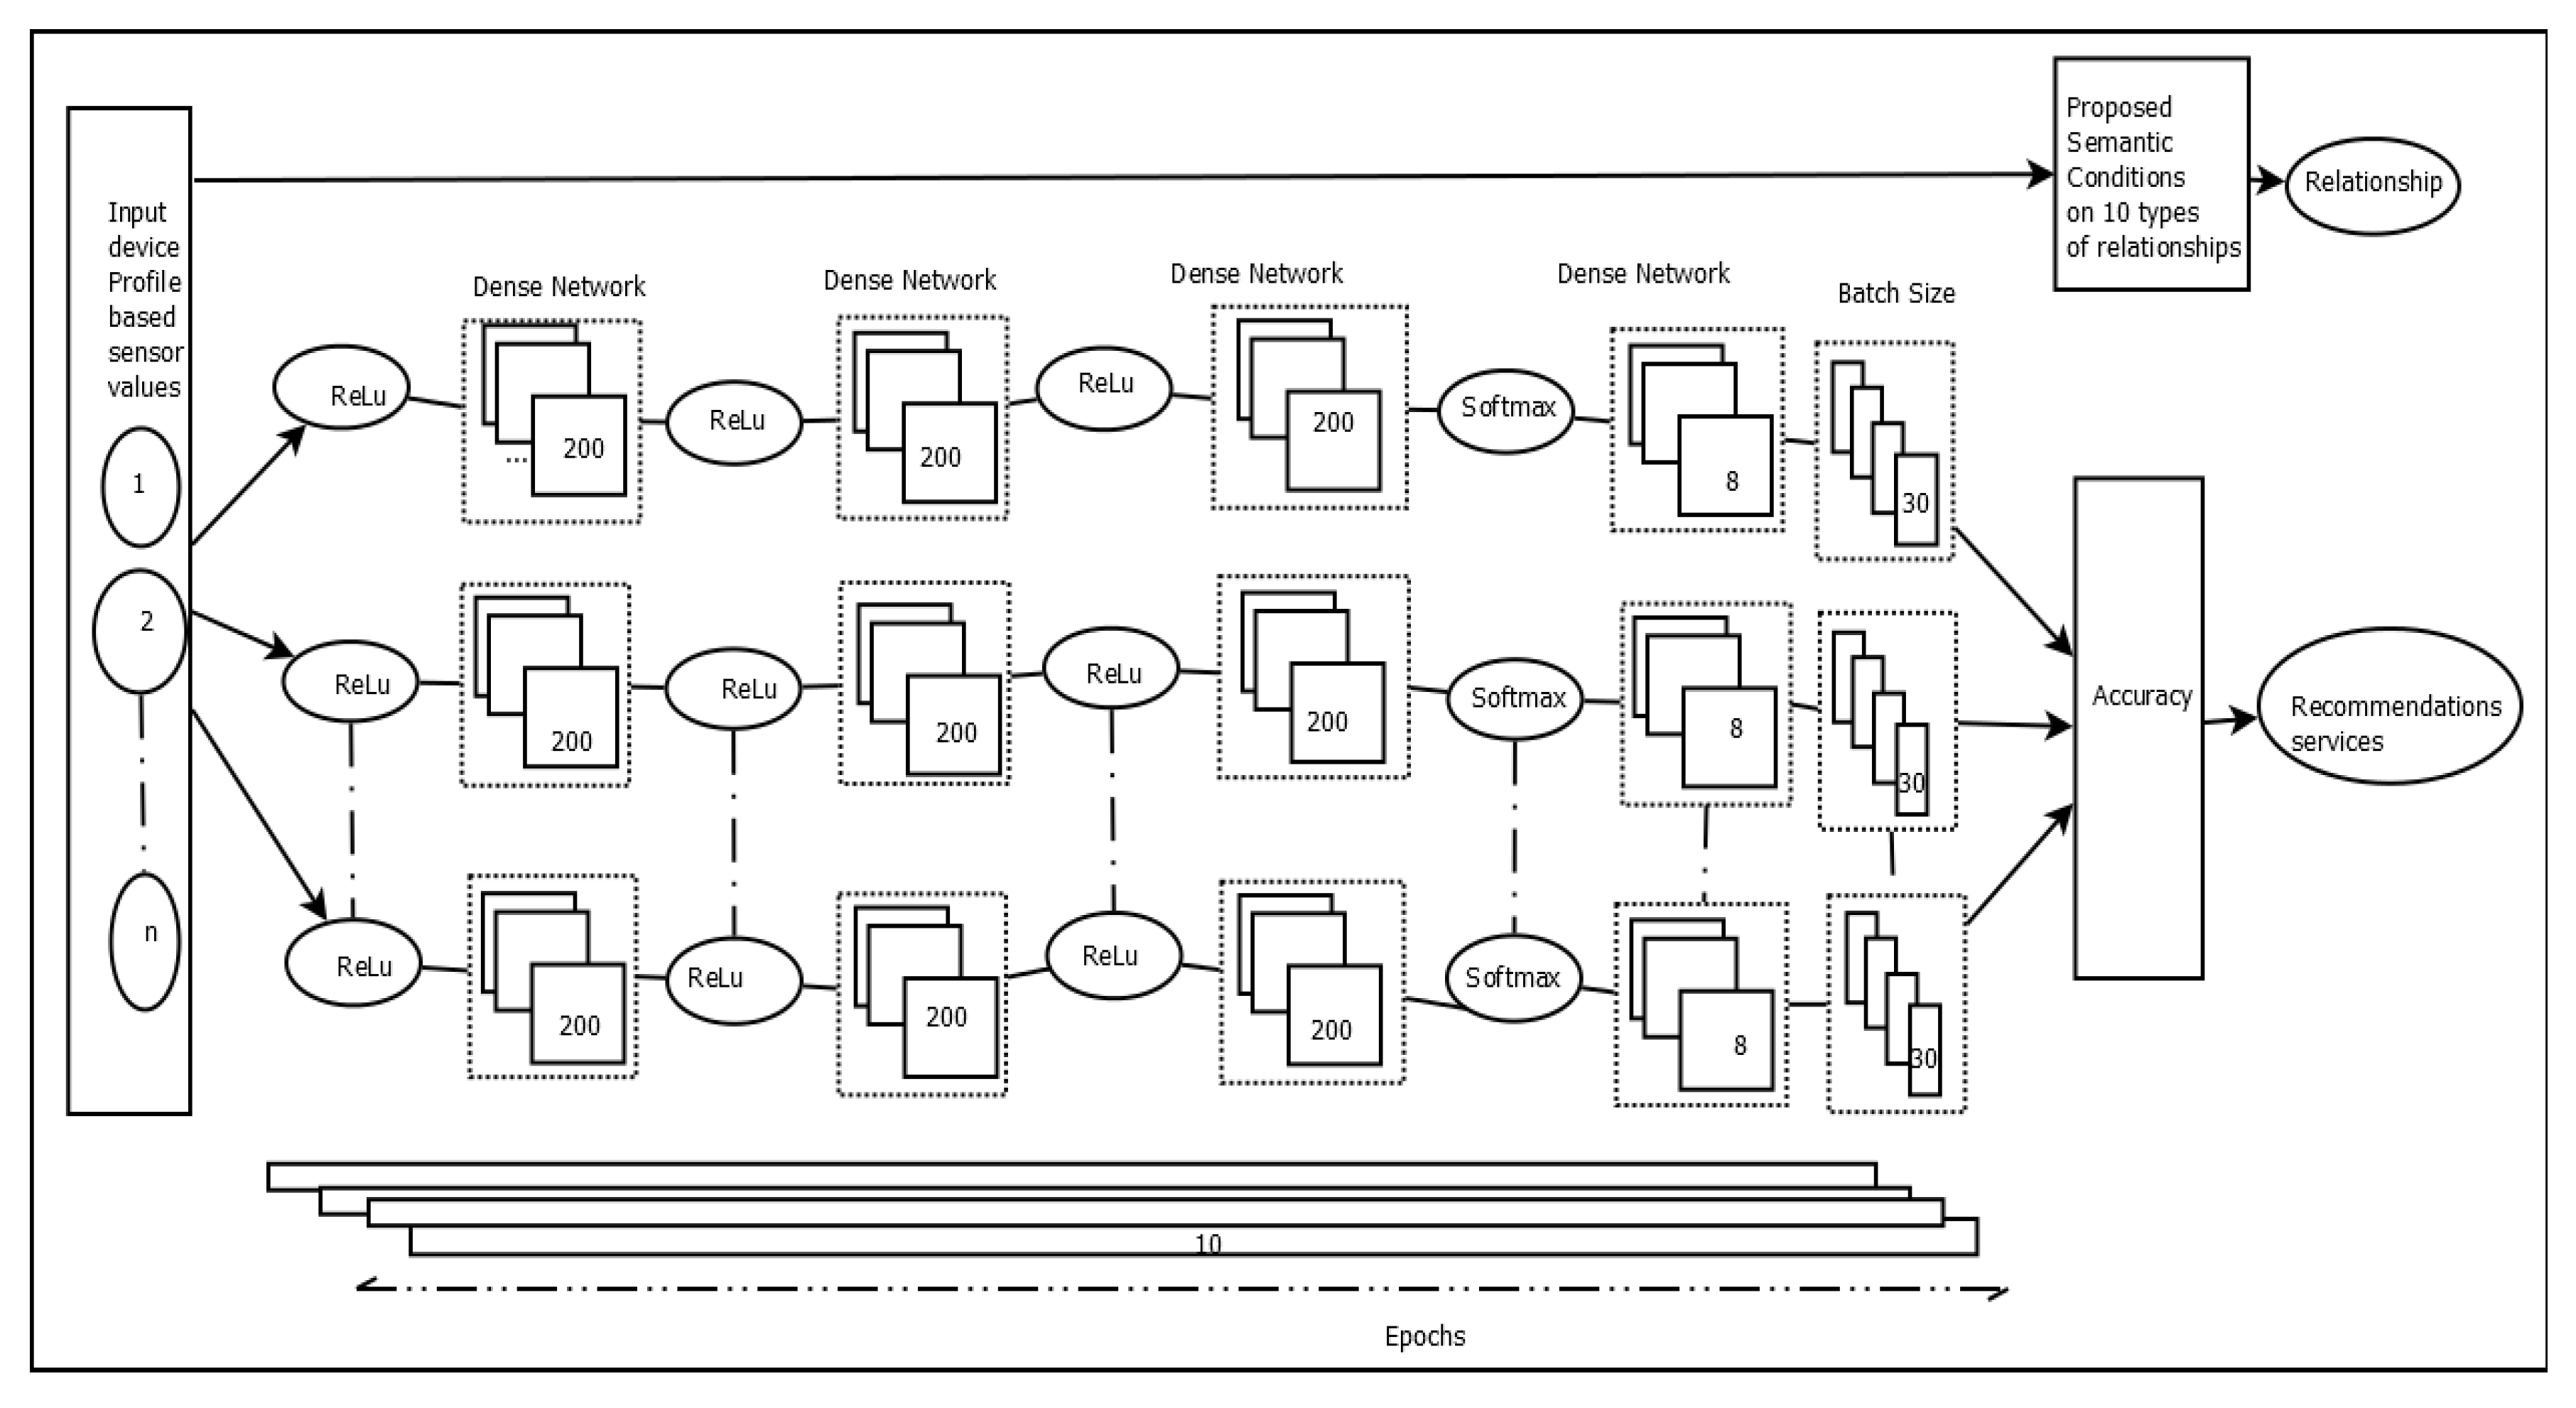
5.1. Model Design
5.2. Methodology
| Algorithm 1 Proposed methodology of R-ANN knowledge model |
| 1: Input: Smart city Data. |
| 2: Output: Relationship based Services. |
| 3: smart city Objects Data() |
| 4: pre-processing Data() |
| 5: identify Relationship Using Semantic Rules() |
| 6: select Objects are in a Relationship() |
| 7: i = 0 |
| 8: for i do |
| 9: n = i++ |
| 10: end for |
| 11: while Artificial Neural Network(ANN) Model do |
| 12: Dense network = 200; Batch Size = 30; Epoch = 10; |
| 13: Input activation function = ReLu |
| 14: Output activation function = softmax |
| 15: end while |
5.3. Working Principle
6. Algorithm
| Algorithm 2 Proposed R-ANN knowledge model | |
| Input: Objects in network , Public informations , environment information and Conditions on Relationships , Relationships . | |
| 2: | Output: Knowledge model . |
| while Objects in do | |
| 4: | if ( == True) then |
| ← + | |
| 6: | , = |
| = | |
| 8: | else |
| Exit() | |
| 10: | end if |
| end while | |
7. Results and Discussion
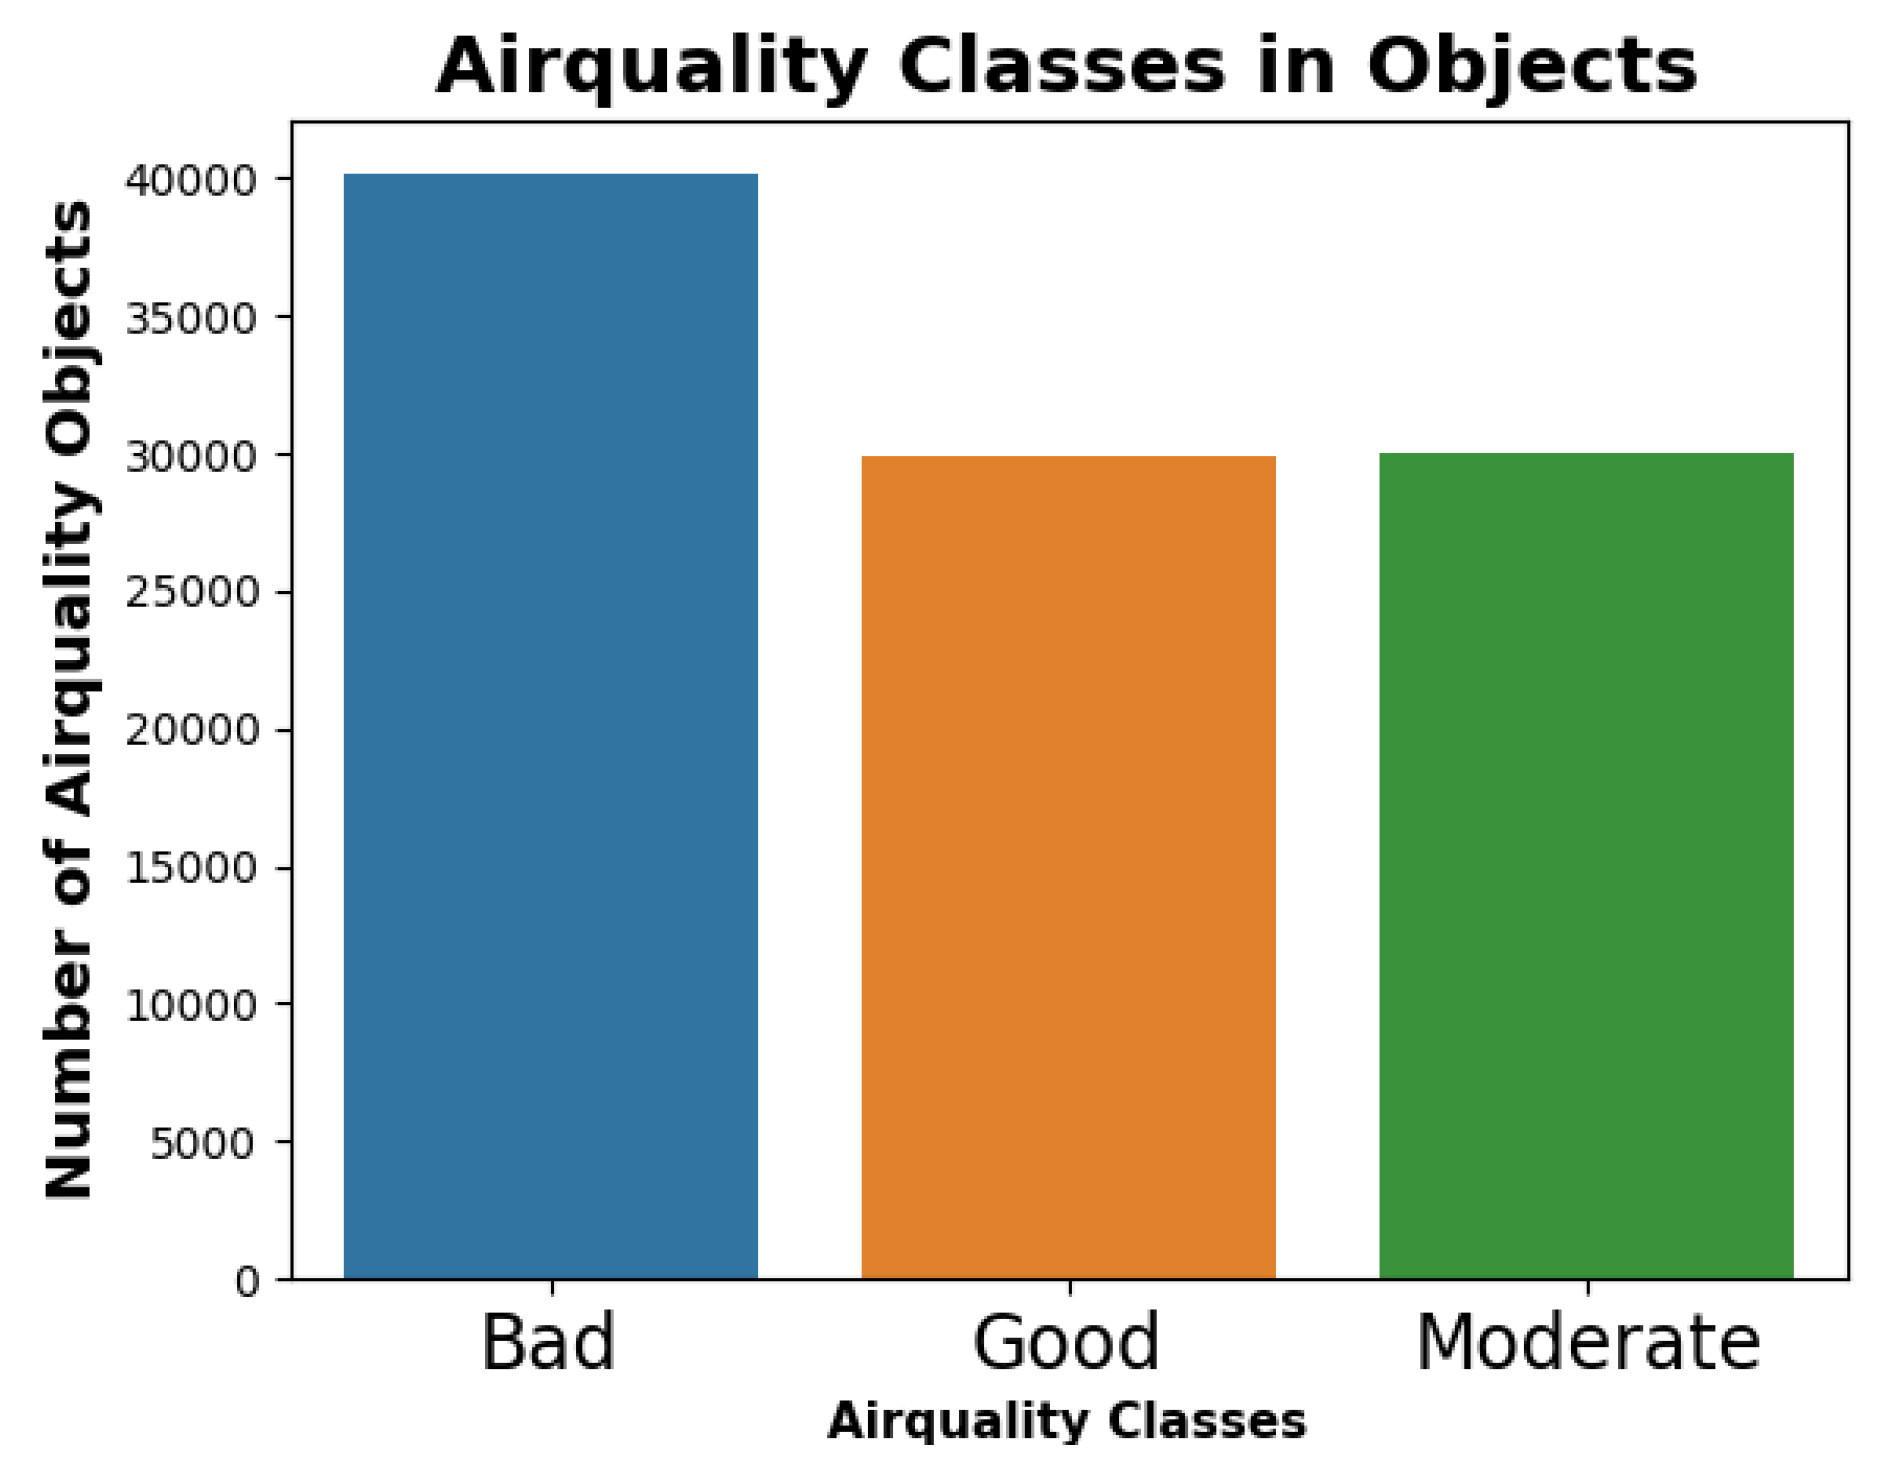
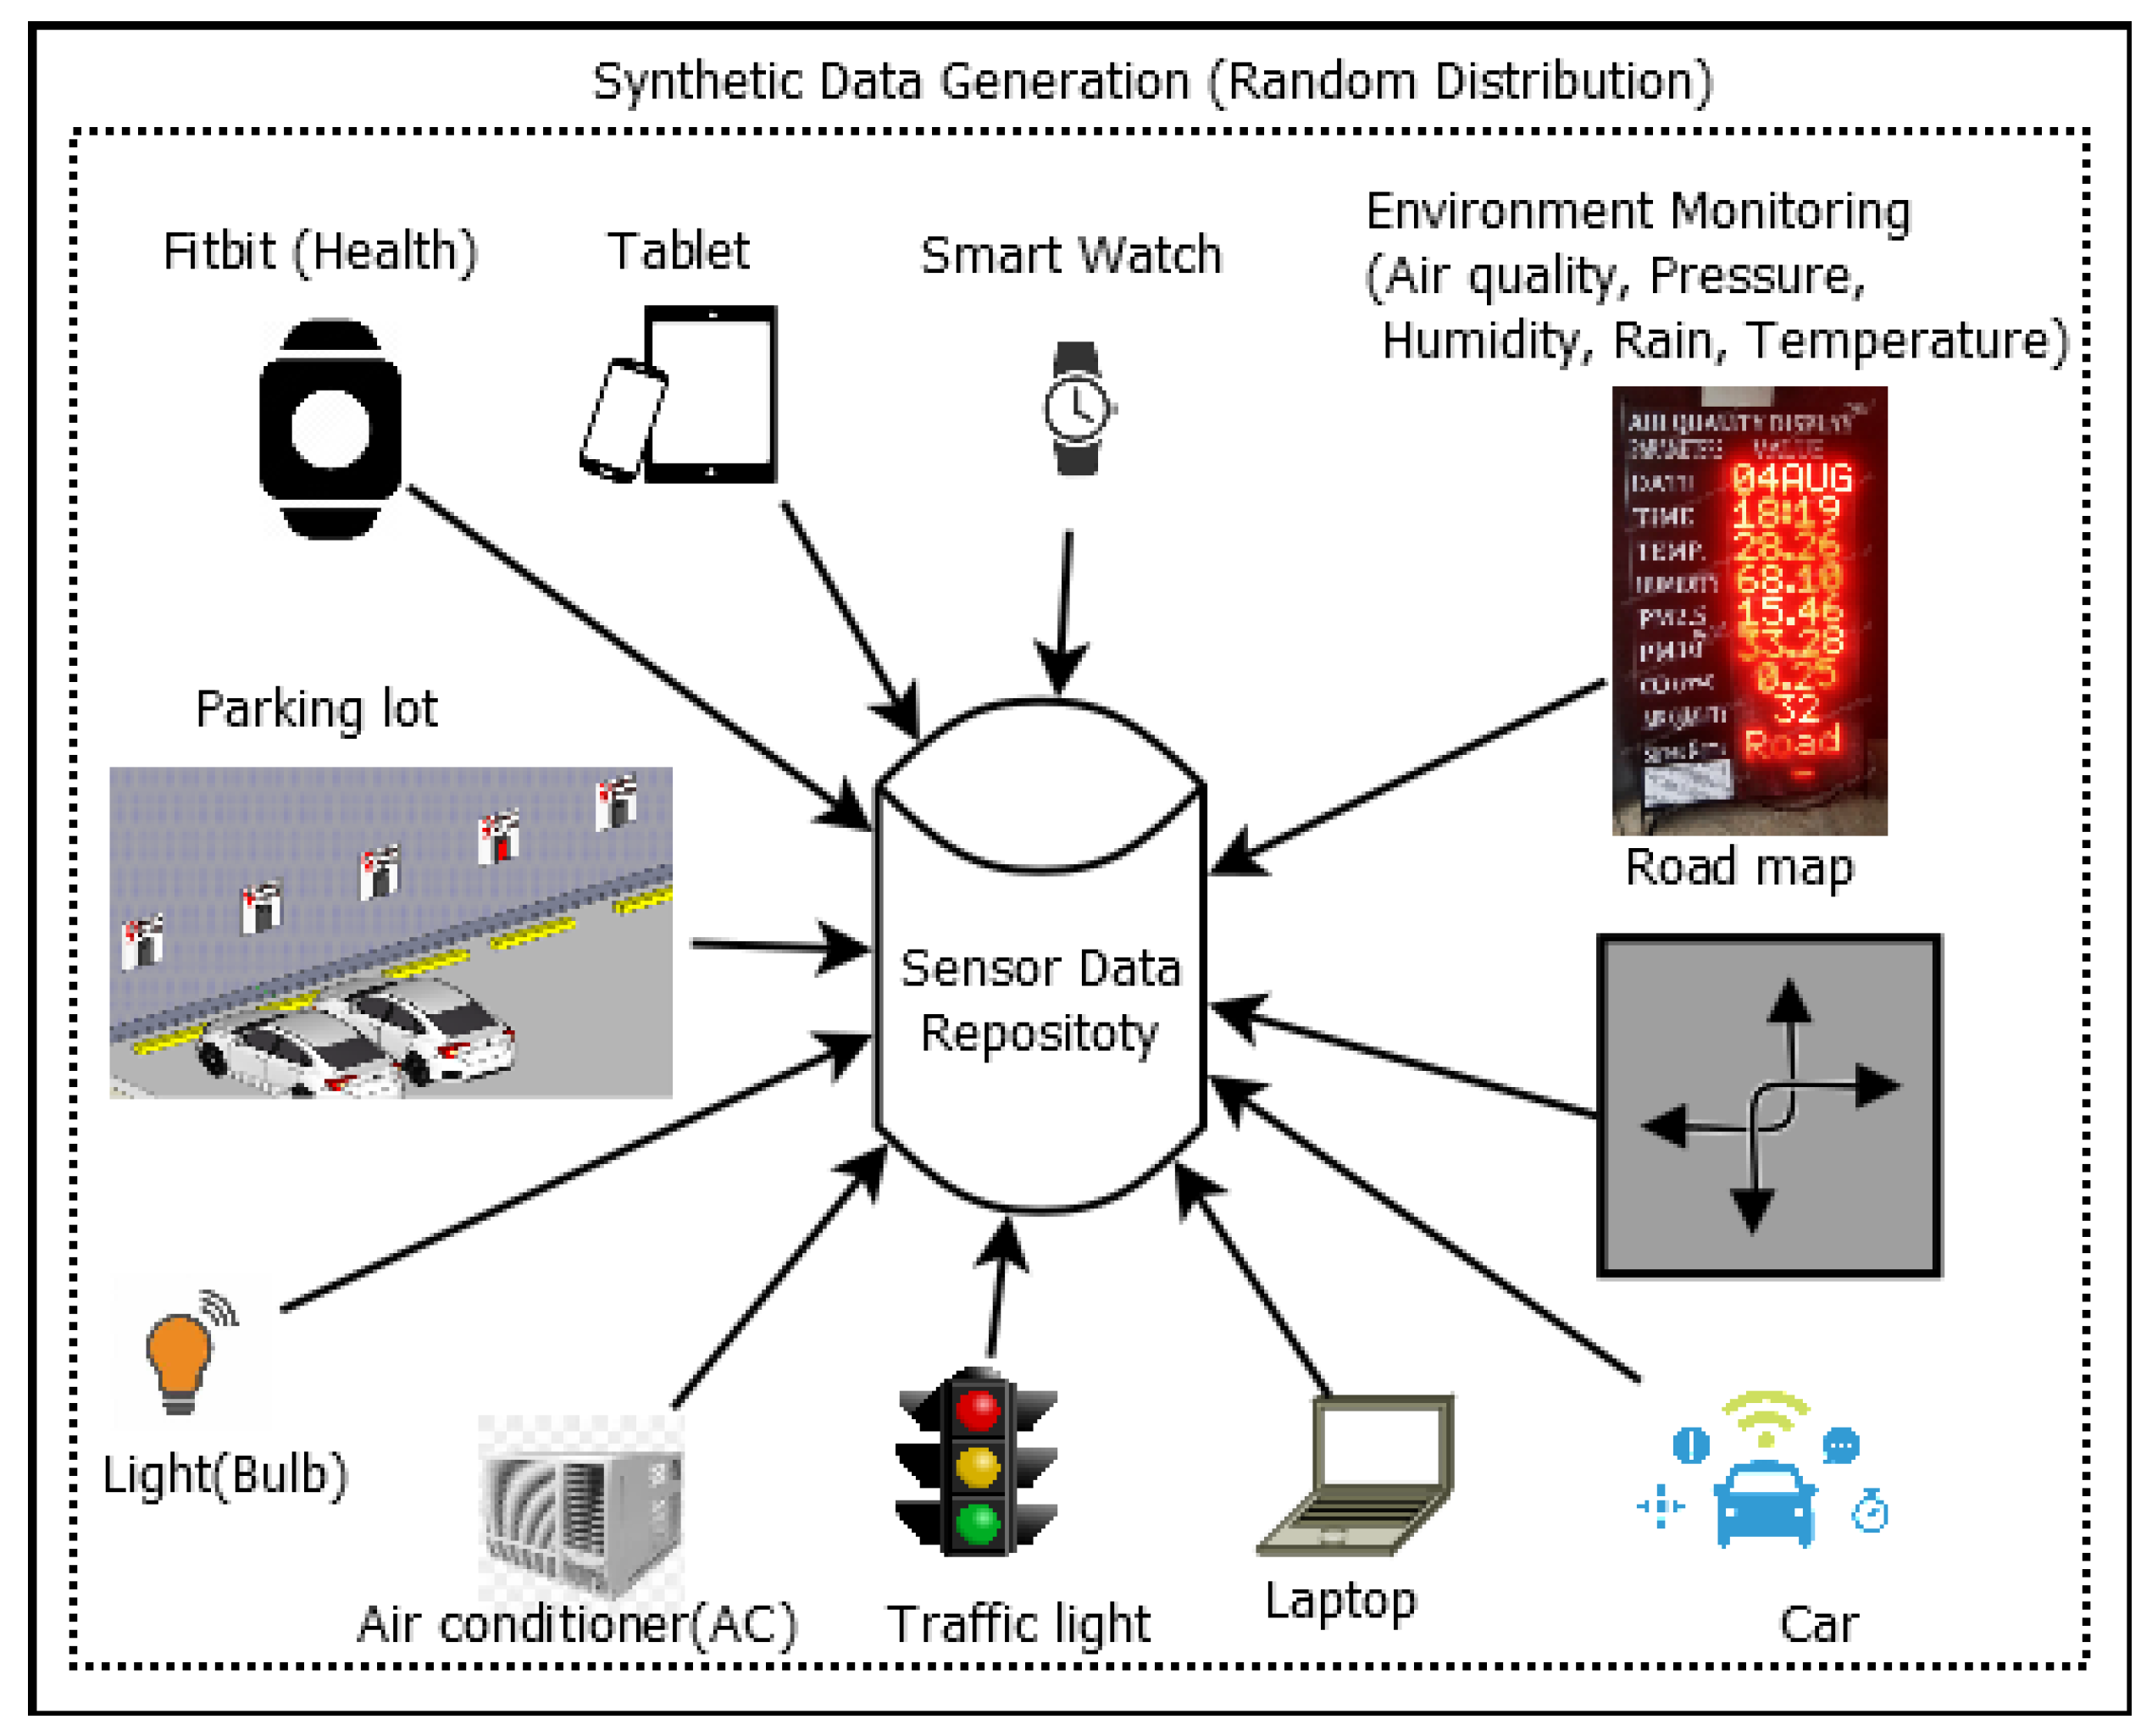
7.1. Dataset
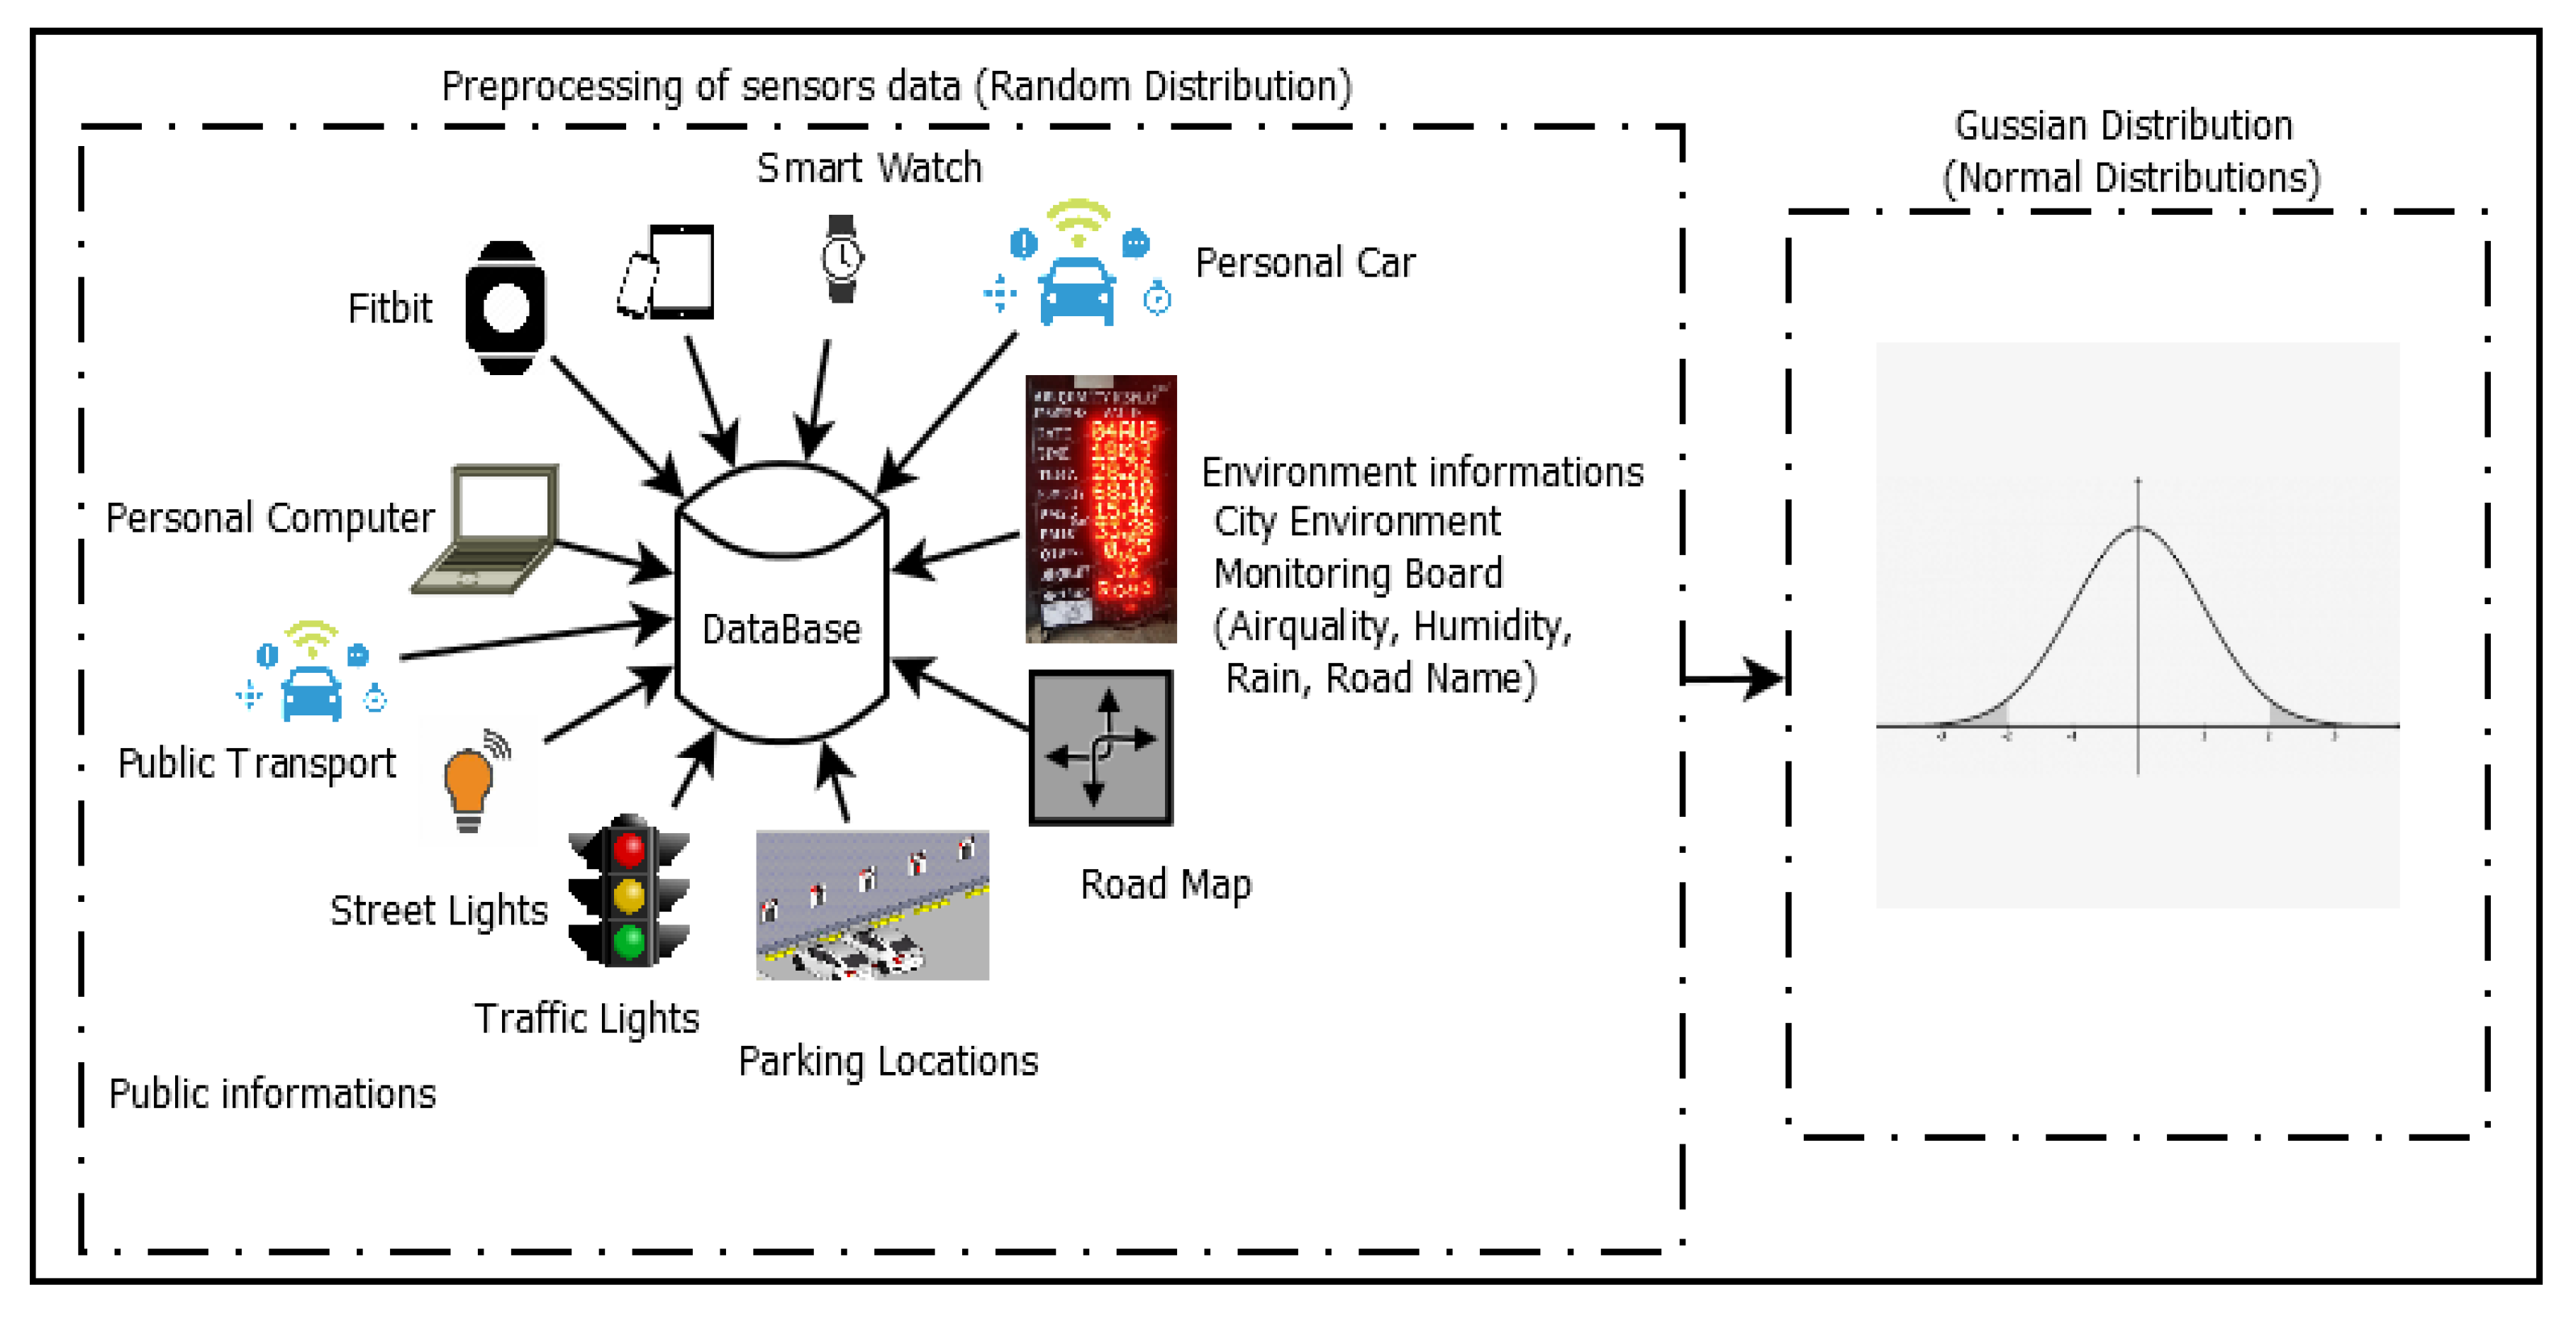
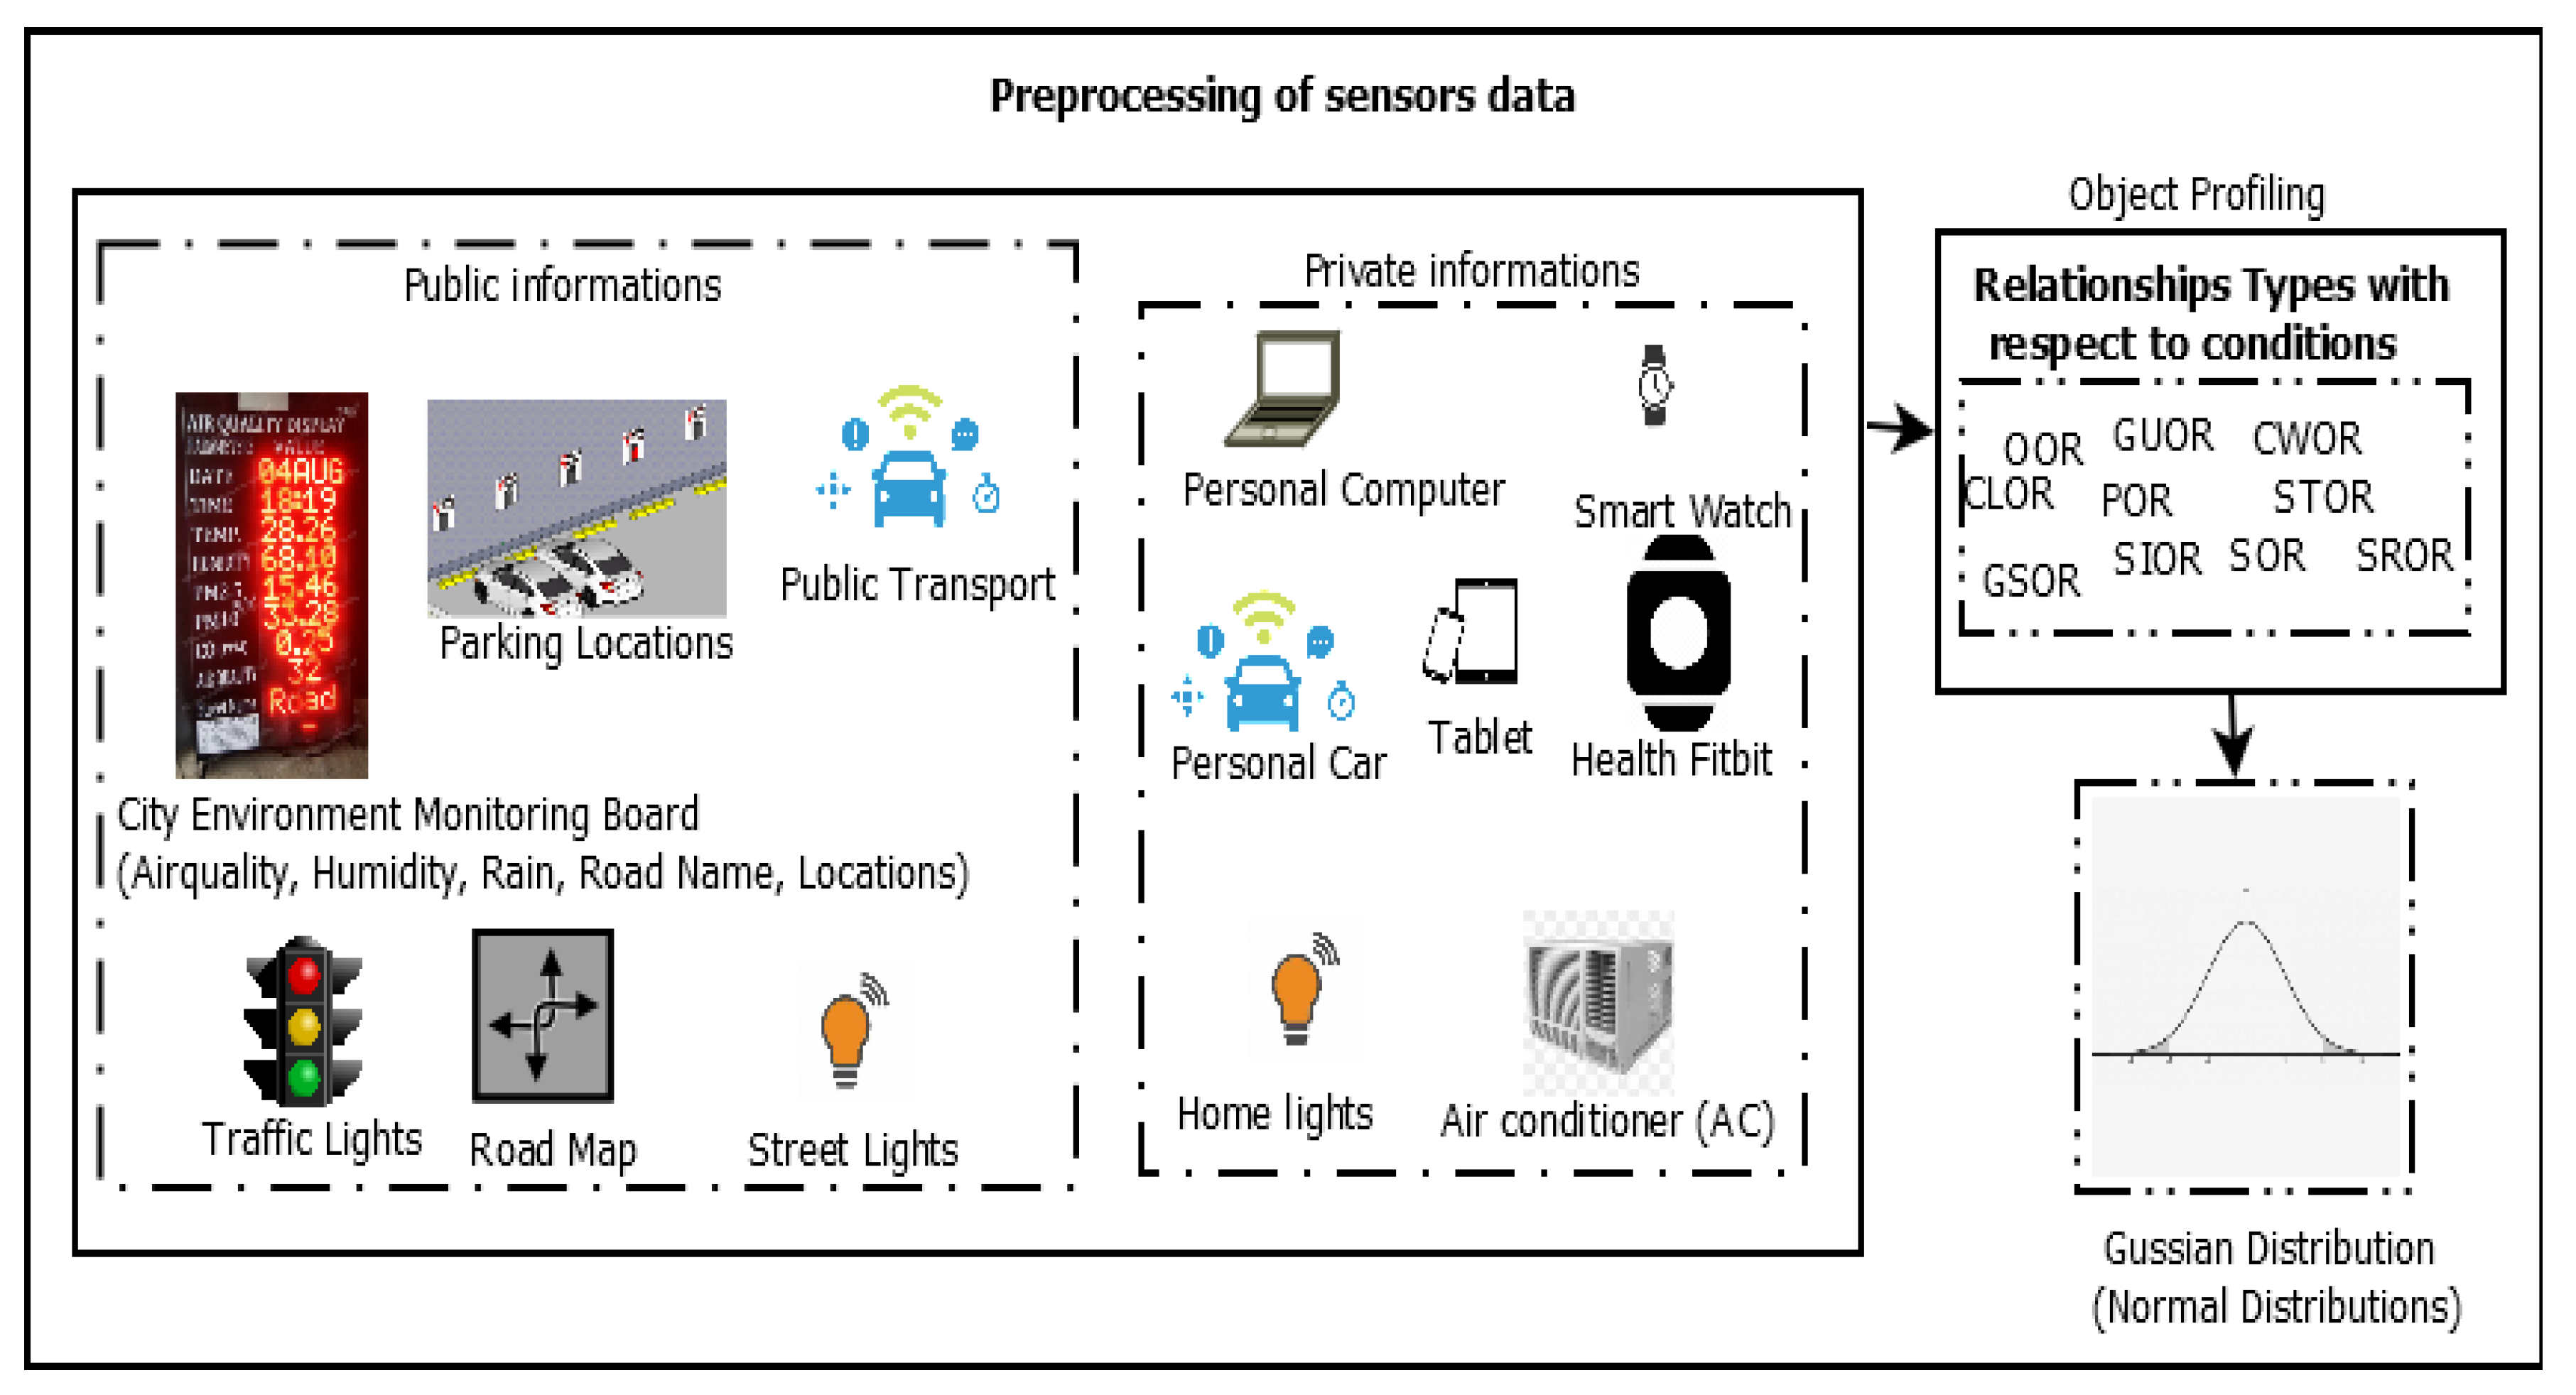
7.2. Data Preparation
7.3. Results
7.4. Experimental Setup
8. Comparative Study
9. Pros and Cons of Proposed Model
10. Conclusions and Future Work
Author Contributions
Funding
Institutional Review Board Statement
Informed Consent Statement
Data Availability Statement
Acknowledgments
Conflicts of Interest
References
- Tsai, S.C.; Chen, C.H. Exploring the Innovation Diffusion of Big Data Robo-Advisor. Appl. Syst. Innov. 2022, 5, 15. [Google Scholar] [CrossRef]
- Hussain, M.; Beg, M.M. Fog computing for internet of things (IoT)-aided smart grid architectures. Big Data Cogn. Comput. 2019, 3, 8. [Google Scholar] [CrossRef] [Green Version]
- Serrano, W. Intelligent recommender system for big data applications based on the random neural network. Big Data Cogn. Comput. 2019, 3, 15. [Google Scholar] [CrossRef] [Green Version]
- Manheim, D. Multiparty dynamics and failure modes for machine learning and artificial intelligence. Big Data Cogn. Comput. 2019, 3, 21. [Google Scholar] [CrossRef] [Green Version]
- Waseem, M.; Lin, Z.; Yang, L. Data-driven load forecasting of air conditioners for demand response using levenberg–marquardt algorithm-based ANN. Big Data Cogn. Comput. 2019, 3, 36. [Google Scholar] [CrossRef] [Green Version]
- Stella, M.; Kenett, Y.N. Viability in multiplex lexical networks and machine learning characterizes human creativity. Big Data Cogn. Comput. 2019, 3, 45. [Google Scholar] [CrossRef] [Green Version]
- Ganzfried, S. Optimal number of choices in rating contexts. In Imperfect Decision Makers: Admitting Real-World Rationality; PMLR: Centre de Convencions Internacional de Barcelona: Barcelona, Spain, 2017; pp. 61–74. Available online: http://proceedings.mlr.press/v58/ganzfried17a.html (accessed on 9 December 2016).
- How, M.L.; Cheah, S.M.; Khor, A.C.; Chan, Y.J. Artificial intelligence-enhanced predictive insights for advancing financial inclusion: A human-centric ai-thinking approach. Big Data Cogn. Comput. 2020, 4, 8. [Google Scholar] [CrossRef]
- Marche, C.; Atzori, L.; Pilloni, V.; Nitti, M. How to exploit the Social Internet of Things: Query Generation Model and Device Profiles’ Dataset. Comput. Netw. 2020, 174, 107248. [Google Scholar] [CrossRef]
- Meghana, J.; Hanumanthappa, J.; Prakash, S.P.S. Performance comparison of machine learning algorithms for data aggregation in social internet of things. Glob. Transit. Proc. 2021, 2, 212–219. [Google Scholar] [CrossRef]
- Altulyan, M.; Yao, L.; Wang, X.; Huang, C.; Kanhere, S.S.; Sheng, Q.Z. A Survey on Recommender Systems for Internet of Things: Techniques, Applications and Future Directions. Inf. Fusion 2021, 35, 68–80. [Google Scholar] [CrossRef]
- Asaithambi, S.P.R.; Venkatraman, S.; Venkatraman, R. Big data and personalisation for non-intrusive smart home automation. Big Data Cogn. Comput. 2021, 5, 6. [Google Scholar] [CrossRef]
- Gandomi, A.H.; Chen, F.; Abualigah, L. Machine Learning Technologies for Big Data Analytics. Electronics 2022, 11, 421. [Google Scholar] [CrossRef]
- Guo, K.; Lu, Y.; Gao, H.; Cao, R. Artificial intelligence-based semantic internet of things in a user-centric smart city. Sensors 2018, 18, 1341. [Google Scholar] [CrossRef] [PubMed] [Green Version]
- Kong, Y.; Ma, X.; Wen, C. A New Method of Deep Convolutional Neural Network Image Classification Based on Knowledge Transfer in Small Label Sample Environment. Sensors 2022, 22, 898. [Google Scholar] [CrossRef] [PubMed]
- Marinov, M.B.; Nikolov, N.; Dimitrov, S.; Todorov, T.; Stoyanova, Y.; Nikolov, G.T. Linear Interval Approximation for Smart Sensors and IoT Devices. Sensors 2022, 22, 949. [Google Scholar] [CrossRef] [PubMed]
- Pavićević, M.; Popović, T. Forecasting Day-Ahead Electricity Metrics with Artificial Neural Networks. Sensors 2022, 22, 1051. [Google Scholar] [CrossRef] [PubMed]
- Chen, Y.H.; Chen, S.W.; Chang, P.J.; Hua, H.T.; Lin, S.Y.; Chen, R.S. A VLSI Chip for the Abnormal Heart Beat Detection Using Convolutional Neural Network. Sensors 2022, 22, 796. [Google Scholar] [CrossRef] [PubMed]
- Cheng, L.C.; Lin, W.S.; Lien, Y.H. A Hybrid Deep Learning Model for Predicting Stock Market Trend Prediction. Int. J. Inf. Manag. Sci. 2021, 32, 121–140. [Google Scholar]
- Wang, L.; Sng, D. Deep learning algorithms with applications to video analytics for a smart city: A survey. arXiv 2015, arXiv:1512.03131. [Google Scholar]
- Lau, B.P.L.; Marakkalage, S.H.; Zhou, Y.; Hassan, N.U.; Yuen, C.; Zhang, M.; Tan, U.X. A survey of data fusion in smart city applications. Inf. Fusion 2019, 52, 357–374. [Google Scholar] [CrossRef]
- Lin, J.; Chen, W.M.; Lin, Y.; Cohn, J.; Gan, C.; Han, S. Mcunet: Tiny deep learning on iot devices. arXiv 2020, arXiv:2007.10319. [Google Scholar]
- Le, L.T.; Nguyen, H.; Dou, J.; Zhou, J. A comparative study of PSO-ANN, GA-ANN, ICA-ANN, and ABC-ANN in estimating the heating load of buildings’ energy efficiency for smart city planning. Appl. Sci. 2019, 9, 2630. [Google Scholar] [CrossRef] [Green Version]
- Mohammadi, M.; Al-Fuqaha, A.; Guizani, M.; Oh, J.S. Semisupervised deep reinforcement learning in support of IoT and smart city services. IEEE Internet Things J. 2017, 5, 624–635. [Google Scholar] [CrossRef] [Green Version]
- Verhelst, M.; Moons, B. Embedded deep neural network processing: Algorithmic and processor techniques bring deep learning to iot and edge devices. IEEE Solid-State Circuits Mag. 2017, 9, 55–65. [Google Scholar] [CrossRef]
- Zamil, M.G.A.; Samarah, S.; Rawashdeh, M.; Karime, A.; Hossain, M.S. Multimedia-oriented action recognition in Smart City-based IoT using multilayer perceptron. Multimed. Tools Appl. 2019, 78, 30315–30329. [Google Scholar] [CrossRef]
- Drewil, G.I.; Al-Bahadili, R.J. Forecast Air Pollution in Smart City Using Deep Learning Techniques: A Review. Multicult. Educ. 2021, 7. [Google Scholar] [CrossRef]
- Sotiriadis, S.; Bessis, N.; Asimakopoulou, E.; Mustafee, N. Towards simulating the internet of things. In Proceedings of the 2014 28th International Conference on Advanced Information Networking and Applications Workshops, Victoria, BC, Canada, 13–16 May 2014; pp. 444–448. [Google Scholar]
- Zeng, X.; Garg, S.K.; Strazdins, P.; Jayaraman, P.P.; Georgakopoulos, D.; Ranjan, R. IOTSim: A simulator for analysing IoT applications. J. Syst. Archit. 2017, 72, 93–107. [Google Scholar] [CrossRef]
- Osterlind, F.; Dunkels, A.; Eriksson, J.; Finne, N.; Voigt, T. Cross-level sensor network simulation with cooja. In Proceedings of the 2006 31st IEEE Conference on Local Computer Networks, Tampa, FL, USA, 14–16 November 2006; pp. 641–648. [Google Scholar]
- Henderson, T.R.; Lacage, M.; Riley, G.F.; Dowell, C.; Kopena, J. Network simulations with the ns-3 simulator. SIGCOMM Demonstr. 2008, 14, 527. [Google Scholar]
- Gupta, H.; Vahid Dastjerdi, A.; Ghosh, S.K.; Buyya, R. iFogSim: A toolkit for modeling and simulation of resource management techniques in the Internet of Things, Edge and Fog computing environments. Softw. Pract. Exp. 2017, 47, 1275–1296. [Google Scholar] [CrossRef] [Green Version]
- Han, S.N.; Lee, G.M.; Crespi, N.; Heo, K.; Van Luong, N.; Brut, M.; Gatellier, P. DPWSim: A simulation toolkit for IoT applications using devices profile for web services. In Proceedings of the 2014 IEEE World Forum on Internet of Things (WF-IoT), Seoul, Korea, 6–8 March 2014; pp. 544–547. [Google Scholar]
- Defiebre, D.; Germanakos, P.; Sacharidis, D. DANOS: A Human-Centered Decentralized Simulator in SIOT. In Proceedings of the Adjunct Publication of the 28th ACM Conference on User Modeling, Adaptation and Personalization, Genoa, Italy, 14–17 July 2020; pp. 299–304. [Google Scholar]
- Kasnesis, P.; Toumanidis, L.; Kogias, D.; Patrikakis, C.Z.; Venieris, I.S. Assist: An agent-based siot simulator. In Proceedings of the 2016 IEEE 3rd World Forum on Internet of Things (WF-IoT), Reston, VA, USA, 12–14 December 2016; pp. 353–358. [Google Scholar]
- Jindal, A.; Aujla, G.S.; Kumar, N.; Prodan, R.; Obaidat, M.S. DRUMS: Demand response management in a smart city using deep learning and SVR. In Proceedings of the 2018 IEEE Global Communications Conference (GLOBECOM), Abu Dhabi, United Arab Emirates, 9–13 December 2018; pp. 1–6. [Google Scholar]
- Chen, J.F.; Chen, W.L.; Huang, C.P.; Huang, S.H.; Chen, A.P. Financial time-series data analysis using deep convolutional neural networks. In Proceedings of the 2016 7th International Conference on Cloud Computing and Big Data (CCBD), Macau, China, 16–18 November 2016; pp. 87–92. [Google Scholar]
- Rose, C.; Mian, I.S. Inscribed matter communication: Part I. IEEE Trans. Mol. Biol. Multi-Scale Commun. 2016, 2, 209–227. [Google Scholar] [CrossRef]
- Udmale, S.S.; Singh, S.K.; Bhirud, S.G. A bearing data analysis based on kurtogram and deep learning sequence models. Measurement 2019, 145, 665–677. [Google Scholar] [CrossRef]
- Pillai, A.S.; Chandraprasad, G.S.; Khwaja, A.S.; Anpalagan, A. A service oriented IoT architecture for disaster preparedness and forecasting system. Internet Things 2021, 14, 100076. [Google Scholar] [CrossRef]
- Akhter, R.; Sofi, S.A. Precision agriculture using IoT data analytics and machine learning. J. King Saud Univ.-Comput. Inf. Sci. 2021, in press. [Google Scholar] [CrossRef]
- Bhuiyan, R. Examination of Air Pollutant Concentrations in Smart City Helsinki Using Data Exploration and Deep Learning Methods. 2021. Available online: https://urn.fi/URN:NBN:fi:amk-2021060113276 (accessed on 30 May 2021).
- Alrahhal, H.; Jamous, R.; Ramadan, R.; Alayba, A.M.; Yadav, K. Utilising Acknowledge for the Trust in Wireless Sensor Networks. Appl. Sci. 2022, 12, 2045. [Google Scholar] [CrossRef]
- Al-Otaiby, N.; Alhindi, A.; Kurdi, H. AntTrust: An Ant-Inspired Trust Management System for Peer-to-Peer Networks. Sensors 2022, 22, 533. [Google Scholar] [CrossRef] [PubMed]
- Ghoneim, O.A.; Manjunatha, B.R. Forecasting of ozone concentration in smart city using deep learning. In Proceedings of the 2017 International Conference on Advances in Computing, Communications and Informatics (ICACCI), Udupi, India, 13–16 September 2017; pp. 1320–1326. [Google Scholar]
- Alam, F.; Mehmood, R.; Katib, I.; Albeshri, A. Analysis of eight data mining algorithms for smarter Internet of Things (IoT). Procedia Comput. Sci. 2016, 98, 437–442. [Google Scholar] [CrossRef] [Green Version]
- Rajendran, S.; Jebakumar, R. Object Recommendation based Friendship Selection (ORFS) for navigating smarter social objects in SIoT. Microprocess. Microsyst. 2021, 80, 103358. [Google Scholar] [CrossRef]
- Rahman, M.A.; Hossain, M.S.; Showail, A.J.; Alrajeh, N.A.; Alhamid, M.F. A Secure, Private, and Explainable IoHT Framework to Support Sustainable Health Monitoring in a Smart City. Sustain. Cities Soc. 2021, 72, 103083. [Google Scholar] [CrossRef]


| Relationship Types | Definitions |
|---|---|
| Parent-OR | Objects that belong to the same manufacturer. |
| Ownert-OR | Objects belonging to the same owner. |
| Guardiant-OR | Between Child object and parent object association. |
| Socialt-OR | Closeness between objects either random in time or periodically. |
| Guestt-OR | Between objects that belong to the users in the guest role. |
| Siblingt-OR | Objects that belong to a group of friends or family members. |
| Servicet-OR | Objects coordinating in the same service composition. |
| Stranget-OR | Objects suddenly disappear in a public environment. |
| Co-locationt-OR | Objects share information at the same location. |
| Co-workt-OR | Group of objects shares common work done by them. |
| Authors | Applications | Methodology | Remarks |
|---|---|---|---|
| Pillai et al. [40] | Disasters prediction | Proposed the MQ4, MQ7 and force sensing resistoron AWS cloud. | It is confined only to IoT Architecture |
| Akhter et al. [41] | Smart Agriculture | ML approach in Apple disease analytics. | IoT in ML based agriculture analytic. |
| Bhuiyan et al. [42] | Smart City | Examine the air pollutant using LSTM CNN, RNN and GRU | Analyse the quality of air. |
| Alrahhal et al. [43] | Smart City Security | Tow-ACKs Trust (TAT) Routing protocol | Analyses network security based on trust. |
| Al-Otaiby et al. [44] | Smart City trust management system | AntTrust, a trust management system inspired by the ant colony | Analyze network trust between peers in P2P networks. |
| Variables | Descriptions |
|---|---|
| N | |
| D | |
| Relationship Types | Device Type | Distance | Conection Type | Communication Protocol | Device Brand |
|---|---|---|---|---|---|
| STOR | different | ≤ 15 mt | public to private | zigbee | different |
| SROR | same | ≤15 mt | public to private | wifi | different |
| GUOR | different | >50 mt <100 mt | private to private | wifi or bluetooth or wifi direct | different |
| CWOR | different | <10 mt | private to private | wifi or bluetooth or wifi direct | different |
| CLOR | same | >10 mt <50 mt | private to private | wifi or bluetooth or wifi direct | different |
| POR | same | <400 mt | private to private | wifi or bluetooth or wifi direct | same |
| GSOR | same | <10 mt | private to private | wifi or bluetooth or wifi direct | different |
| SIOR | different | <50 mt | private to private | wifi or bluetooth or wifi direct | different |
| SOR | different | >20 mt <50 mt | public to private | wifi or bluetooth or wifi direct | different |
| OOR | different | <20 mt | private to private | wifi or bluetooth or wifi direct | same |
| Attributes | Sample Descriptions |
|---|---|
| OwnerId | Owner IDs up to range of 1 to 100,000 users |
| Devices | Devices includes (smart phone, fitbit, tablet, car and smart watch) |
| DeviceBrands | Total four brands A, B, C and D for all devices. |
| Distance | 0 to 500 m |
| Protocols | Blueetooth, WIFI, GSM and Zigbee |
| DeviceType | Private and Public |
| Locations | Device location Name |
| Attributes Types | Samples |
|---|---|
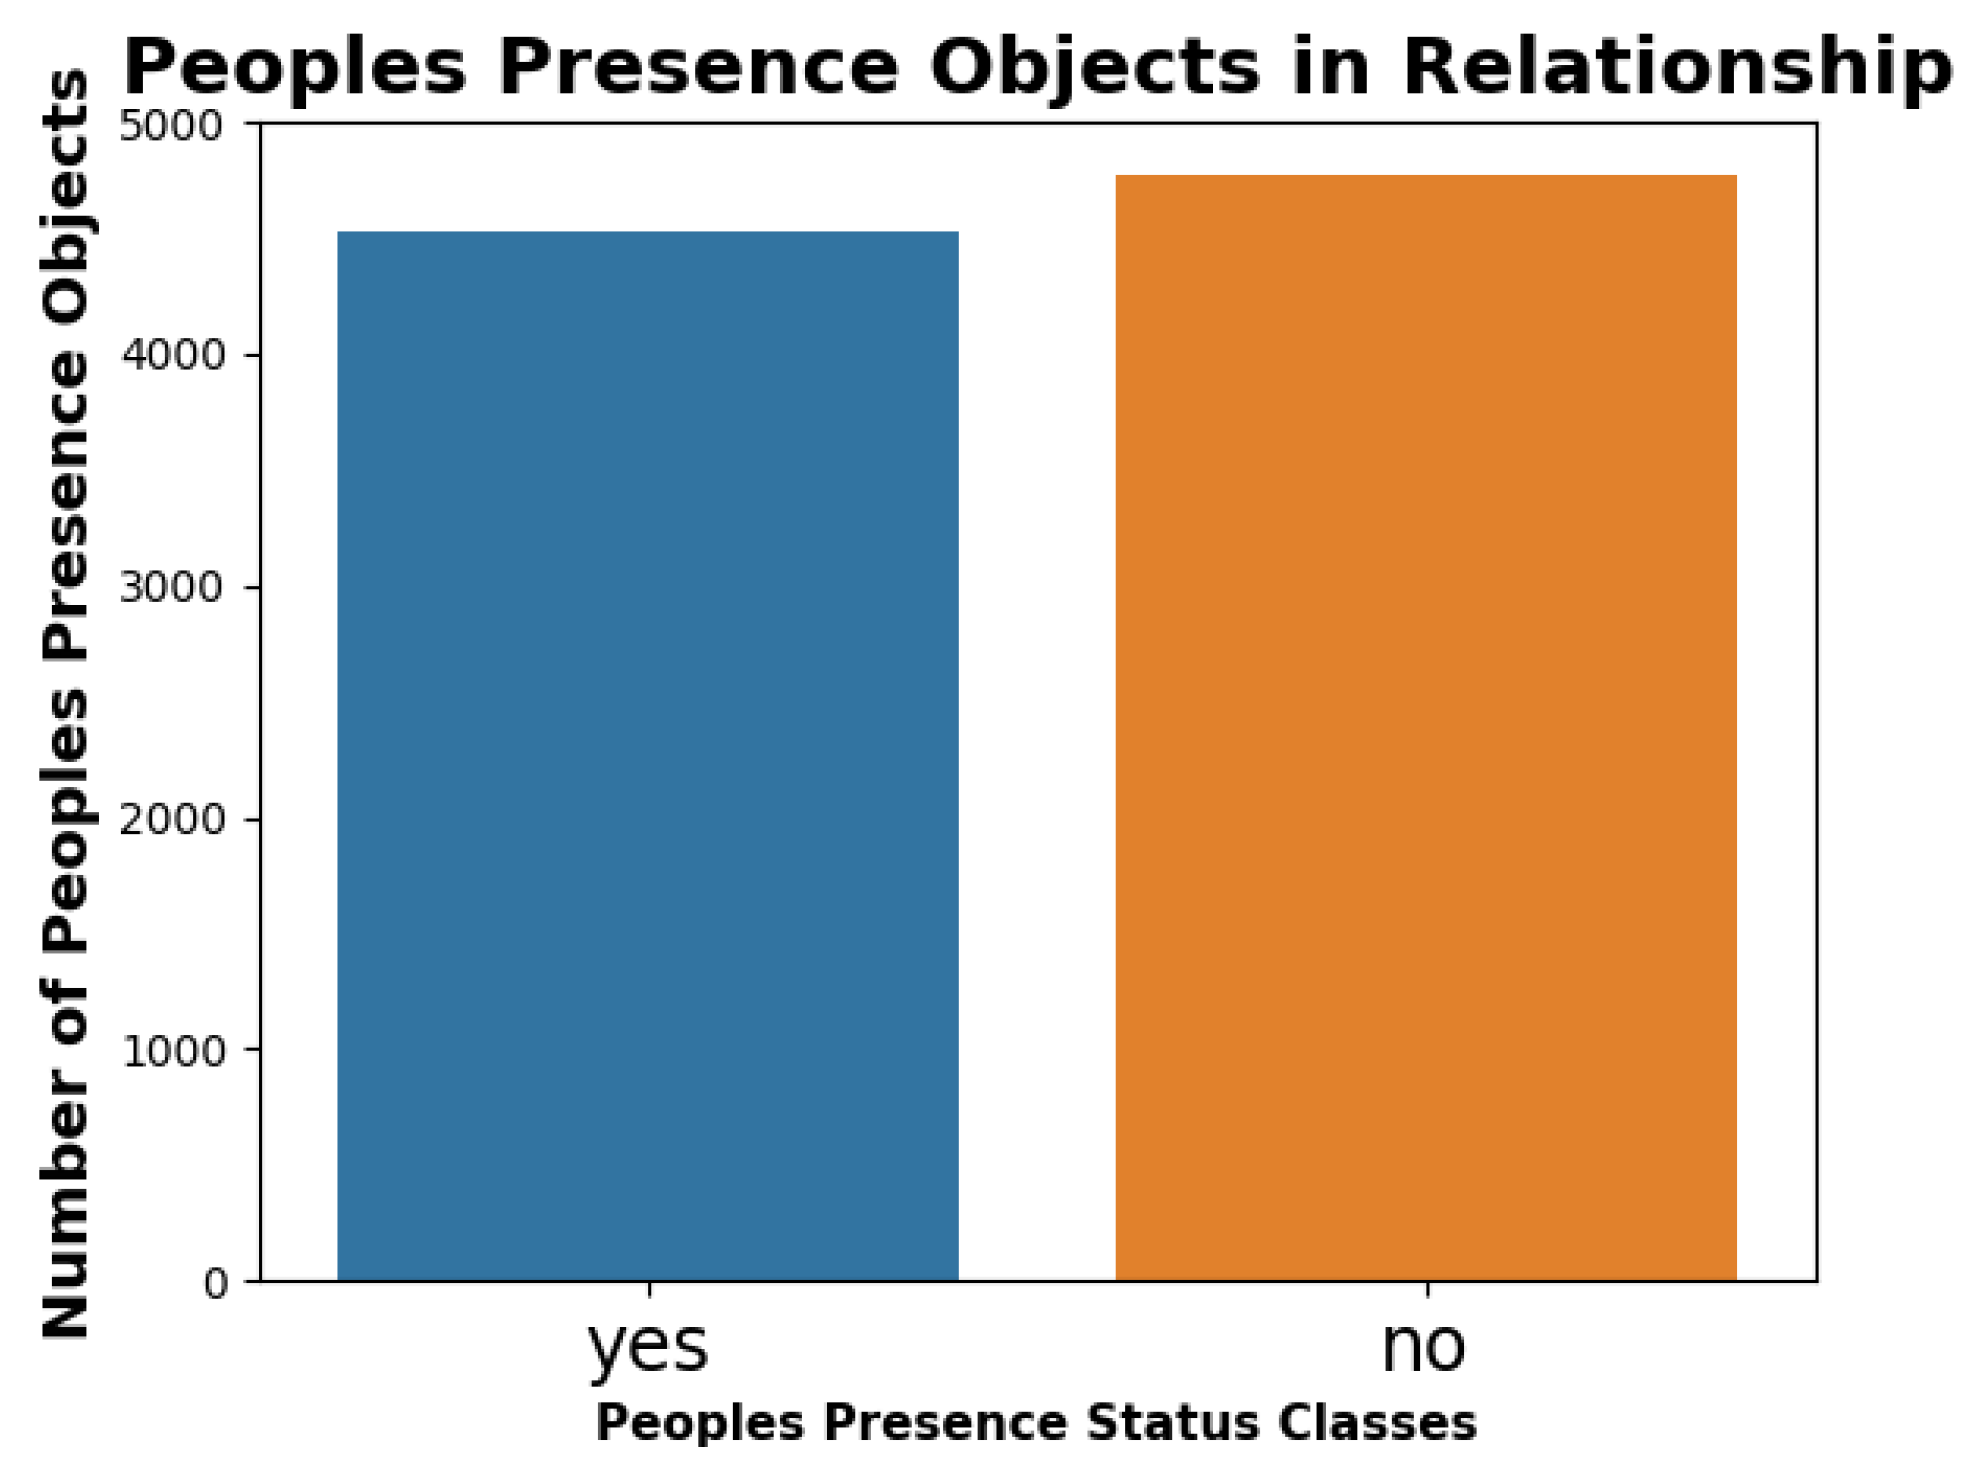
| People PresencePublic | People present in the public places. |
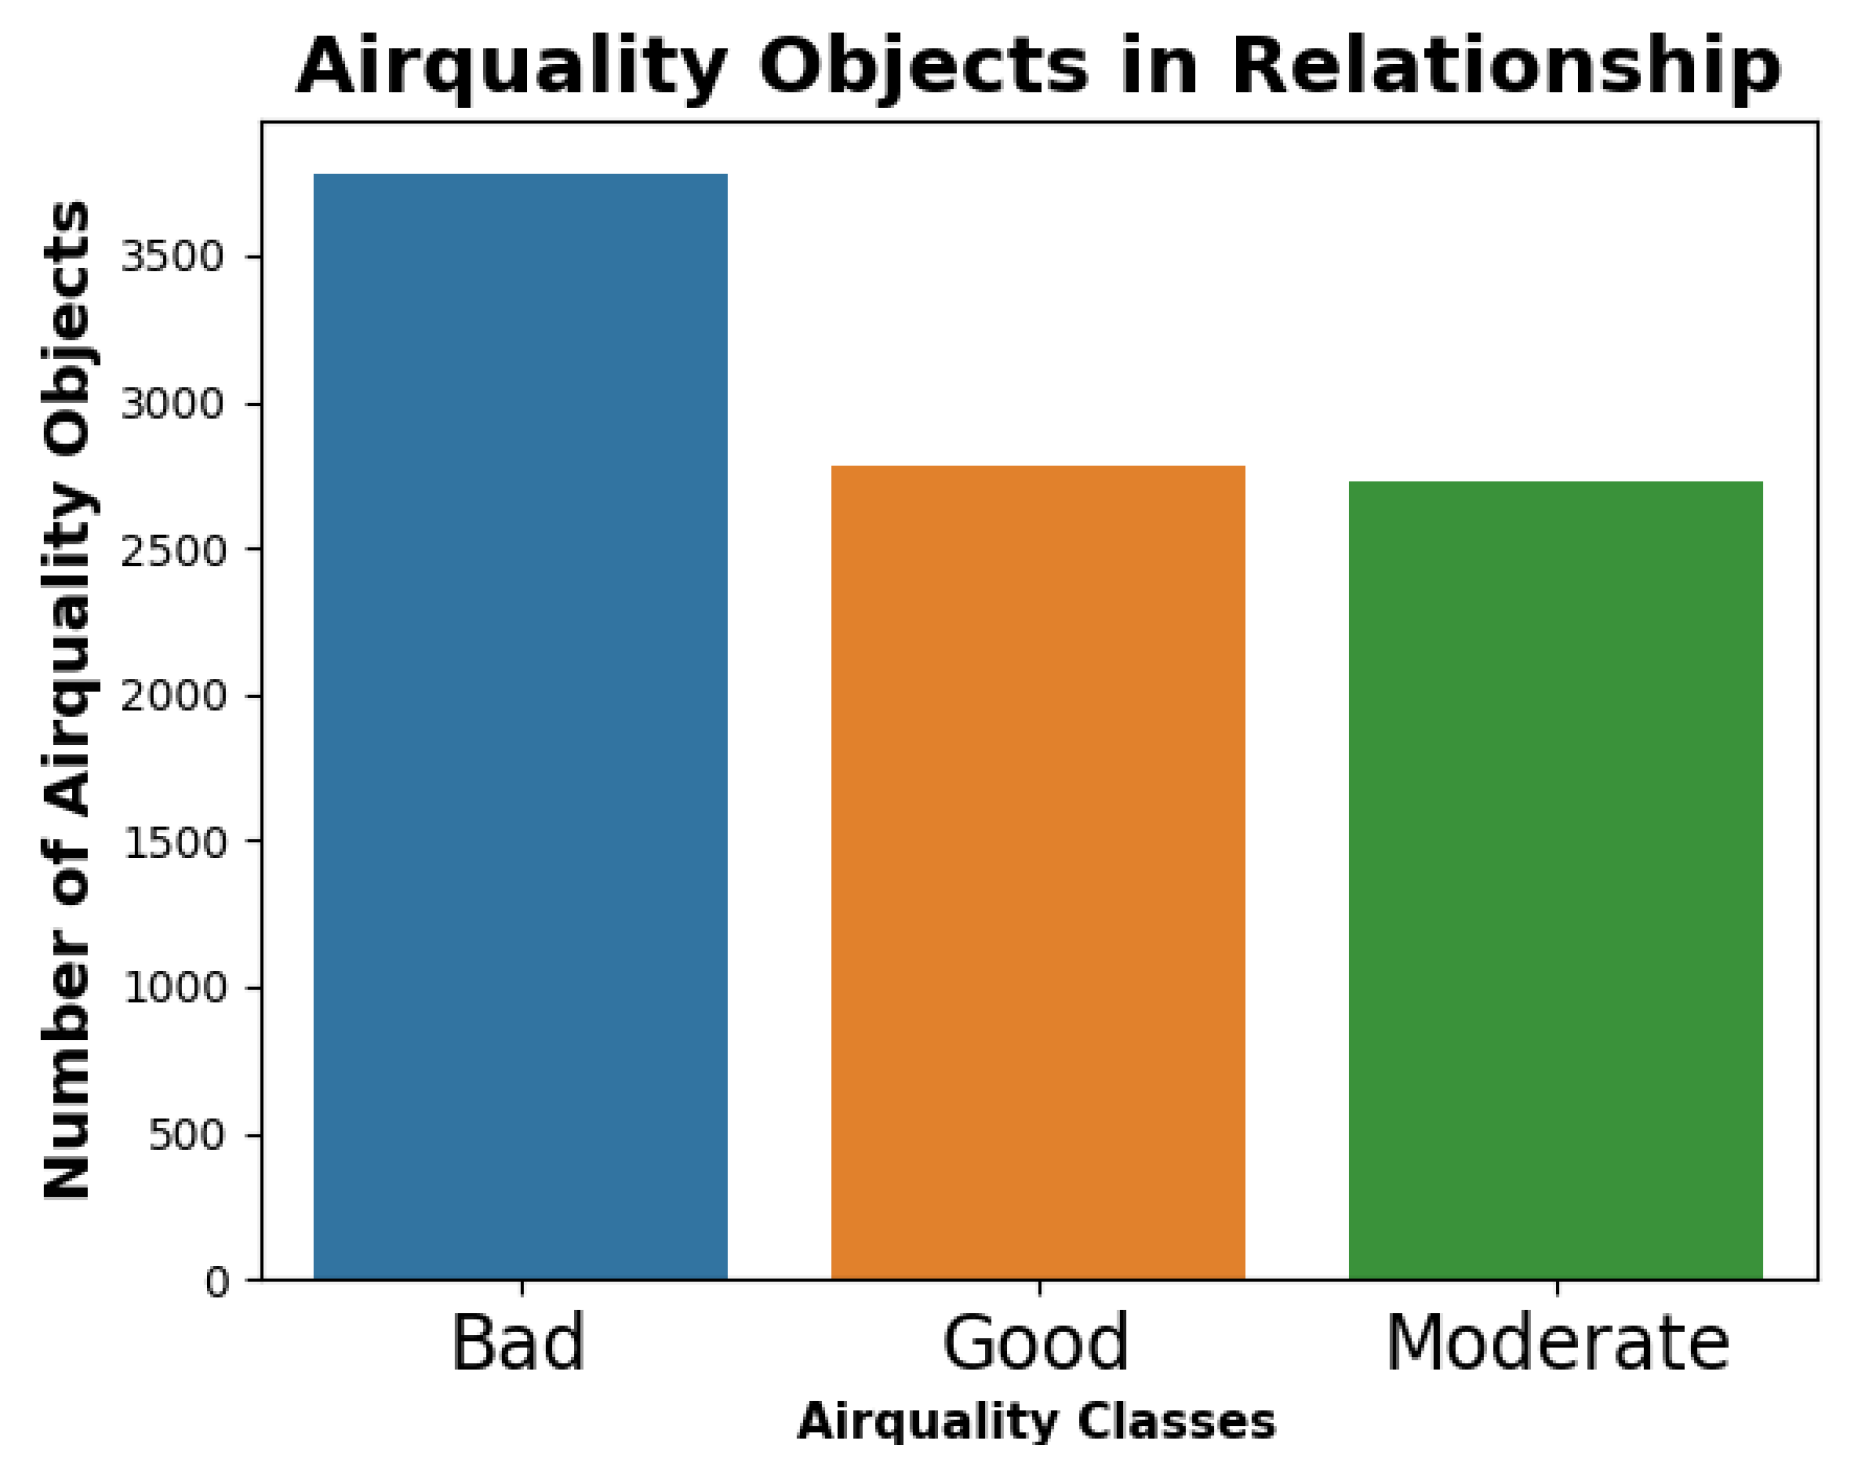
| AirQuality | Air quality of the public place |
| NO2 | Gaseous air pollutant comrpising nitrogen and oxygen |
| O3 | Ozone O3 in Ground-level or the bad ozone |
| CO | Smoke and fumes contained in carbon monoxide are common air pollutants. |
| nox | Pollution is emitted by automobiles, trucks and various non-road vehicles. |
| AirQualityIndex | It is used by government agencies to communicate to the public (range 0 to 500) |
| DeviceMoving | Accelerometer in range of −270 to +270 |
| Movement | Device movement yes or No |
| ParkingStatus | City location parking status yes or no |
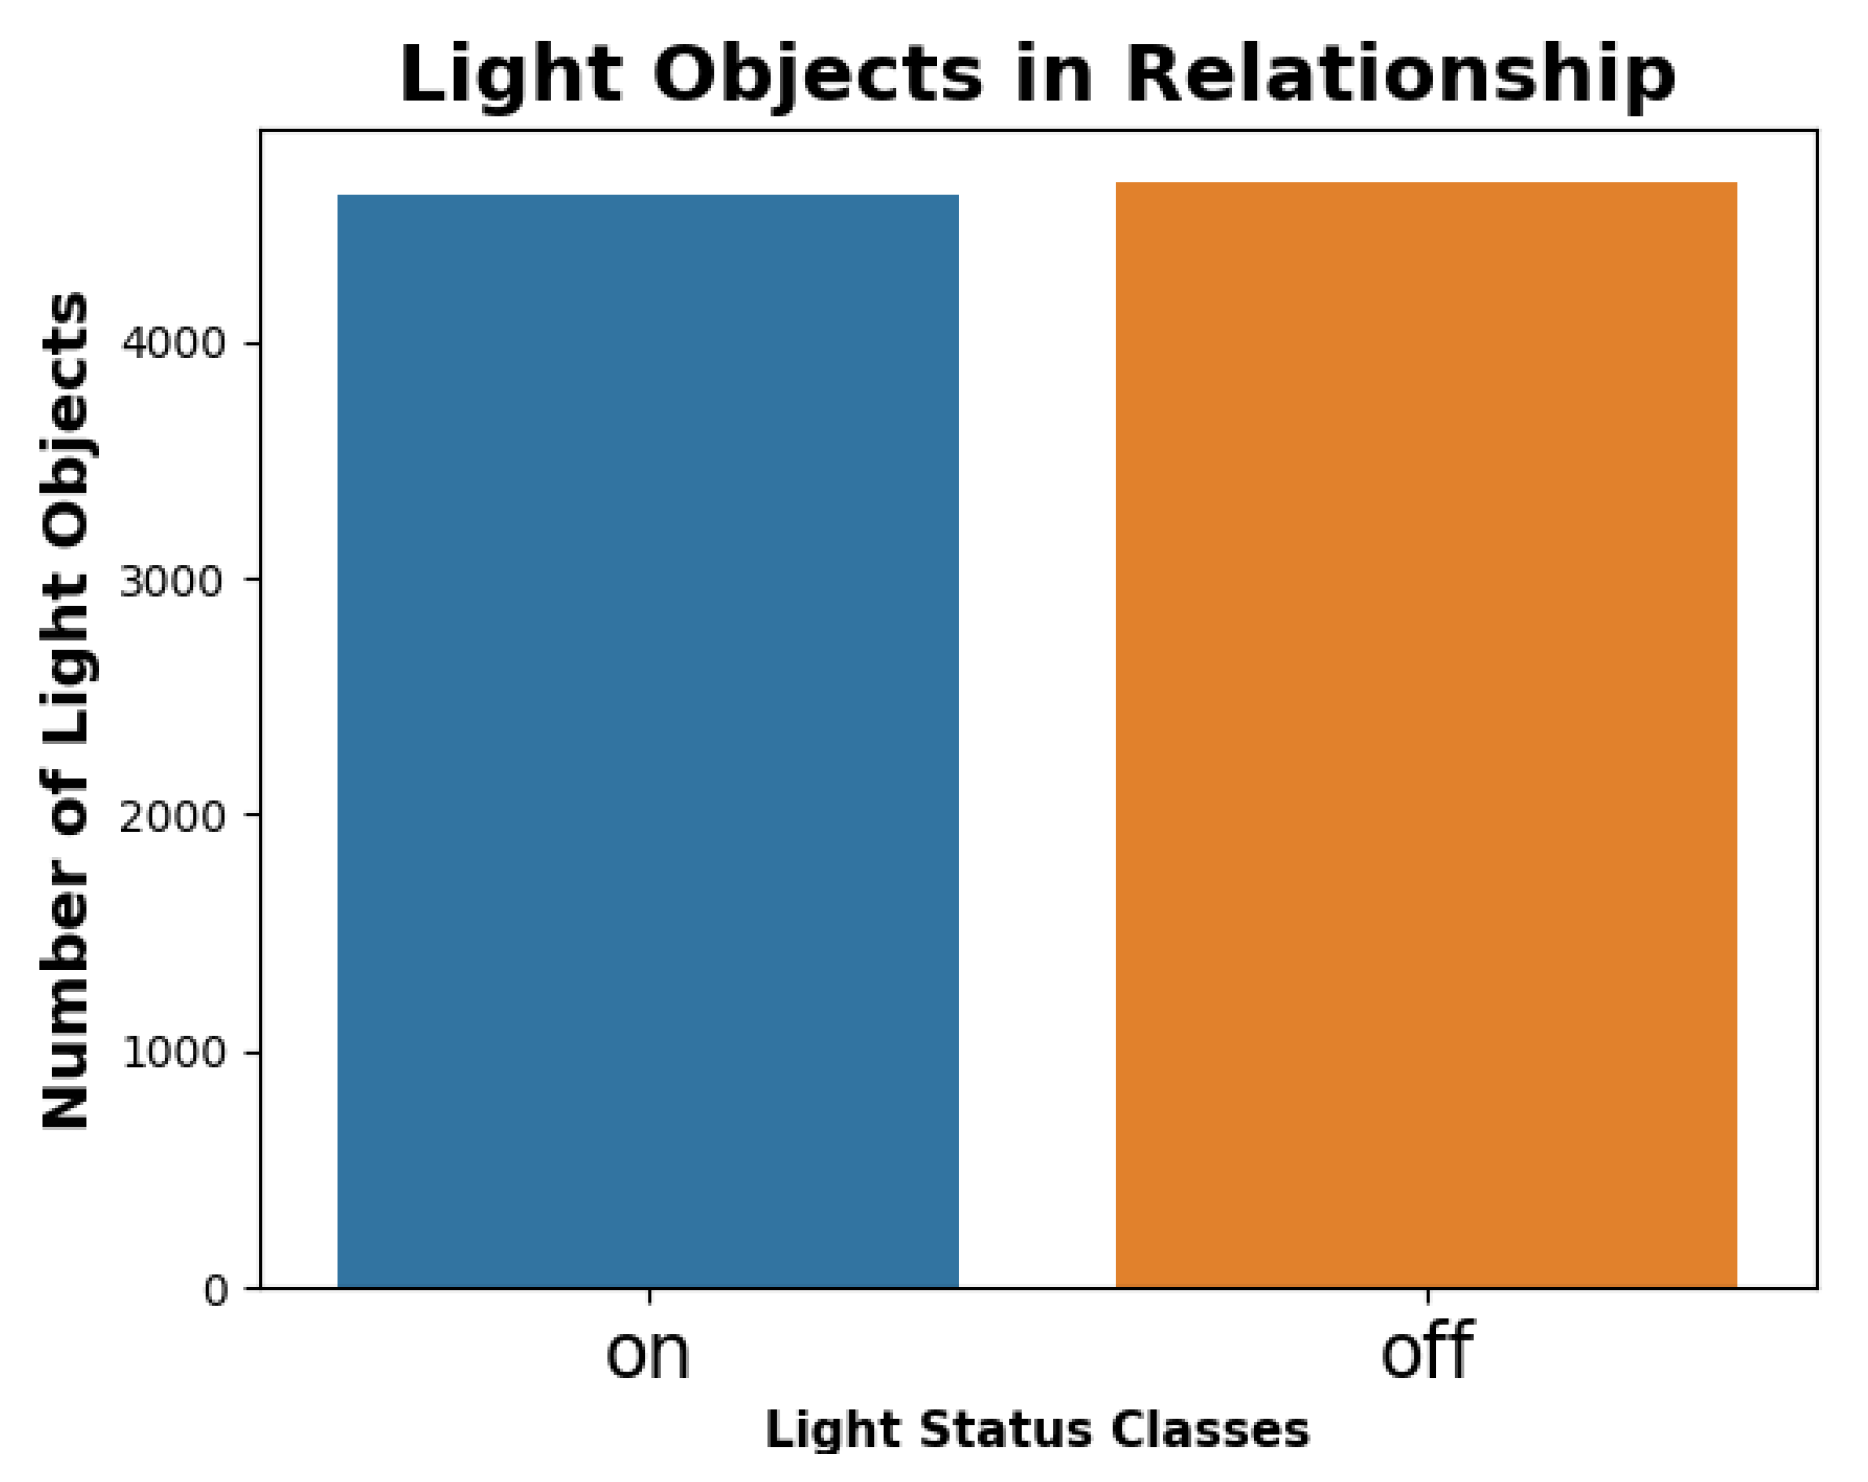
| StreetlightStatus | Yes or no |
| Temperature | City location temperature range of −10 to 100 |
| Pressure | City location pressure range of 0–100 |
| Humidity | City location humidity range of 0–100 |
| WeatherDescription | City location weather: sunny, cloudy, thunder, lightning and rainy |
| Point ofInterest | City location events range 1–50 |
| LandMark | City landmark |
| TrafficStatus | City landmark or location traffic status (yes or no) |
| Applications | Services |
|---|---|
| Air Quality | Location, Landmark, NO2, CO and NOx |
| Weather | Location, Landmark, Pressure, Humidity and Temperature |
| Traffic | Movement, Device Moving, Location and Landmark |
| Parking | Movement, Device Moving, Location and Landmark |
| Street Light | Movement, Device Moving, Location and Landmark |
| People Presence | Movement, Device Moving, Location and Landmark |
| Applications | Precision | Recall | F1 Score | Average Accuracy |
|---|---|---|---|---|
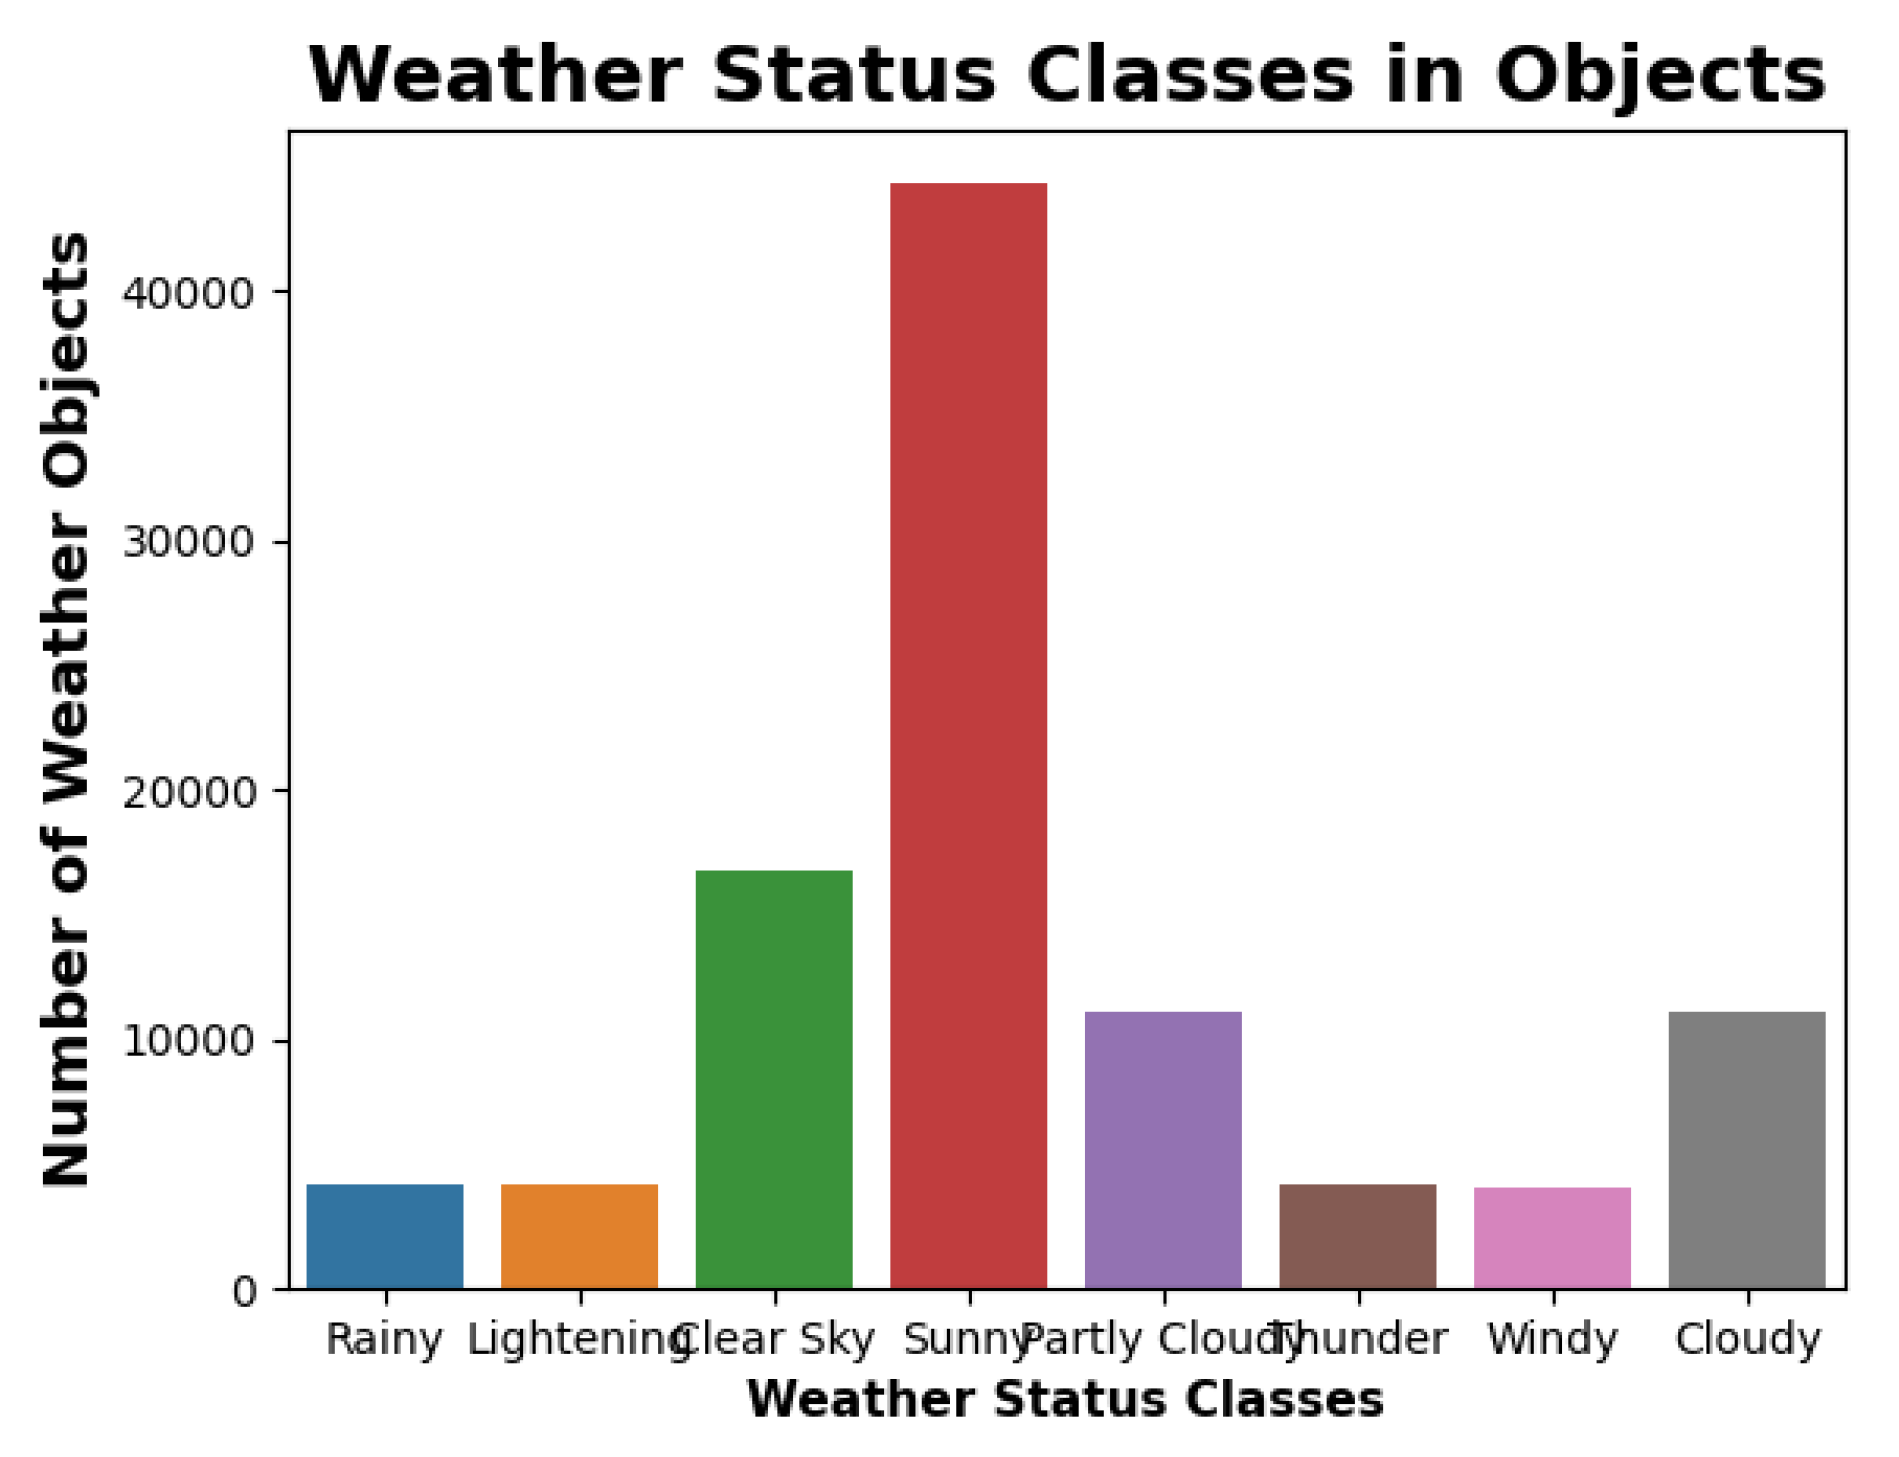
| Weather Status | 0.94 | 0.93 | 0.93 | 74.89 % |
| 0.51 | 0.96 | 0.66 | ||
| 0.30 | 0.05 | 0.08 | ||
| 0.10 | 0.25 | 0.14 | ||
| 0.25 | 0.05 | 0.08 | ||
| 0.97 | 1.00 | 0.99 | ||
| 0.25 | 0.92 | 0.39 | ||
| 0.15 | 0.80 | 0.25 | ||
| Air quality Status | 0.98 | 0.99 | 0.98 | 96.08% |
| 0.93 | 0.99 | 0.96 | ||
| 0.98 | 0.89 | 0.93 | ||
| Traffic Status | 0.91 | 0.95 | 0.92 | 94.00% |
| 0.94 | 0.93 | 0.93 | ||
| 0.96 | 1.00 | 0.97 | ||
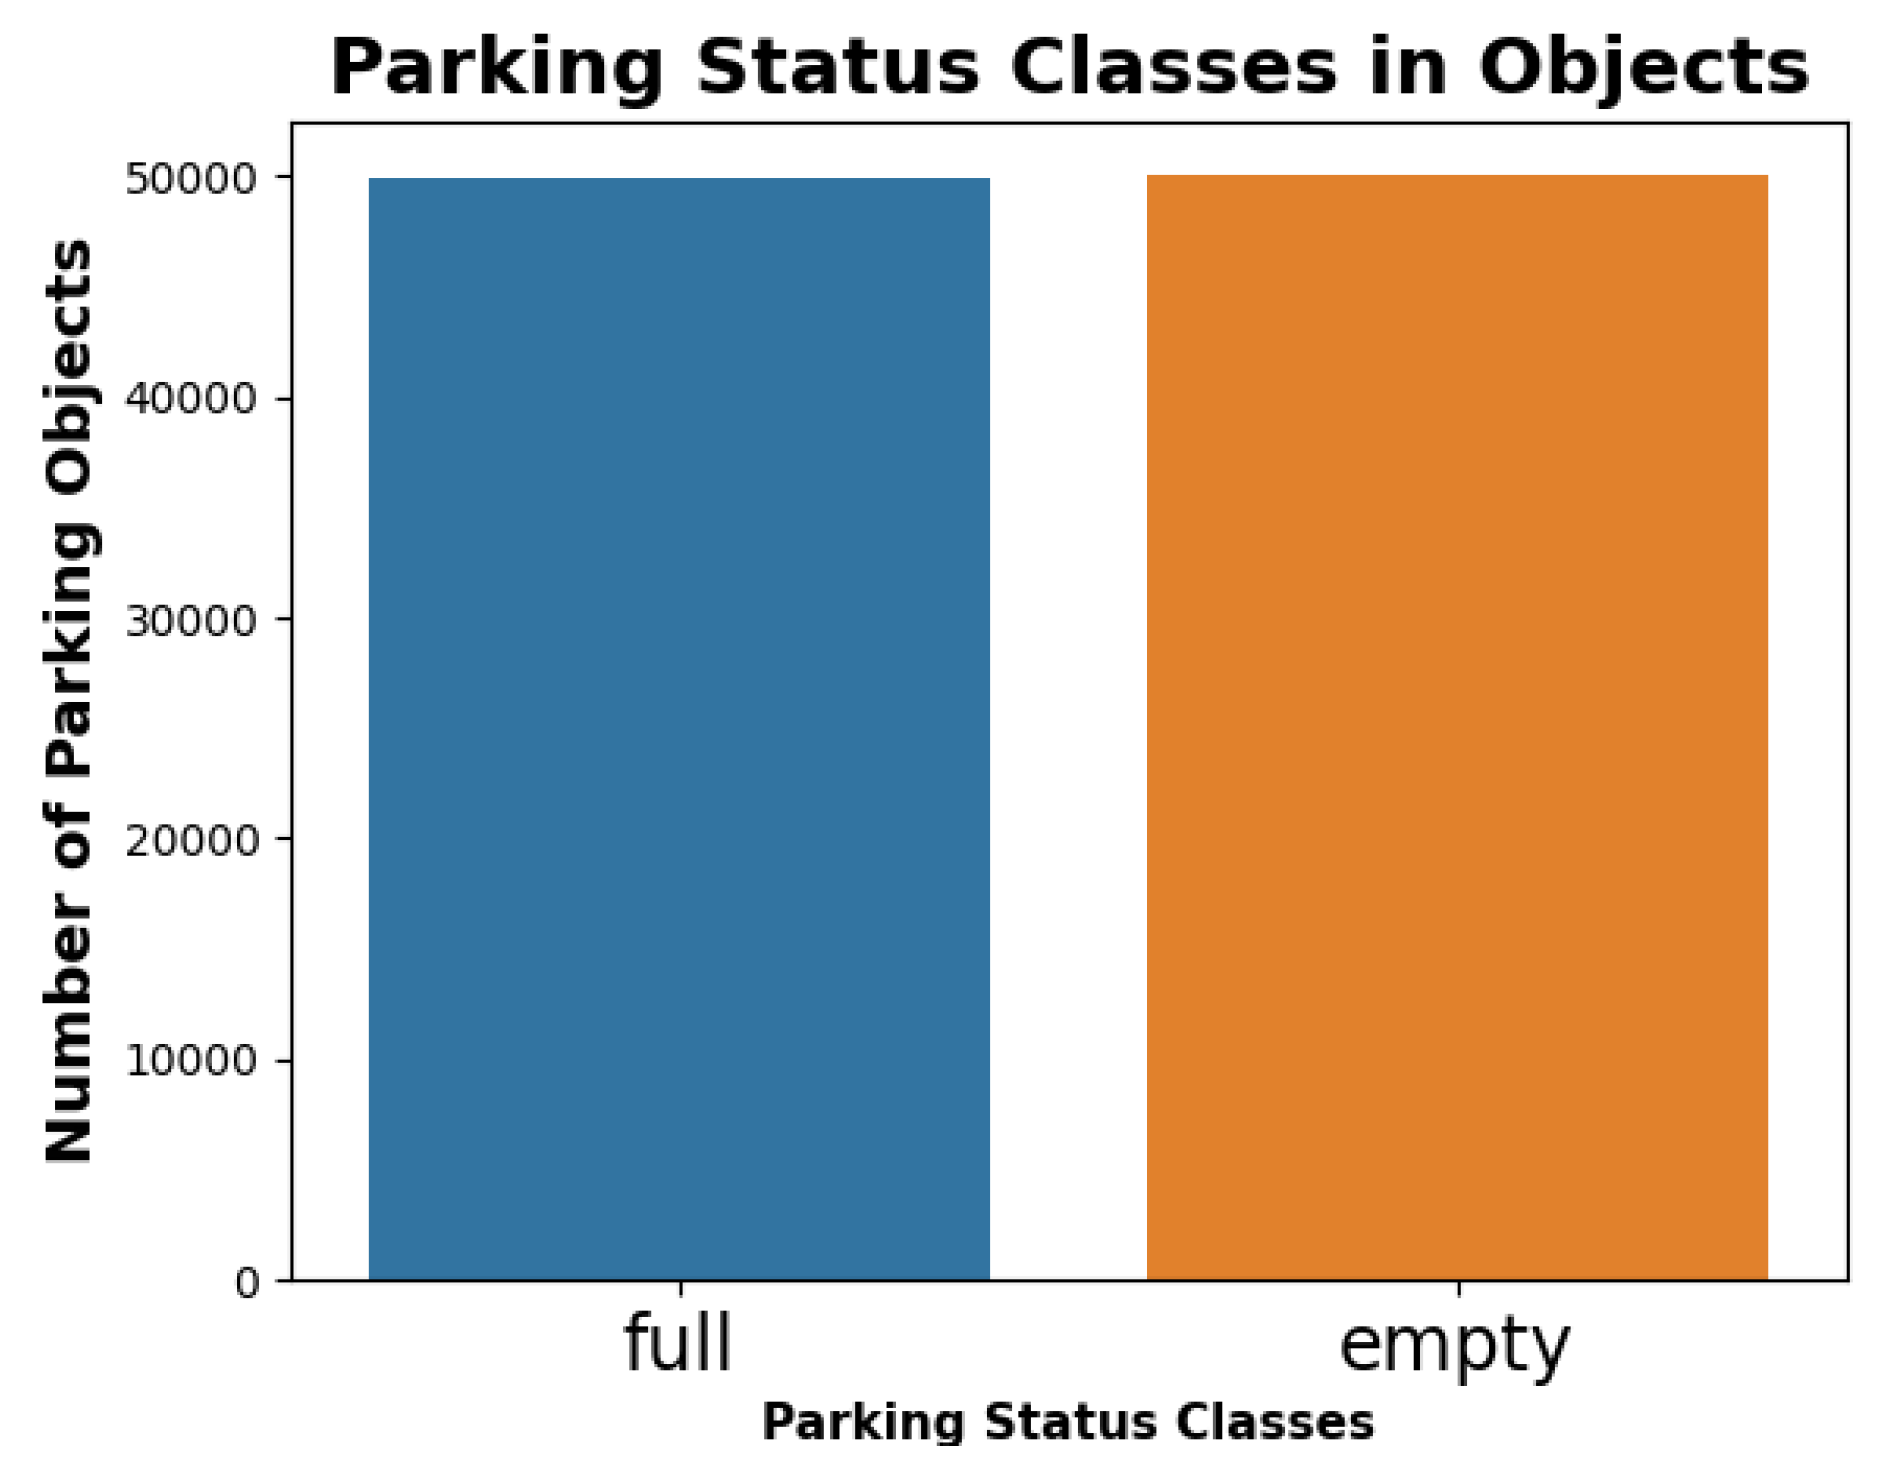
| Parking Status | 0.50 | 1.00 | 0.67 | 66.50% |
| 0.55 | 0.85 | 0.66 | ||
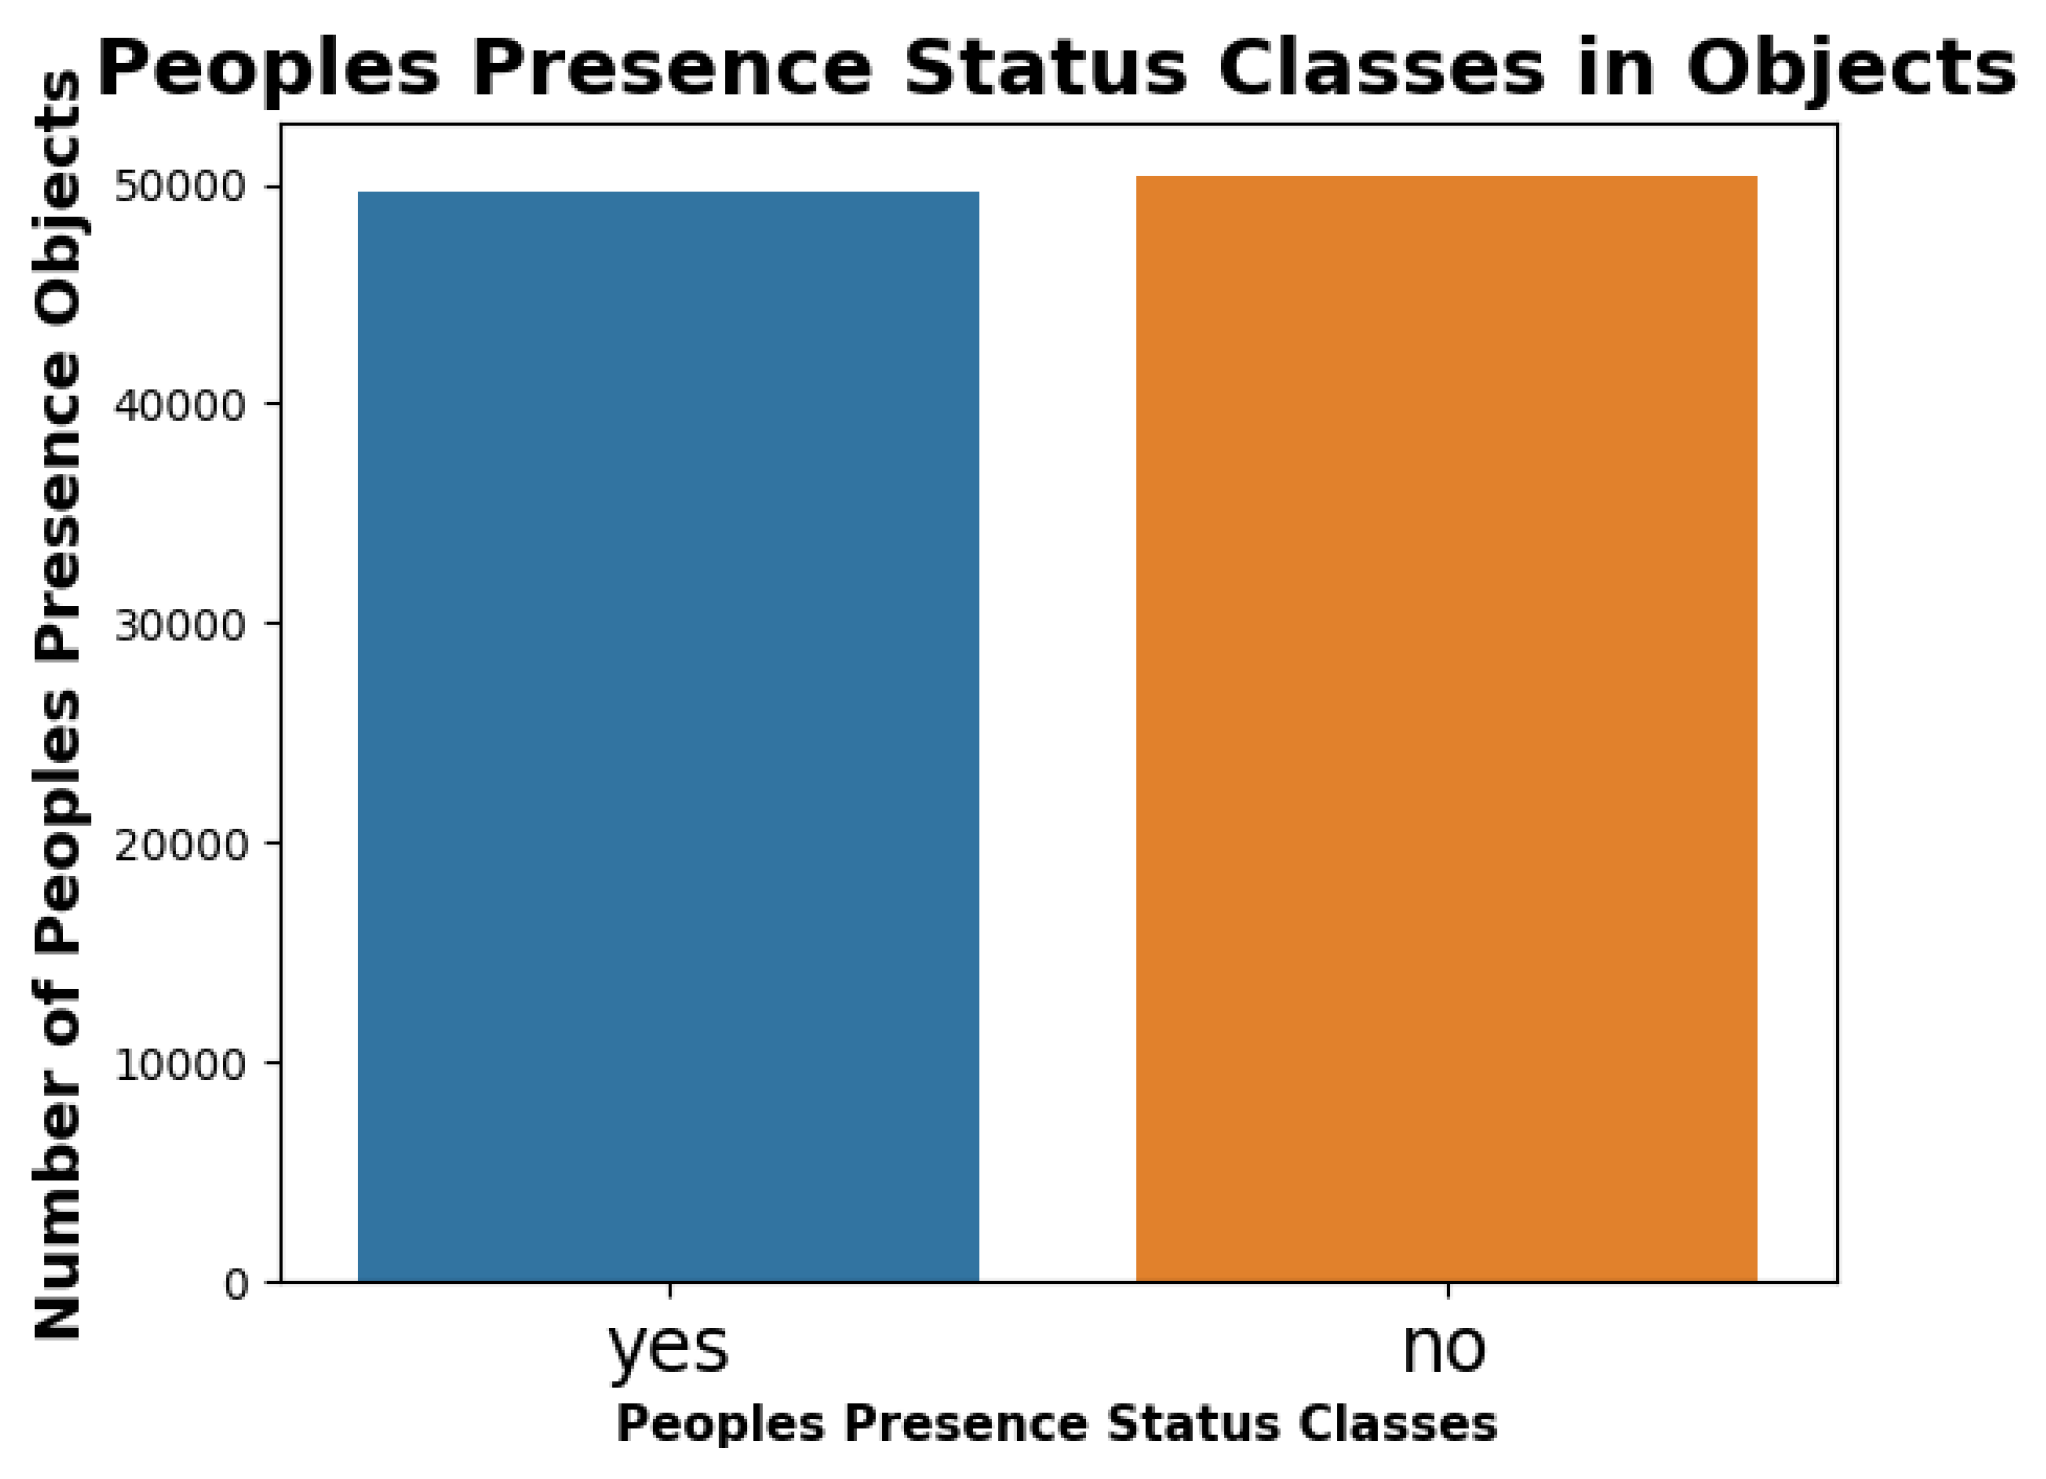
| People Presence Status | 0.65 | 0.75 | 0.66 | 66.50% |
| 0.50 | 1.00 | 0.67 | ||
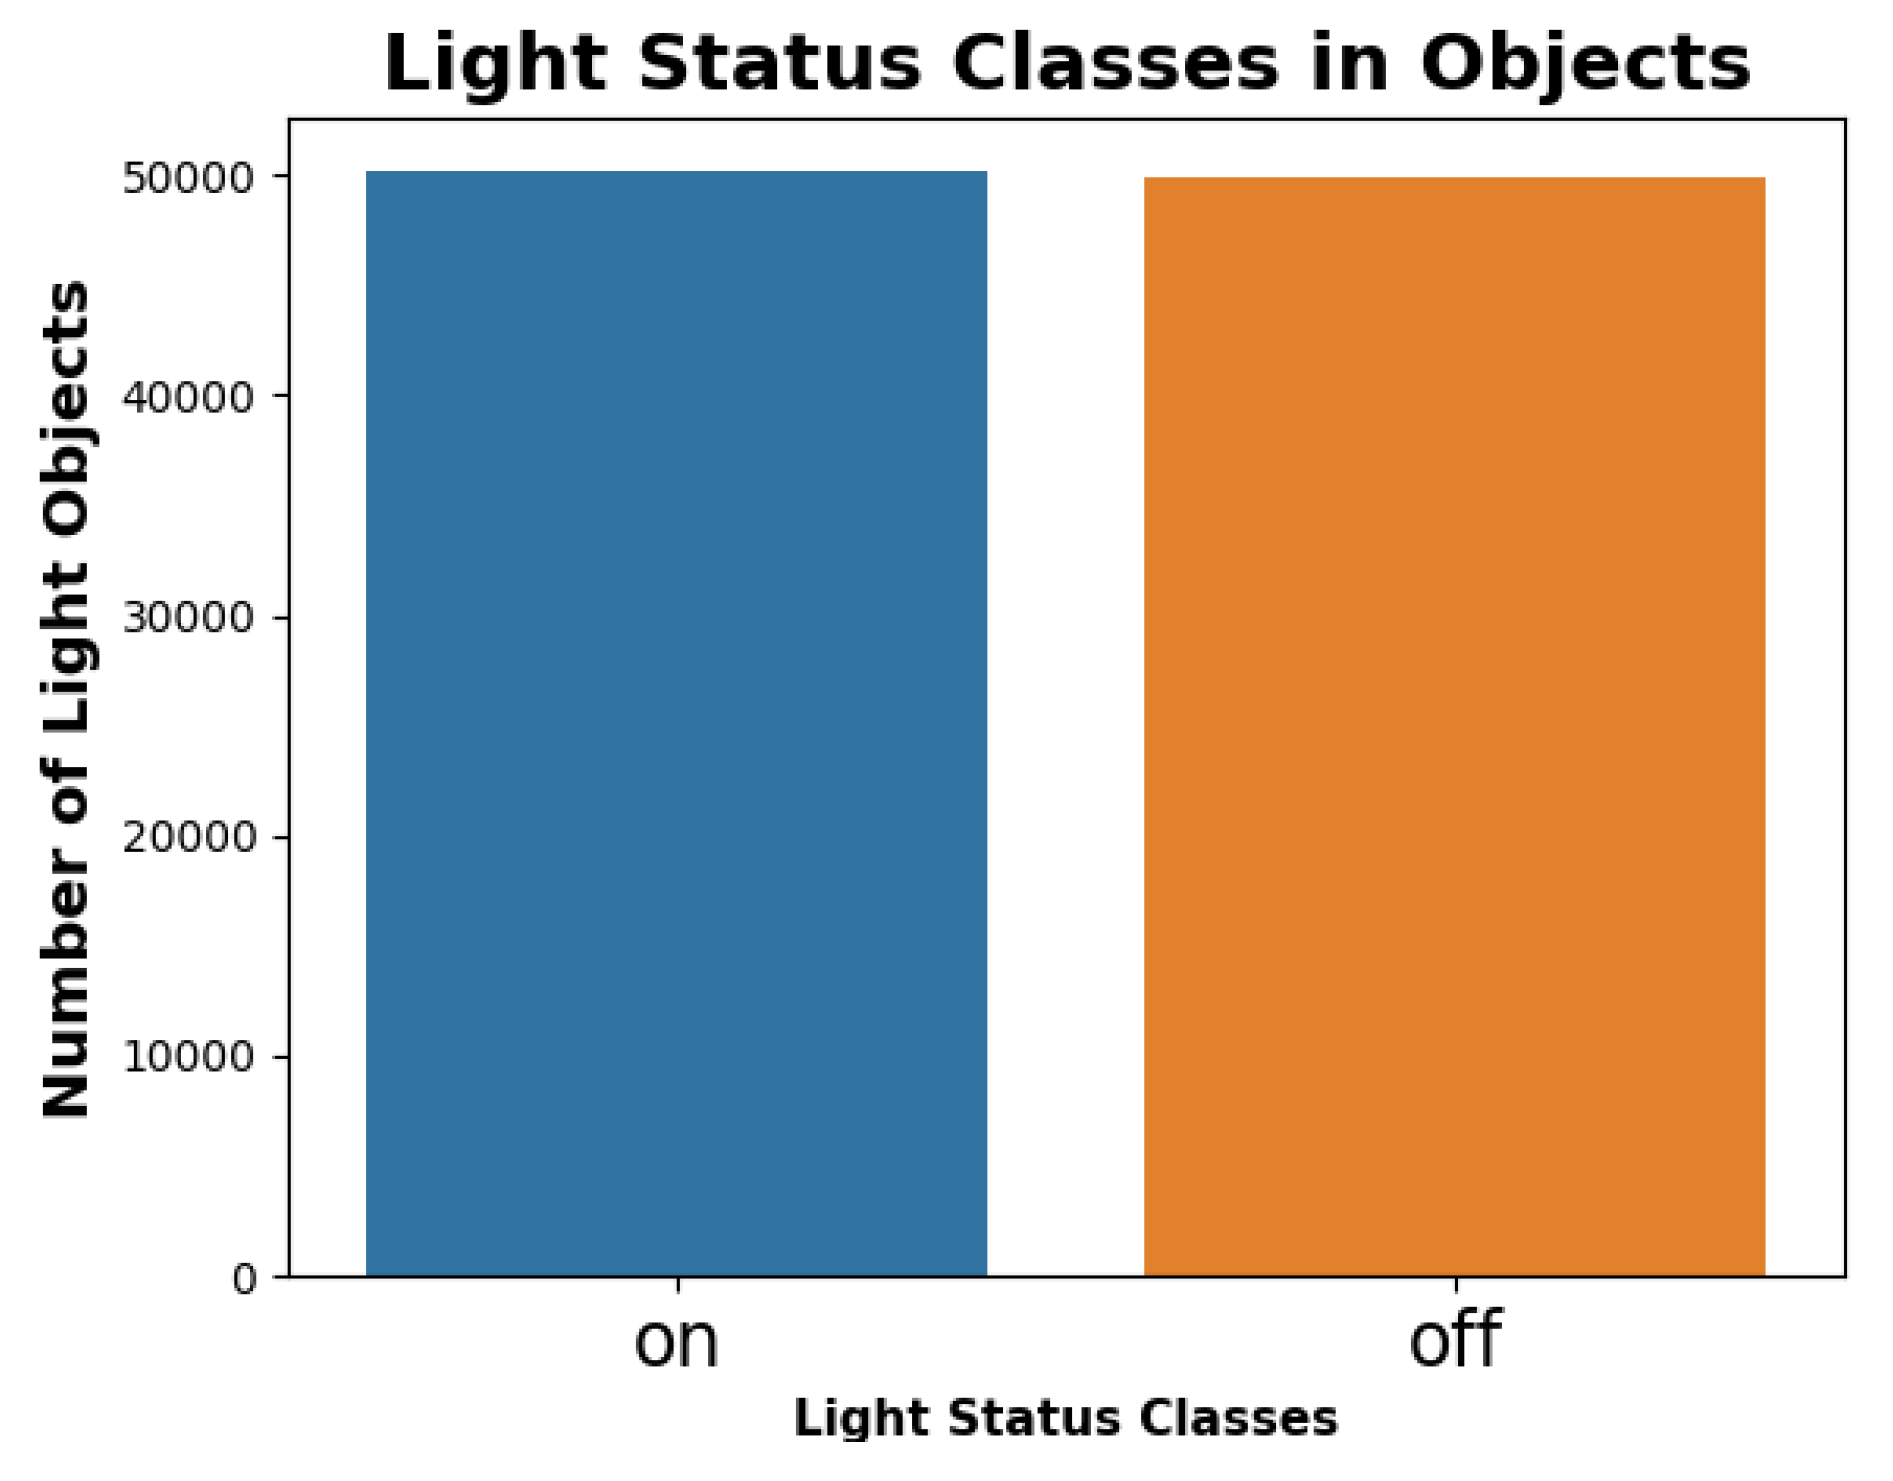
| Light Status | 0.97 | 1.00 | 0.99 | 75.00% |
| 0.35 | 0.99 | 0.51 | ||
| Average Accuracy of All Applications | 78.83% |
| Request Device | Protocols | Repond Device | Service | Applications | Relation Identified |
|---|---|---|---|---|---|
| [SmartPhone] | [WiFi] | [Car] | Location | Traffic | SIBOR |
| [Tablet] | [Bluetooth] | [Car] | Location | Traffic | SIBOR |
| [SmartPhone] | [Bluetooth] | [Car] | Landmark | Weather | POR |
| [Tablet] | [Bluetooth] | [Car] | Pressure, Humidity | Weather | SIBOR |
| [Tablet] | [Bluetooth] | [Car] | CO, Nox | Air quality | POR |
| [SmartPhone] | [WiFi] | [Car] | CO, Nox | Air quality | GUOR |
| [SmartPhone] | [WiFi] | [Car] | CO, Nox | Air quality | POR |
| [SmartPhone] | [WiFi] | [Car] | Landmark | Weather | GUOR |
| [SmartPhone] | [Bluetooth] | [Car] | Movement, Device Moving, Location and Landmark | Traffic | SIBOR |
| [Tablet] | [Bluetooth] | [Car] | Landmark | Weather | SIBOR |
| [Tablet] | [Bluetooth] | [SmartPhone] | Landmark | Weather | SIBOR |
| [SmartPhone] | [Bluetooth] | [SmartPhone] | Landmark | Weather | POR |
| [Tablet] | [Bluetooth] | [SmartPhone] | Landmark | Weather | POR |
| [SmartPhone] | [Bluetooth] | [SmartPhone] | Movement, Device Moving, Location and Landmark | Traffic | SIBOR |
| [Tablet] | [Bluetooth] | [SmartPhone] | Landmark | Weather | SIBOR |
| [Tablet] | [Bluetooth] | [SmartPhone] | Landmark | Weather | CWOR |
| [Tablet] | [Bluetooth] | [SmartPhone] | Landmark | Weather | POR |
| Precision | Recall | F1 Score | |
|---|---|---|---|
| 0.96 | 0.90 | 0.93 | |
| 0.76 | 0.88 | 0.82 | |
| accuracy | 0.90 | ||
| macro avg | 0.86 | 0.89 | 0.87 |
| weighted avg | 0.90 | 0.90 | 0.90 |
| Overall Accuracy | 89.62 % |
| Dataset | Model | Results | Accuracy | ||||
|---|---|---|---|---|---|---|---|
| MSE | RMSE | MAE | |||||
| PJM and Open Energy (Information) | [45] | CNN | − | − | − | − | |
| SVR | − | − | − | − | |||
| City Pluse EU FP7 | [46] | SVM | − | − | − | ||
| NN | − | − | − | ||||
| GLM | − | − | |||||
| CASAS Dataset MIT Dataset | [47] | SF + GWA + Ranking | − | − | − | ||
| IoHT data | [48] | CNN | − | − | − | − | 80% to 94% |
| MIT-BIH arrhythmia Dataset | [18] | CNN | − | − | − | ||
| Smart city Dataset for 6 applications (Air quality Weather Traffic Parking Street Light People Precence) | Proposed R-ANN | − | − | − | − | ||
Publisher’s Note: MDPI stays neutral with regard to jurisdictional claims in published maps and institutional affiliations. |
© 2022 by the authors. Licensee MDPI, Basel, Switzerland. This article is an open access article distributed under the terms and conditions of the Creative Commons Attribution (CC BY) license (https://creativecommons.org/licenses/by/4.0/).
Share and Cite
S. D., M.; Prakash, S.P.S.; Krinkin, K. Service Oriented R-ANN Knowledge Model for Social Internet of Things. Big Data Cogn. Comput. 2022, 6, 32. https://doi.org/10.3390/bdcc6010032
S. D. M, Prakash SPS, Krinkin K. Service Oriented R-ANN Knowledge Model for Social Internet of Things. Big Data and Cognitive Computing. 2022; 6(1):32. https://doi.org/10.3390/bdcc6010032
Chicago/Turabian StyleS. D., Mohana, S. P. Shiva Prakash, and Kirill Krinkin. 2022. "Service Oriented R-ANN Knowledge Model for Social Internet of Things" Big Data and Cognitive Computing 6, no. 1: 32. https://doi.org/10.3390/bdcc6010032
APA StyleS. D., M., Prakash, S. P. S., & Krinkin, K. (2022). Service Oriented R-ANN Knowledge Model for Social Internet of Things. Big Data and Cognitive Computing, 6(1), 32. https://doi.org/10.3390/bdcc6010032