Article

AI Based Emotion Detection for Textual Big Data: Techniques and Contribution

1
Symbiosis Institute of Technology, Symbiosis International (Deemed University), Pune 412115, India
2
Symbiosis Centre for Applied Artificial Intelligence (SCAAI), Symbiosis Institute of Technology, Symbiosis International (Deemed University), Pune 412115, India
3
Department of CSE, Vardhaman College of Engineering, Hyderabad 500001, India
4
School of Computer Science and Engineering, The University of New South Wales, Sydney, NSW 2052, Australia
*
Authors to whom correspondence should be addressed.
Big Data Cogn. Comput. 2021, 5(3), 43; https://doi.org/10.3390/bdcc5030043
Submission received: 28 July 2021 / Revised: 3 September 2021 / Accepted: 6 September 2021 / Published: 9 September 2021
(This article belongs to the Special Issue Big Data and Internet of Things)

Abstract

:
Online Social Media (OSM) like Facebook and Twitter has emerged as a powerful tool to express via text people’s opinions and feelings about the current surrounding events. Understanding the emotions at the fine-grained level of these expressed thoughts is important for system improvement. Such crucial insights cannot be completely obtained by doing AI-based big data sentiment analysis; hence, text-based emotion detection using AI in social media big data has become an upcoming area of Natural Language Processing research. It can be used in various fields such as understanding expressed emotions, human–computer interaction, data mining, online education, recommendation systems, and psychology. Even though the research work is ongoing in this domain, it still lacks a formal study that can give a qualitative (techniques used) and quantitative (contributions) literature overview. This study has considered 827 Scopus and 83 Web of Science research papers from the years 2005–2020 for the analysis. The qualitative review represents different emotion models, datasets, algorithms, and application domains of text-based emotion detection. The quantitative bibliometric review of contributions presents research details such as publications, volume, co-authorship networks, citation analysis, and demographic research distribution. In the end, challenges and probable solutions are showcased, which can provide future research directions in this area.

1. Introduction

Out of 7.8 billion people worldwide, 50.64% of the population uses social networks, irrespective of their age [1]. Presently popular social networking sites like Facebook, Instagram, YouTube, WhatsApp, FB messenger, Twitter, and Reddit are used by this population. In addition, Twitter, Instagram, and Reddit are very widely used microblogging sites where people make short, frequent posts from these social networks.
Online Social Media (OSM) platforms provide the opportunity to express, communicate, and share people’s opinions, thoughts, views, and perspectives—on local and international issues, matters, and topics—through text, image, audio, and video posts. Posts on social media are public and abundant in emotions. Analyzing and studying these posts from social media may indicate emotional states and the reasons behind those emotions. However, the massive volume of this data makes this analysis very difficult. Artificial Intelligence can help to find emotions, feelings, personal traits, views, and their effects on social trends in an automated manner. Societal events such as pandemics and elections cause emotional variations in masses which are expressed via online social media. Even though various modes of communication are available, the text remains one of the most prevalent forms of communication in a social network. So, text-based emotion detection becomes a vital part of the research.
Text-based emotion detection using artificial intelligence employs Natural Language Processing (NLP) [2], which combines techniques in linguistics and computations to help computers comprehend and produce texts and speech/voice in the form of human languages. Wider applications in NLP consist of machine translation, speech recognition systems, sentiment analysis, text classification, questions and answering, chatbots, text summarization, and so on. Emotion detection is an extended derivative of sentiment analysis. Emotion detection is taking out finer-grained emotions like anger, happiness, sadness, anxiety, depression, etc., and applying this feedback to future decision making. This study of text-based emotion detection using artificial intelligence methods will be useful in many fields, including human–computer interaction, education, data mining, psychology, E-learning, software engineering, website customization, information filtering systems, gaming, etc.
The focus of sentiment analysis is to derive information from human language for interpreting views and feelings to assign polarities like positive, negative, or neutral. However, emotion detection aims at finding out more specific sentiment tones such as happiness, sadness, depression, anxiety, etc. Emotion detection can be applied to three classes, i.e., text, speech, and facial expressions. Emotion detection [3] from text is a process of determining the emotions of the written text using a set of predetermined emotion-labeled datasets and data analysis algorithms. Such kind of text emotion analysis helps in understanding the feedbacks given through online social media, customer reviews, product reviews, discussion forums, online recommendation systems, conversational agents, emails, web blogs, and many more. Emotion detection from text is addressed by two approaches: (1) Explicit detection and (2) Implicit detection. Explicit means clearly stated words or emotion-bearing words like “happy” are used in the written text to express the emotions. Explicit detection is identifying and classifying written text into emotion classes with the help of emotion-bearing words. Explicit detection is used where more specified key phrases are used to express emotions, such as the keyword-based approach of emotion detection. In contrast, identifying and categorizing text into emotion classes without emotion-bearing words is referred to as implicit emotion detection.
The issues in accurately detecting emotions from the text are short/incomplete text, emojis, grammatical mistakes, use of special characters, etc. Emotion detection can be done at different levels in texts such as word level, sentence level, paragraph level, and document level.

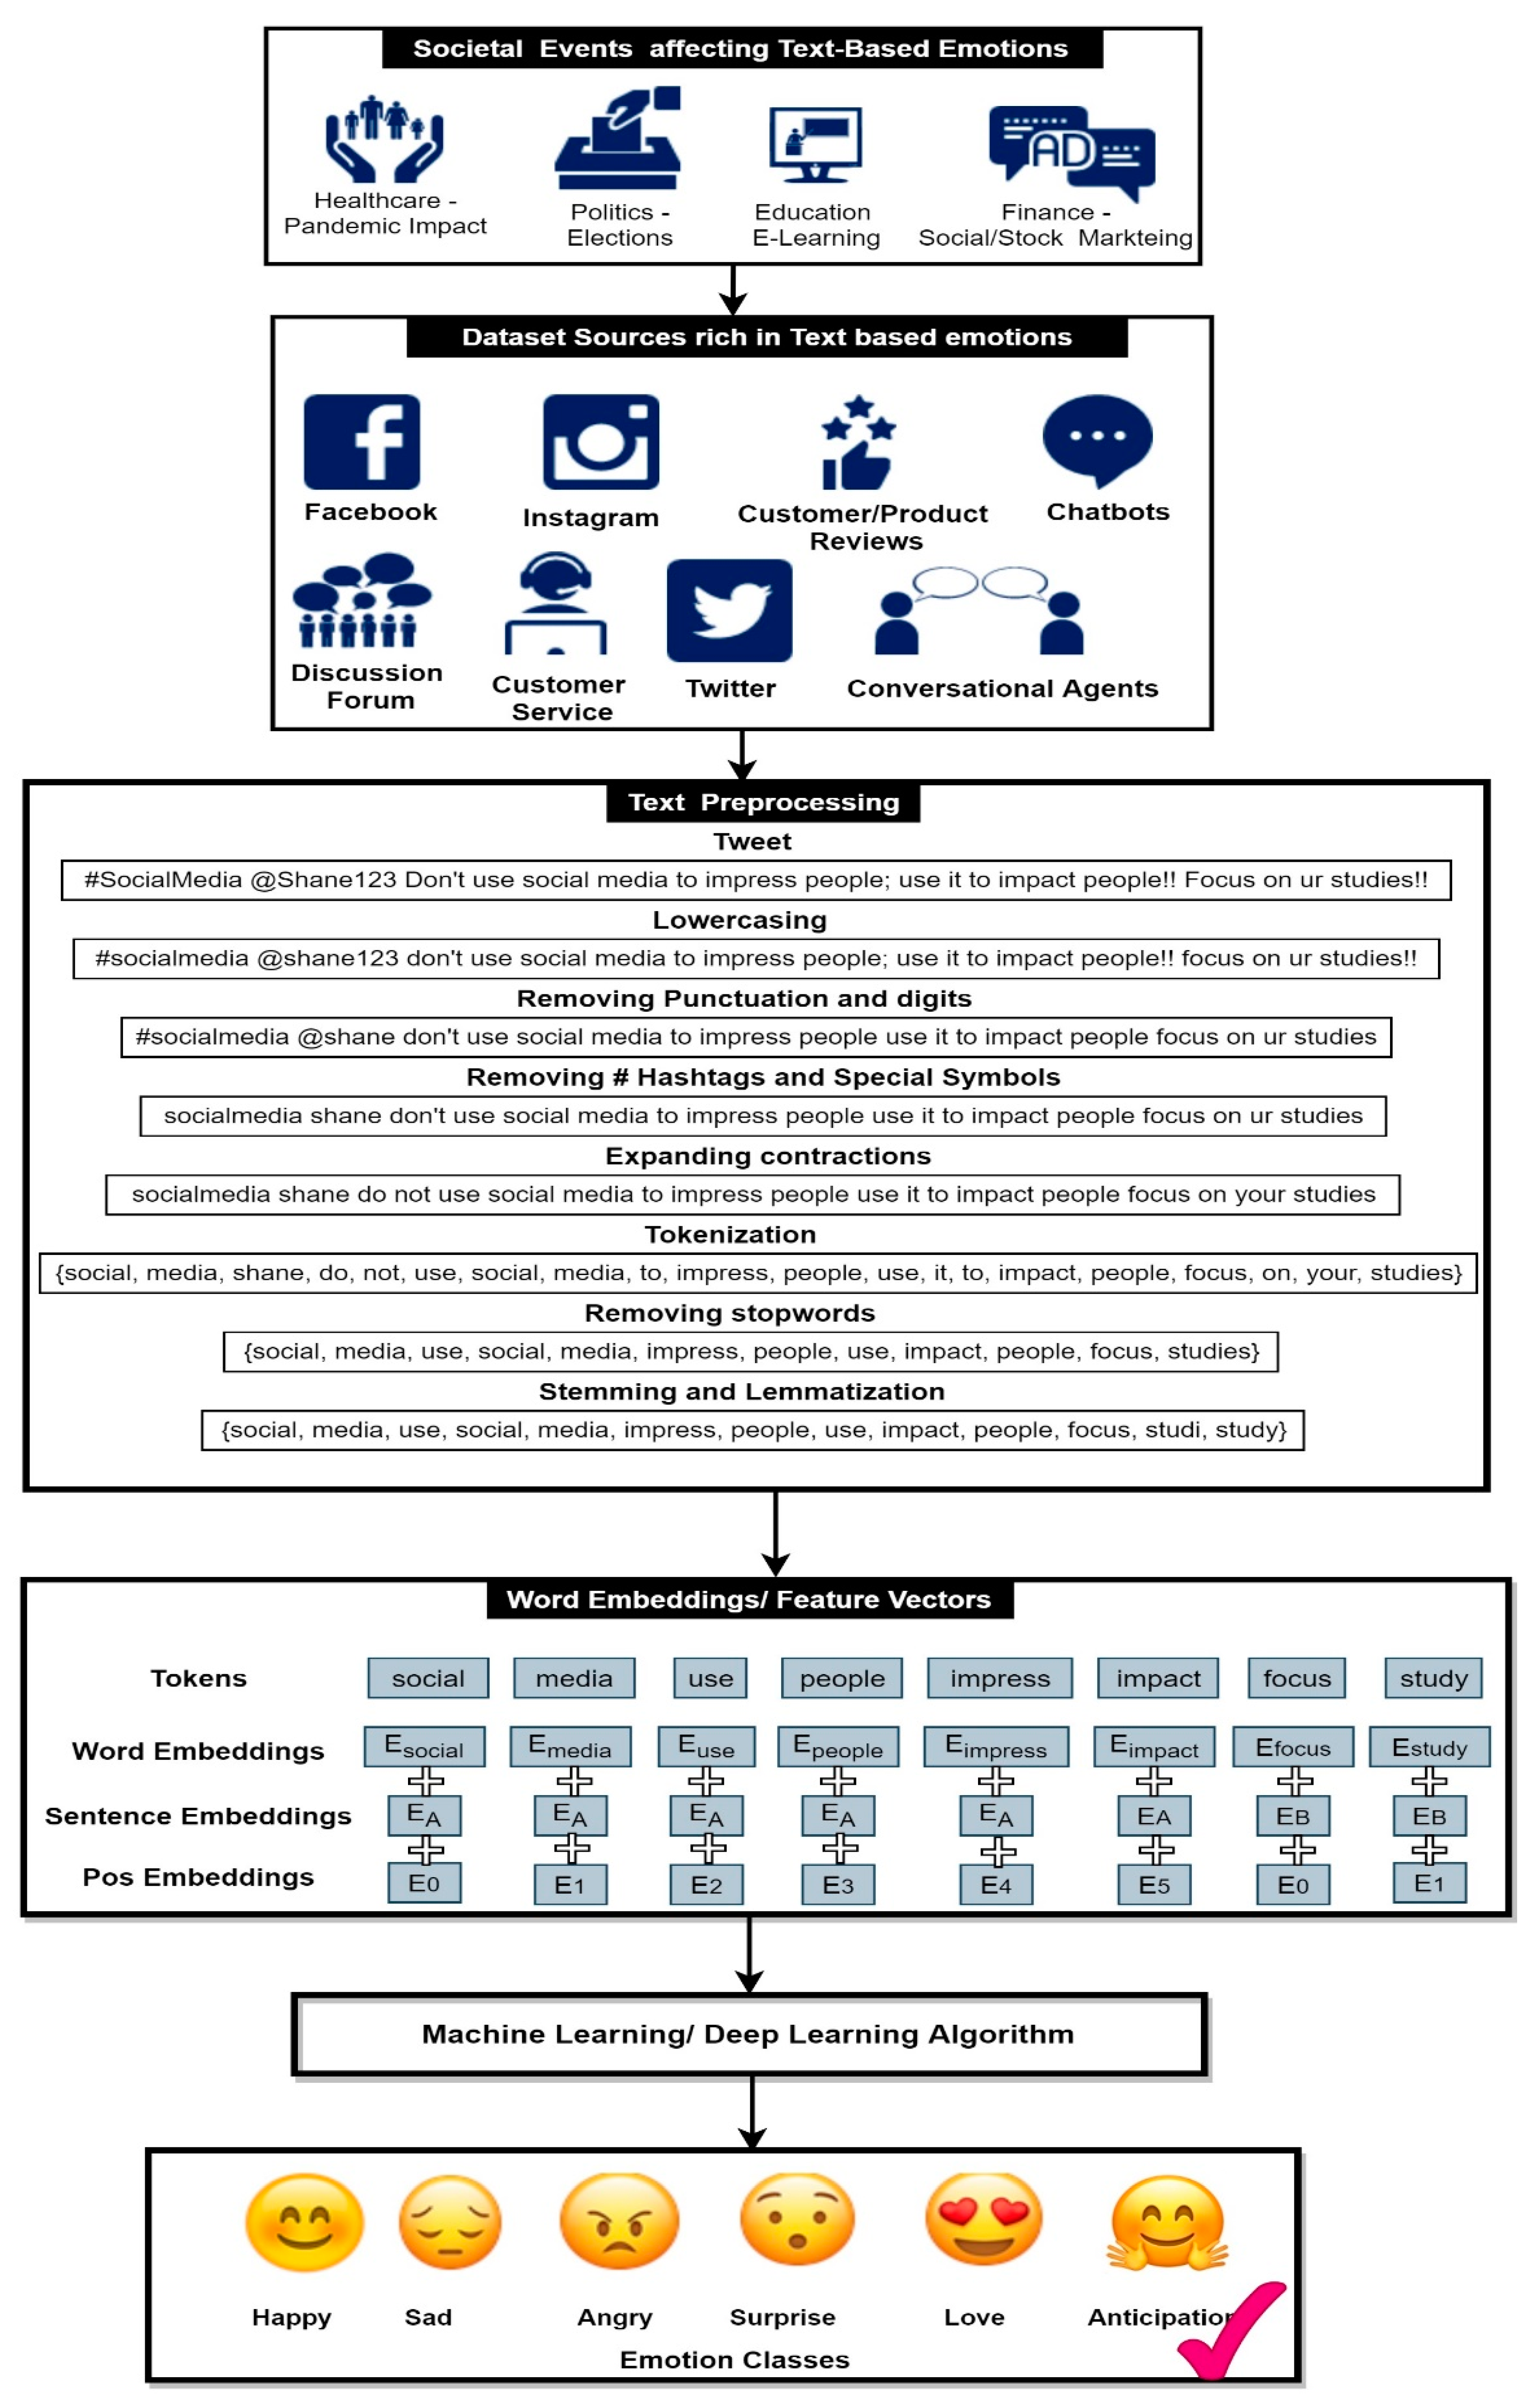
Text-Based Emotion Detection: Overview

Figure 1 shows the process flow of text-based emotion detection using artificial intelligence. In any text-based emotion detection system, initially, datasets are created by downloading the data from online social media using APIs like Twitter data can be downloaded by using Tweepy on Python. After data generation, text pre-processing steps involve making the text suitable for any machine or deep learning algorithm to process it. Text preprocessing involves tokenization, text cleaning, normalization, and creating feature vectors/embedding. Particularly, the text from social media, product/customer reviews, etc., consists of slang words, emojis, hashtags, HTML tags, short text, incomplete words, etc., which requires preprocessing. Next, machine or deep learning is applied to generated feature vectors. These feature vectors are fed into any machine learning algorithm or deep learning neural network where feature vectors with emotion labels are trained. Then the trained system is used to classify and predict the labels of unseen text. Here we take a brief look at the applications of text-based emotion detection. Table 1 shows the prominent application domains where text-based emotion detection with artificial intelligence is utilized.
Text-based emotion detection has spread into multiple application domains like product reviews, service reviews, online social media, conversational agents, etc. Customers provide their feedback about a product/service. This feedback is used by businesses to understand customer requirements, in order to increase customer support. With online social media, people express their thoughts and opinions on a particular societal event. Therefore, it becomes necessary to understand the impact of the societal event on people’s emotional states. Nowadays, conversational systems are widely used in various areas like healthcare, financial services, E-learning, entertainment, etc. The primary goals of a conversational agent are entertainment, social contact, and novelty interaction, emphasizing productivity. Therefore, it becomes necessary to study users’ emotions in the interaction and understand a user’s feelings to respond accordingly. One more important concern is security and privacy preservation as text and speech are users’ primary modes of communications. The authors of [9,10,11] discussed privacy persevering concepts with different contexts. From Table 1, the outcome can be inferred; text-based emotion detection is used in various applications domains with different machine learning and deep learning techniques.
The contributions of this paper are as given below:
  • To represent the qualitative analysis of the relevant research work which is carried out in the last 15 years.
  • To review the emotion modeling approaches for the text-based sources.
  • To survey existing AI approaches and publicly available datasets for text-based emotion detection.
  • To perform bibliometric analysis of text-based emotion detection using artificial intelligence by employing Scopus and web of science databases.
The rest of the paper is organized as follows: Section 2 provides a brief about qualitative analysis. It describes different emotion models, emotion detection approaches, and emotion databases. Section 3 presents the quantitative bibliometric analysis. Section 4 provides the summarizing comments on bibliometric analysis with challenges identified. Section 5 presents future work directions. Section 6 represents the conclusion.

2. Qualitative Analysis—Techniques Overview

In the field of emotion detection, the journey of emotions was started by Charles Darwin, the famous scientist, in 1872. After that, one of the important developments in the field was the affective computing theory by Rosalind W. Picard in 1997. Rosalind Picard stated that if humans want computers to be truly intelligent and interact naturally with humans, we must make computers capable to identify, interpret, and express emotions. Picard showed that the Turing test could show whether or not a machine can think, and the hidden Markov model was used to show transitions from one emotional state to another given a series of observations over time. It changed the direction in the field of text-based emotion detection. Psychologist Robert Plutchik [12] developed the wheel of emotions in 1980. He categorized eight elementary and primary emotions: trust, joy, surprise, fear, anticipation, sadness, disgust, anger, and also stated that there exists a polar opposite to each primary emotion. Plutchik’s wheel of emotions provided a great framework for understanding emotion and its intention. Ref. [13] gives a detailed outline of affecting computing with techniques discussed on emotion recognition from speech. In text-based emotion detection, researchers have proposed many emotion models to understand emotions and expressions behind emotions. Hence, emotion models play an important role in text-based emotion detection. The second significant part of text-based emotion detection is the approach/algorithms used to detect emotions from the text. Different algorithms are used to categorize the text into different emotion categories. Lastly, labeled emotion data is used by algorithms to classify the text; it plays are a very important role in text-based emotion detection. Now, people are becoming more reliant on computers to do daily tasks, emphasizing the need to enhance human–computer interactions. Therefore, it is essential to comprehend emotions expressed in text because the text is the primary mode of human–computer interactions in emails, chatbots, discussion forums, blogs, product/service reviews, and other social media platforms. Emotion models, various approaches, and datasets that play important roles in text-based emotion detection are further elaborated.

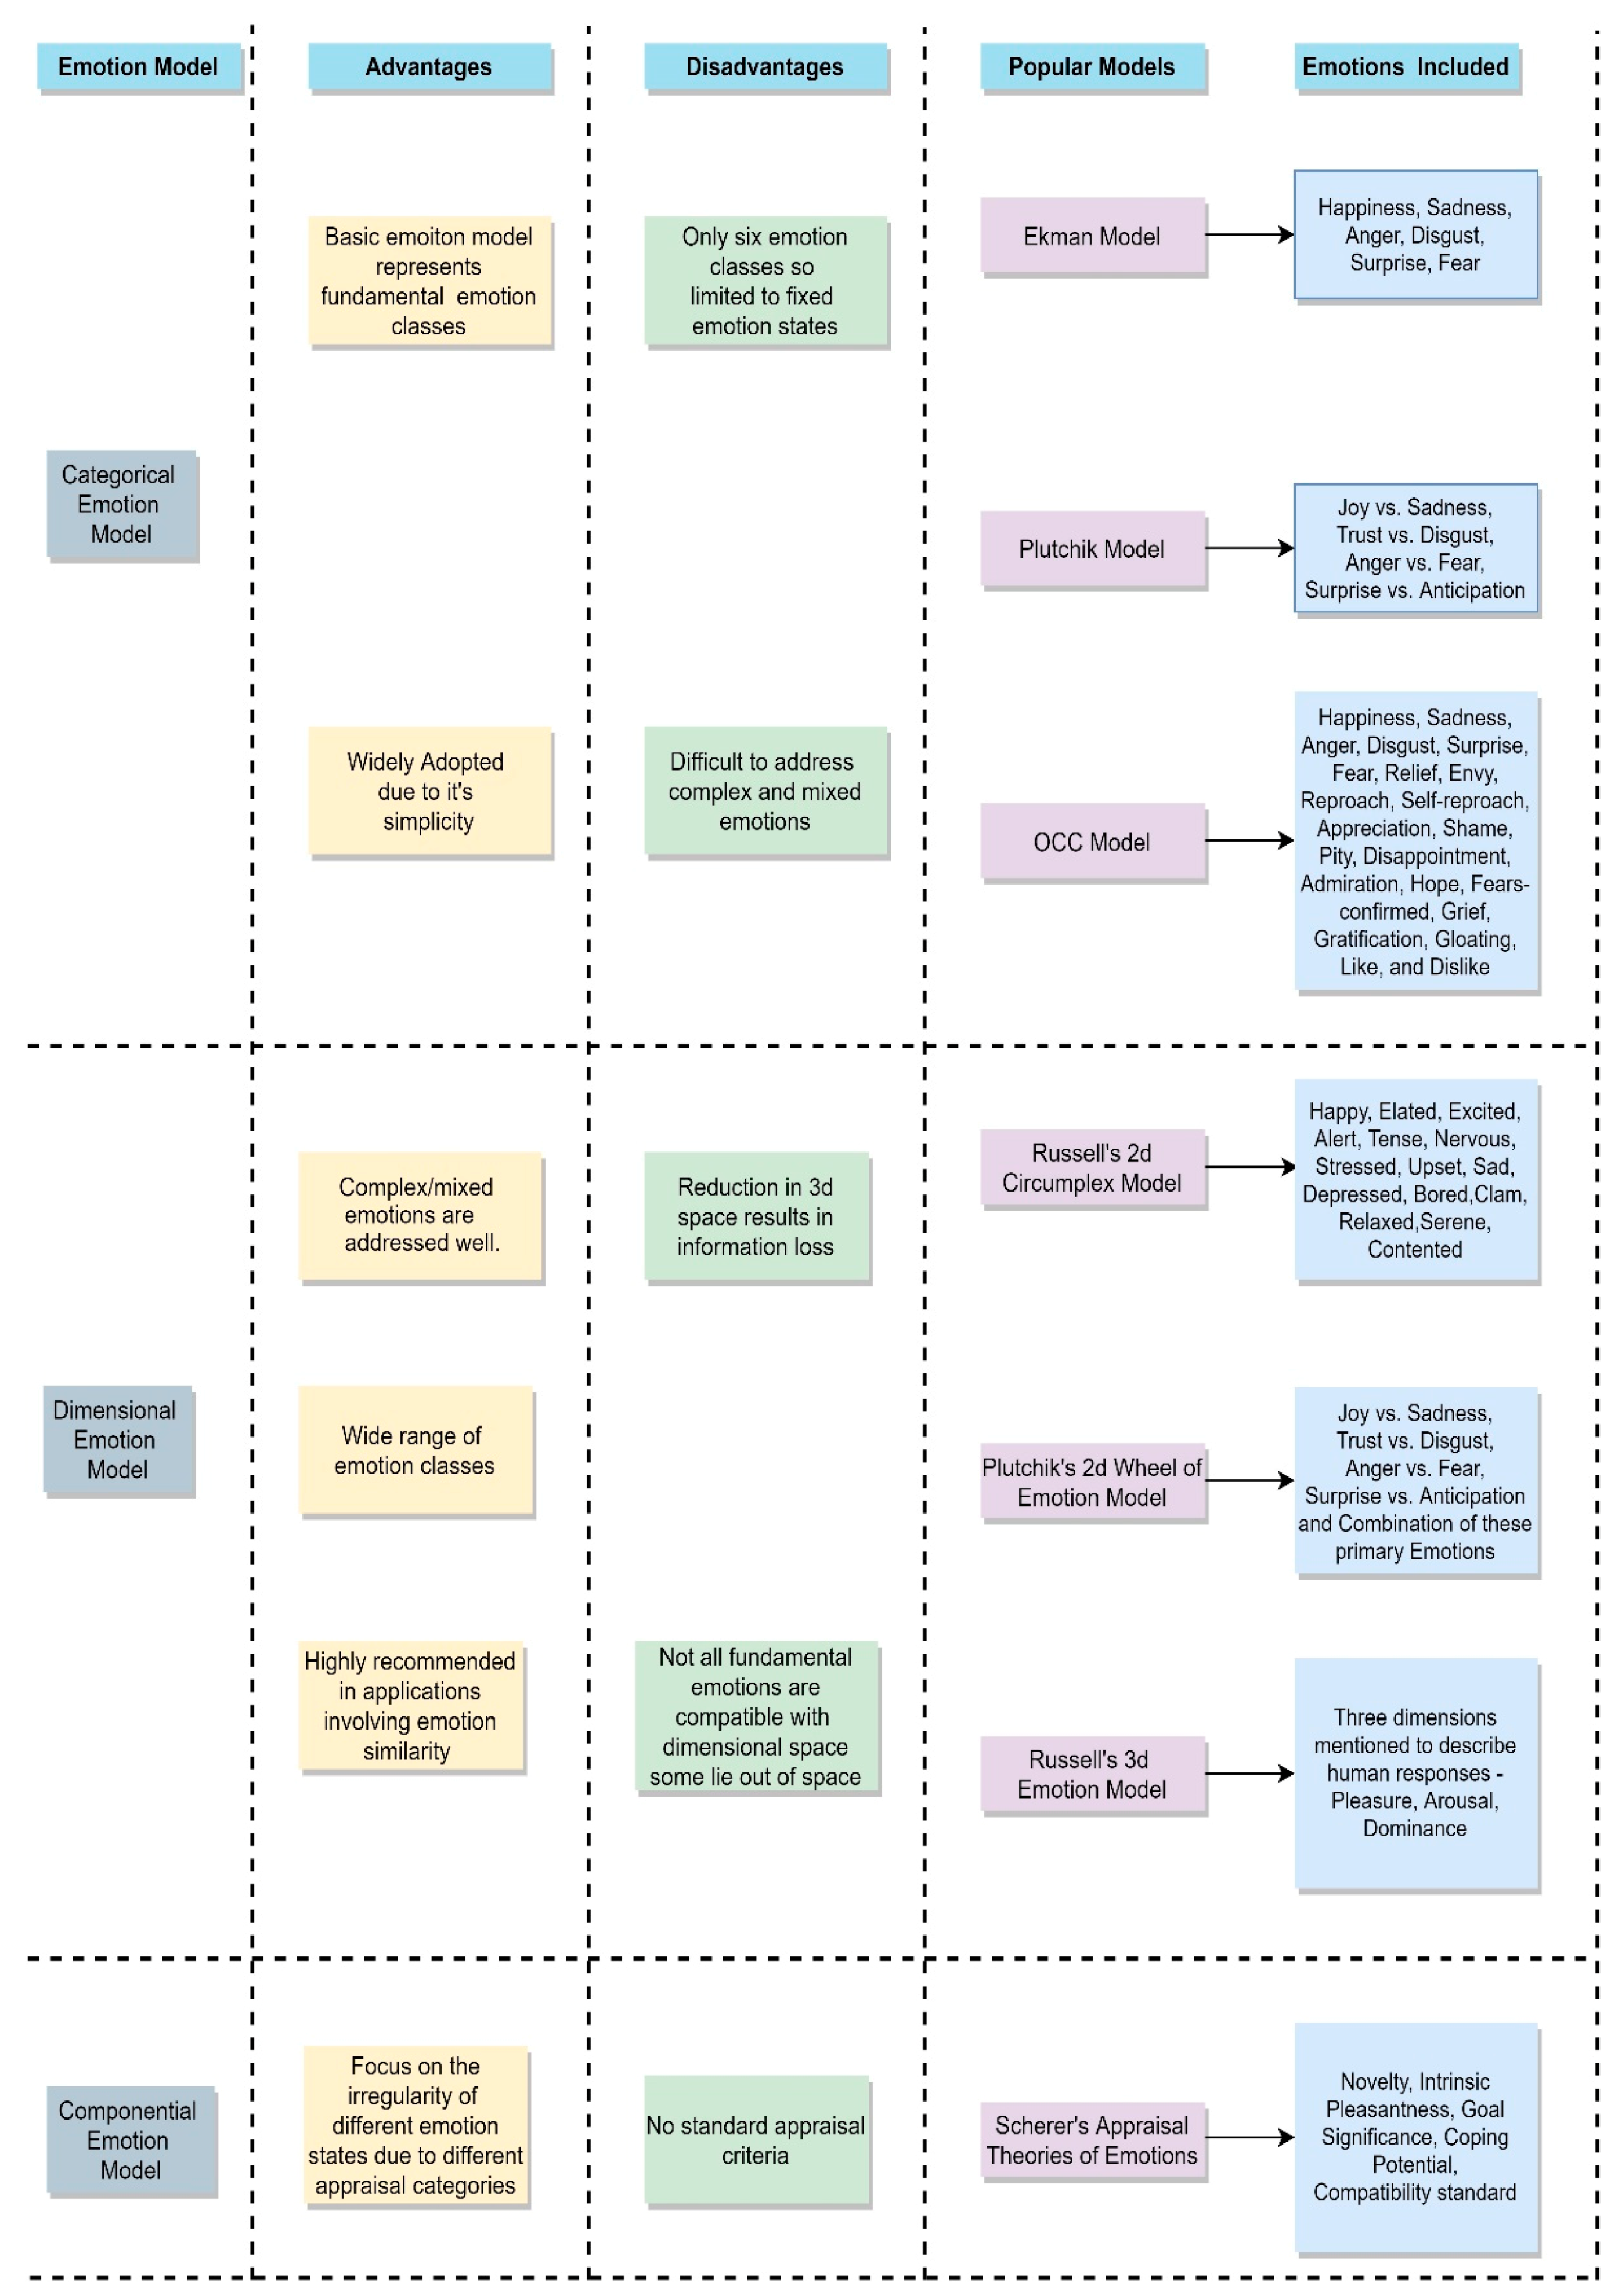
2.1. Emotion Models—Brief Overview

Emotion models are the foundation of the emotion detection process, as these models define the way of the representation of emotions. Different modeling approaches are used for emotion detection, such as the categorical emotion model, dimensional emotion model, and the componential emotion model.
(1) Categorical Emotion Model [12,13,14,15]—The categorical emotion model is also referred to as a discrete emotion model. The basic idea behind the categorical model is that a few significant emotions are universally accepted. These emotions are independent, that is, emotions are not related to each other. These basic emotions are sadness, happiness, fear, anger, disgust, surprise. The categorical model of emotions comprises placing emotions into distinctive categories or classes. Commonly used models in this category are the Robert Plutchik model, the Paul Ekman model, and the OCC Model. The Paul Ekman model [14] differentiates emotions based on six (6) basic classes. According to his theory, six (6) basic emotions initiate from distinct neural systems due to how a person perceives a situation. As a result, emotions are not dependent. These basic emotions are sadness, happiness, disgust, anger, surprise, and fear. However, other composite emotions, including greed, lust, shame, guilt, pride, and suchlike, could be produced in addition to these emotions. The Robert Plutchik model [12] assumes that few prime emotions appear in contrary sets, and their amalgam creates intricate emotions. Plutchik termed eight primary emotions joy vs. sadness, surprise vs. anticipation, anger vs. fear, and trust vs. disgust in opposite pairs. Plutchik states each emotion has varying degrees of intensity. The Orthony, Clore, and Collins (OCC) model [15] opposed the concept of “basic emotions”, as stated by Plutchik and Paul Ekman. Herein, OCC claimed that emotions arise from how human beings perceive events, which differ in terms of their intensity. OCC classified emotions into twenty-two (22) classes, adding sixteen (16) emotions—relief, reproach, envy, self-criticism, shame, appreciation, disappointment, pity, fears-confirmed, admiration, hope, grief, gratification, gloating, like, and dislike—to the emotions Paul Ekman suggested as basic, therefore covering a much broader representation of emotions. According to the researcher’s preference, any of the categorical emotional models can be employed to depict emotions. However, because of its larger number of classes, the OCC model has a broader emotional representation scope.
(2) Dimensional Emotion Model [12,16,17]—The dimensional emotion model states that emotions are dependent. They are associated with each other. Emotions are represented by a dimensional space in the dimensional emotion model viz. multidimensional and uni-dimensional and show how emotions are related to each other, focusing on how emotions are linked based on the event’s occurrence and its severity: high or low. This model comprises emotion variations in three dimensions.
  • Valence—This dimension states that emotion is positive or negative.
  • Arousal—This dimension states emotion is exited or apathetic.
  • Power—This dimension states degree of emotion.
Commonly used models in this category are Russell’s 2D circumplex model, Plutchik’s 2D wheel of emotions model, and Russell’s 3D model. Russell’s 2-dimensional circumplex of affect model [16] denotes emotions with arousal and valence on the vertical and horizontal axes, respectively in a two-dimensional circular space.
The model divides emotions into two categories: arousal and valence. Arousal classifies emotions through activations and deactivations, while valence distinguishes between unpleasantness and pleasantness. The circumplex model of affect asserts that emotions are associated rather than distinct. The horizontal axis of Plutchik’s 2-dimensional wheel of emotions [12] represents arousal, while the vertical axis represents valence. The emotions are displayed in homocentric circles on the wheel. The inward emotions are derivatives of the eight primary emotions, followed by the eight primary emotions, and ultimately, the outermost segments of the wheel are permutations of the basic emotions. The emotion wheel depicts in what way related emotions are arranged on the wheel based on their places. Russell and Mehrabian [17] proposed the three-dimensional emotion model that comprises arousal, pleasure or valence, and dominance as the third dimension. As assumed in the 2D model, arousal and valence describe how active/inactive or pleasant/unpleasant emotion is. Dominance is the third component that refers to how much control, experiencers had on their emotions.
(3) Componential Emotion Model [18]—The componential emotion model is also called an appraisal-based model. It is an extension of the dimensional emotion model. According to a componential emotion model, an individual may feel an emotion derived from an event. The outcome relies on the individual’s experience, expectations, and possibilities for action. The popular model in this category is appraisal theory. Emotions are observed through variations in motivation, cognition, motor, physiology, feelings, expressions, and reactions, among other things. “Appraisal theories” [18] state that a person can only experience an emotion if it is produced by an appraisal of an entity that directly impacts them and that the outcome is “based on the person’s goals, experience, and possibilities for action. Appraisal expressions might be found in the text to describe the events that lead to an emotion. An emotional outcome can best be predicted based on an individual’s assessment of the preceding object, event, or situation [19]. As a result, it is necessary to contextualize emotional responses, as the same situation might produce distinct affective responses, and inherent factors can produce identical responses.
Figure 2 shows the comparative analysis between different emotion models, including the advantages and disadvantages of each emotion model, popular emotion models in the category, and emotions included in each model. After selecting the emotion model, a significant step is to finalize the approach for text-based emotion detection.

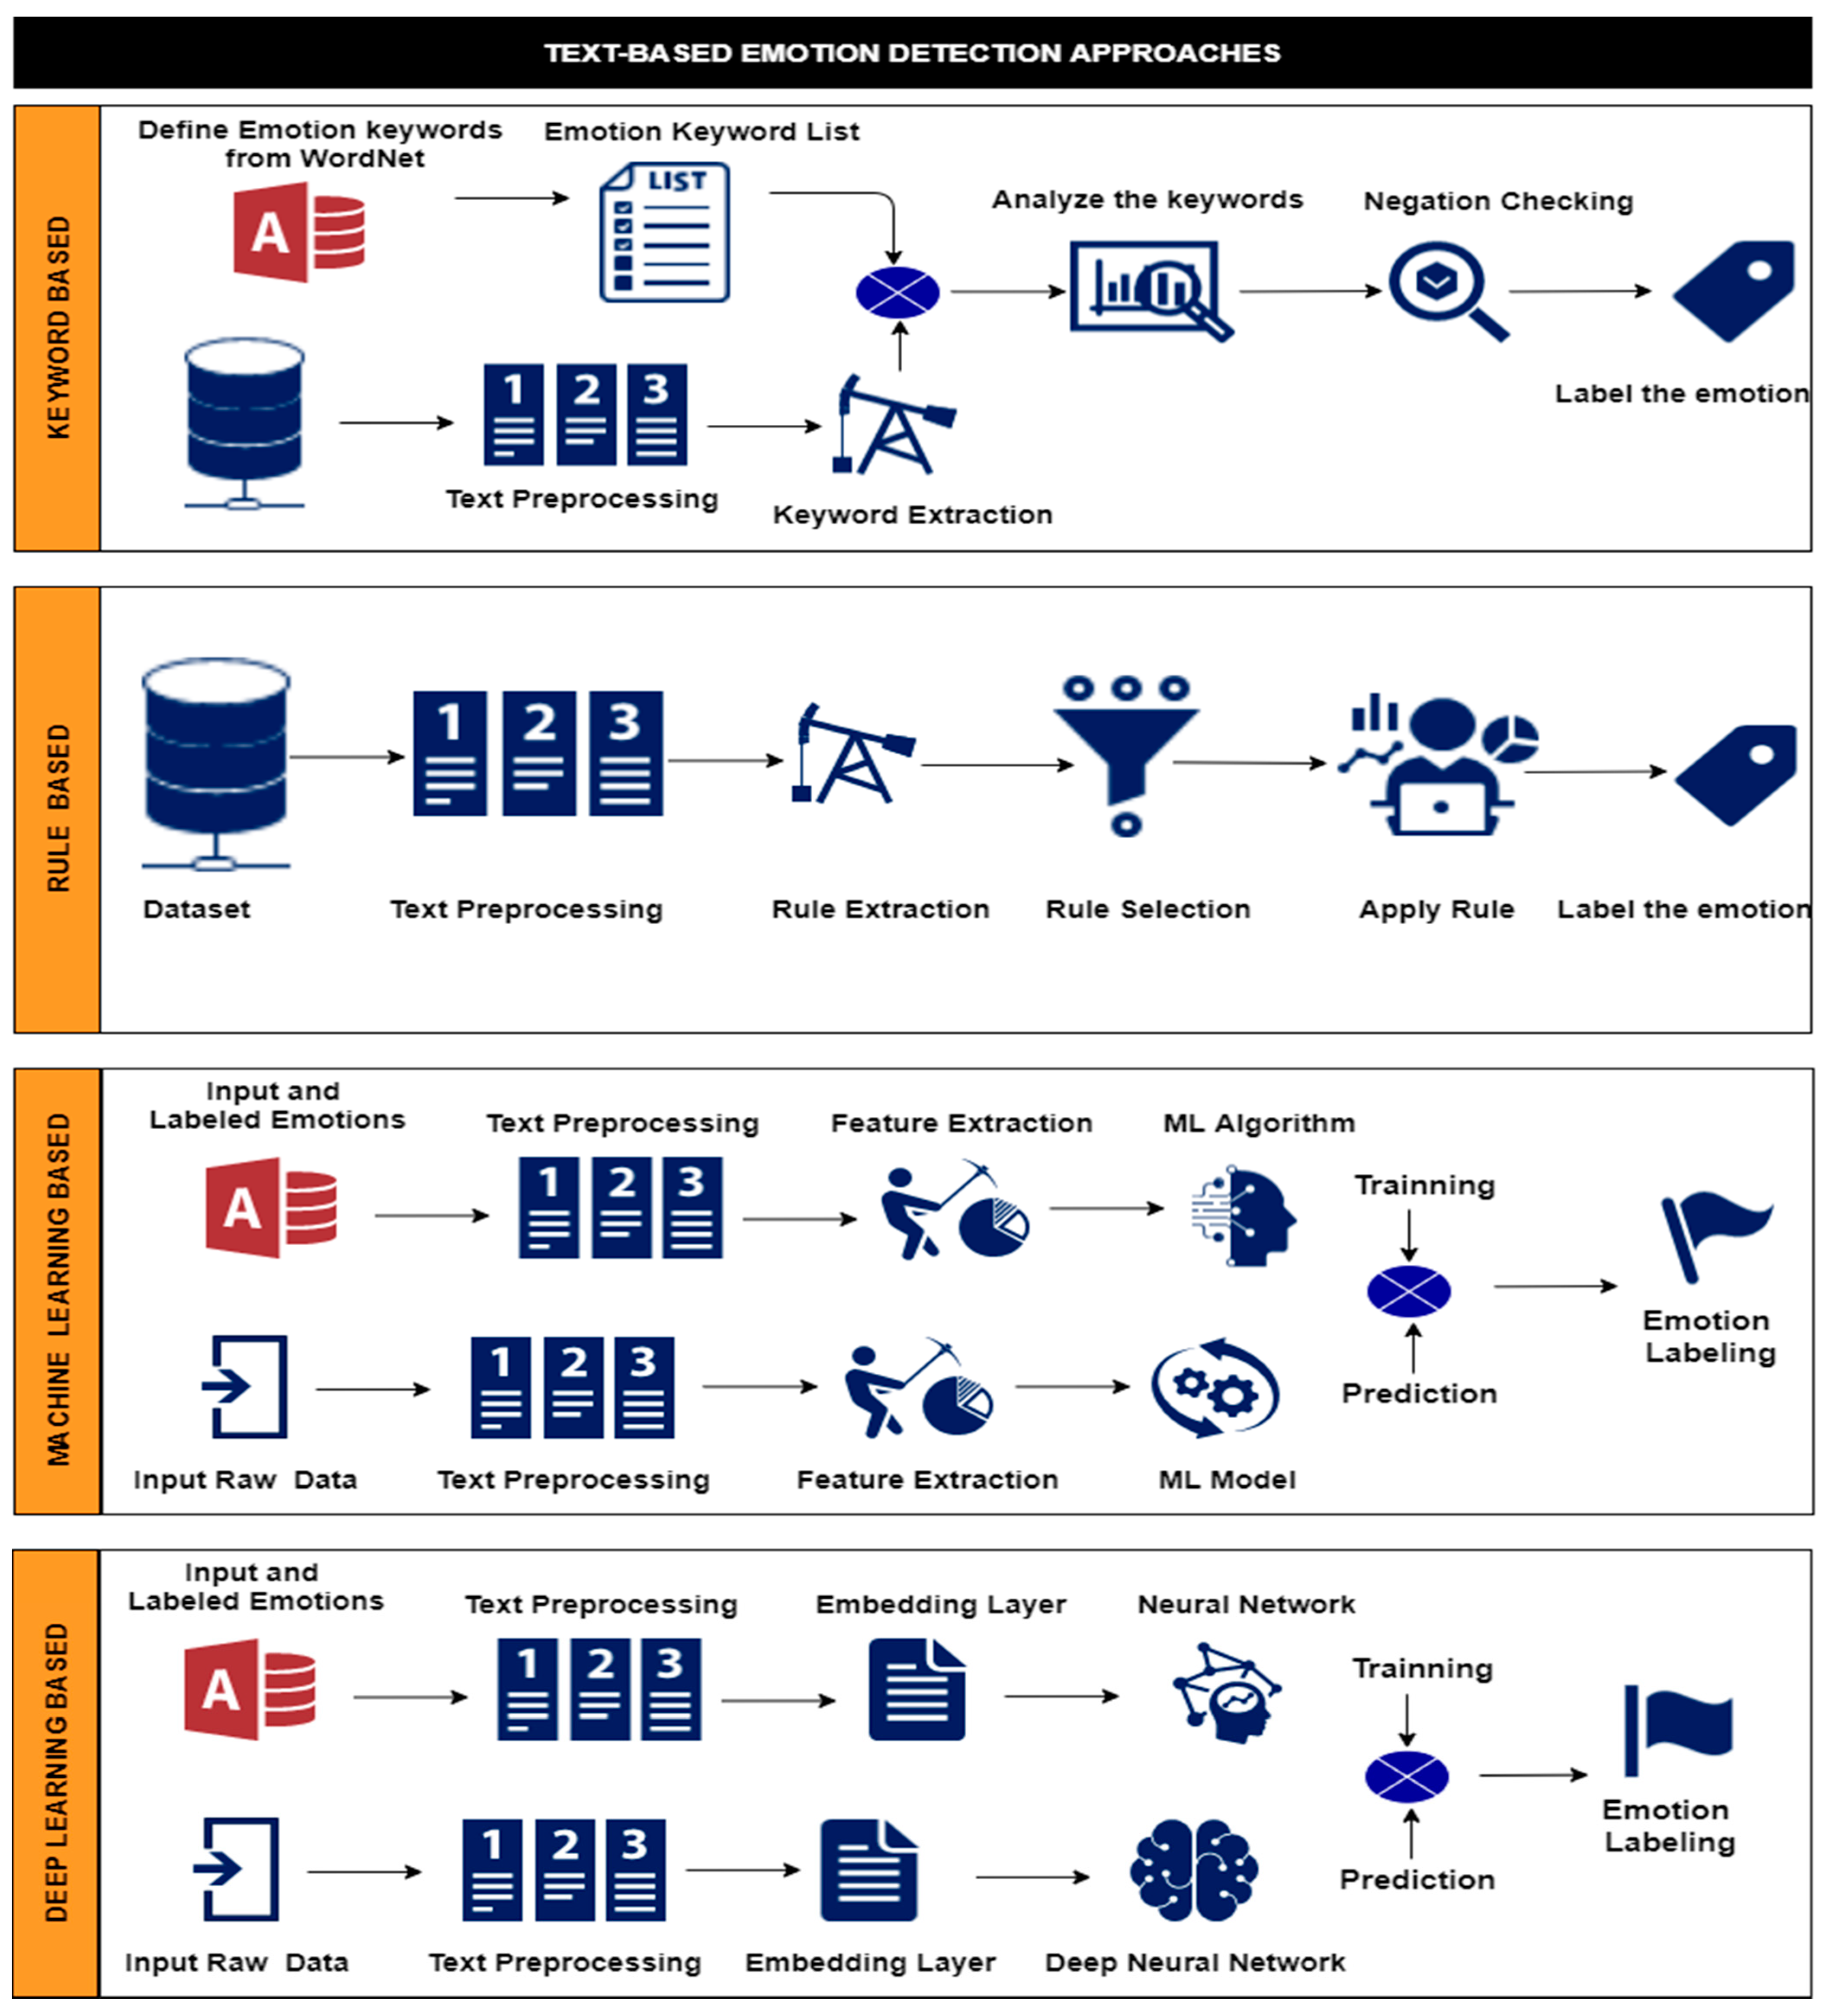
2.2. Text-Based Emotion Detection Approaches

The general approaches used for detecting emotions from the text are the keyword-based approach, rule-based approach, classical learning–based approach, and deep learning–based approach. Figure 3 shows the approaches used for text-based emotion detection.
(1) Keyword-based approach—A keyword-based approach is built on locating the occurrences of a keyword in a given text and matching with the labels stored in the dataset. In this approach, the emotion keyword list is initially defined from standard lexical databases such as WordNet-Affect [20] or WordNet [21]. Next, preprocessing is carried out on the dataset. After that, keyword spotting is done between emotion keywords from the text and predefined keyword lists. Then keyword intensity of emotion is analyzed. Afterward, negation checking is performed to identify negation cues and the scope of the cue, and finally, the emotion label is determined. In our analysis, we surveyed [22,23,24,25], which are centered on a keyword-based approach. To have a better understanding of how this approach works, we examined [22]. In [22], J. Tao explained the keyword-based emotion recognition approach. Each sentence is considered as a combination of content words or Emotion Function Word (EFW). EFWs can take three forms: emotion keyword, modifier word, and metaphor word. Emotion keywords can take six emotion labels from Ekman’s emotion model and assigned specific weights. Modifier words consist of words that emphasize strong or weak emotions. Metaphor words show spontaneous expressions or personal characteristics. This approach first applies POS tagger to each sentence and check EFW then assign emotional ratings to EFW. The next step is to give weights to emotion keywords and constructs a link to EFW. Then, scores across all sentences are summed. To determine an overall score, it goes through a fuzzy logic process. In the last step, sentences are assigned suitable emotion labels according to the overall score. Figure 3 outlines the keyword-based approach.
(2) Rule-based approach—The rule-based approach defines logical and grammatical rules to detect emotions from the text. Initially, text preprocessing is done on the emotion dataset. Then, rules for emotion recognition are mined from text using linguistic and statistic theories. In this, probabilistic affinity or lexical affinity is attached to each word. Then, the best of the rules are selected. Lastly, the selected rules are used for emotion detection to detect emotion labels. Refs. [26,27,28,29] surveyed in the rule-based approach. Lee et al. [26] suggested a rule-based approach for identifying emotion cause events. Lee et al. used the Chinese microblogging website—Sina Weibo—as a data corpus. The expressly communicated thoughts or experiences that generate a related emotion are referred to as cause events. Initially, a labeled corpus is constructed based on emotional causes. Then, the grouping of cause events and the place of cause events pertaining to emotional experiences are determined. Then, keywords are defined for every emotion category. Following that, seven groups of linguistic clues are found, along with two groups of linguistic rules to detect emotion causes are developed. The authors constructed 15 linguistic rules to detect emotions. Finally, a system that identifies the causes of emotions is constructed based on linguistic criteria. Figure 3 shows a general overview of the rule-based approach.
(3) Machine Learning/Classical Learning–based Approach—Figure 3 outlines the machine/classical learning–based approach. The machine learning–based approach enables systems to learn and develop as a result of their experiences automatically. Machine learning algorithms classify the text into different emotion classes. There are two categories of machine learning algorithms—supervised or unsupervised. In most of the reviewed papers, supervised machine learning algorithms are widely used. This approach generally starts with the text preprocessing step. Then the useful features are extracted from the text, and only features are selected with the most information gain. After that, with the given feature set and emotion labels, the system is trained. Lastly, the trained system is used to classify the emotion from the unseen text, termed prediction. The authors surveyed Refs. [30,31,32,33,34,35], which used the machine learning–based approach. To better understand how this approach works, we examined [32], where Bruyne et al. presented an emotion classification system for English tweets. Initially, text preprocessing has performed using word and sentence tokenization, stemming, lowercasing, and POS-tagging. Next, feature extraction is accomplished using n-gram features, lexicon features, and various semantic and syntactic features. Then to solve a multi-class multi-label problem, an ensemble of eleven binary classifiers was created for each possible emotion class, anger, anticipation, disgust, trust, fear, love, joy, pessimism, optimism, surprise, and sadness where each model gets the previous models’ predictions as supplementary features. To create a multi-label representation of the predictions, the predicted labels are concatenated.
(4) Deep Learning–based approach—deep learning is a variant of machine learning in artificial intelligence with networks capable of unsupervised learning from unstructured or unlabeled data. Figure 3 outlines the deep learning–based approach. This approach enables neural networks to learn complex concepts by constructing them from simpler ones. Initial preprocessing is carried out on the dataset. After that, the embedding layer is built, where tokens are represented in the form of numbers. Then, depending on the number of emotion labels, these feature vectors are input into one or more Deep Neural Network layers. Patterns are learned from data and used to predict the labels by using classification. References [8,19,36,37,38,39,40,41,42,43] surveyed the deep learning–based approach. To have a better understanding of how this approach works, we examined Ref. [41]. A deep learning system for multi-label emotion identification problems for micro-blogs was proposed by Rathnayaka et al. [41]. For preprocessing, they used the Ekphrasis tool. Word normalization, tokenization, spell correction, and segmentation are all performed by Ekphrasis. GloVe, a pre-trained word embedding algorithm, was used. The features from the embedding layer are provided to two Bidirectional–Gated recurrent unit layers. After that, the output of the first Bi-GRU layer is given to the first attention layer. The output combined from the first and second Bi-GRU and embedding layer is given to the second attention layer. Then, combined, two attention layers are provided to a DNN with a sigmoid activation function for classification. The authors used 11 emotion categories to classify emotions: anger, anticipation, disgust, trust, fear, love, joy, pessimism, optimism, surprise, and sadness.
In Table 2, a qualitative analysis of the relevant literature is shown. This table highlights the datasets, algorithm/technique/methods, objectives, advantages, disadvantages, application domain, evaluation performance, and emotions detected, that have been surveyed in different emotion-detection approaches. The table is arranged according to the application domain. In our qualitative analysis, it has been discovered that social media is the application area [43] where prominent research has been done in text-based emotion detection, with little research on conversational systems (chatbots) public monitoring. It has also been discovered that the categorical emotion model is the most used by researchers in text-based emotion detection, while the componential emotion model has been less preferred. The major emotions detected in all the application domains are happiness, anger, fear, surprise, disgust, sadness. Machine learning and deep learning–based approaches performed well on the different evaluation measures like accuracy and precision.

2.3. Dataset/Corpora

Following the selection of a model to classify the emotions, appropriate data acquisition is the next important step in text-based emotion detection. In emotion detection from text, researchers either create their datasets according to study or use available datasets. Datasets available for text-based emotion detection research are labeled or annotated customized datasets. These annotated datasets are created with the help of expert human annotators from respective fields. Researchers have preferred existing datasets or created their datasets according to experiments’ requirements to specific application domains. Most of the datasets are easily available and can be downloaded freely. Most datasets are multi-labeled datasets that are suitable for emotion detection from text. There are few structured datasets with annotations designed for text-based emotion detection, publicly available for research purposes. Information for many datasets is collected from online social media platforms such as Facebook, Twitter, Reddit, etc. Data collected from online social media has been in the form of tweets, posts, comments, while some datasets are built from Google news, newspapers, essays, letters, travel guides, conversations, story tales, etc. Publicly available datasets used for text-based emotions from different fields are listed in Table 3.

3. Quantitative Analysis—Bibliometric Contributions Analysis

Bibliometric analysis is referred to as a statistical examination of published scientific journals, books, or papers. This analysis provides insights into the contribution of various countries, institutes, authors, and journals in the research area. A detailed study of existing literature in this field will help to evaluate the quality of research work with its merits and demerits and provides support to researchers in shaping and enhancing further research actions. The applicability of bibliometric analysis differs with the factors that are being analyzed and methods being used in various subject areas like those that we surveyed in the manufacturing field [53] and in the medical field [54]. The aim is to provide new ideas and ongoing development in the area by visually reflecting and mapping the literature on text-based emotion detection using artificial intelligence over the past 16 years in terms of augmentation, potency, social, and abstract structure. First, this survey depicts research using artificial intelligence with citation data and publication data between 2005 and 2021 (augmentation). Second, this study finds the research areas and the popular journals impacting the field’s growth, along with the important authors and prominent countries in text-based emotion detection using artificial intelligence (potency). Third, the study indicates the collaborative connection between the authors and the countries (social structure). Fourth, the study exposes the current focus (abstract structure) of the research on text-based emotion detection using artificial intelligence over the past years.

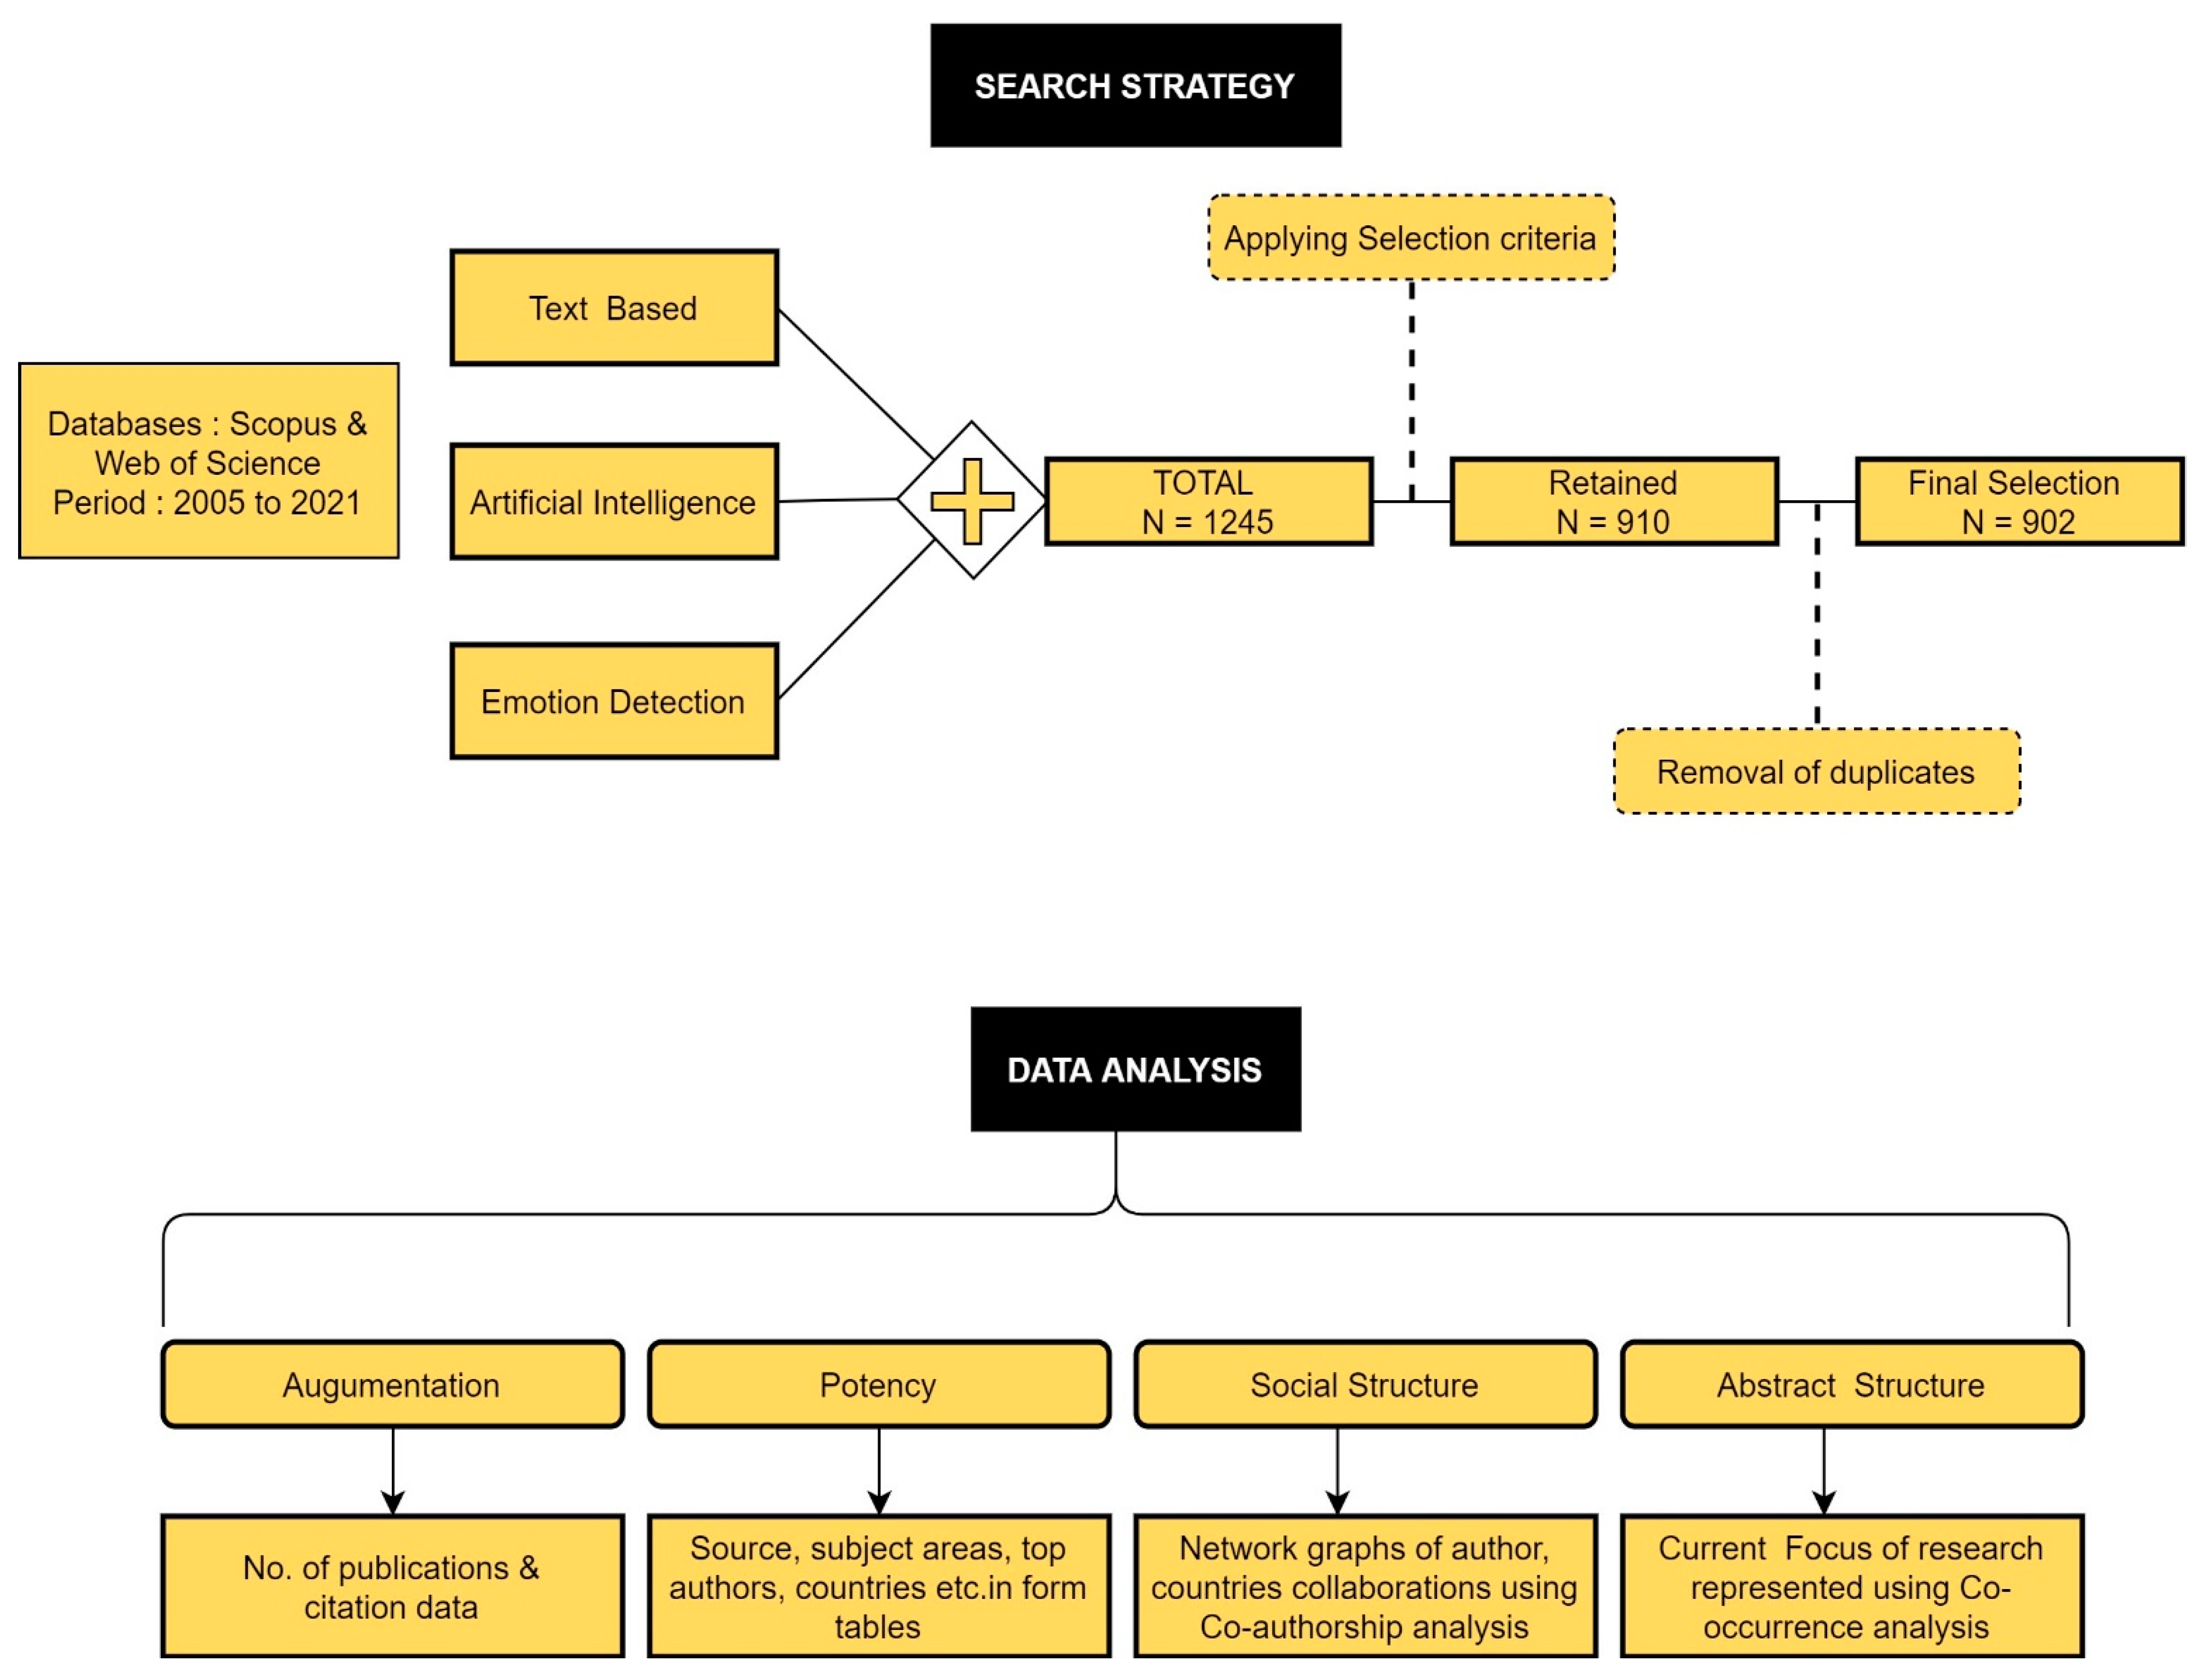
3.1. Search Strategy

For this analysis, two parallel searches were performed on Elsevier’s Scopus and Clarivate Analytics’ Web of Science databases. All the searches and document retrieval were performed on the last week of March 2021. The first search targeted text-based and consists of only one search keyword in focus: [“text-based”]. The subsequent search was aimed to get research focusing on artificial intelligence. Following keywords included in search in the topic field [“artificial intelligence,” “deep learning,” “machine learning,” “natural language processing”]. In the next search, emotion detection keywords related to text-based were inputted. The following keywords included in the title field: [“emotion detection,” “sentiment analysis,” “emotion analysis,” “emotion recognition,” “chatbots,” “conversational agents,” “social media,” “Twitter,” “Facebook,” Reddit,” “Instagram,” “reviews”].
The OR Boolean operator is used between keywords while searching to obtain a greater number of appropriate documents. Additionally, in Web of Science searches, asterisks are used as wildcards. Web of Science permits you to use asterisks as a wildcard in all the searches that accept words and groups of words. All of the searches were restricted to journal articles and reviews that were written between 2005 and 2021. The English language was implemented in the search. This search approach retrieved a total of 910 documents: 827 documents from Scopus and 83 from Web of Science. After extracting the duplicates, a total of 902 research papers were chosen and included in the paper. Each document’s publication title, publication year, Journal/Source title, the number of citations are considered for analysis. Thus, the abstract, the title, the keywords, and cited references were retrieved. Figure 4 shows the methodological outline of the search strategy and data analysis approach used to retrieve the Scopus and Web of Science documents.

3.2. Data Analysis Procedure

The documents retrieved in the earlier search were examined using illustrative and bibliometric methods to provide a general outline of the progress going in text-based emotion detection using artificial intelligence. To describe the development curve in the research on text-based emotion detection using artificial intelligence, publication count and citations per year were obtained. The tables were created to describe the summary of the research in terms of subject areas, journals/source titles, publication types, countries, funding agencies contributing to the growth of the research field. Bibliometric analysis is performed in VOS viewer and Gephi software to study and visually illustrate the social and abstract formation of the field. VOS viewer is a free software for visualizing and exploring bibliometric maps [55]. In VOS viewer, the types of analysis are co-occurrence, co-authorship, citations, co-citations, bibliographic coupling, and units of analysis are authors, organizations, keywords, documents sources, countries, or references depending on the attention of the analysis.
The units of analysis are often depicted in the graphs as circular nodes or rectangular frames. The node/frame size represents the number of publications, authors, or keywords, etc. A link, which is a connection or a relation between the two nodes, is called an Edge. An Edge may represent bibliographic coupling links between publications, co-authorship links between authors, and co-occurrence links between keyword nodes, and each edge is a strength of that relationship. A cluster is a set of nodes included in a map relating to each other, and the color of each node denotes to which cluster a node belongs. The software constructs the bibliometric maps in three steps using a distance-based method [56]. The software approximates the differences between the nodes in the first stage. Then it creates a two-dimensional map in the second step, with the distance between nodes reflecting their similarity. The VOS viewer groups closely related nodes into clusters in the third stage [56]. Co-authorship and bibliographic coupling analyses were done to survey the social structure of research on text-based emotion detection using artificial intelligence. The units of analysis considered authors, organizations, countries/territories, documents, and sources. Each node in the map represents one of the units of analysis, and the nodes’ relationships are shown by the edges linking them. The clusters correspond to collaboration networks that exist between groups of authors or countries. Finally, the field’s abstract structure was discovered via a keyword co-occurrence analysis. The unit of analysis considered the keywords of the authors. If two keywords appear in the publication, their co-occurrence link is stronger. Clusters of co-occurring keywords correspond to the current focus of the research on text-based emotion detection using artificial intelligence over the past 15 years. The second bibliometric software Gephi is a free and open-source software for analyzing and visualizing large network graphs. A network in Gephi comprises two parts: a list of the vertices/nodes that make up the network and a list of the edges (interactions between nodes). Two attributes are attached to the nodes: a label and a numeric attribute. The color of the nodes is determined by attribute. In addition, the size of a node is determined by its “Degree Centrality” value (its number of connections). Centrality is an essential metric to analyze the position of a node in a network.

3.3. Data Collection

This bibliometric analysis utilized Elsevier’s Scopus and Clarivate Analytics’ Web of Science (WoS) databases for document retrieval. First, the search started with the “text-based” keyword introduced in the WoS and Scopus. Afterward, the results were narrowed down by the specific selection criteria and years. Table 4 shows the list of keywords used for document retrieval from Scopus and Web of Science. We initially retrieved search query results from Scopus, which were 1011, and that from Web of Science were 234. After applying some selection criteria—we considered papers written only in English; considered only conference papers, articles, reviews as document type; limited our search from 2005 to 2021; and restricted research areas to computer science, engineering, psychology, social sciences, and decision sciences—we obtained 827 publications from Scopus and 83 publications from Web of Science as a result, after applying the selection criteria. Then, removing duplicates (08) from both databases, we had 902 publications for analysis. The final query was given as:
“Text-based” AND “Artificial Intelligence” OR “Deep Learning” OR “Machine Learning” OR “Natural Language Processing” AND “Emotion Detection” OR “Sentiment analysis” OR “Emotion Analysis” OR “Emotion Recognition” OR “Chatbots” OR “Conversational agents” OR “Social Media” OR “Twitter” OR “Facebook,” “Reddit” OR “Instagram” OR “Reviews.”

3.3.1. Initial Search Results

Elsevier’s Scopus and Clarivate Analytics’ Web of Science (WoS) database platforms were used for retrieving the documents for the analysis. On the above-specified query search, 1011 research publications were retrieved from Scopus, and 324 research publications were retrieved from Web of Science. Scopus’s main publications written in the English language were 827, and on Web of Science, publications written in the English language were 83 in number. We excluded publications written in different languages, as specified in Table 5.
In this survey, we considered only articles published in journals, conference proceedings, and reviews from the Scopus database and Web of Science database. We excluded book chapters, books, notes, etc. Detailed information is provided in Table 6.

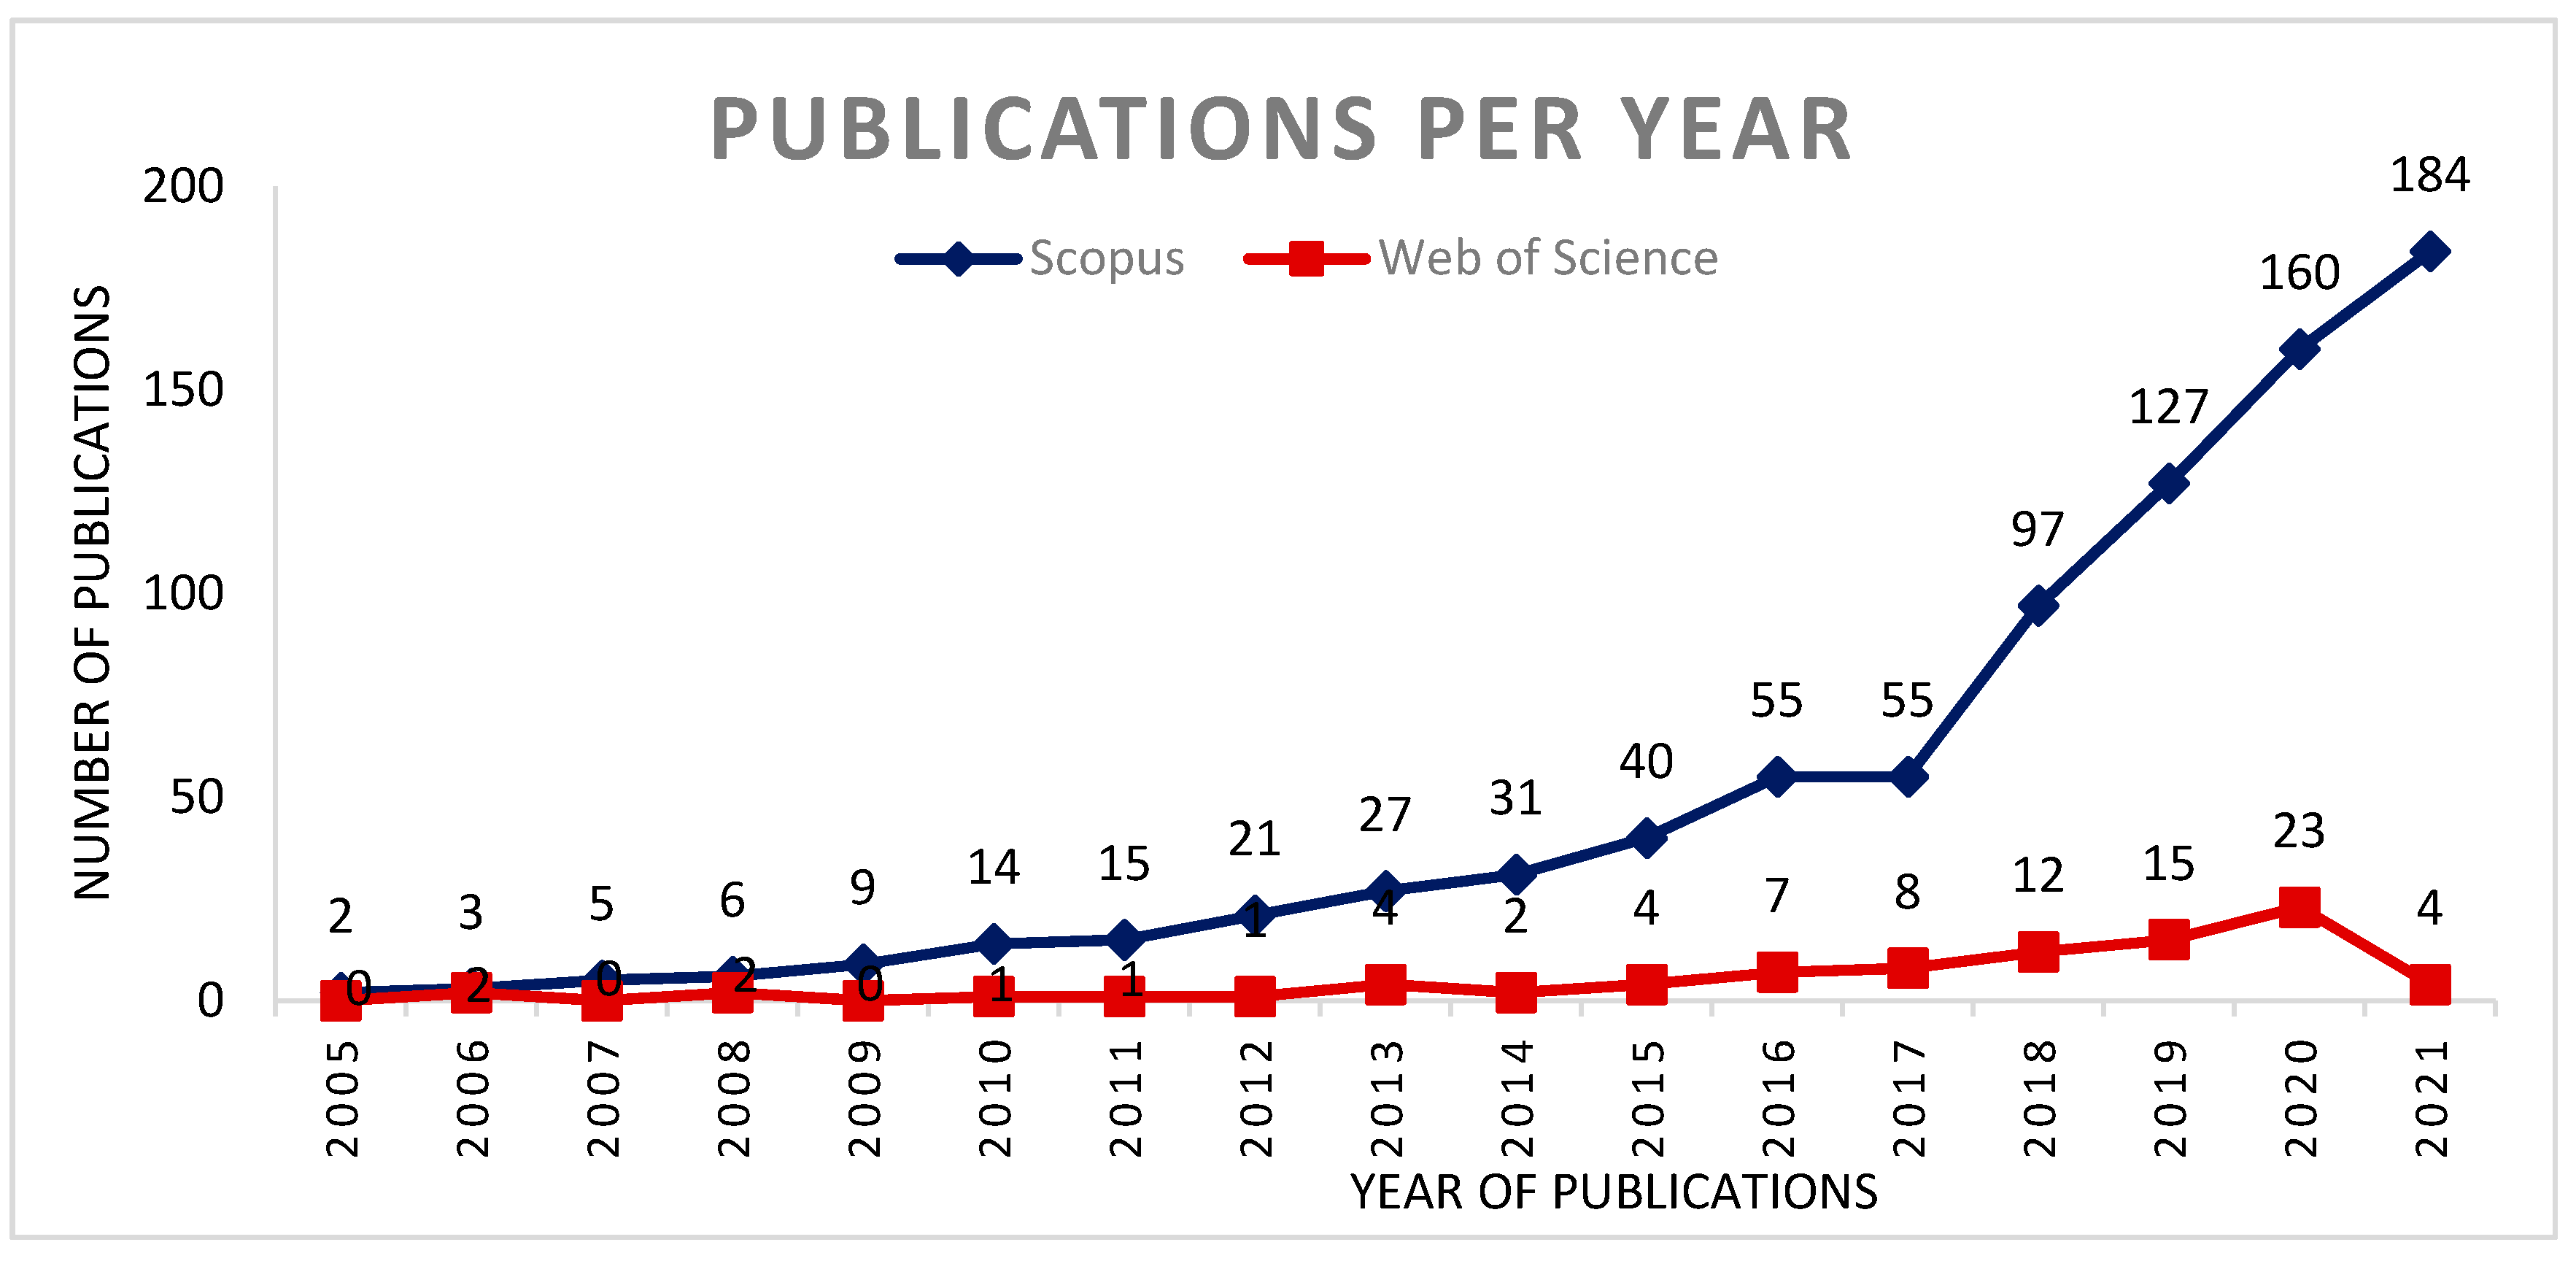
3.3.2. Analysis Based on Yearly Publication Distribution

In exploratory data analysis, publication count per year is analyzed for both Scopus and Web of Science. For publication years from 2005 to 2021, 16 years are taken into consideration. By analyzing the data, we can see text-based emotion detection. This area has become the center of attention for many researchers after 2017. It has been gradually increasing year by year. The publication count reveals rapid growth in 2020, with 160 publications retrieved from Scopus and 23 publications retrieved from Web of Science. More papers are expected to be retrieved in the future. Figure 5 and Table 7 show yearly publications.

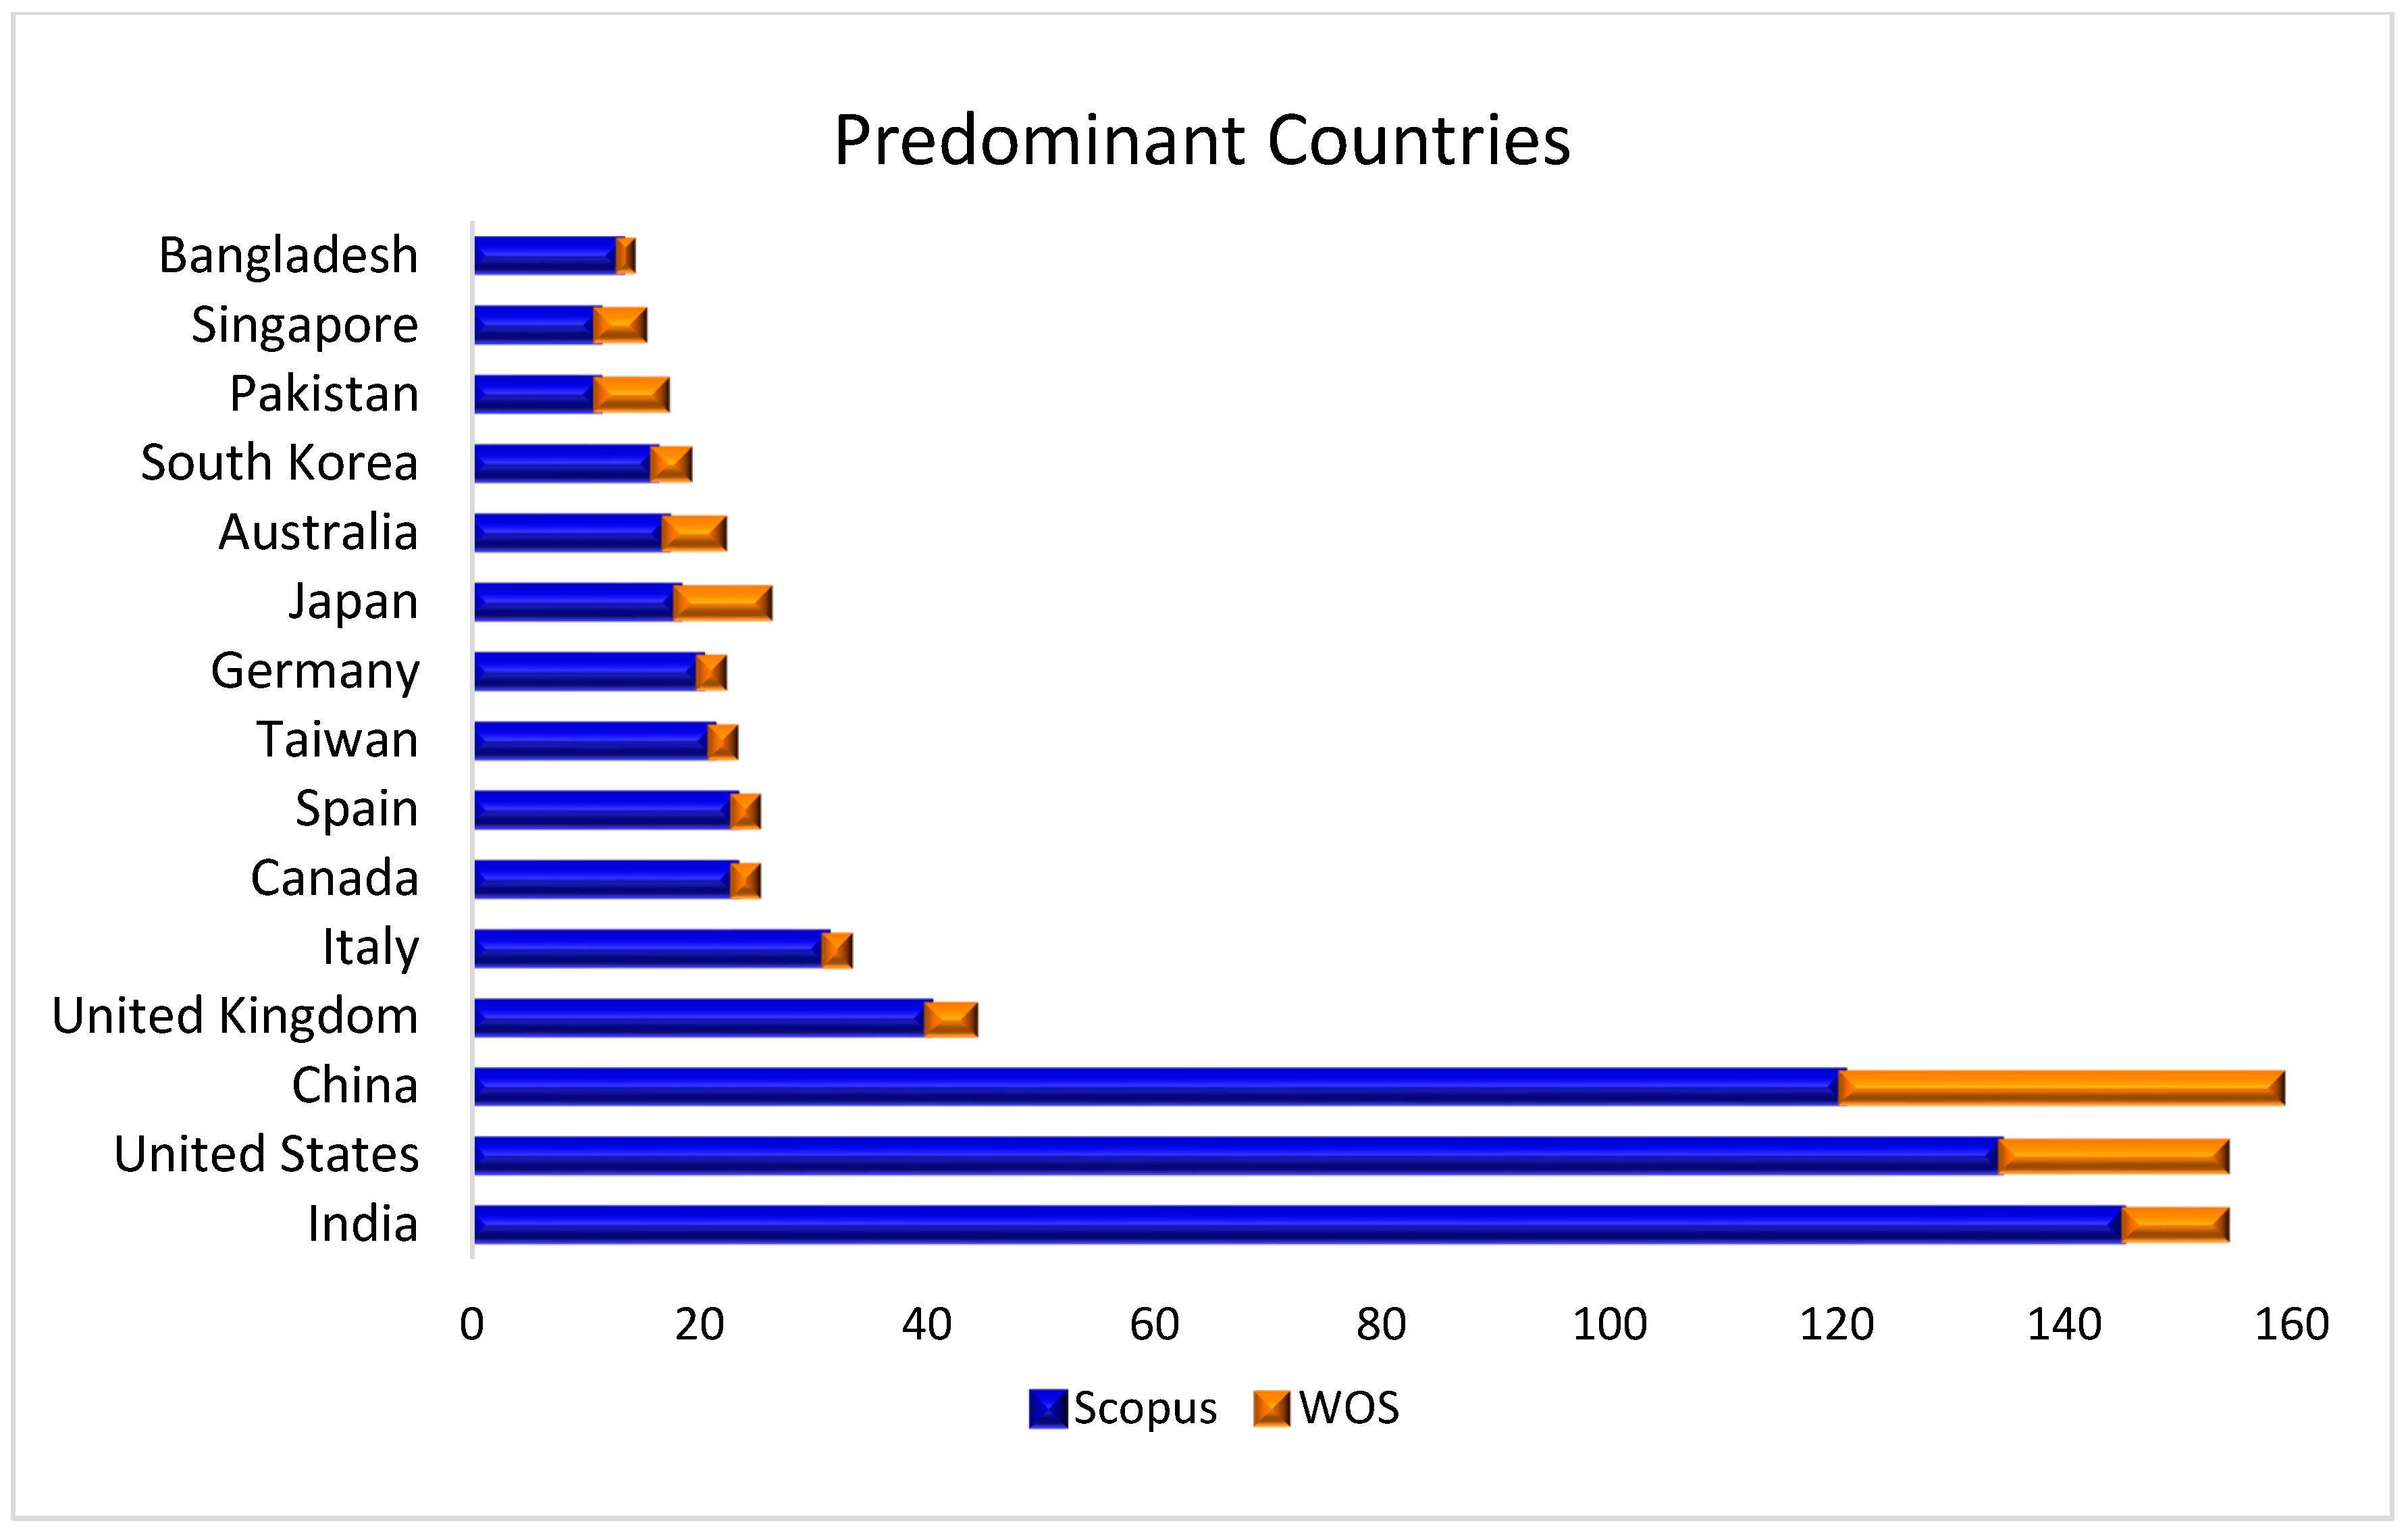
3.3.3. Analysis Based on Geographical/Country Wise

Geographical analysis is a study of the regional geographical locations (country/territory) where research in the particular field has been done significantly. In the area of text-based emotion detection, predominant countries are shown in Figure 6. Research publications from Scopus and Web of Science in different locations are illustrated using a radar map. This map shows major contributing countries with their research counts in the field of text-based emotion detection. India tops with count 145, followed by the United States with 134, and China, with 120, places at third on the Scopus database. In contrast, on Web of Science, China (combining Peoples R China and China) leads with 39, followed by the United States with 20. Table 8 shows the 15 major contributing countries in the area of text-based emotion detection.

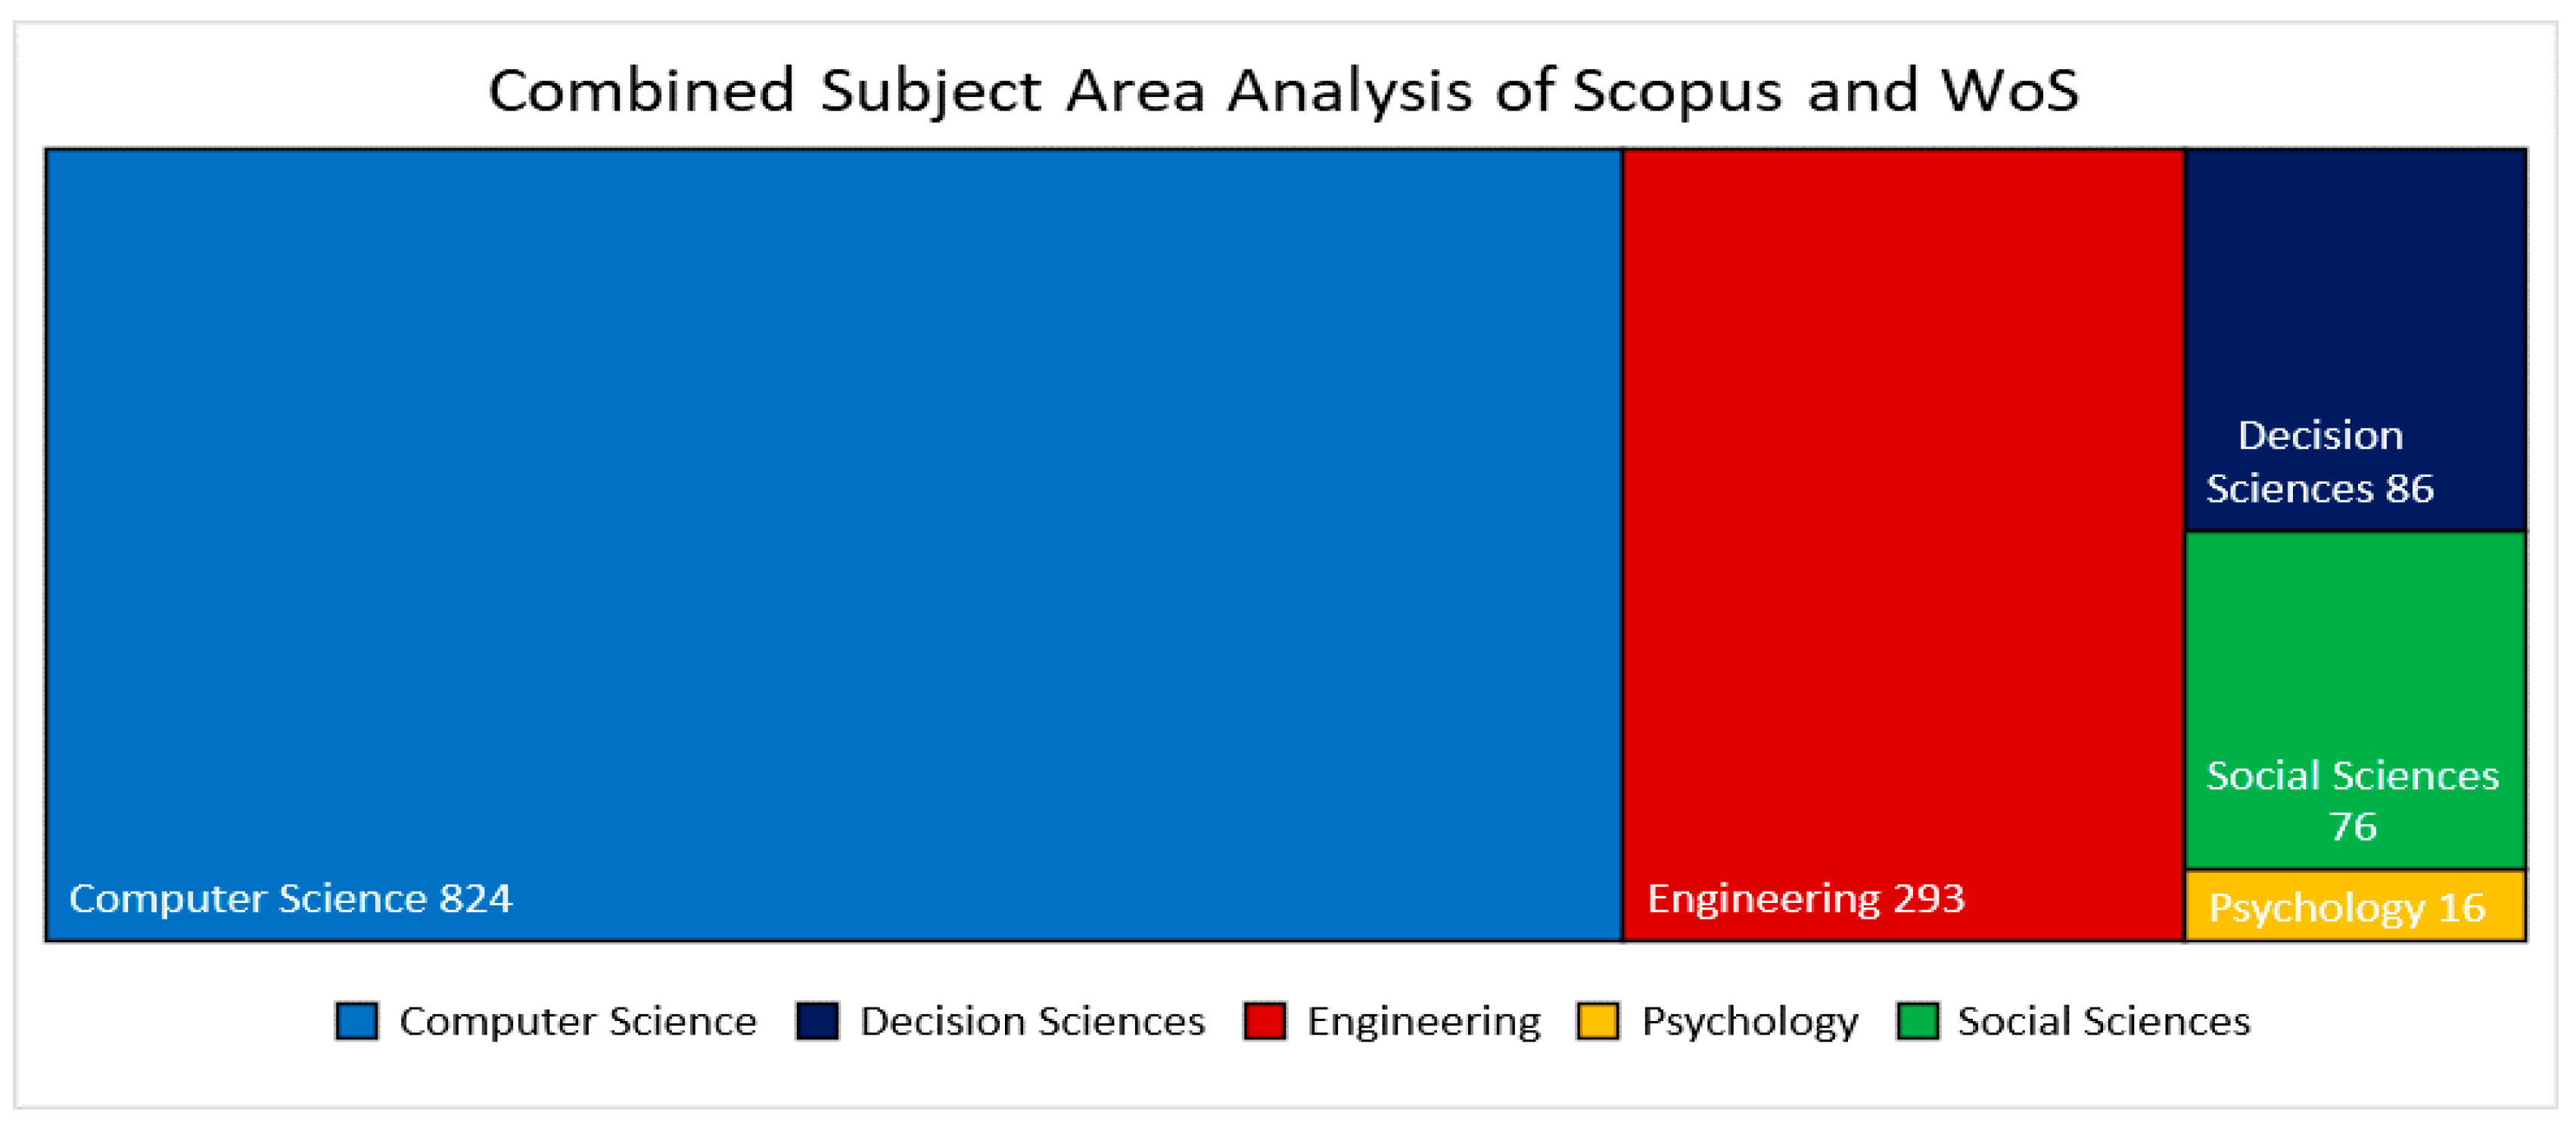
3.3.4. Analysis Based on Subject Area

In subject area analysis, researchers from different fields try to solve the problem from their perspectives. Table 9 shows subject area analysis. In our analysis, computer science, engineering, and psychology are the subject areas from Scopus and Web of Science with major publications in text-based emotion detection. Other subject areas, such decision sciences social sciences, also considered the study of text-based emotion detection significantly using artificial intelligence. Figure 7 shows the categorization of research done in various fields.

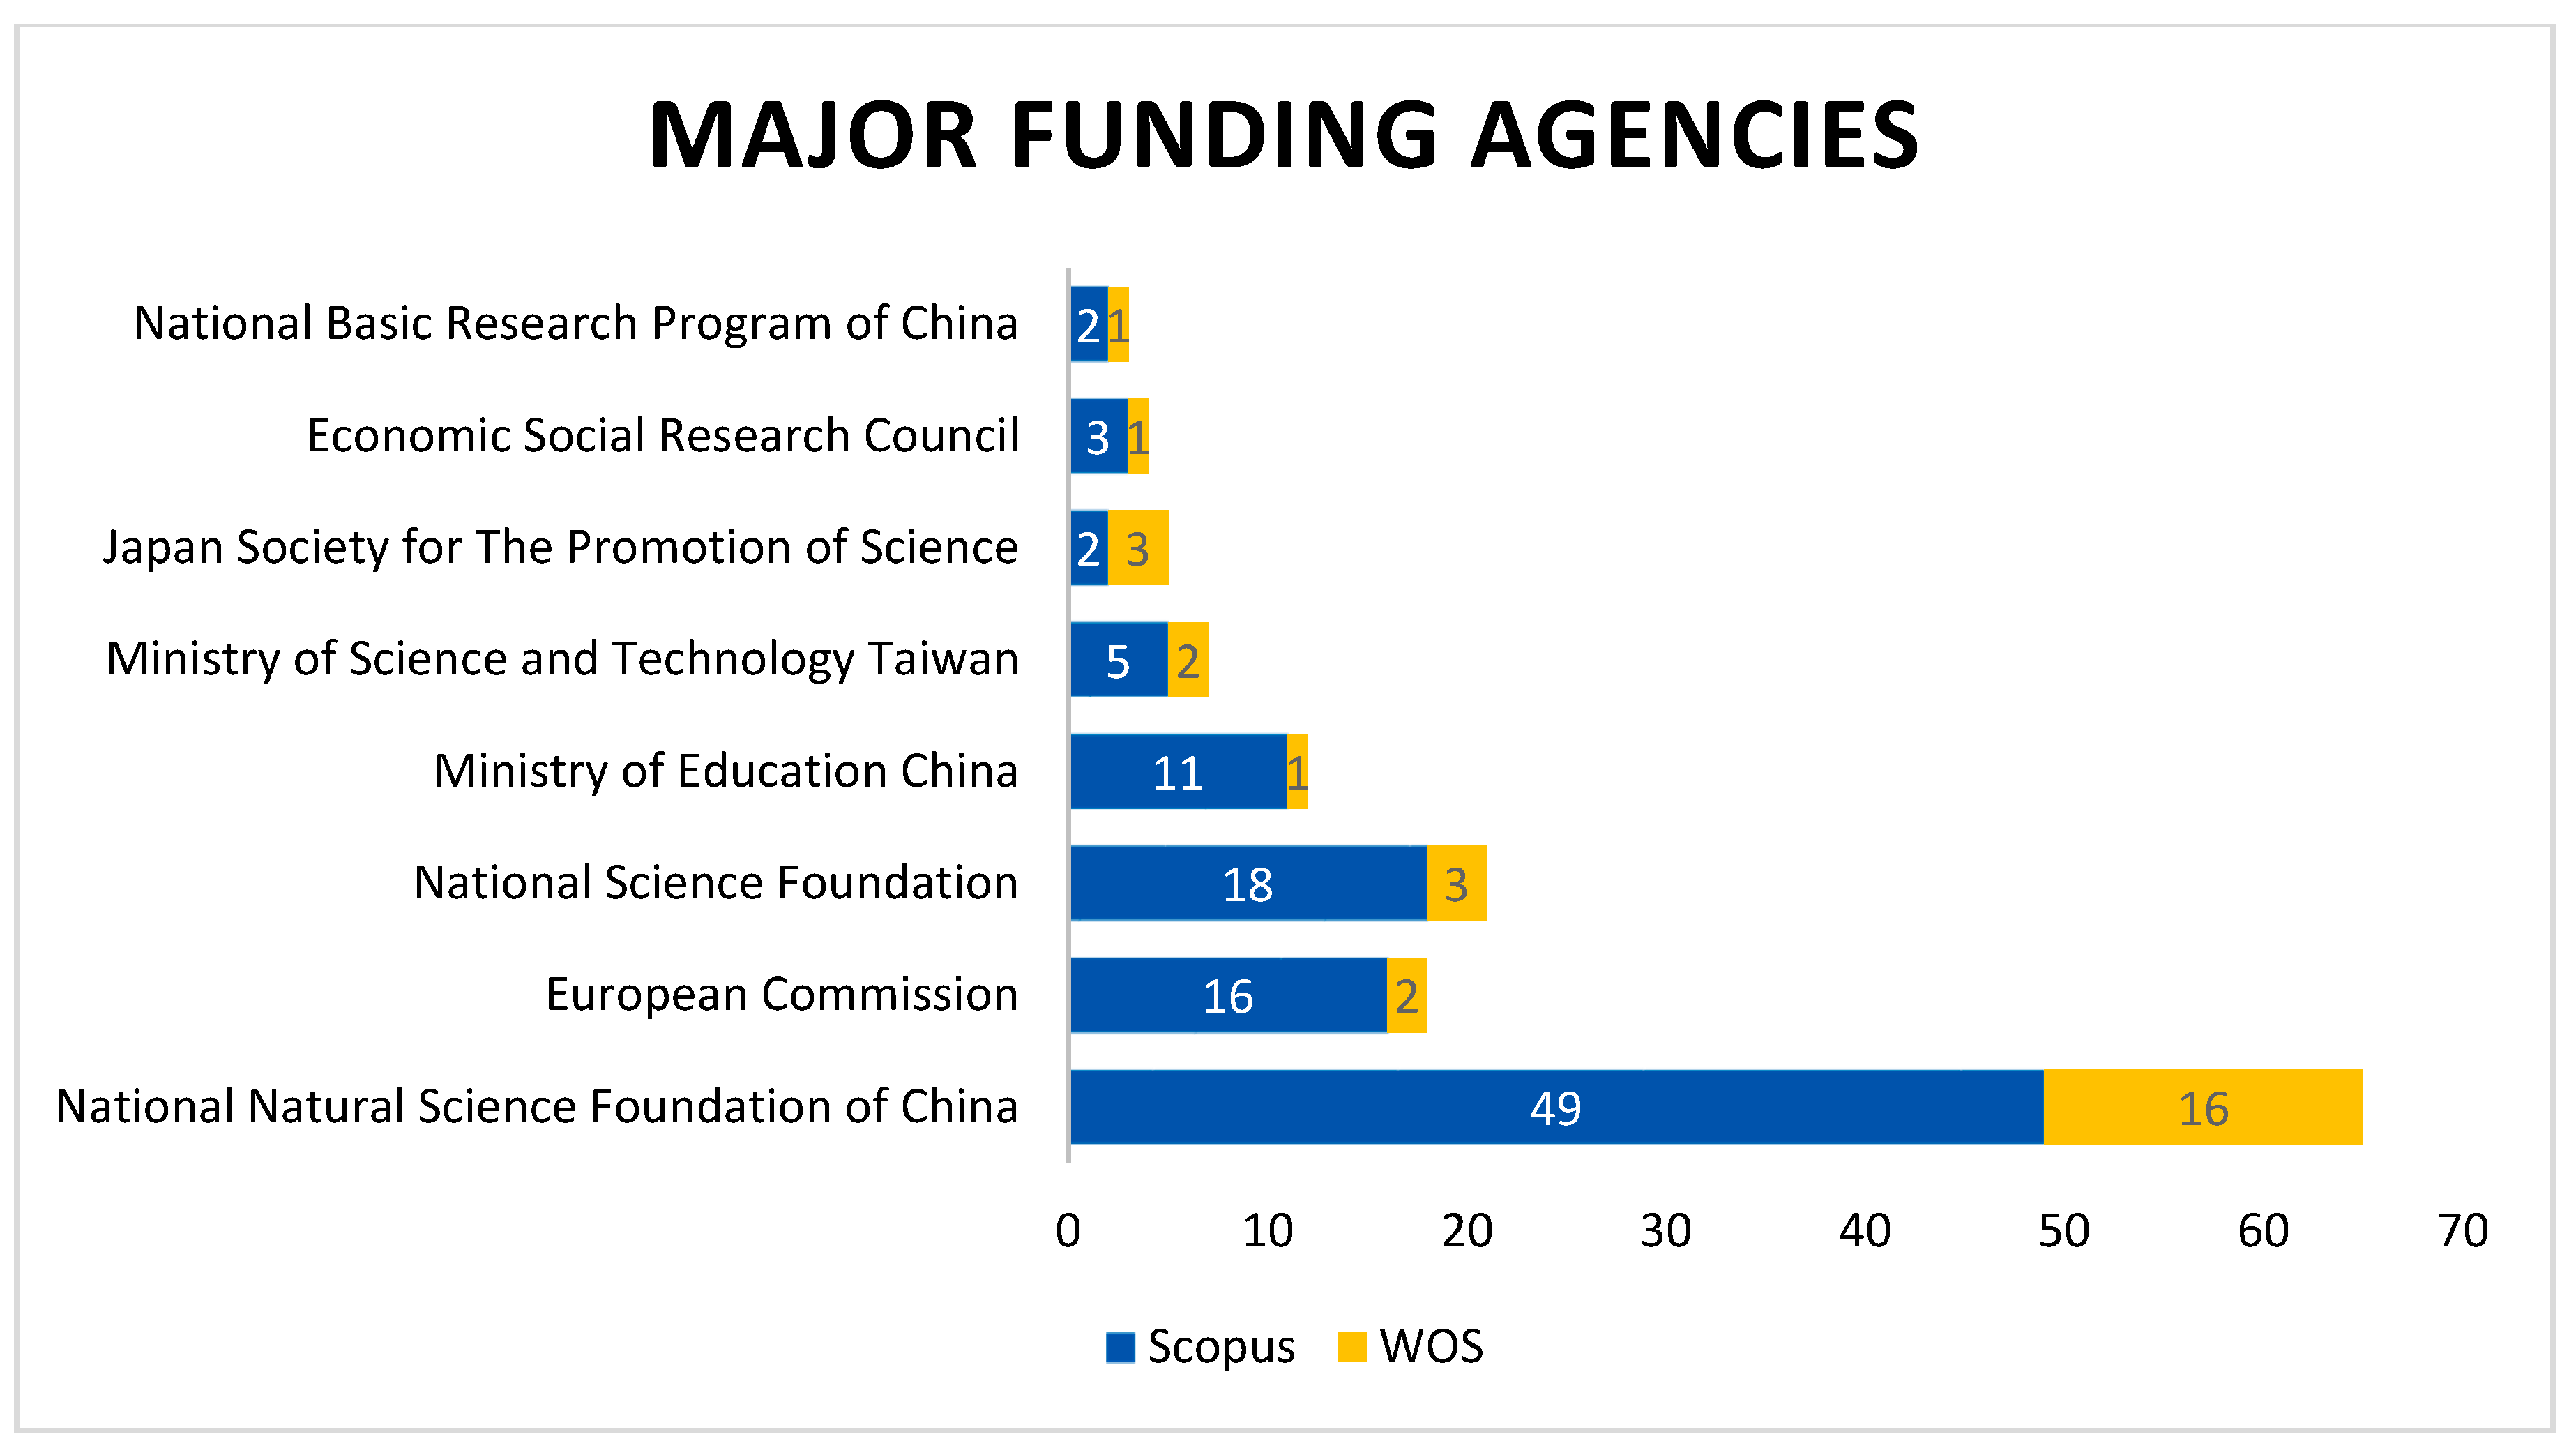
3.3.5. Analysis Based on Funding Agencies

Statistical analysis based on funding agencies shows the universities and organizations contributing funds to the research field. Figure 8 shows the topmost universities and organizations that provide funds to the projects in text-based emotion detection from Scopus and Web of Science. Figure 8 and Table 10 show combined major funding agencies from Scopus and Web of Science in the area of text-based emotion detection. In addition, the national natural science foundation of China and the European Commission national science foundation play a vital role in providing funds in this field. Some other funding agencies include the ministry of education China, the ministry of science and technology Taiwan, and many others.

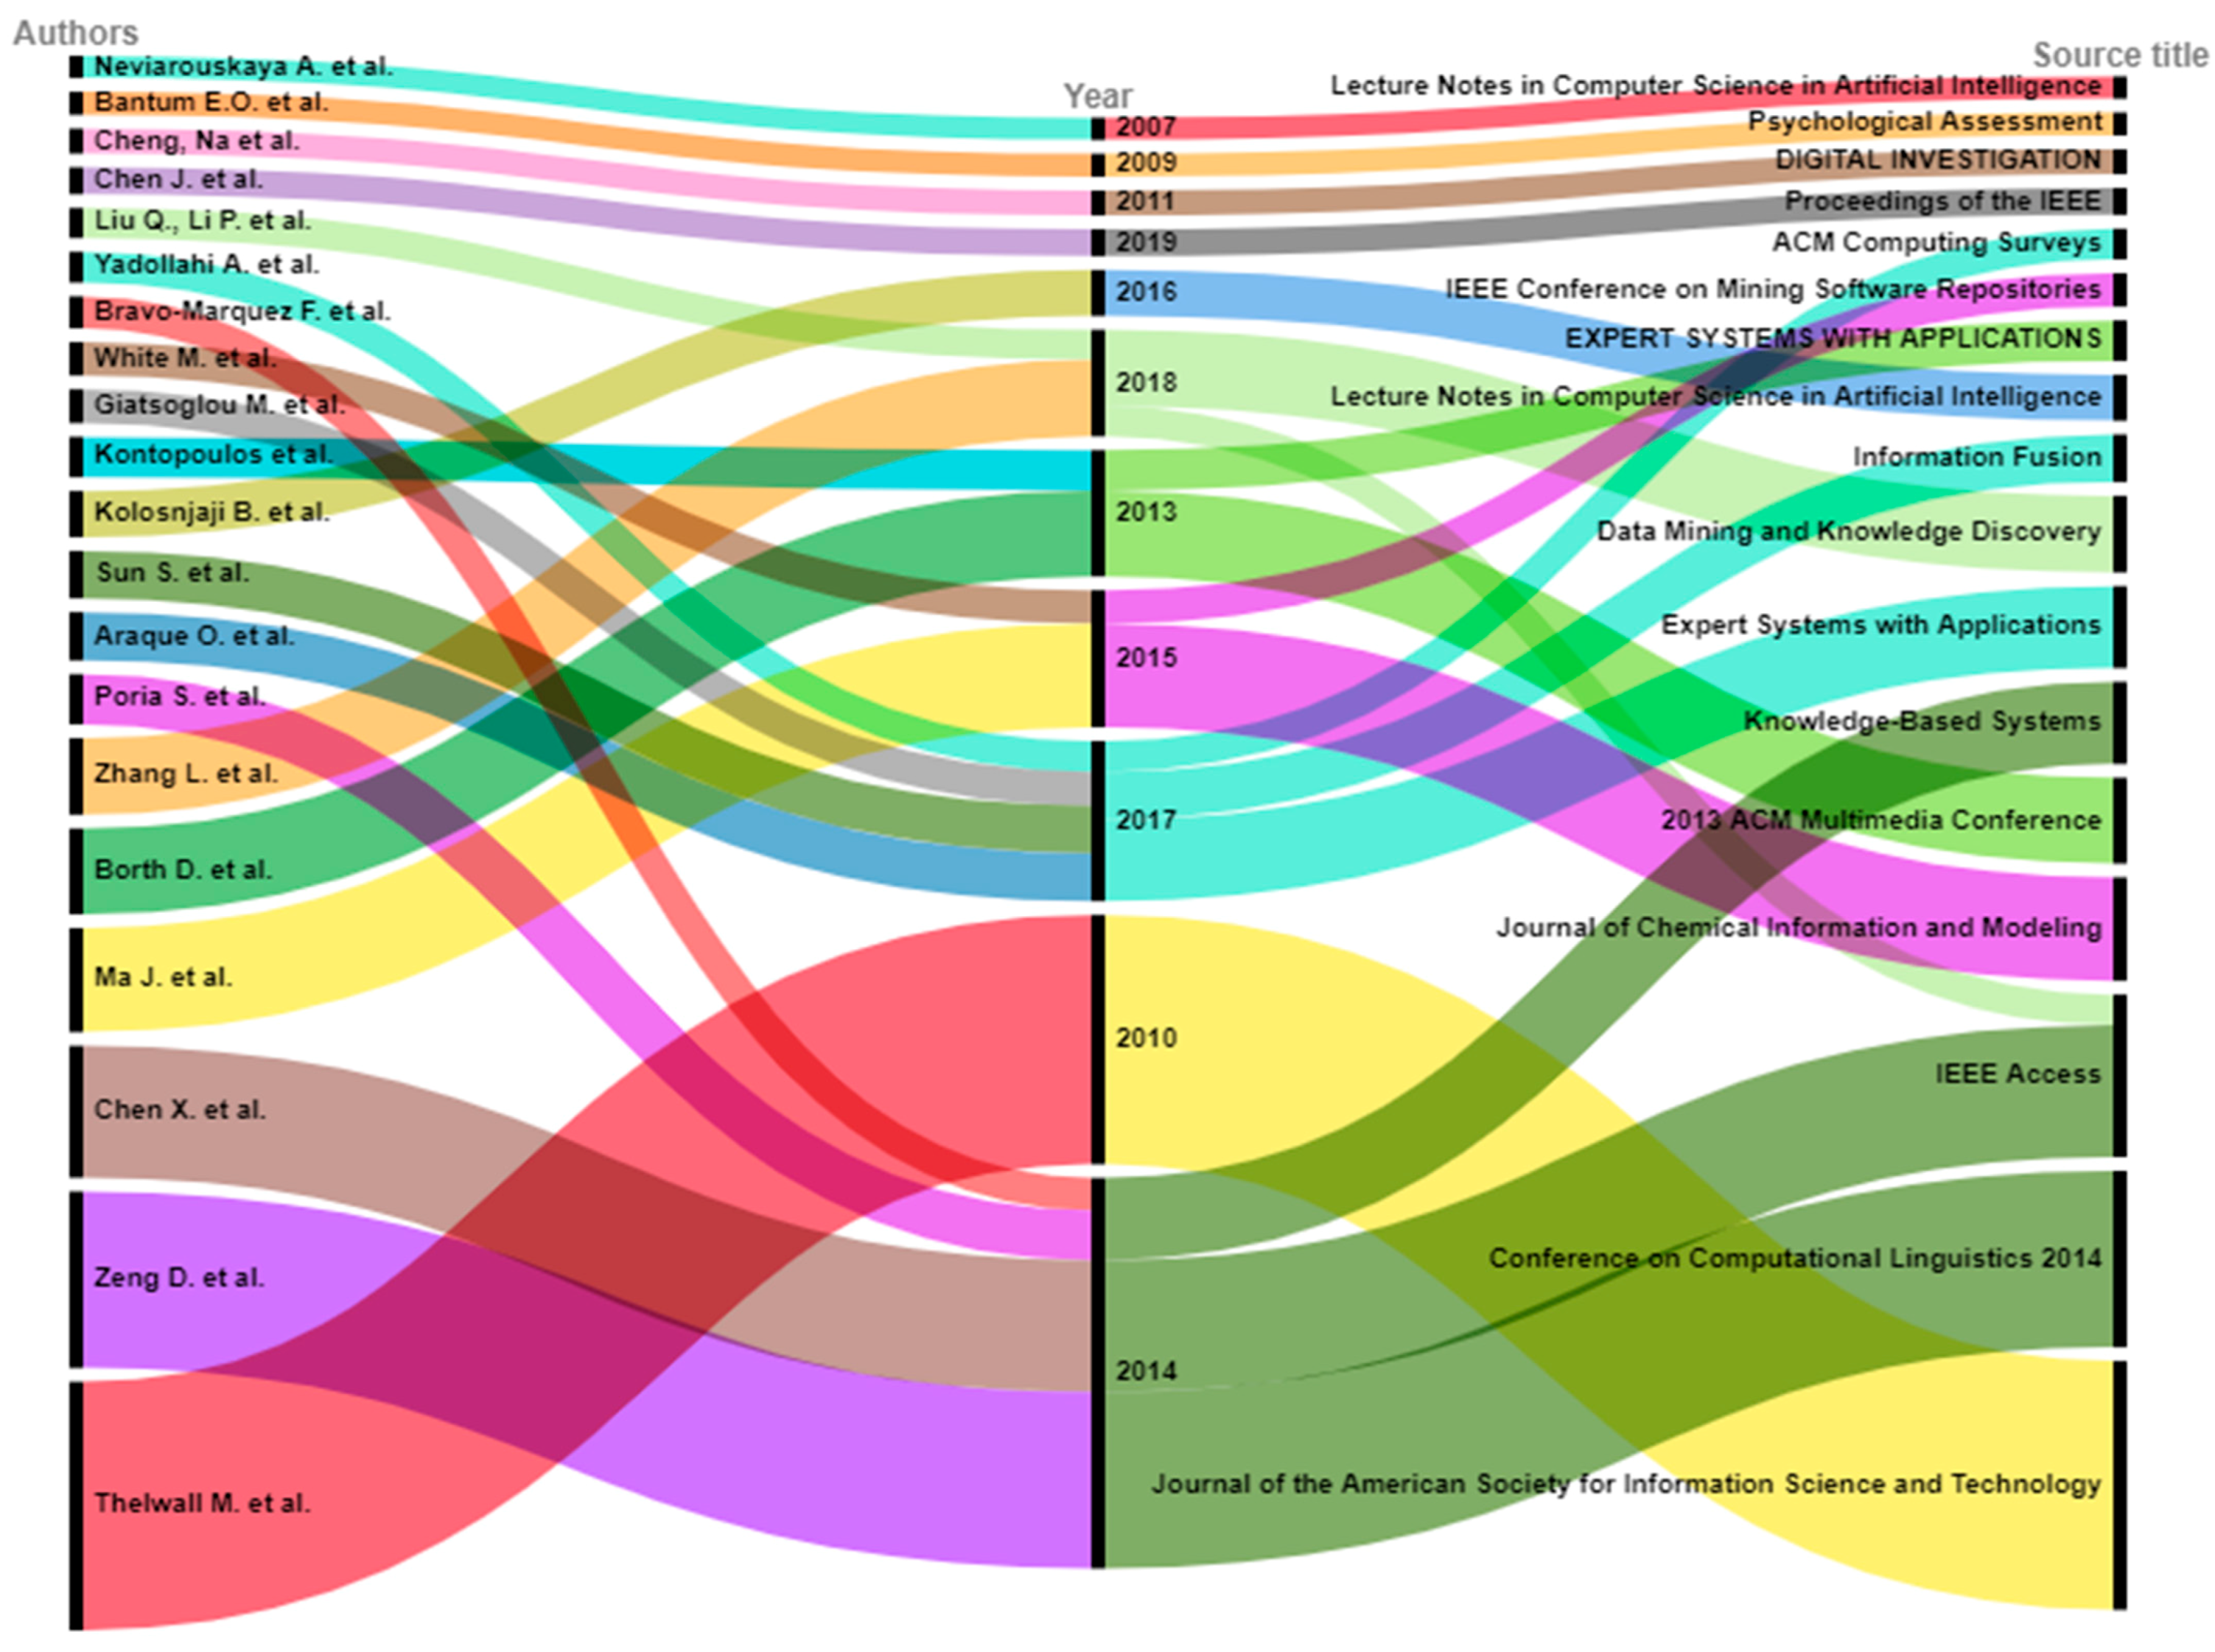
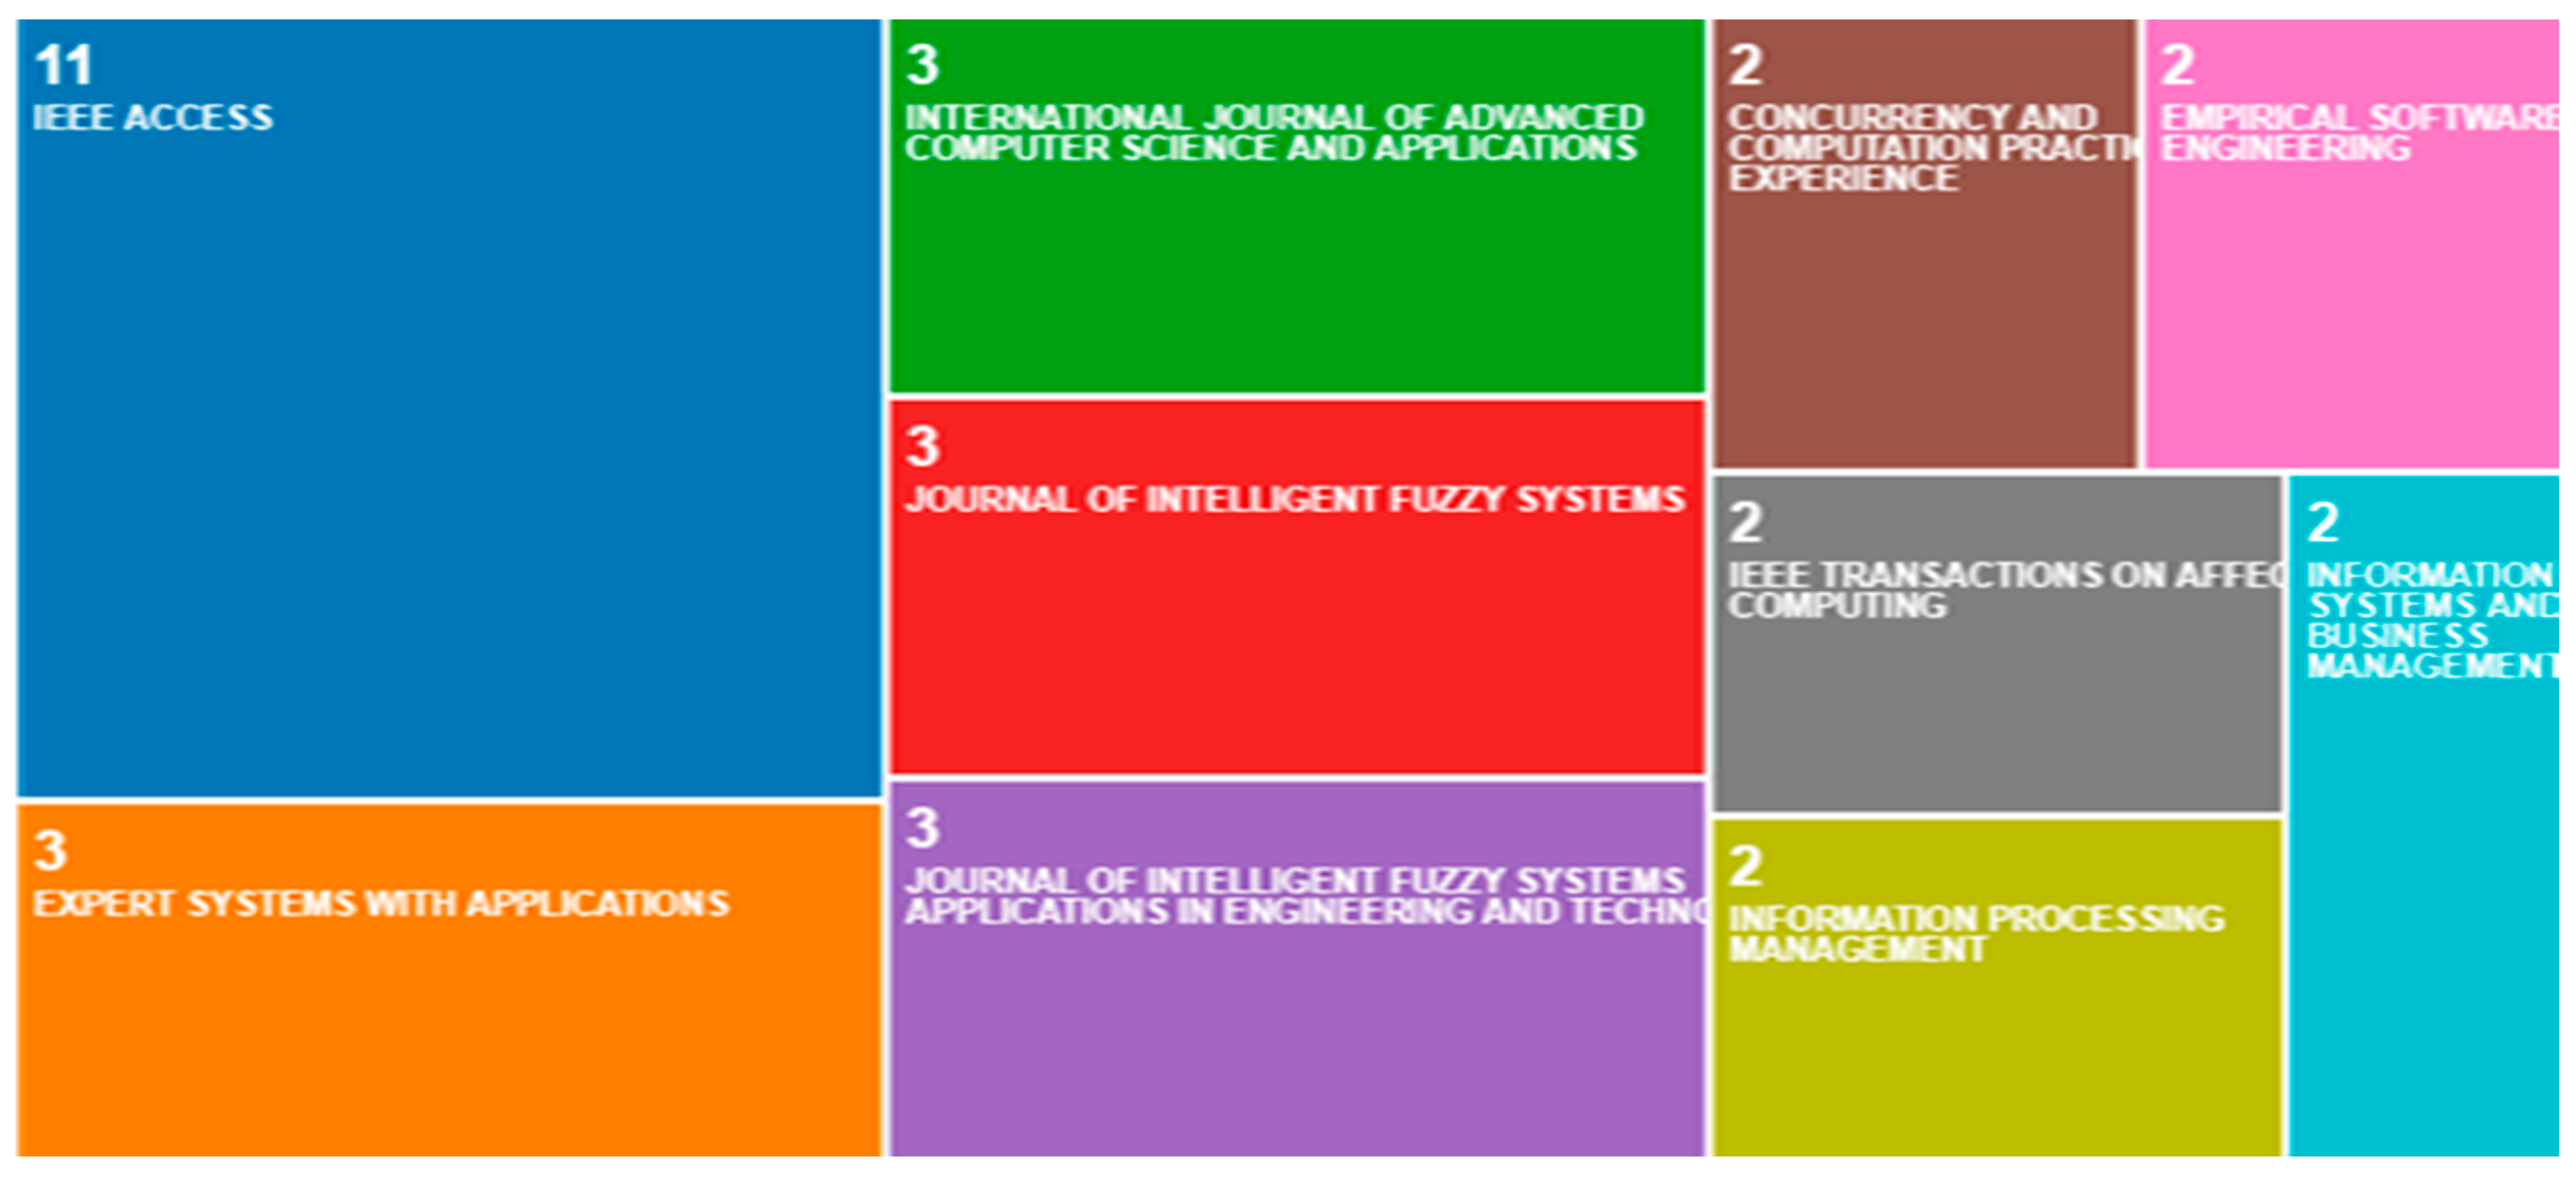
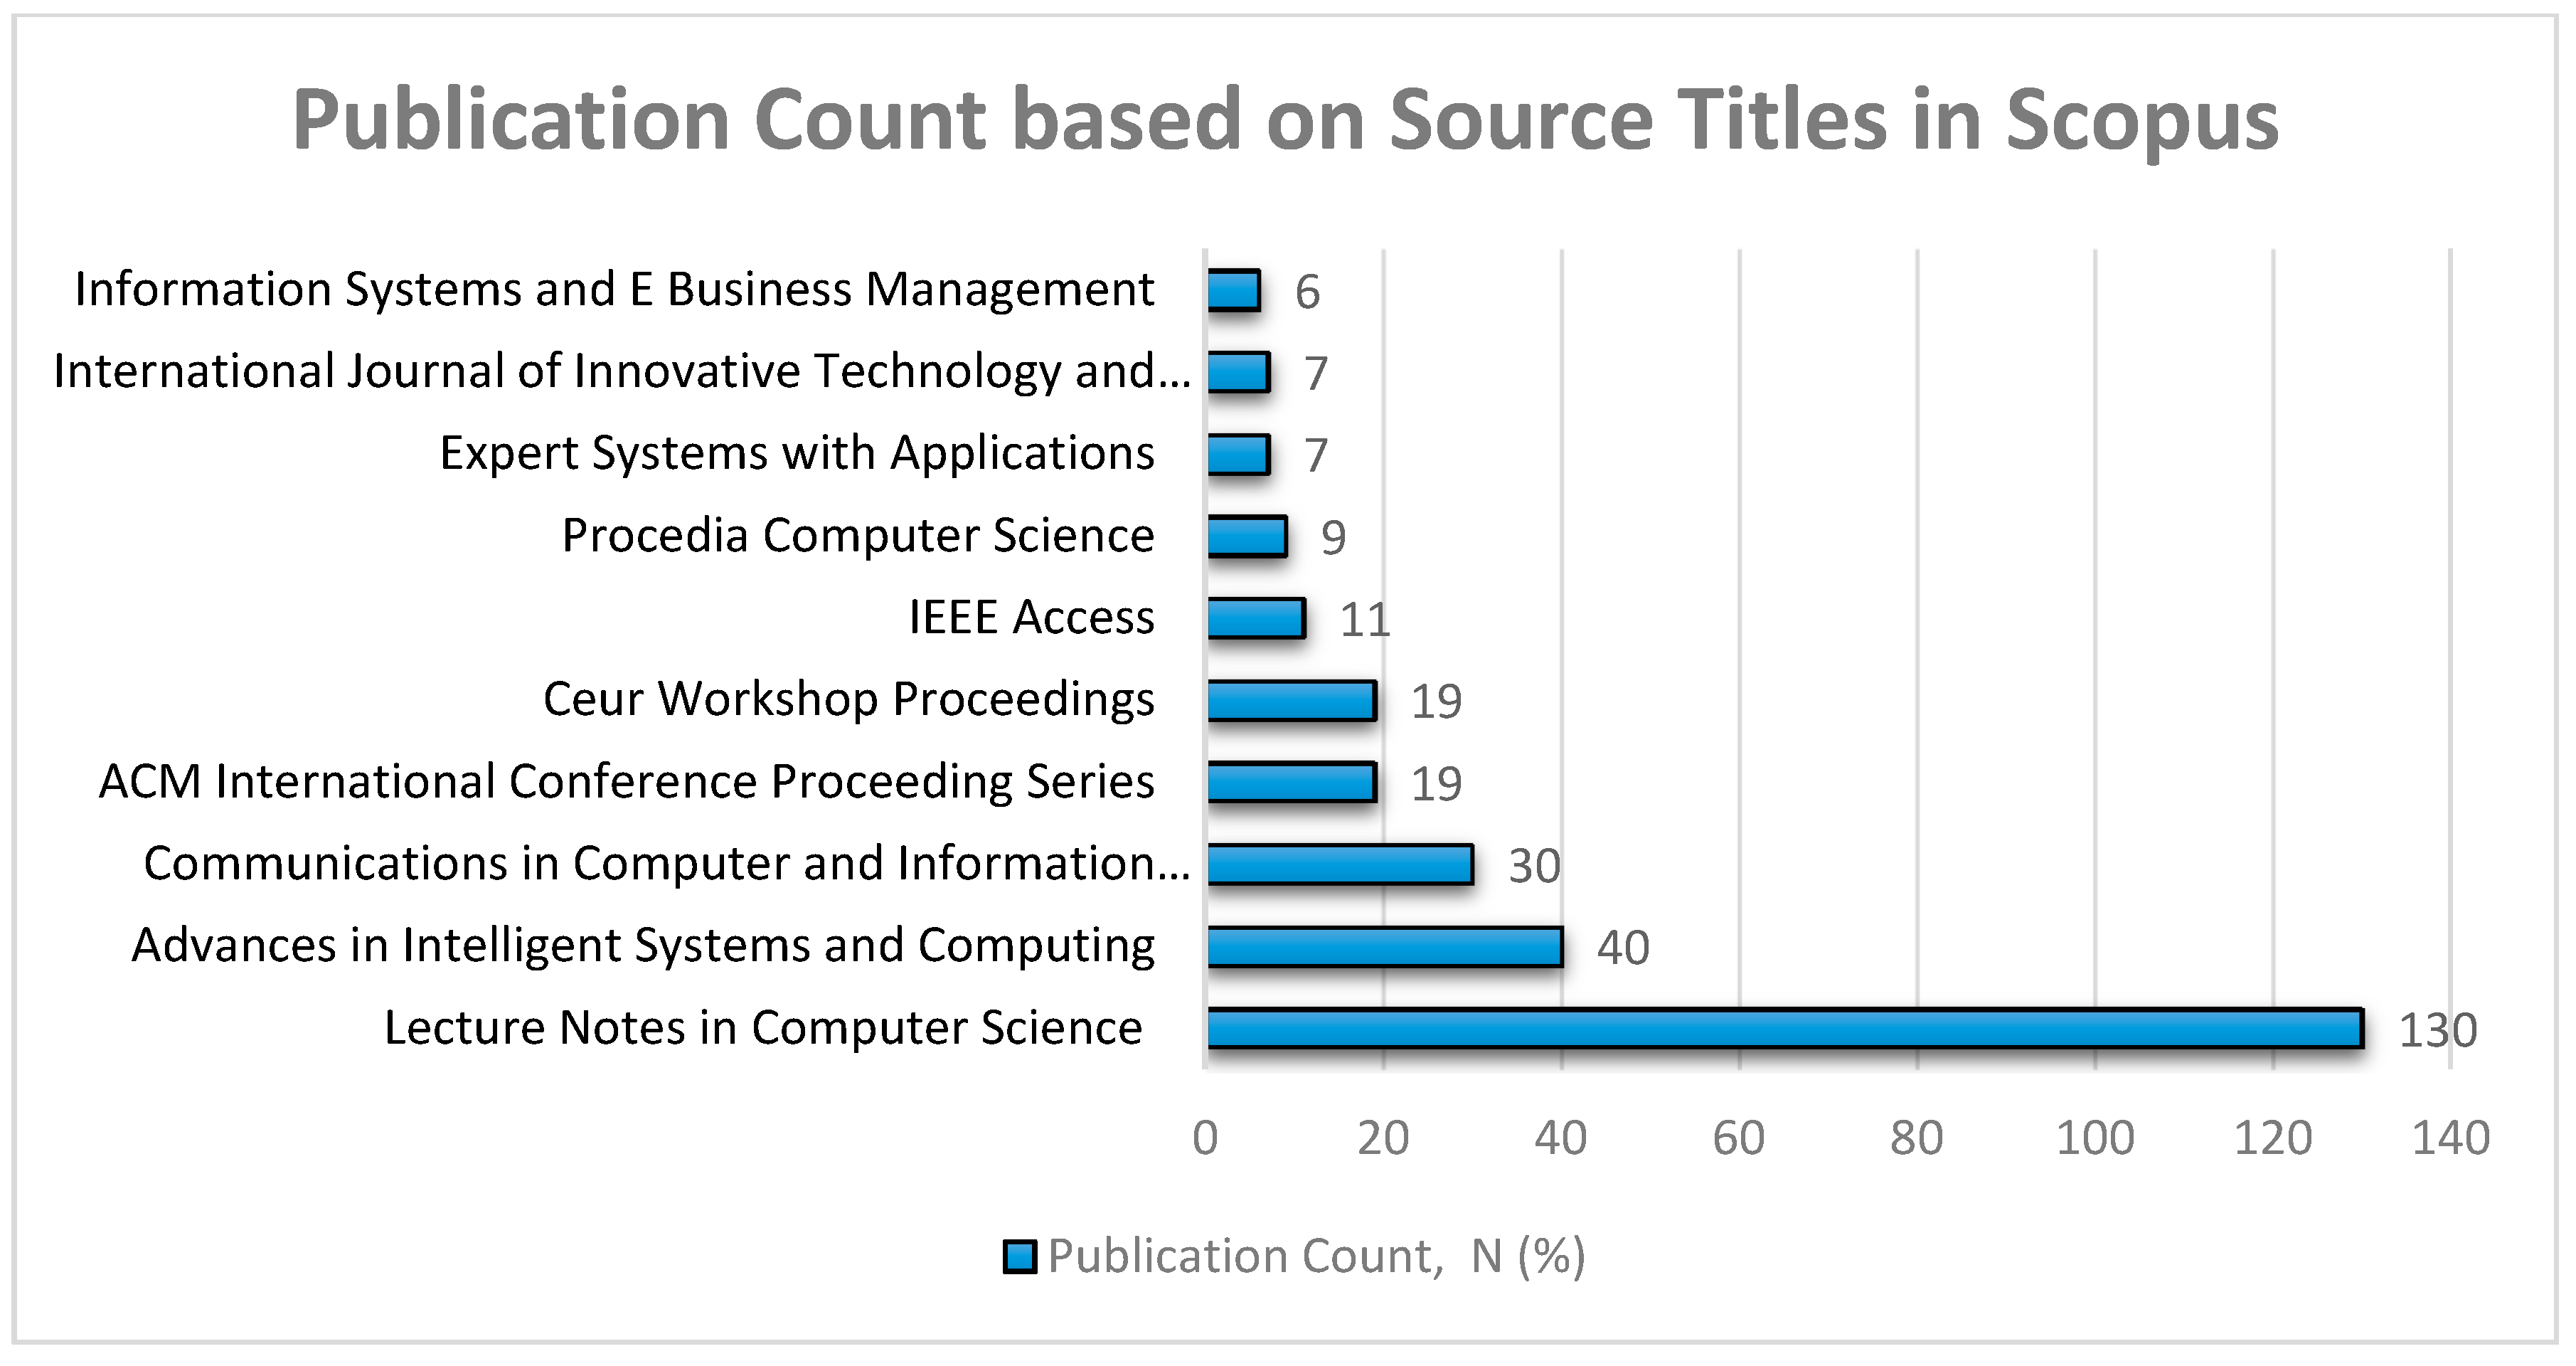
3.3.6. Analysis Based on Source Titles/Publication Source

Statistical analysis based on the source titles means where publications were published originally. Document types such as journal articles, conference proceedings, and reviews were considered. Table 11 and Table 12 show the publication source titles with high Scopus and Web of Science titles, respectively. Lecture Notes in Computer Science Including Subseries Lecture Notes in Artificial Intelligence and Lecture Notes in Bioinformatics was the most productive publication source on Scopus with a count of 130, followed by Advances in Intelligent Systems and Computing with 40, Communications in Computer and Information Science with 30, and ACM International Conference Proceeding Series and Ceur Workshop Proceedings with 19 each. With 11 publication counts, IEEE ACCESS was identified as the most productive publication source on Web of Science, followed by Expert Systems with Applications, International Journal of Advanced Computer Science and Applications, Journal of Intelligent Fuzzy Systems, Journal of Intelligent Fuzzy Systems Applications in Engineering and Technology, each with a count of 3. The leading source titles on Scopus and Web of Science are shown in Figure 9 and Figure 10.

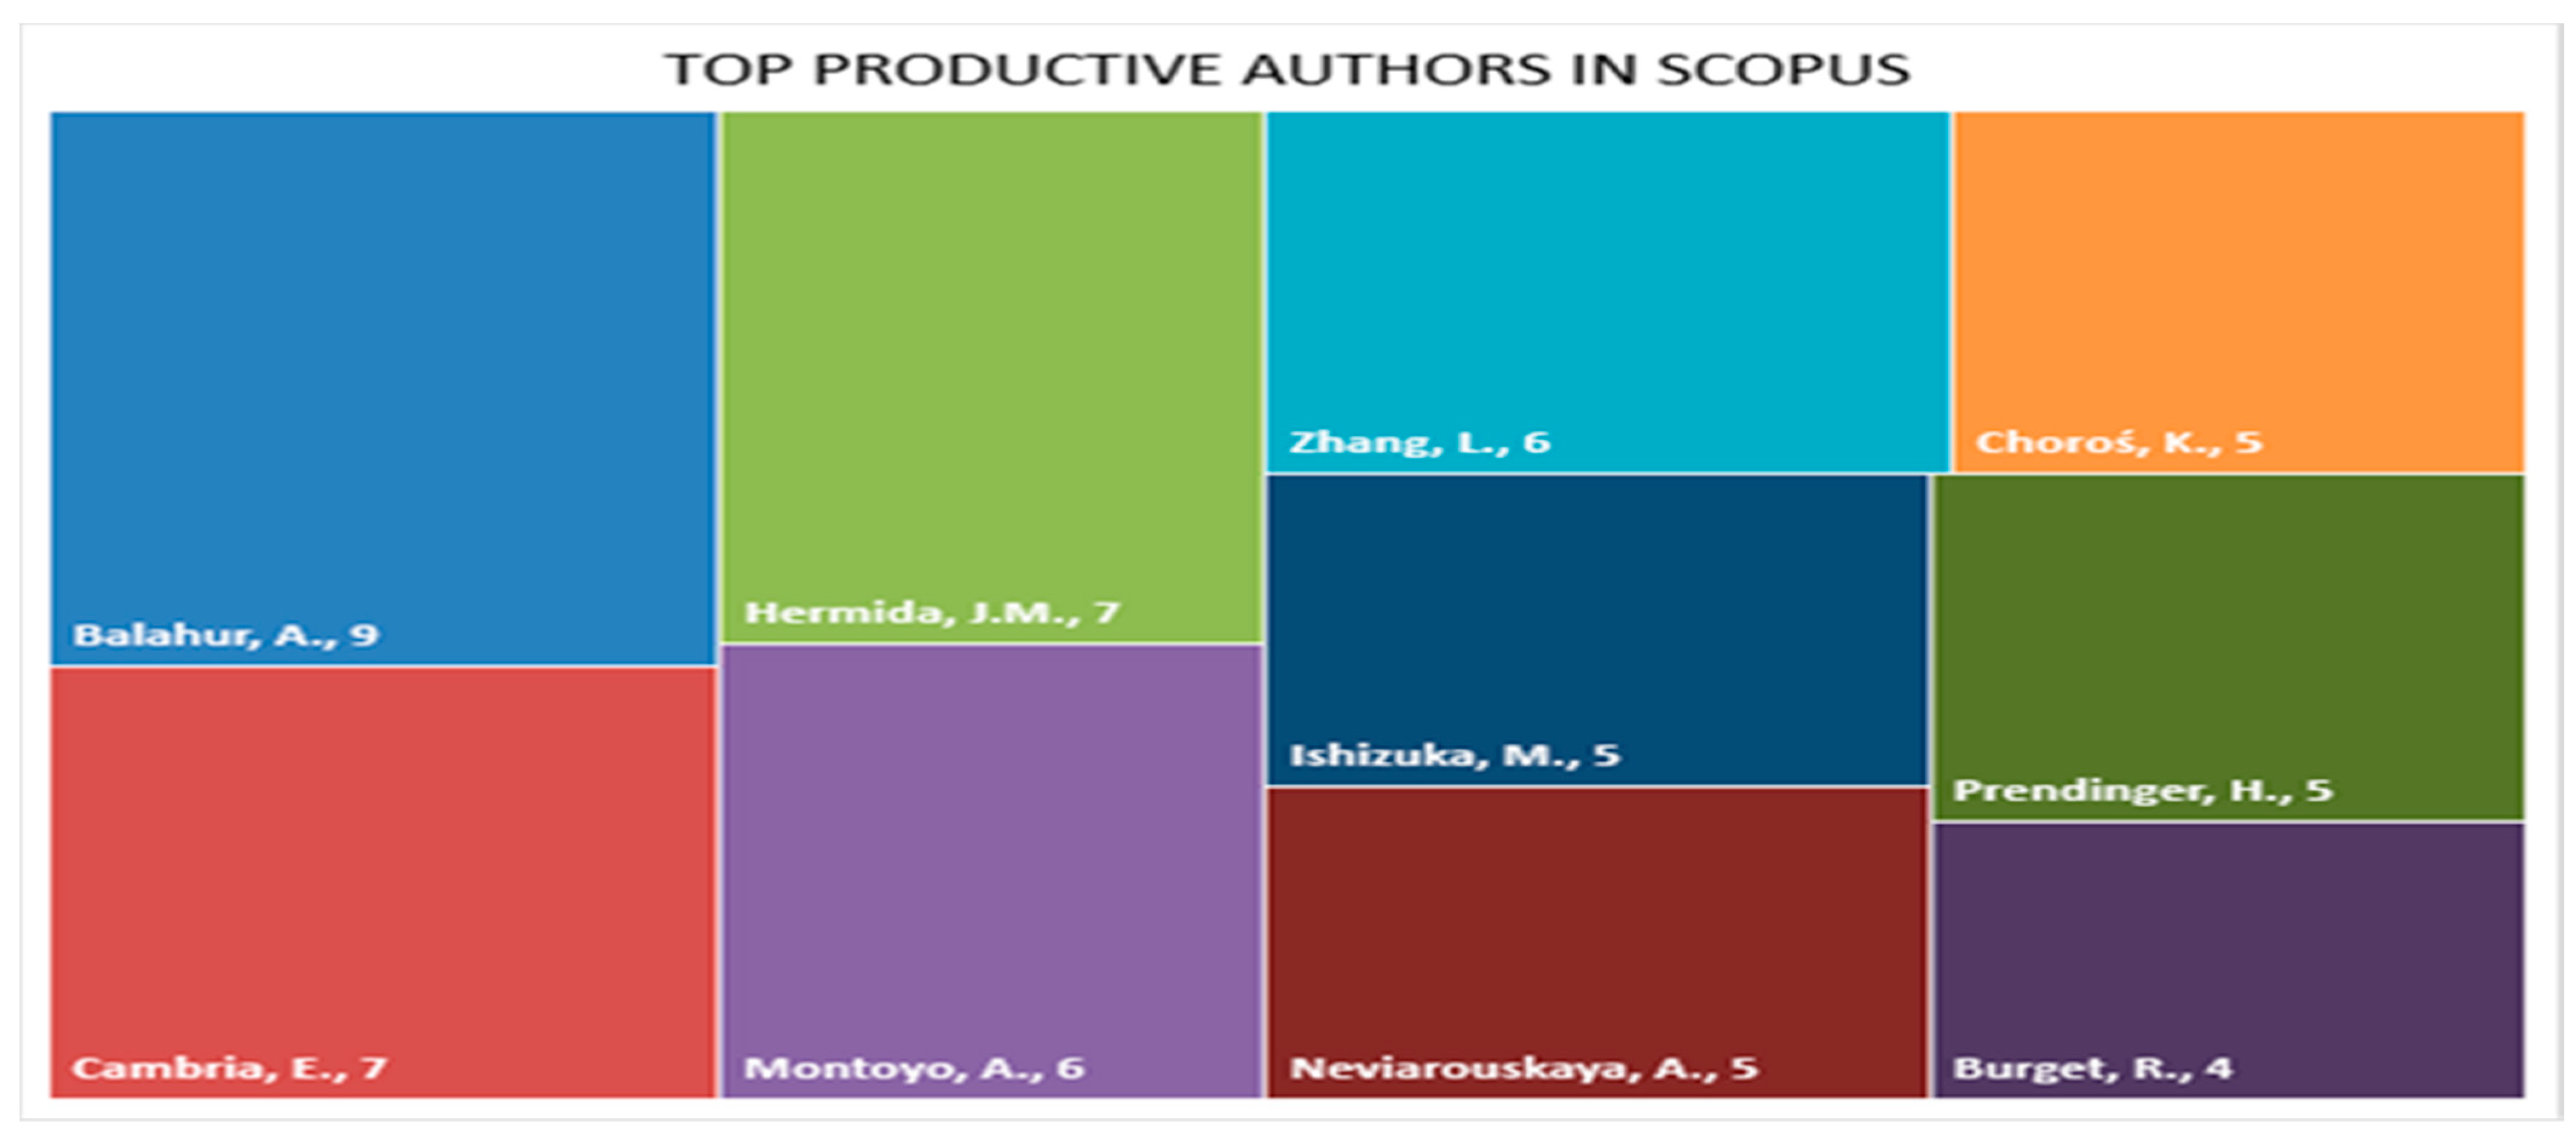
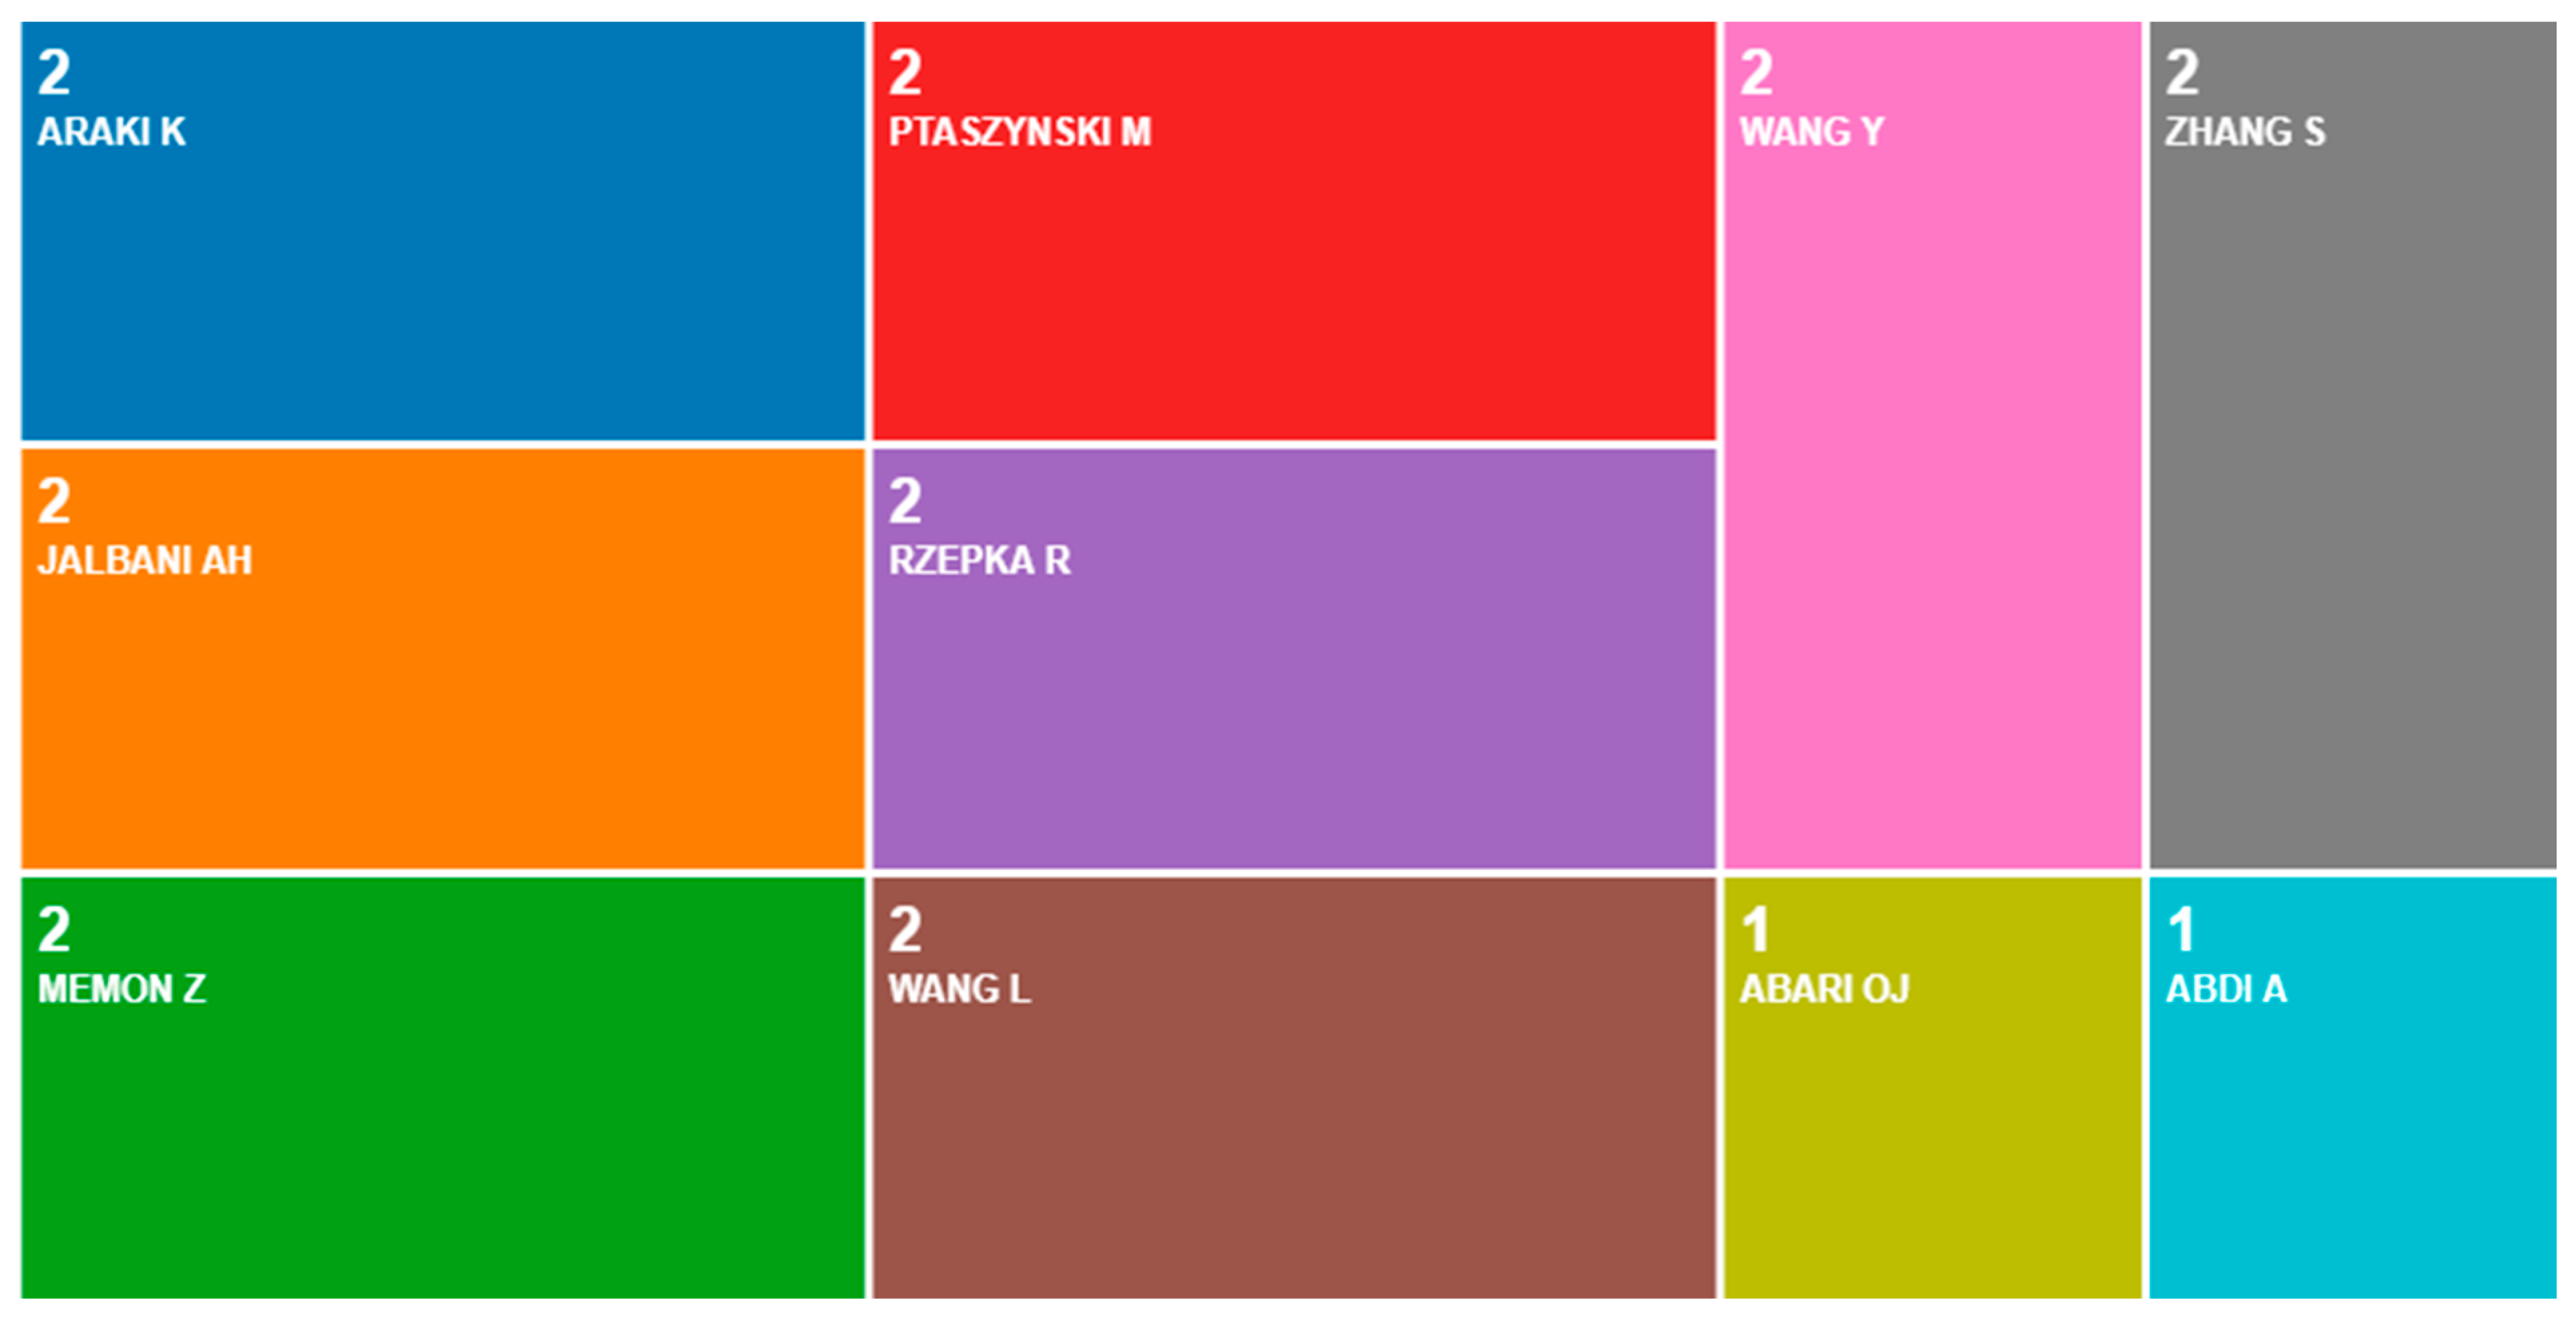
3.3.7. Analysis Based on Author

Author-based statistical analysis provides the information of publication count per author. The number of publications from Scopus and Web of Science is used to determine the most productive authors. On Scopus, Alexandra Balahur leads the race with a total of nine publications, whereas on Web of Science, the leading author is ARAKI K with two publications. Figure 11 and Figure 12 show the topmost authors from Scopus and Web of Science, respectively.

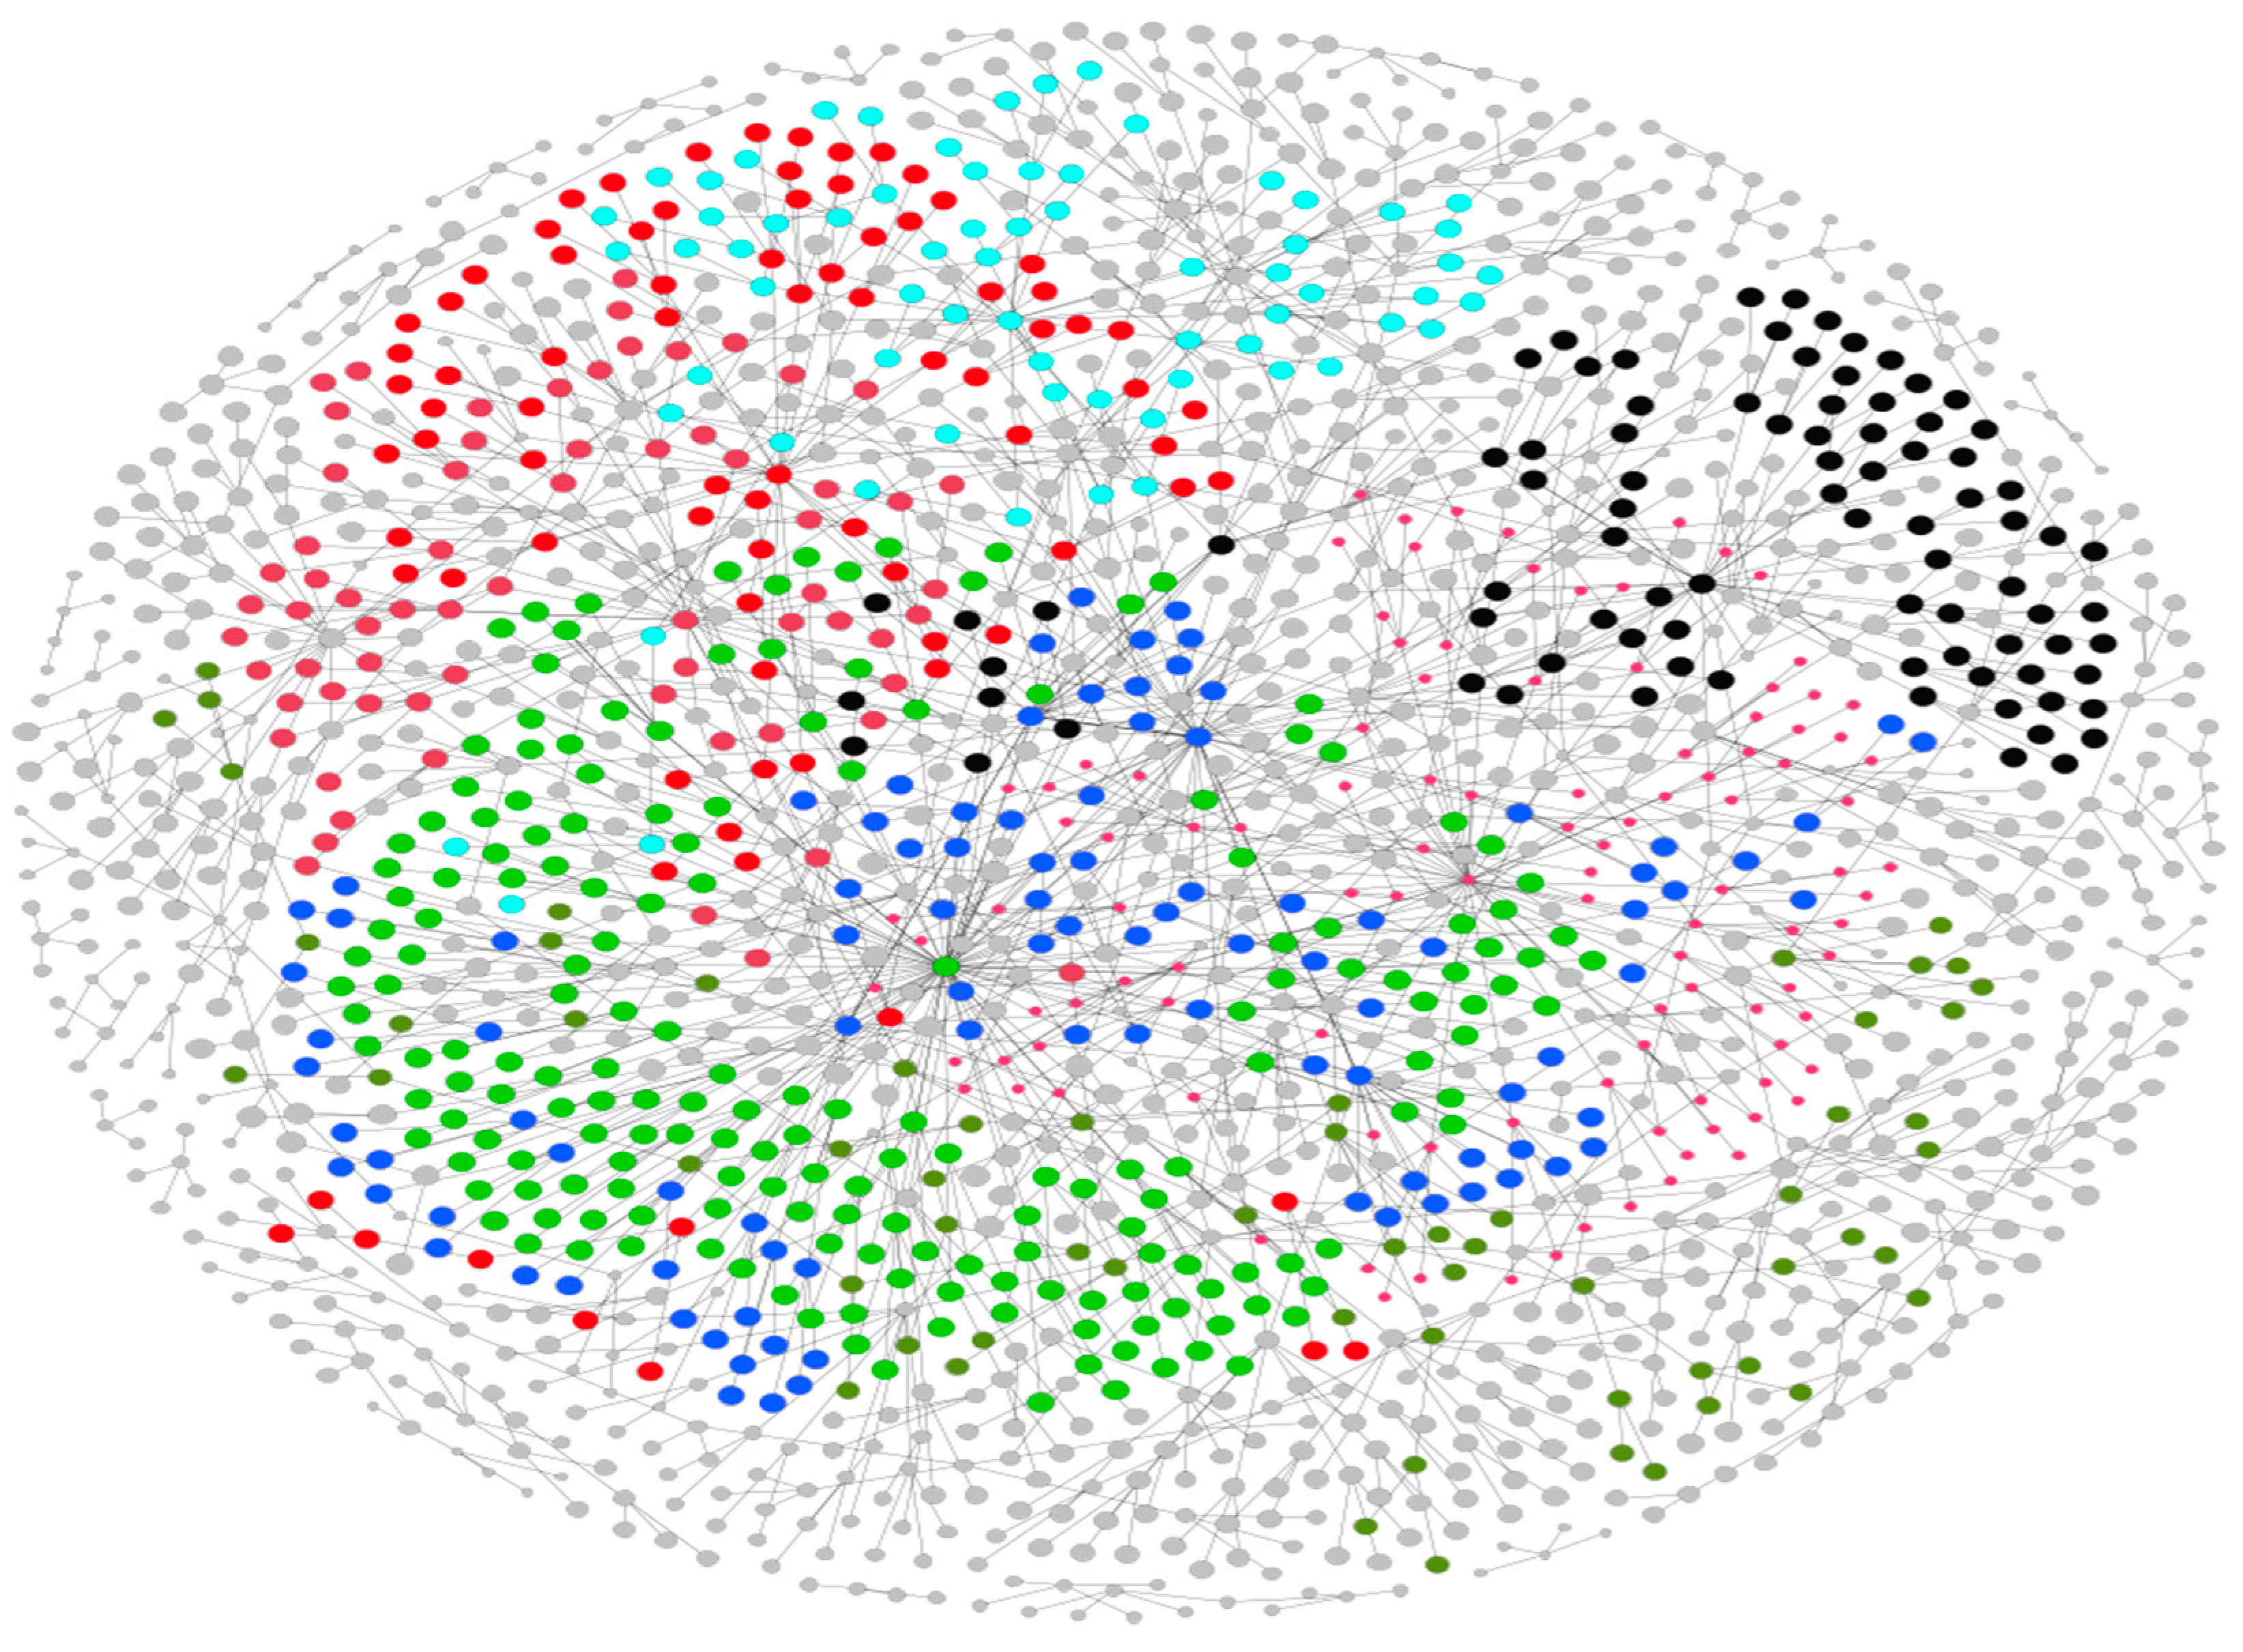
3.4. Network Analysis

In network analysis, citations or common keywords were examined, and the relationships between publications based on authorship were visualized. VOS viewer and Gephi, which are bibliometric tools, were used for representing network graphs. Figure 13 shows the linkage between the top 53 highly cited authors with their co-authors, source titles, and paper title. For example, the maximum number of citations received by a publication titled “Sentiment in short strength detection informal text” is 1028, written by Thelwall M.et al. Table 13 shows the top 10 highly cited authors with publication title and the number of citations exclusively in sentiment analysis and emotion detection. The figure’s network analysis is carried out using Gephi.
Figure 14 shows the clustered network analysis of authors with their co-authors, source titles, and publication title based on modularity measures from both Scopus and Web of Science. Modularity is a unit of network or graph structure that shows the strength of a network’s division into modules (too termed clusters, groups, or communities). The different clusters with different colors show the strength of dividing a network into modules. The network analysis of the figure is carried out using Gephi.

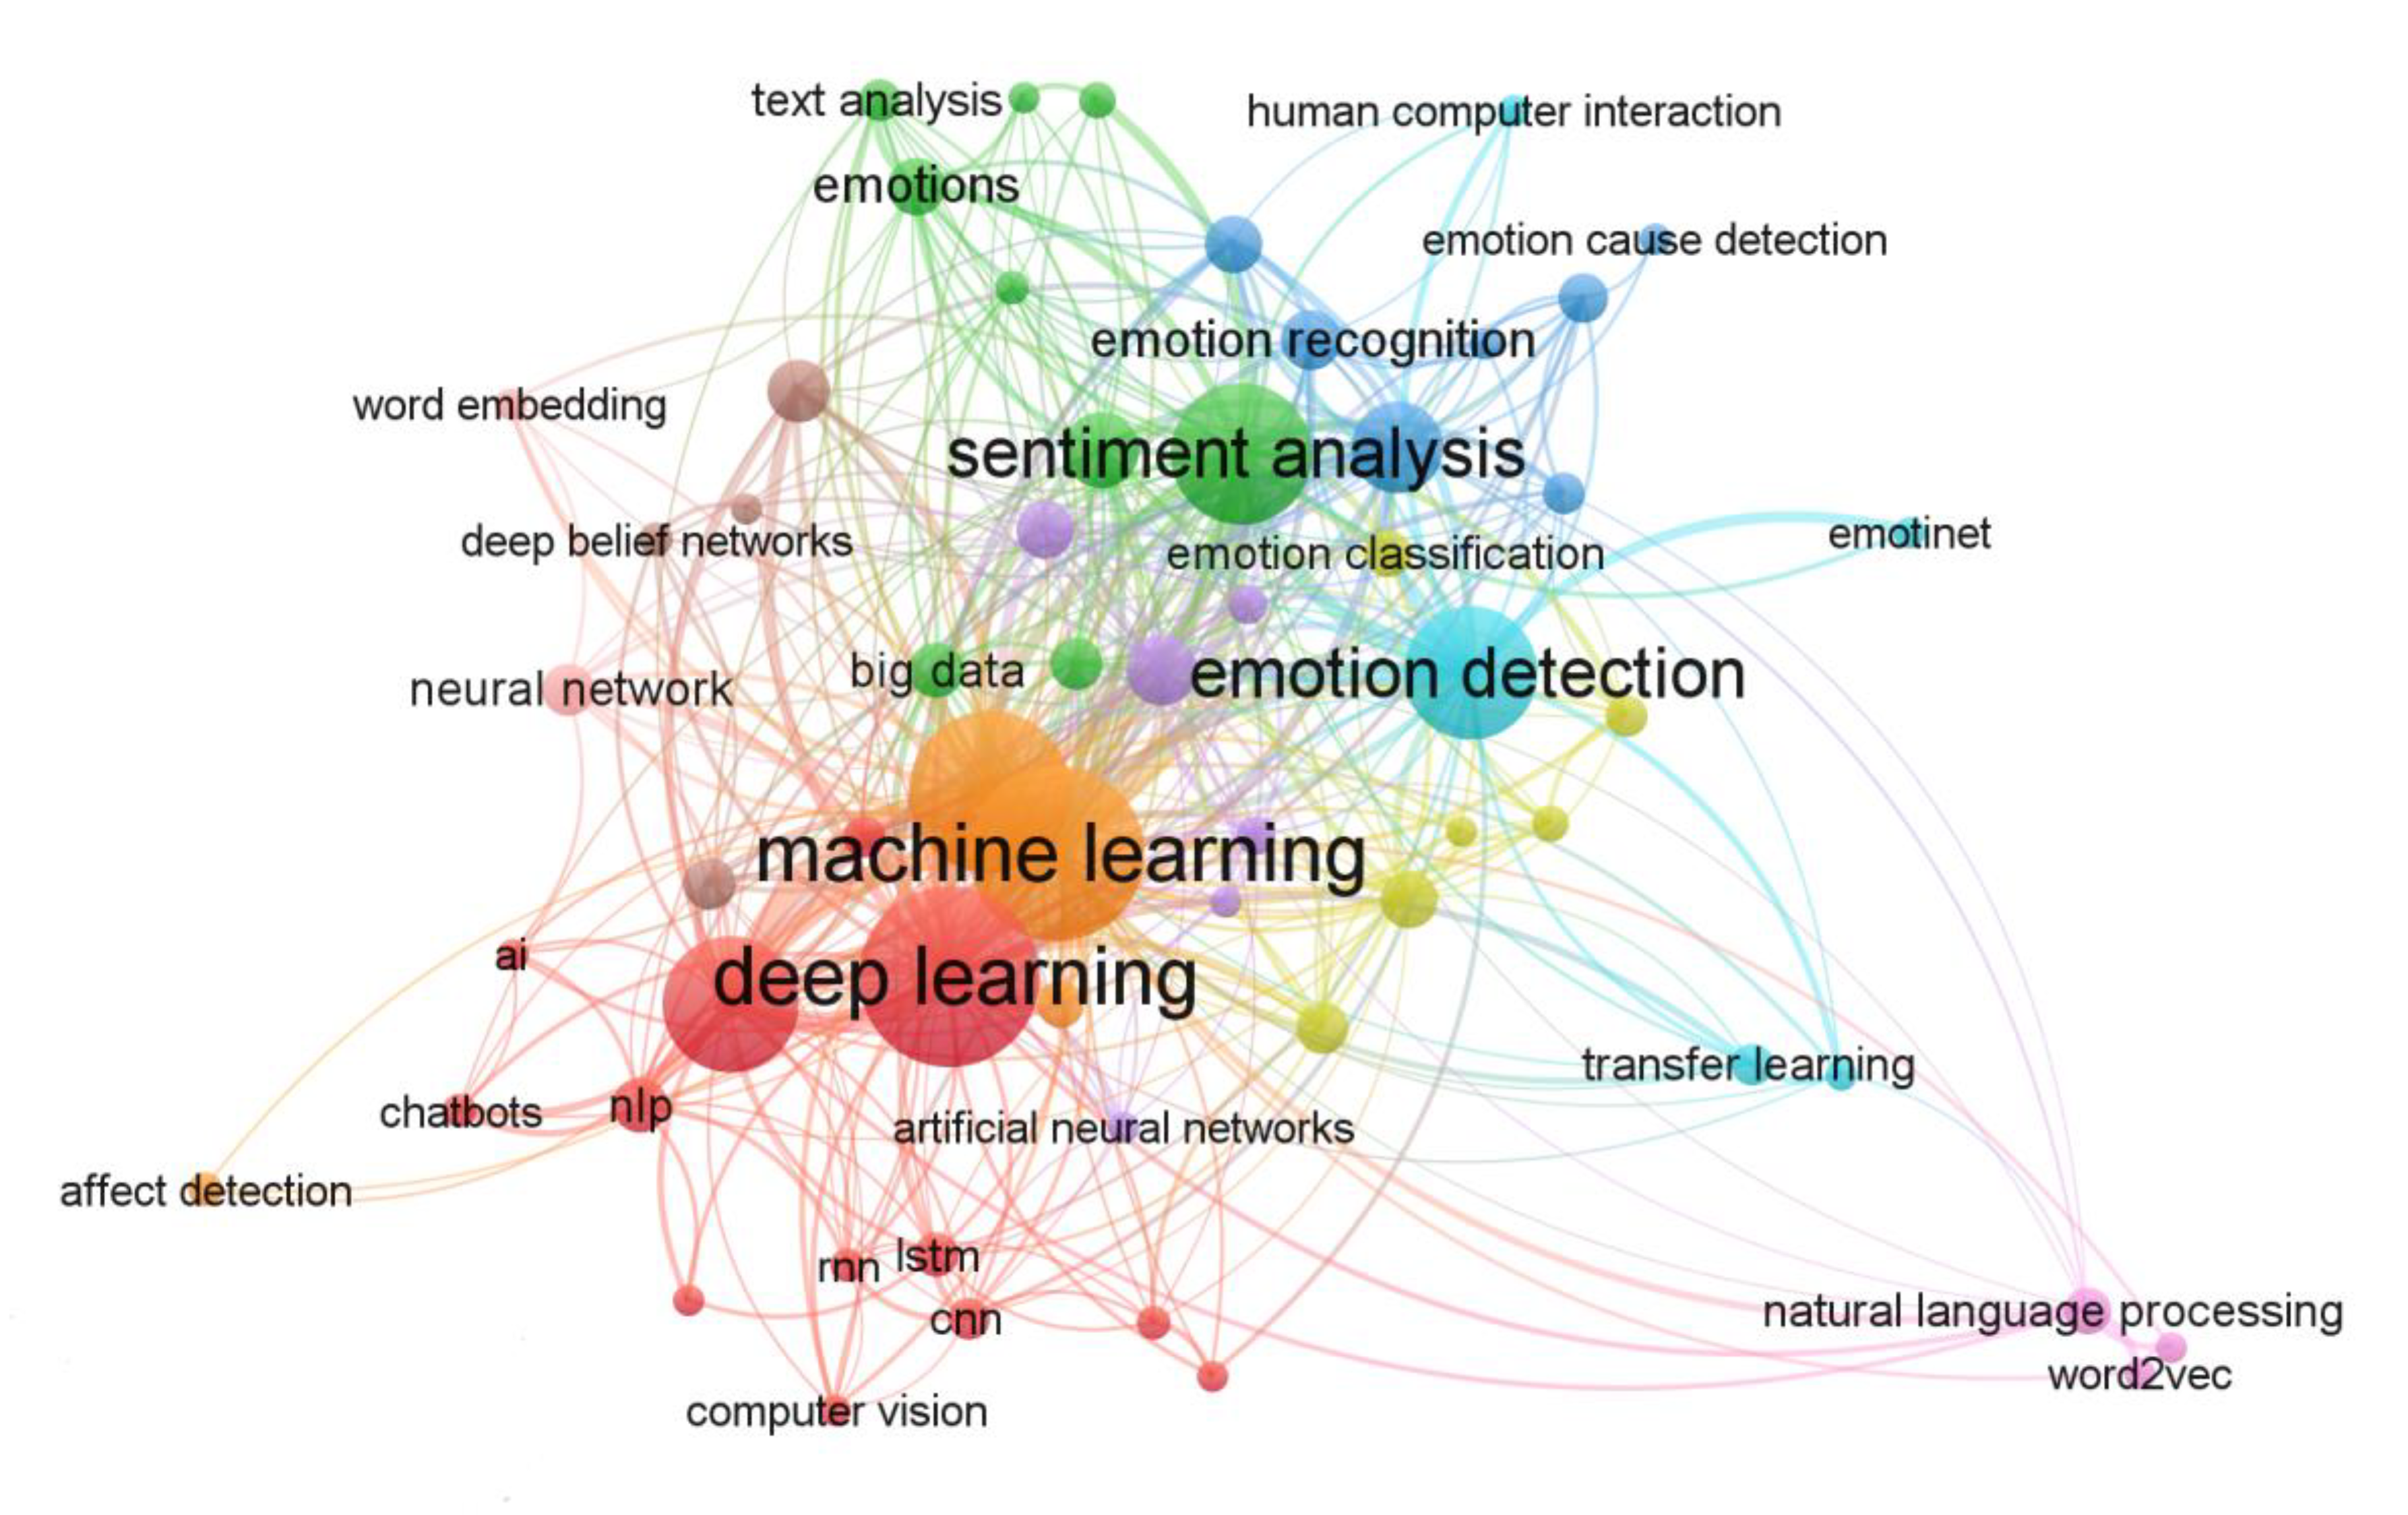
3.4.1. Analysis Based on Author Keyword Co-Occurrence

Authors or researchers use suitable keywords while retrieving the documents from databases. These keywords play a significant role in searching the documents. We focused on the authors’ keywords, which reflect the publications’ main research areas. A network diagram, a well-known bibliometric tool, was used to visualize the author keyword co-occurrence relationship. Each node in this figure represents a keyword, and an edge connecting two nodes represents the co-occurrence of two words. Initially, we obtained 1777 keywords as a result. We selected the keywords which have a minimum of five occurrences. Of the 1777 keywords, 64 met the threshold. Then, for each of the 64 keywords, the total strength of co-occurrence links with another keyword was calculated. The keywords with the greatest total link strength were selected. Then, we could verify the selected keywords and remove unwanted or repeated keywords. The keyword co-occurrence network diagram is shown in Figure 15.
We can examine that keywords with a high occurrence signify the research area’s scope, which consists of Deep Learning, Sentiment Analysis, Emotion Detection, and Machine Learning. Network analysis of Figure 15 is carried out using VOS Viewer. Table 14 highlights the top 20 author keywords, their total link strength, and occurrences

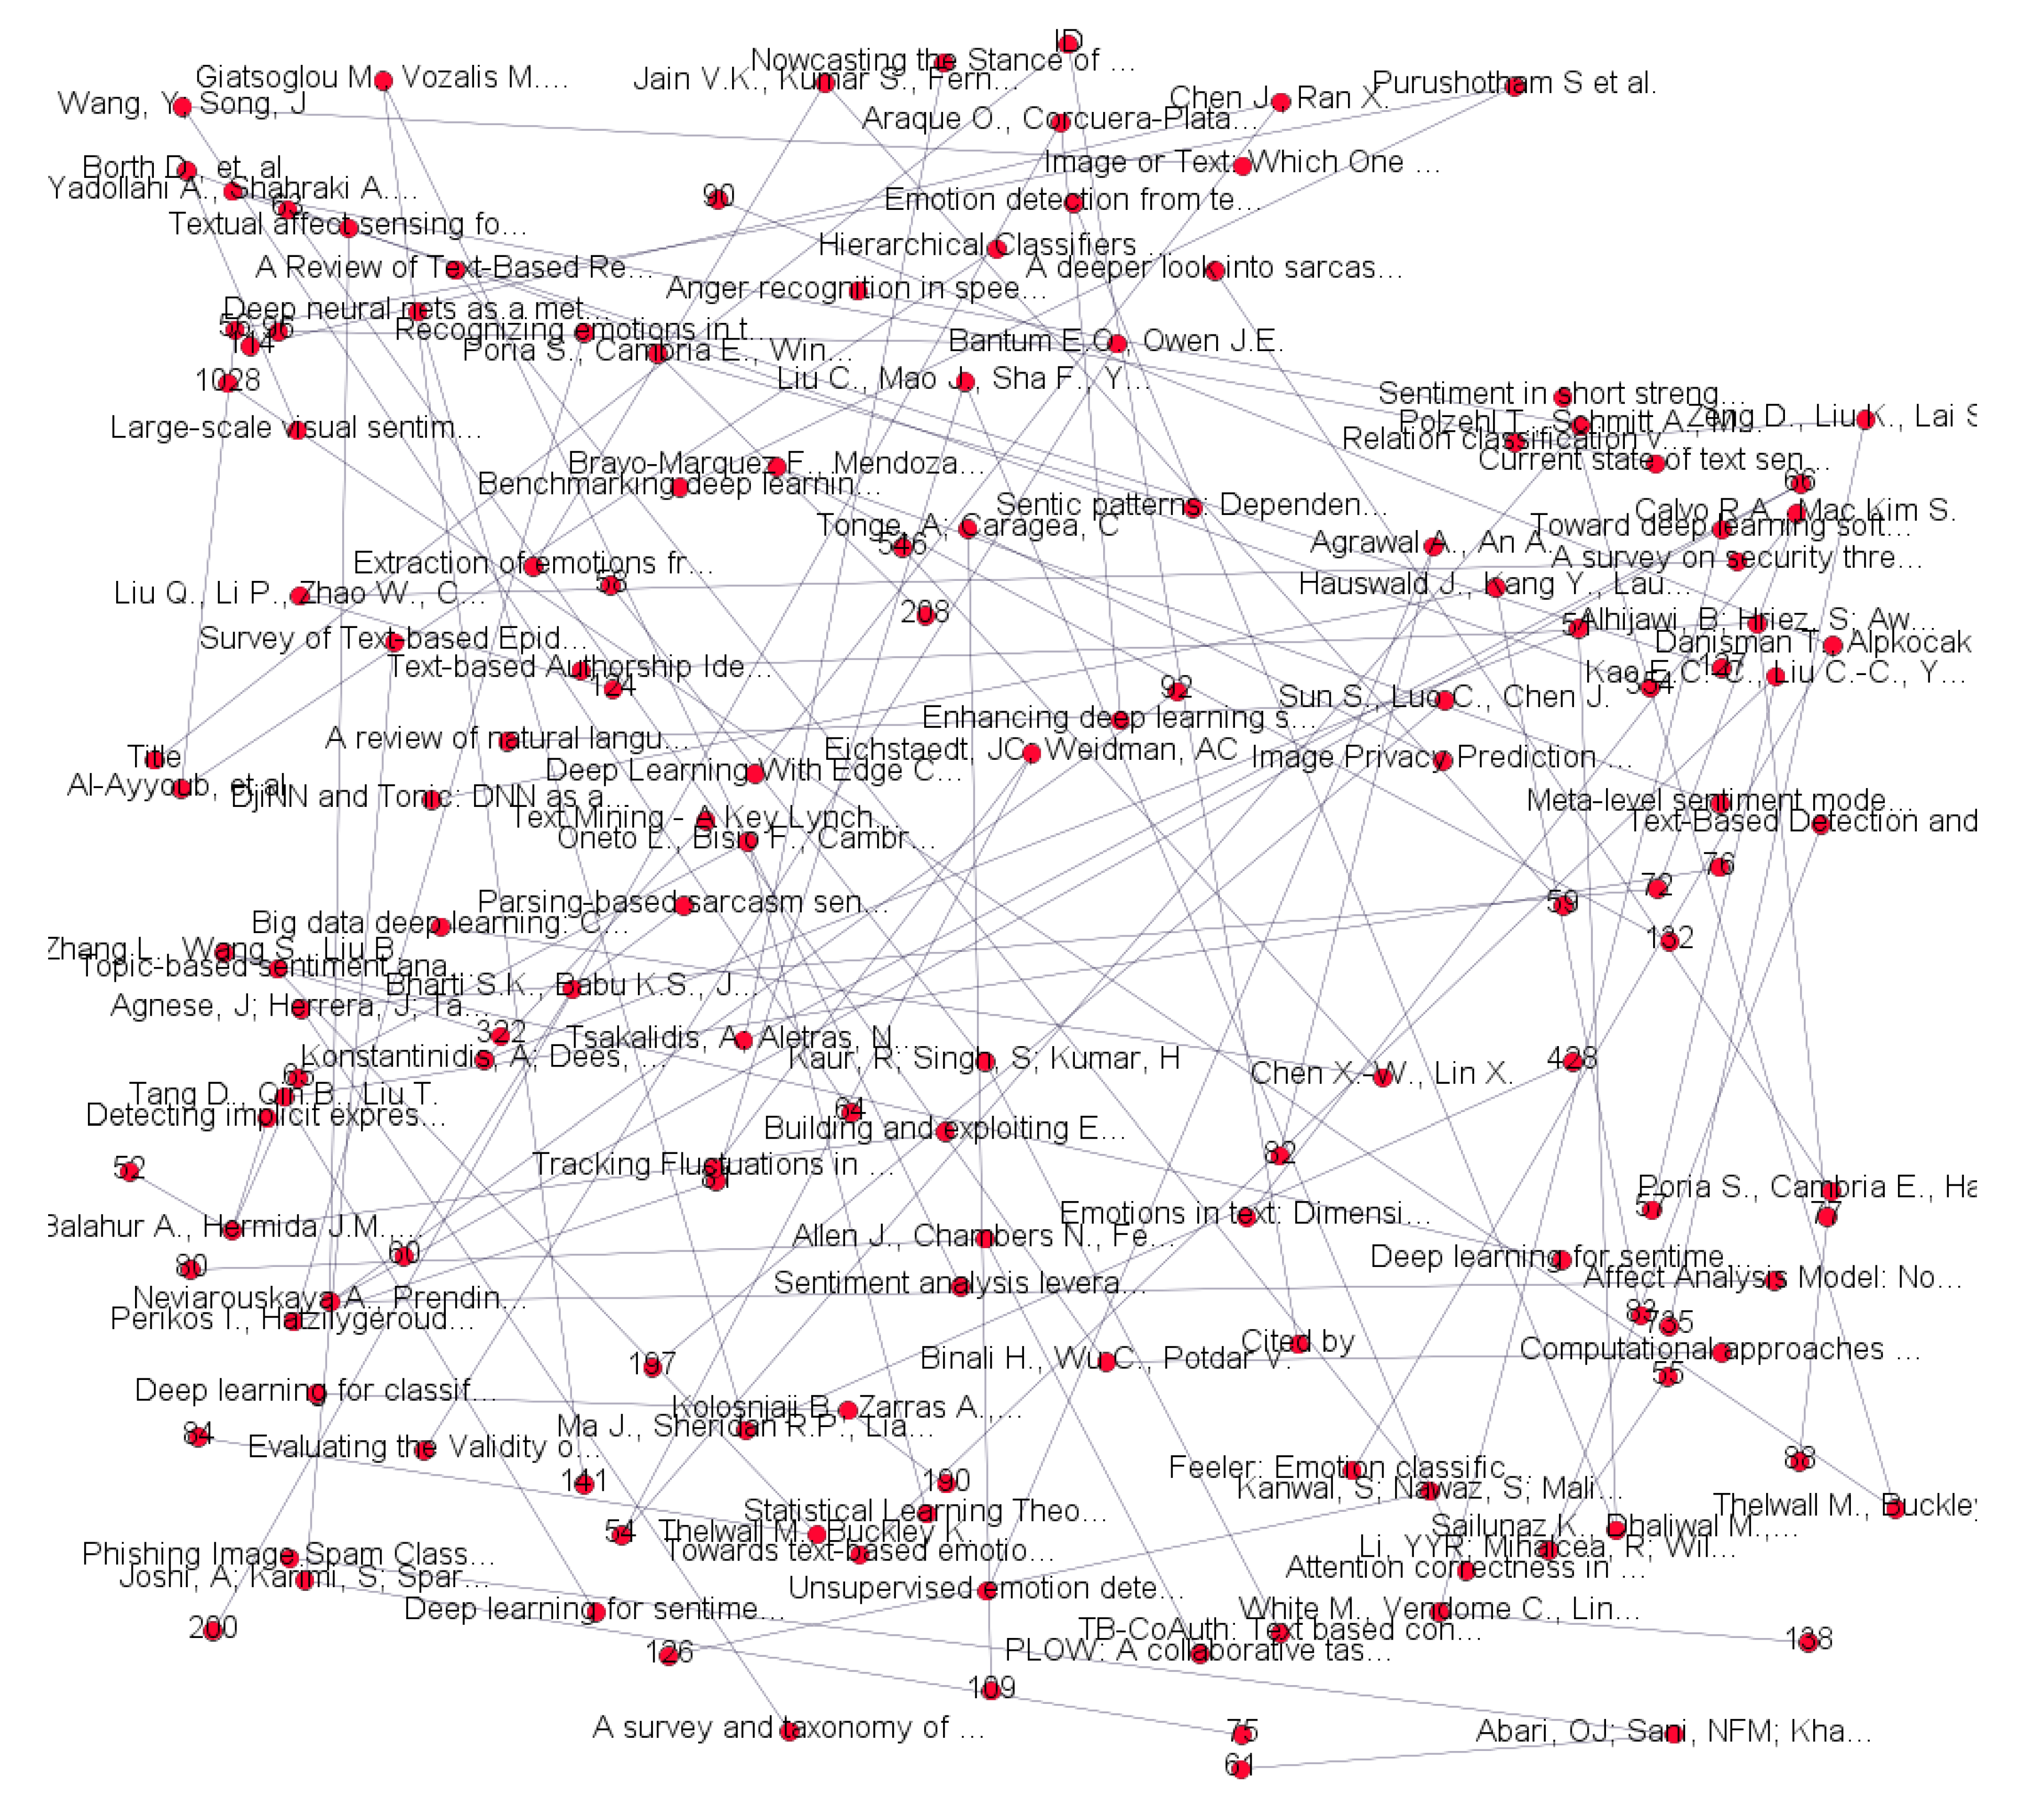
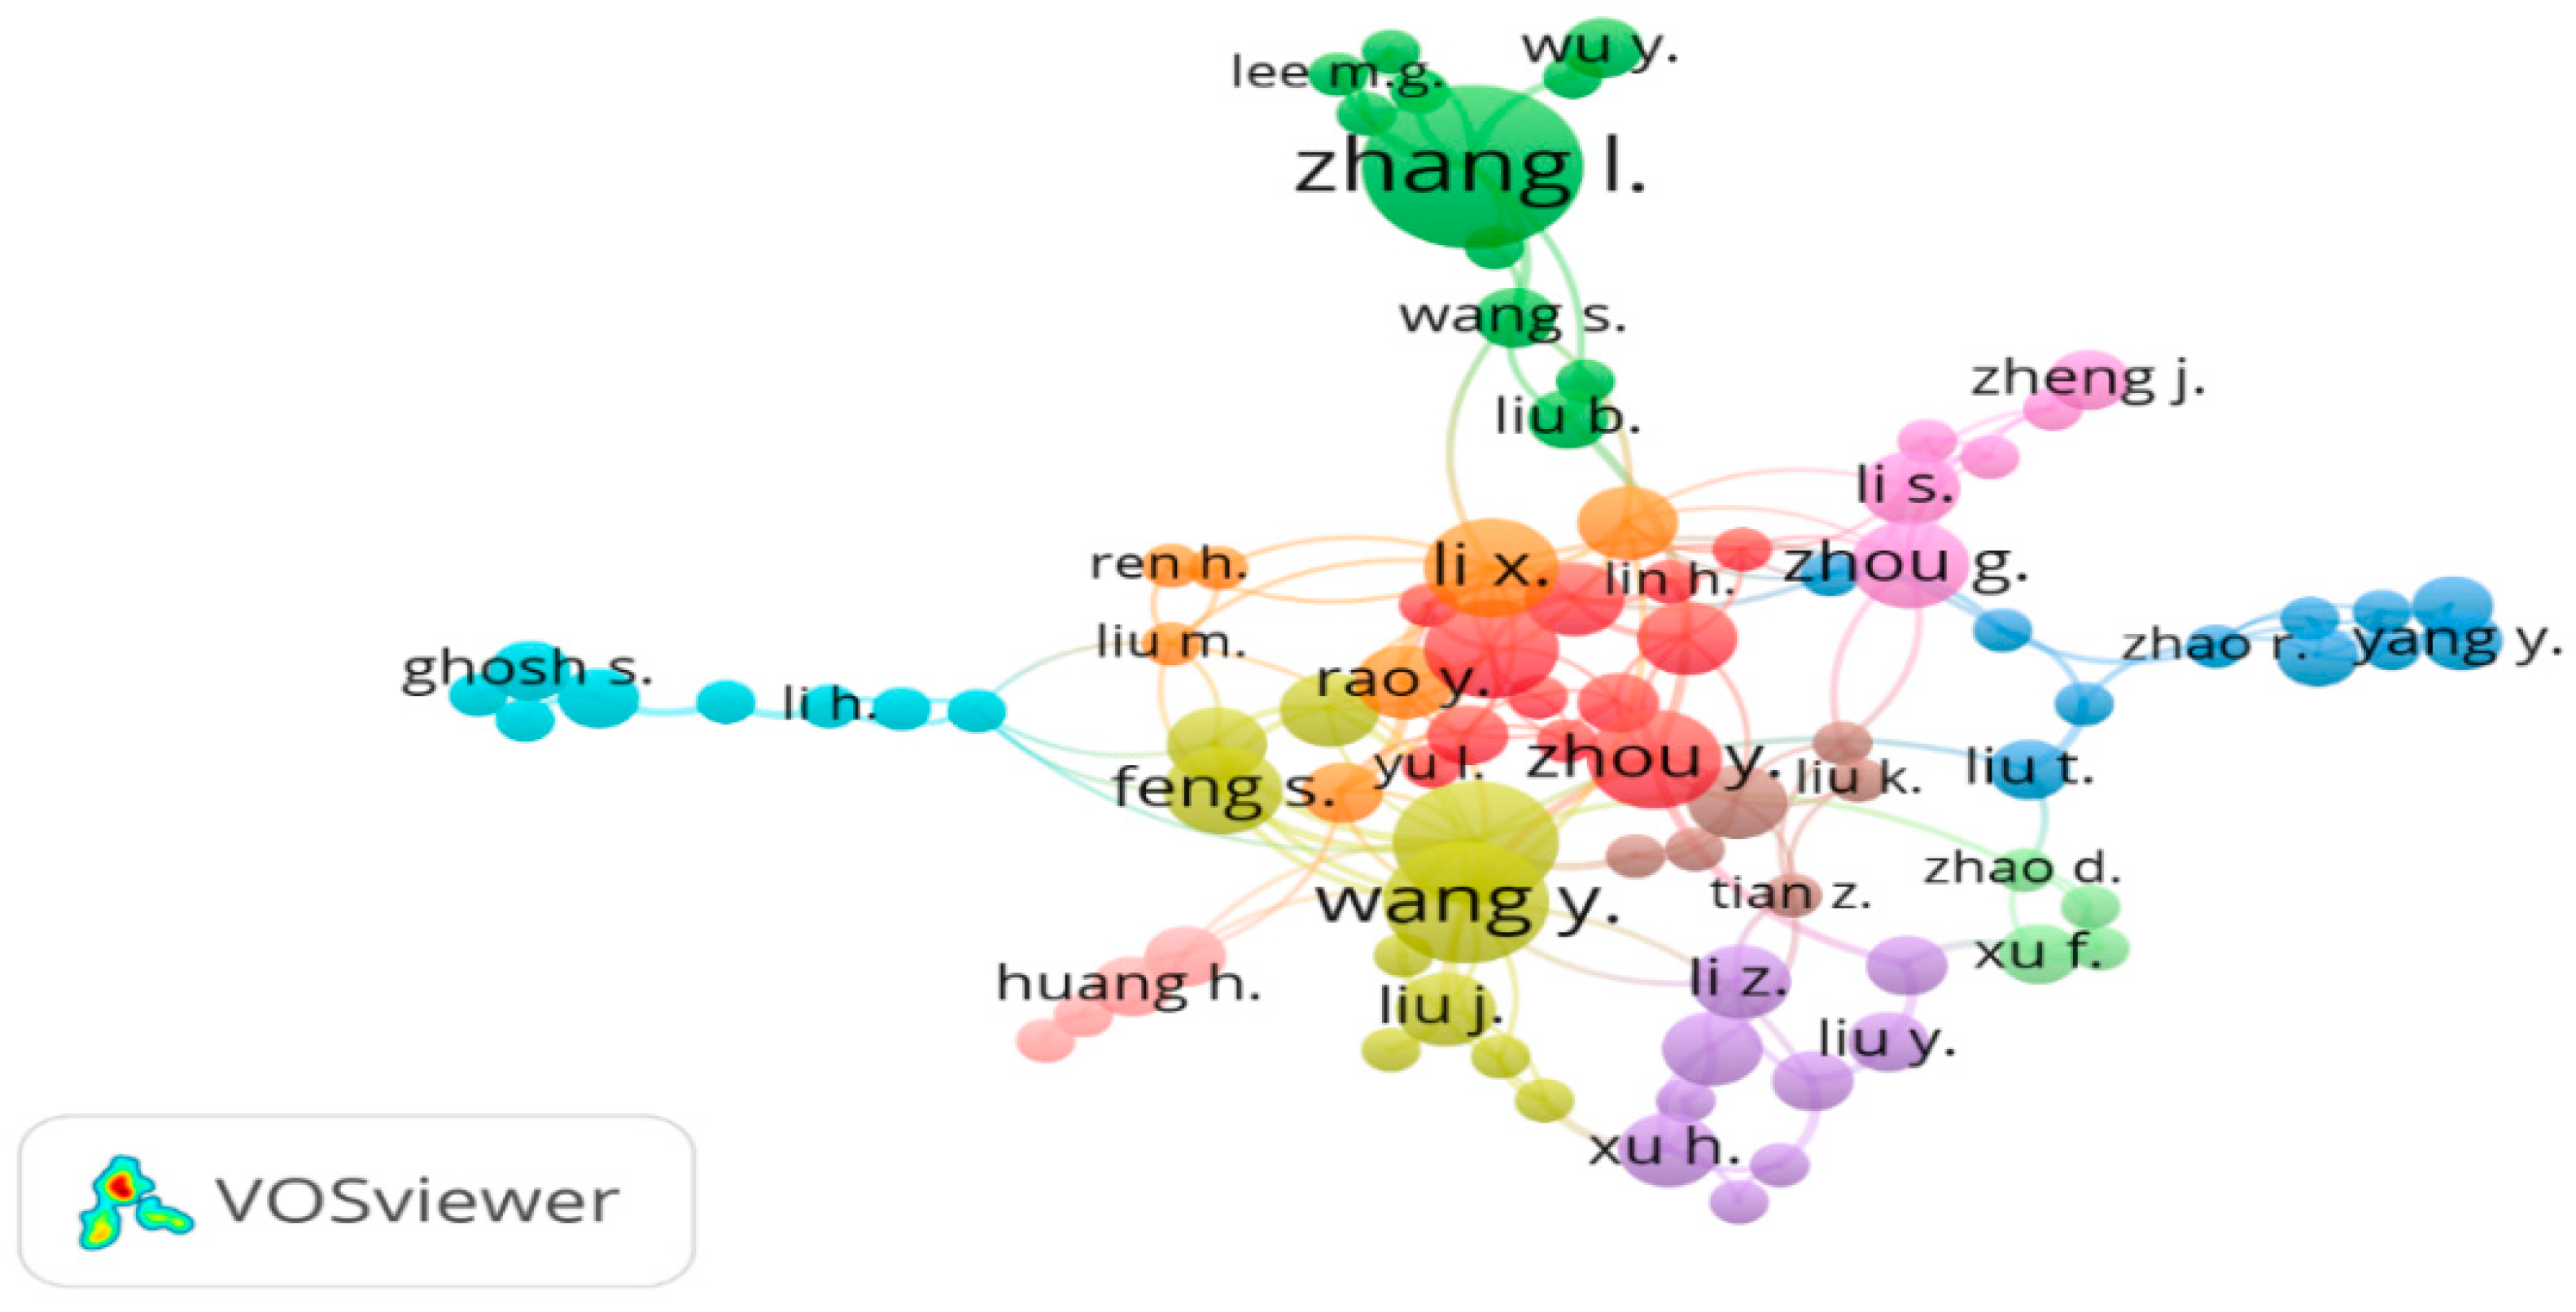
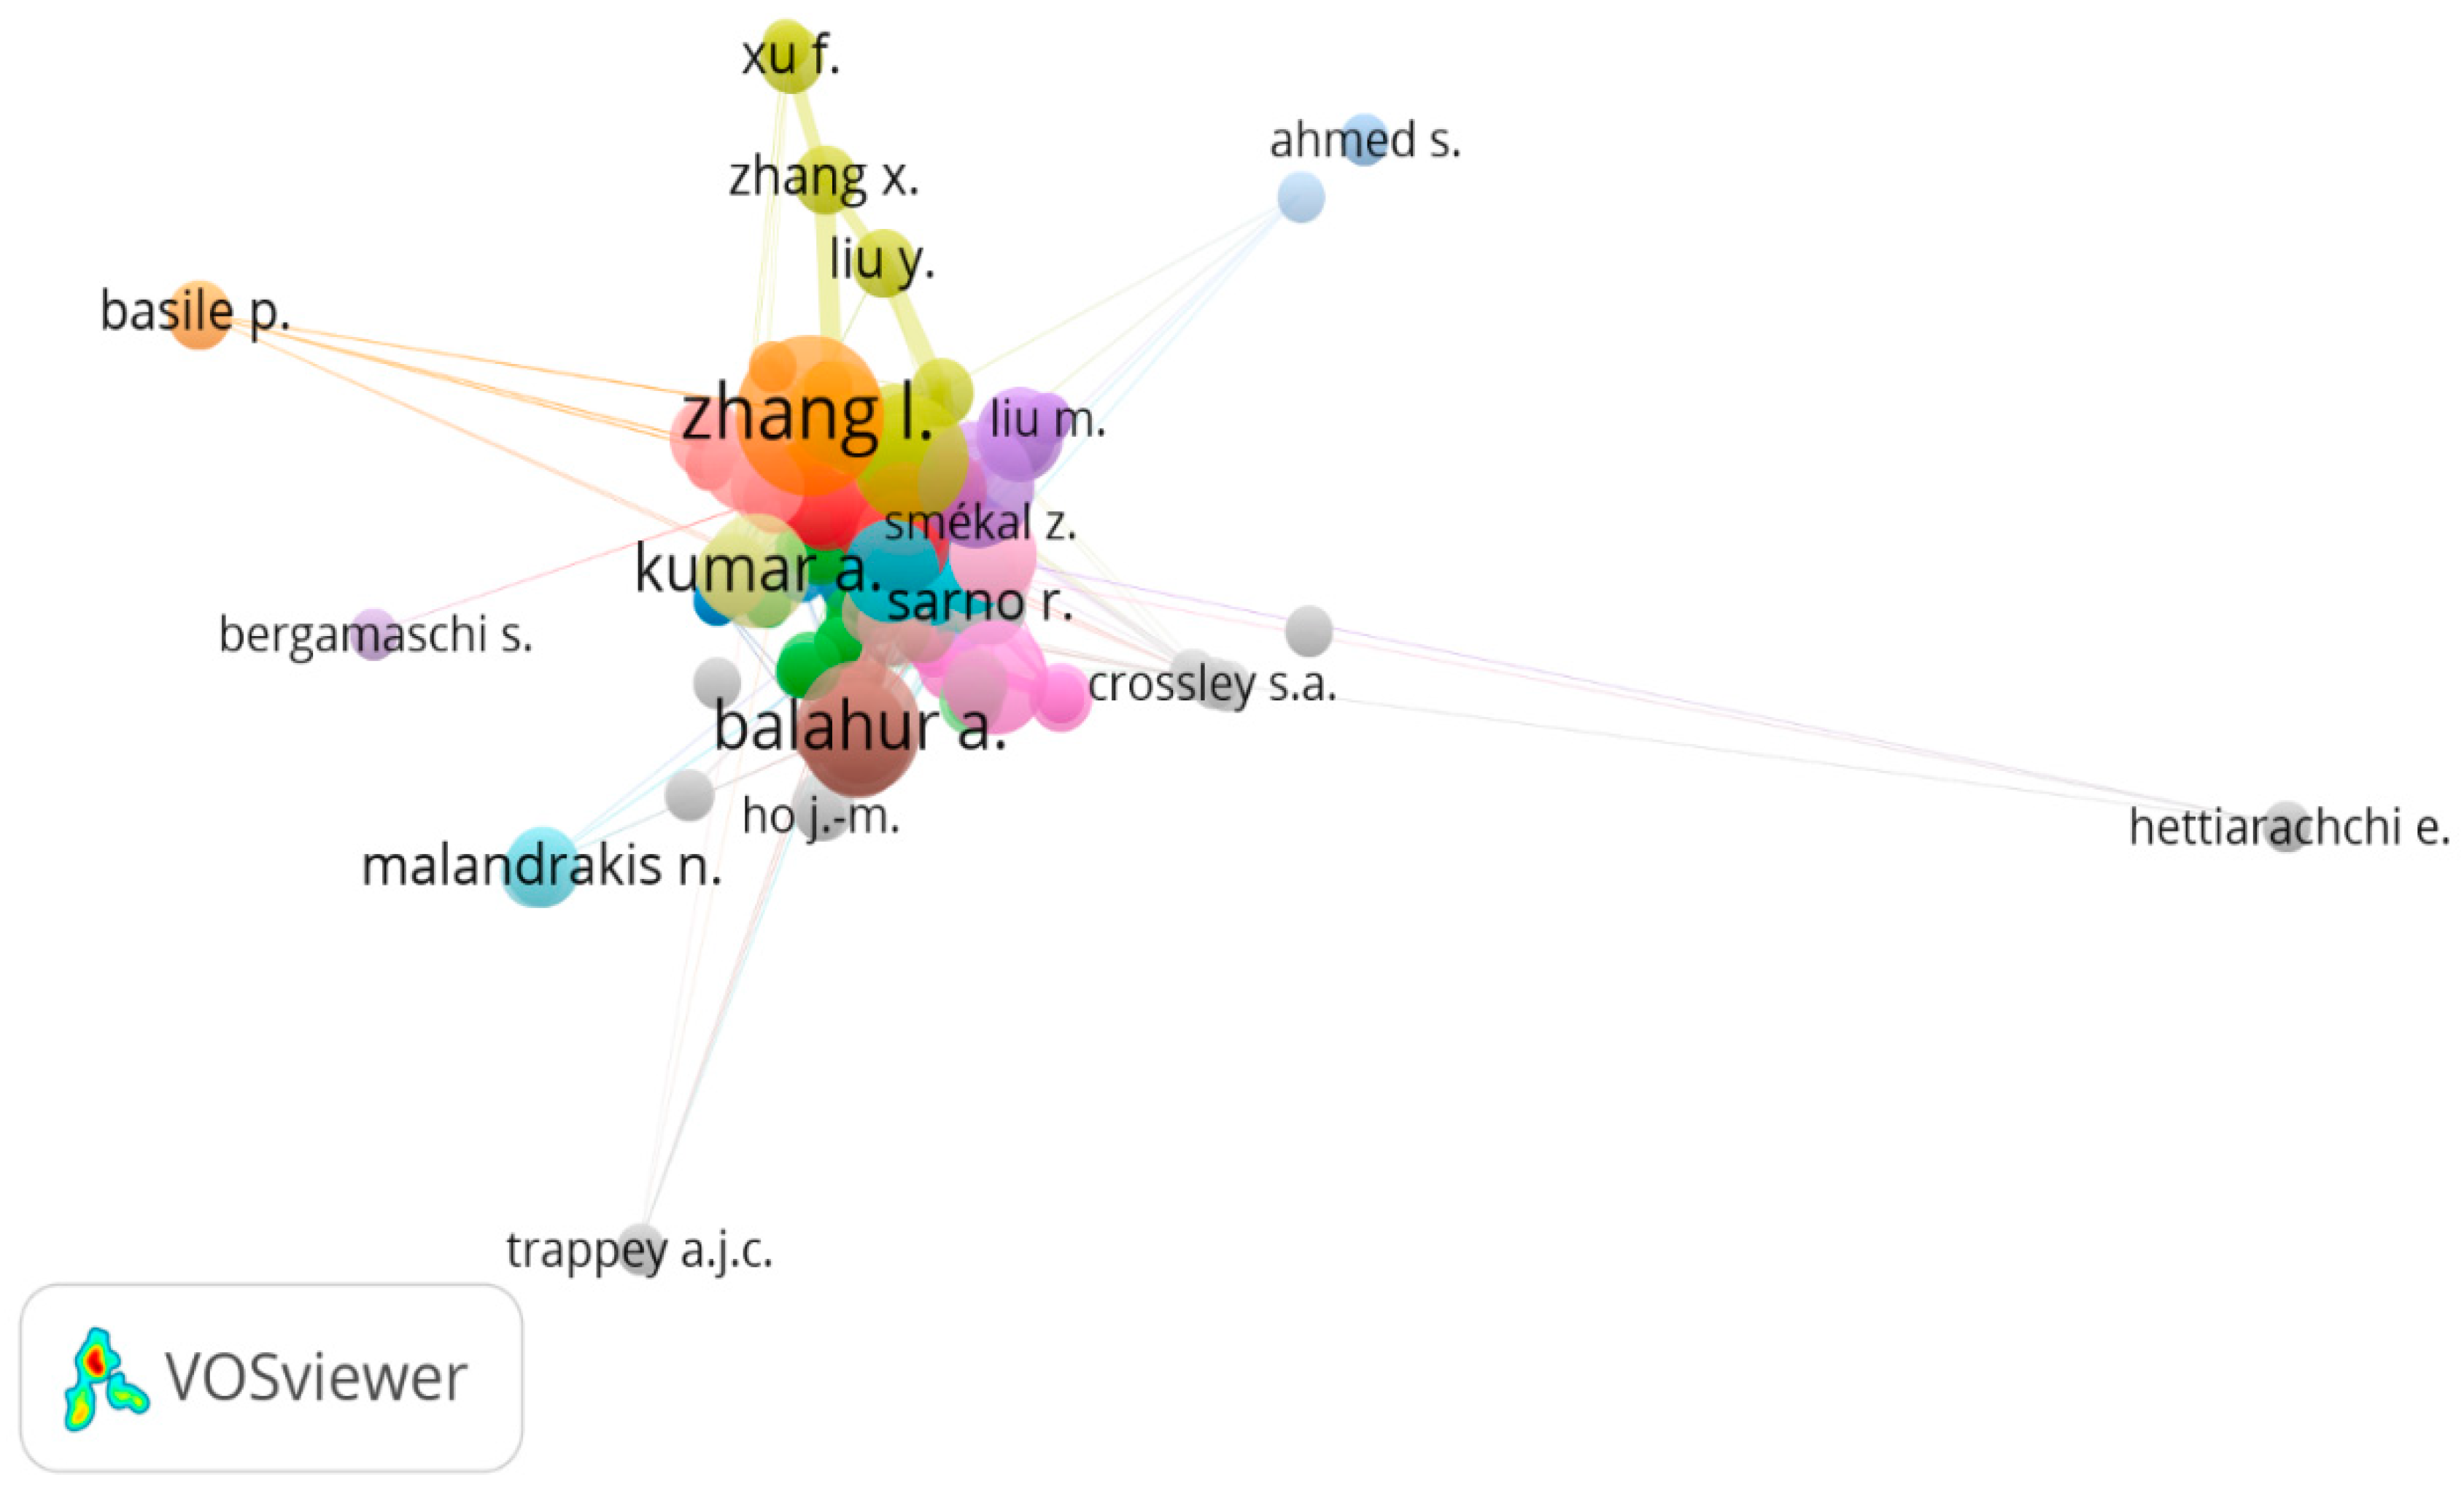
3.4.2. Analysis Based on Co-Authorship

Co-authorship is a form of collaboration in which two or more researchers report their findings on the same topic. As a result, co-authorship networks are regarded as groups of researchers who collaborate. Nodes in co-authorship networks reflect the researchers or authors. Initially, we obtained 2053 authors as a result.
We selected the authors who have two minimum numbers of documents and one minimum citation of the author. Of the 2053 authors, 207 met the threshold. Then for each of the 207 authors, the total strength of co-authorship links with other authors was calculated. First, the authors with the greatest total link strength were selected. Then only the largest set of connected authors were selected. Figure 16 shows the co-authorship network diagram. Table 15 shows the top 10 authors with their links and the number of published documents.

3.4.3. Analysis Based on Citations

Citation analysis is a method of determining the relative significance or influence of an author, an article, or a publication by counting the number of times other works have cited the author, document, or publication. To find out how much impact a particular article or author has had by showing which other authors cited the work within their papers. The yearly number of citations is presented in Table 16, from both Scopus and Web of Science databases. The number of citations per year has been steadily increasing. In 2020, 51,655 and 290 citations were noted on Scopus and Web of Science, respectively. Table 16 shows the citations received in text-based emotion detection from 2015 to 2021. It is observed from the table that, in the year 2020, the maximum citations were received. Table 17 and Table 18 show the top five publications from Web of Science and citation analysis of the top ten publications from Scopus. The alluvial diagram was designed by analyzing of top 20 highly cited documents in the field of study. Alluvial diagrams are a type of flow diagram originally developed to represent changes in network structure over time. In Figure 17, the alluvial diagram represents the association between authors, years, and source titles of highly cited 20 articles. The year 2014 has received the highest number of citations.

3.4.4. Analysis of Highly Cited Publications

In publication citation, we visualized the highest cited documents using a network diagram. The topmost cited publication was “Sentiment in short strength detection informal text” by Thelwall et al. (2010). Initially, in this analysis, we obtained 904 documents as a result. We selected the documents which have five minimum numbers of citations. Of the 904 documents, 282 met the threshold. Then, for each of the 282 documents, the number of citation links was calculated. The documents with the largest links were selected.
The documents with the largest citations are shown in the network diagram. In the network graph, we can observe that the top ten highly cited publications with the authors’ names are visible. The color chart on the bottom side depicts the degree of large correlation with the year of publication. The network analysis of Figure 18 is carried out using VOS Viewer.

3.4.5. Analysis of Highly Cited Authors

In author citation, we visualized the highest cited author using a network diagram. Initially, we obtained 2053 authors as a result. Next, we selected the documents which have a minimum of 1 (one) document per author and a minimum of 1 (one) number of citations of an author. Of the 2053 documents, 1426 met the threshold. Afterward, for each of the 1426 documents, the number of citation links with another author was considered. The authors with the greatest total links were chosen. From the total link, the largest set of connected items consists of 247 authors. The authors with the largest citations are shown in the network diagram. The sizes of the circles in Figure 19 suggest the authors with large citations. Table 19 shows the highest cited authors with links and number of citations.

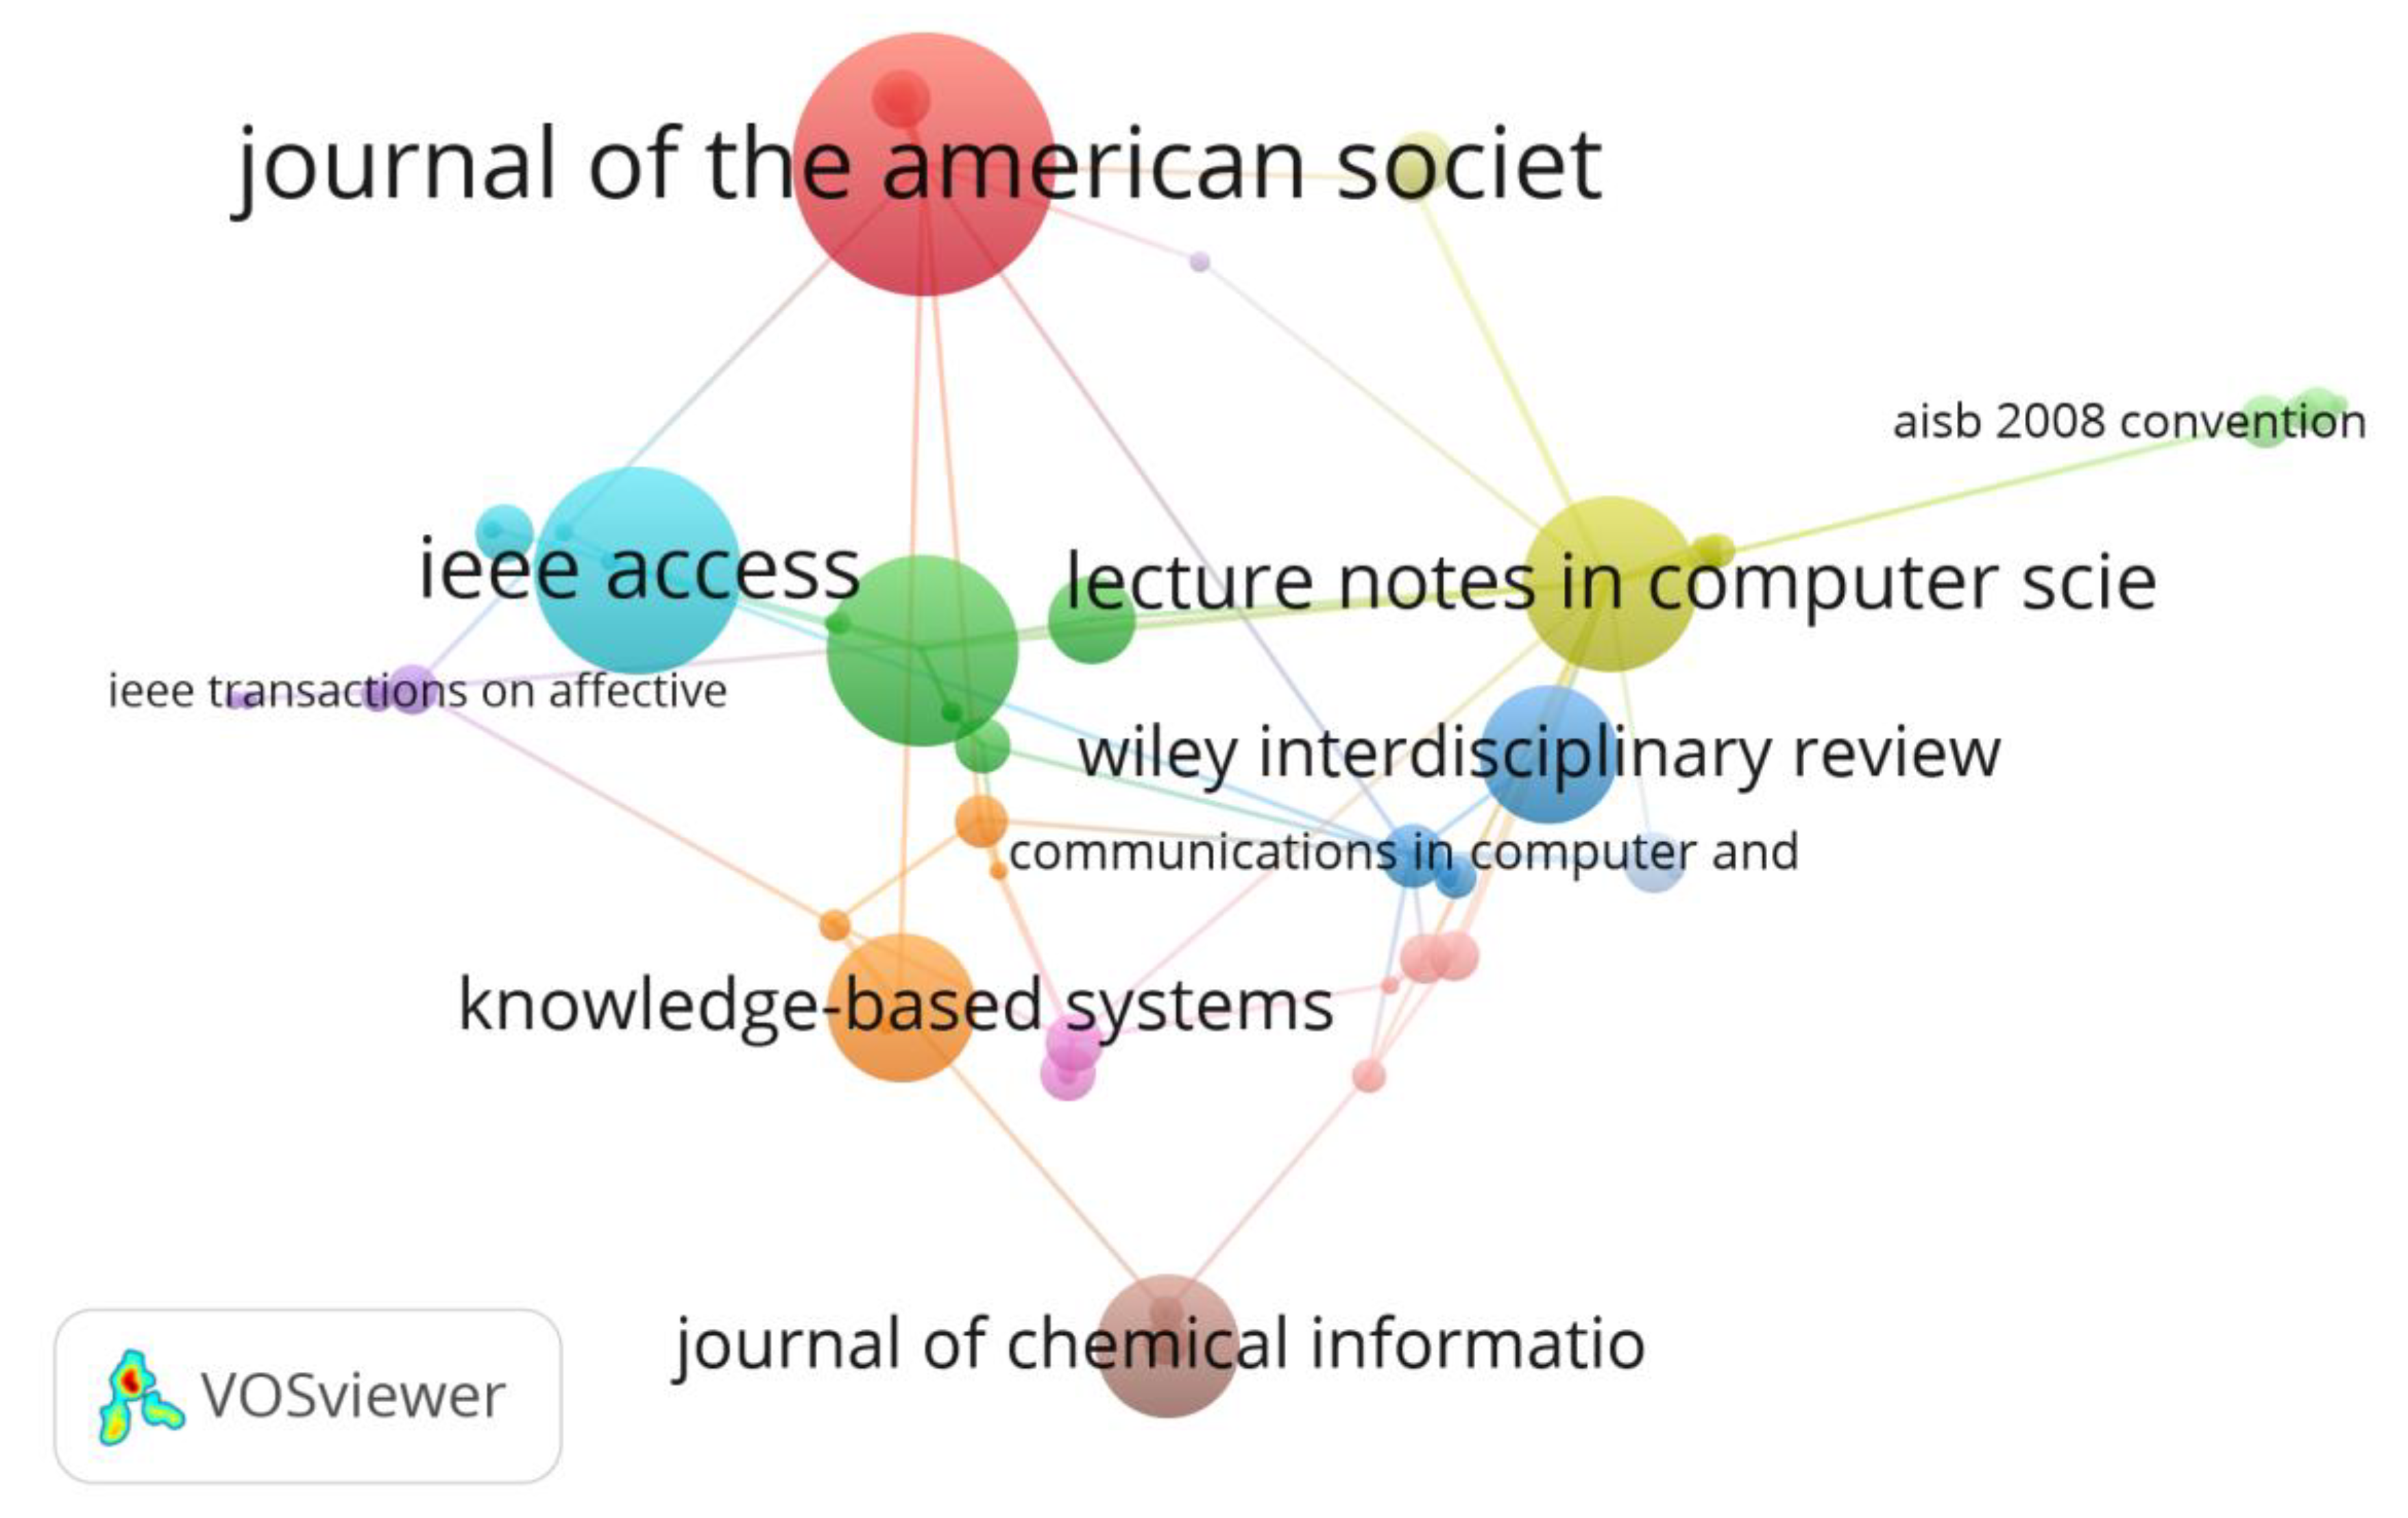
3.4.6. Analysis of Highly Cited Sources

In source citation, we visualized the highest cited sources using a network diagram. Initially, we obtained 493 sources as a result. Then we selected the sources which have a minimum of 1 (one) number of source documents and a minimum of 1 (one) number of citations of the source. Of the 493 documents, 342 met the threshold. After that, for each of the 342 sources, the number of citation links with other sources was determined. Finally, the sources with the greatest total links were chosen. From the selected link, the largest set of connected items consists of 63 sources. The sources with the largest citations are shown in the network diagram. The sizes of the circles in the diagram suggest the sources with large citations. Figure 20 shows the highest cited sources. Table 20 shows highly cited sources, links, citations, and publication year.

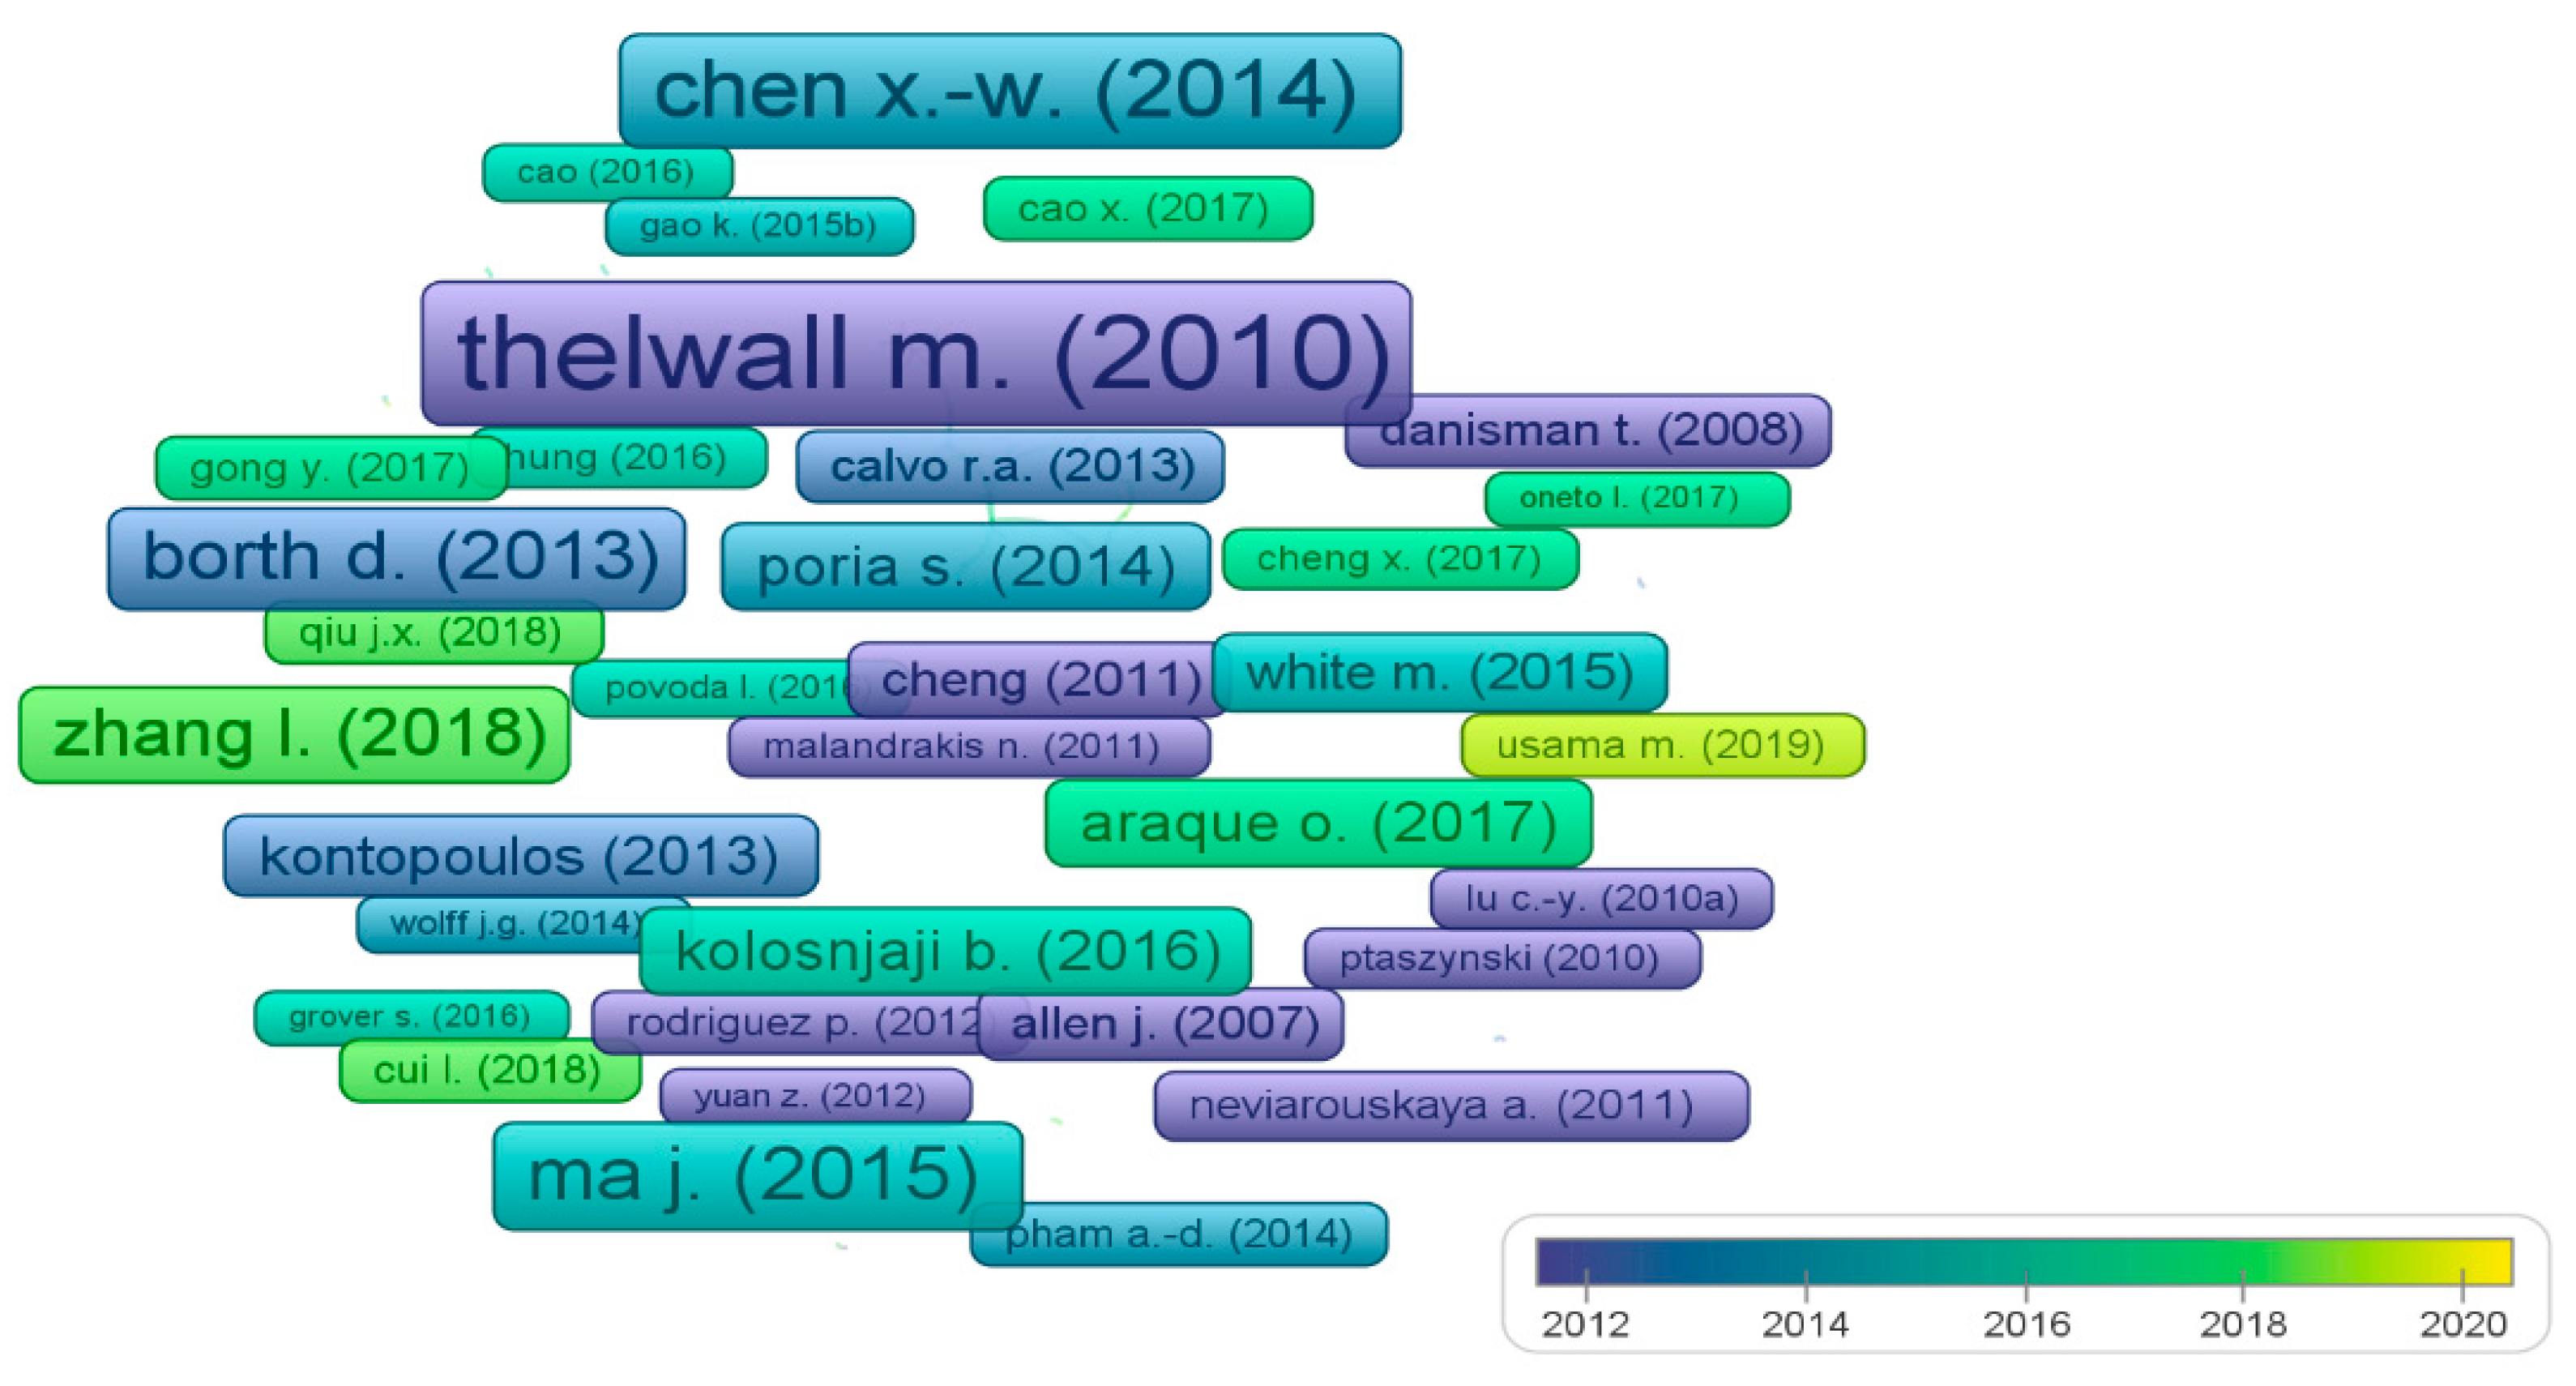
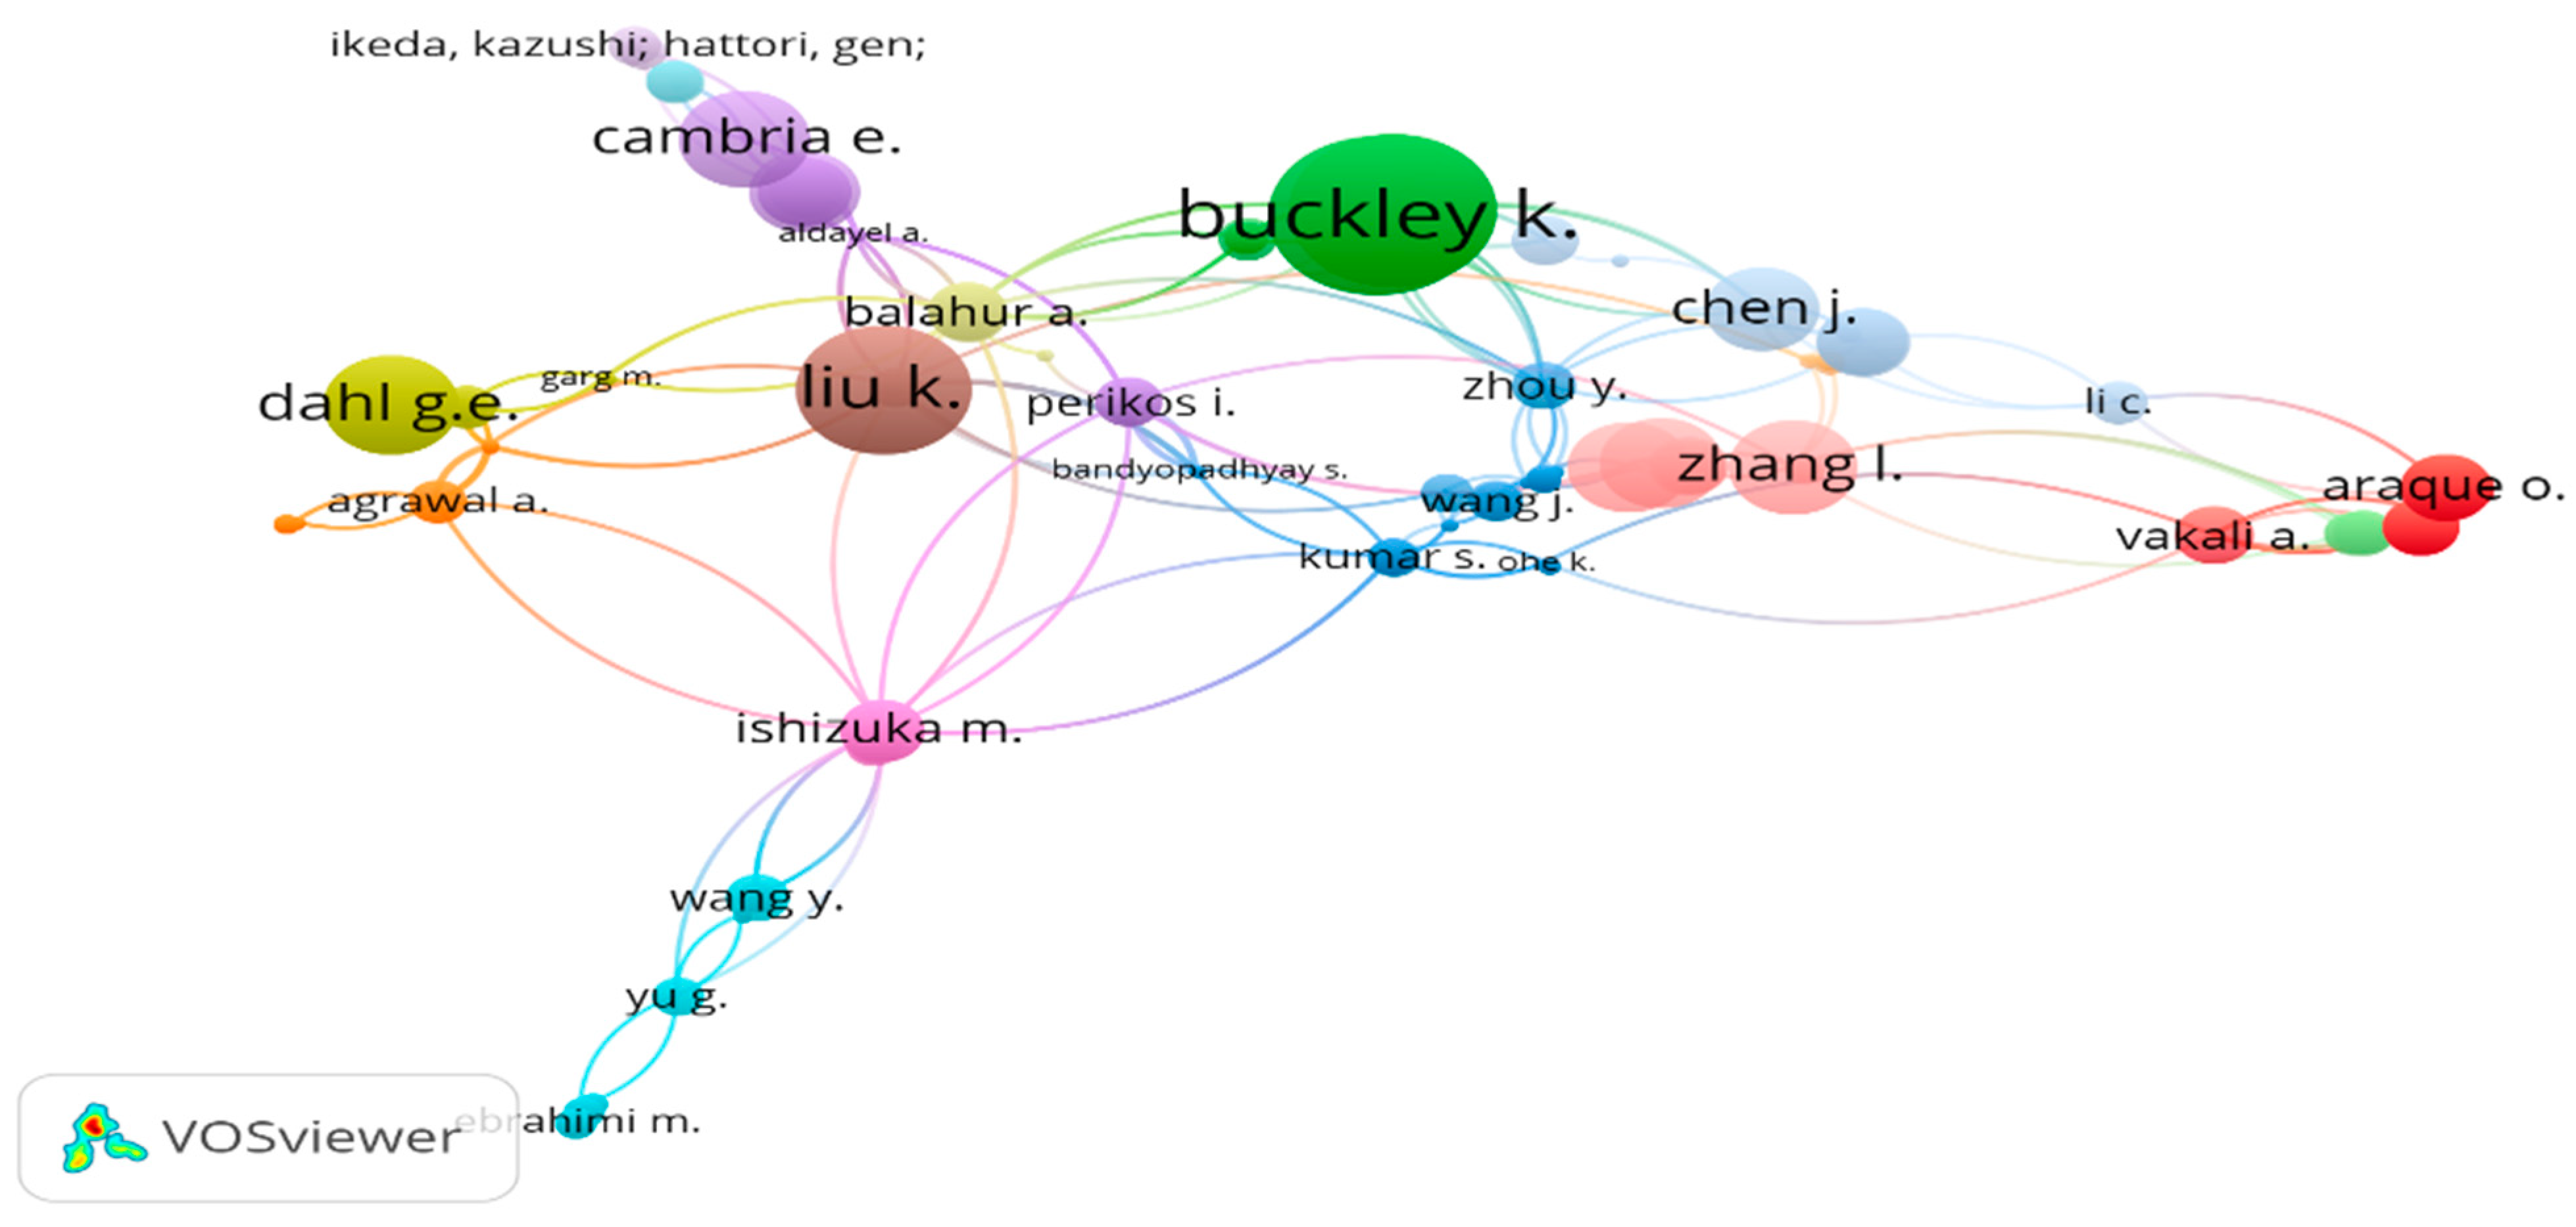
3.4.7. Analysis Based on Author Bibliographic Coupling

When two works in their bibliographies refer to a third common work, this is known as bibliographic coupling. Two documents are bibliographically coupled if they both cite one or more documents in common. Author Bibliographic Coupling (ABC) states that two researchers who have more common references are more related and have common research interests. In this analysis, we obtained 2053 authors as a result. We selected documents with a minimum of 2 (two) documents per author and a minimum of 2 (two) citations. Of the 2053 documents, 201 met the threshold. After that, for each of the 201 documents, the number of citation links with another author was determined. Finally, the authors with the greatest total links were chosen. From the total link, the largest set of connected items consisted of 190 authors. Thus, author Zhang et al. have large bibliographic coupling.
The authors with the largest citations are shown in the network diagram. The sizes of the circles in Figure 21 suggest authors with large bibliographic couplings. Table 21 shows authors with bibliographic coupling, links, total strength links, and citations.

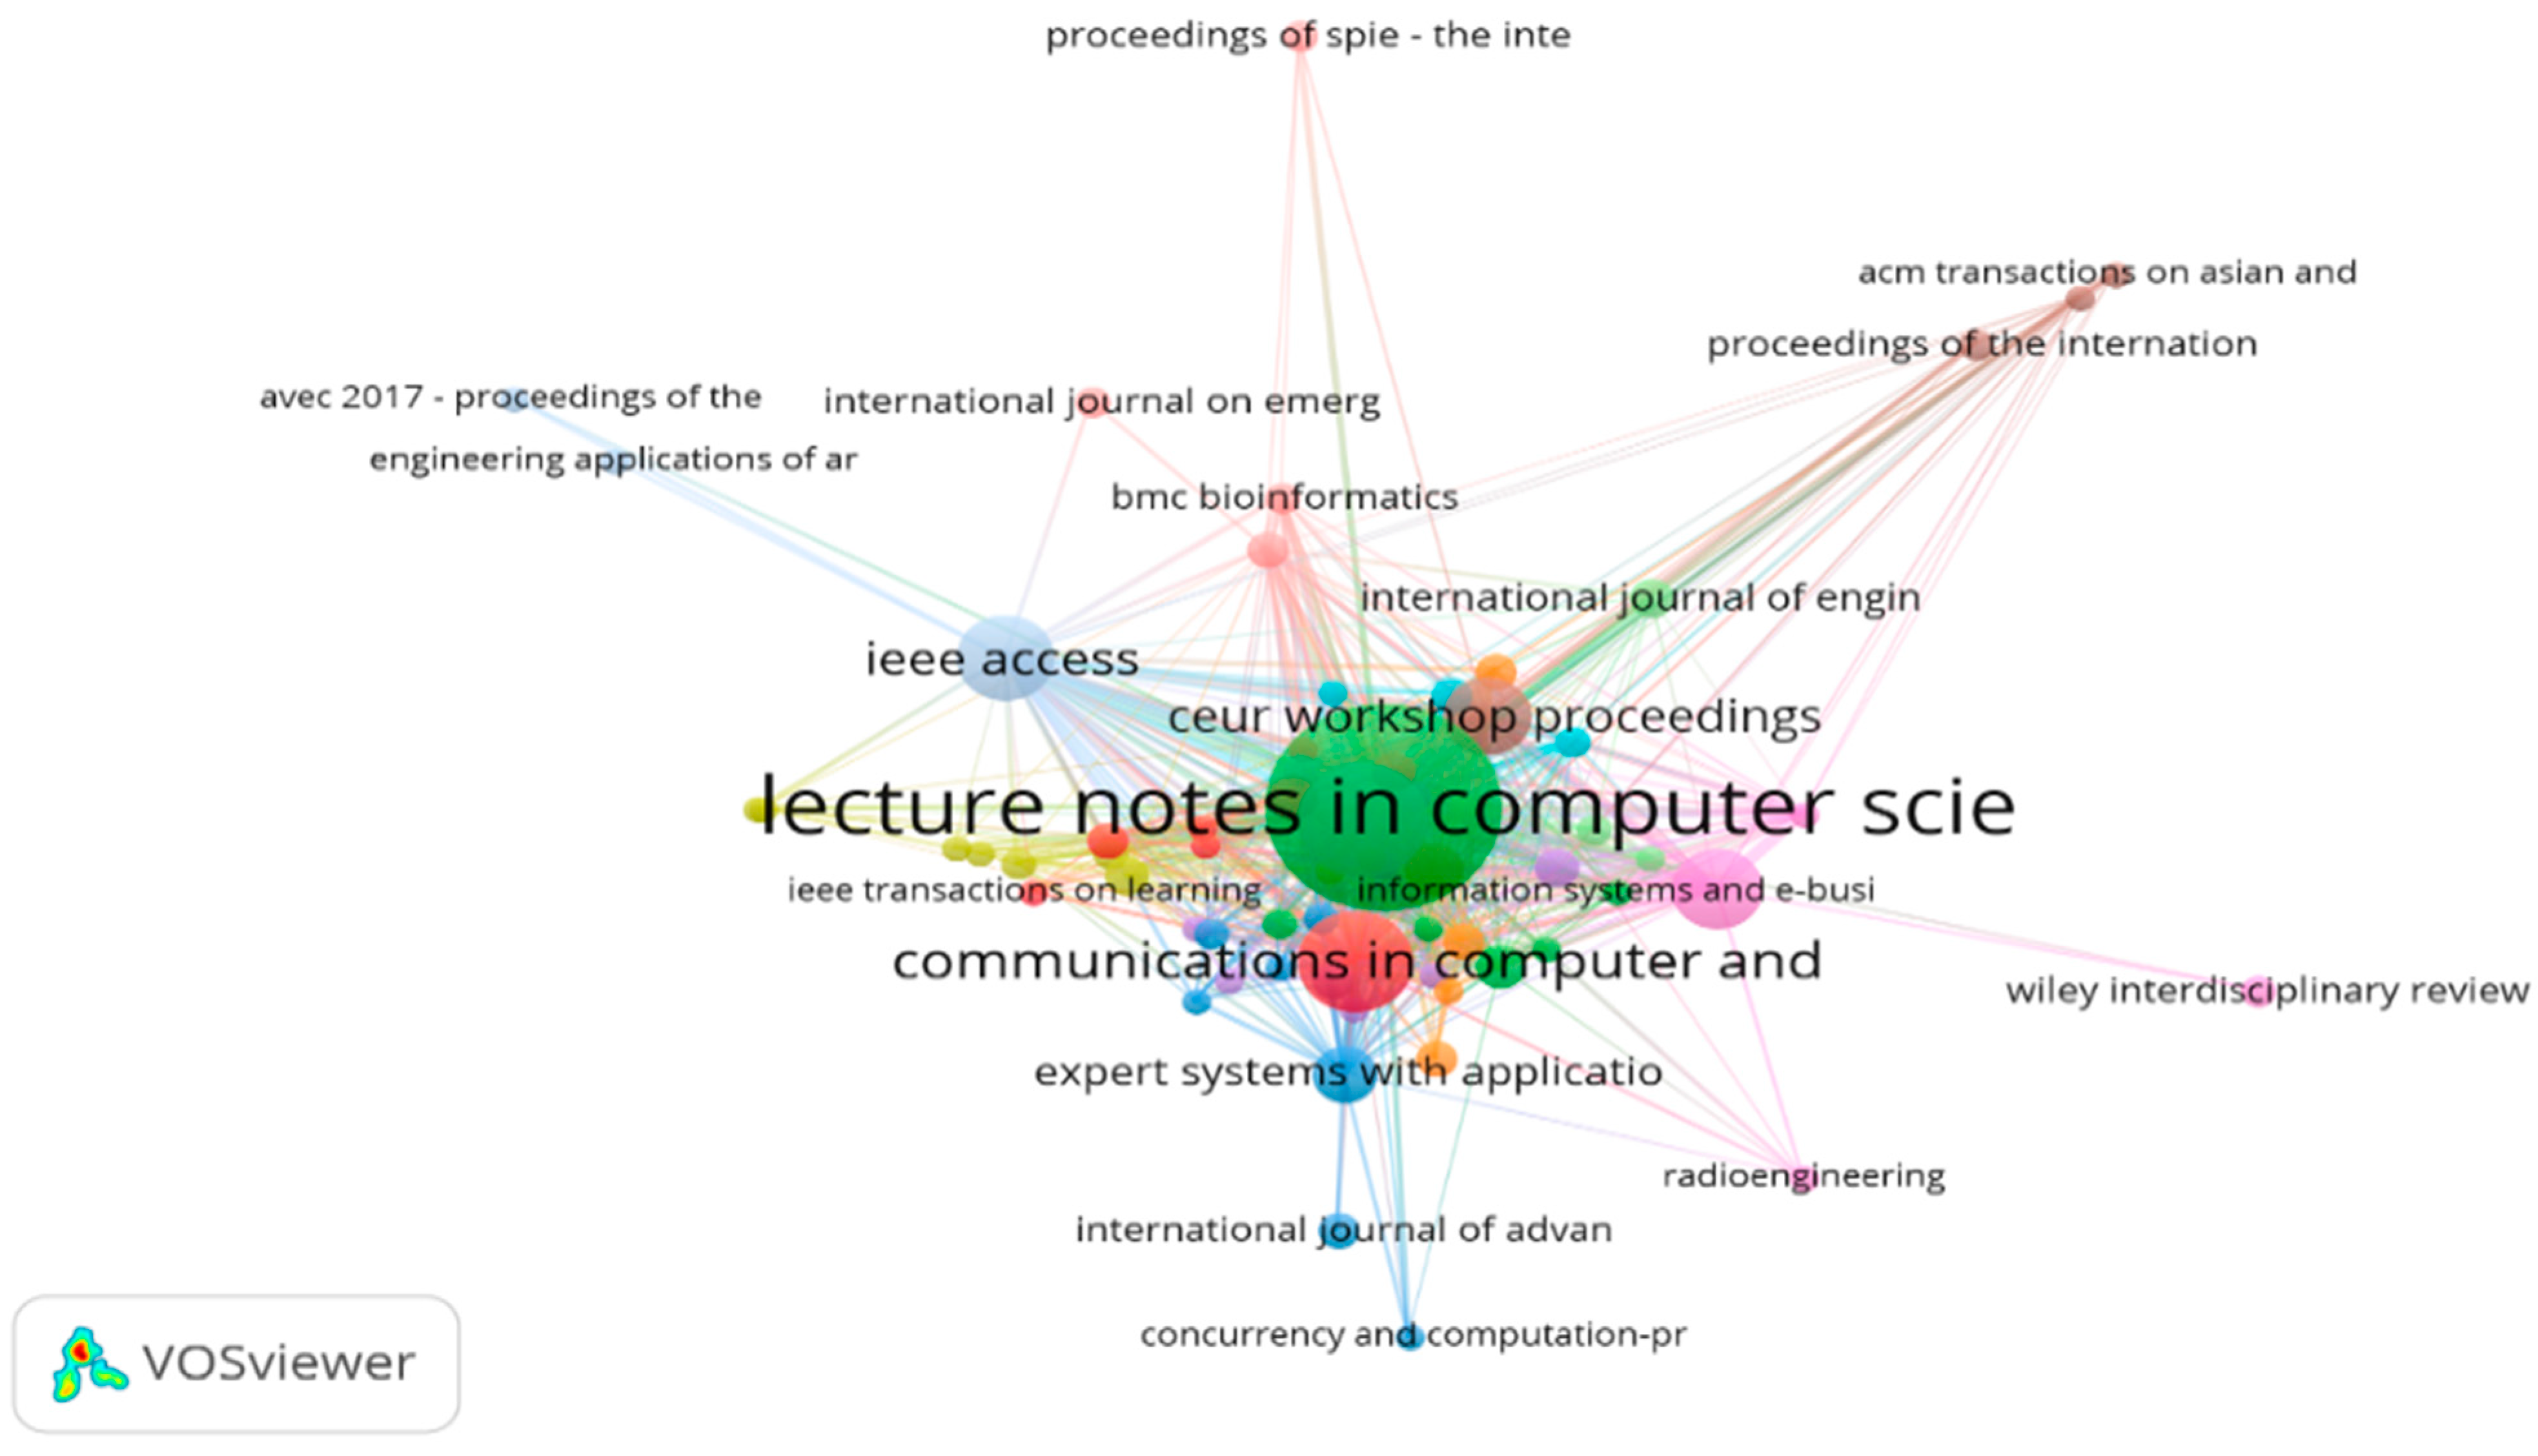
3.4.8. Analysis Based on Source Bibliographic Coupling

Source Bibliographic Coupling (SBC) is when two authors have a common reference or common source. Initially, we obtained 493 sources as a result. Then we selected the sources with a minimum of 2 (two) number of documents of source and a minimum of 2 (two) number of citations of the source. Of the 493 documents, 72 met the threshold. Then, for each of the 72 sources, the number of citation links with other sources was determined. The sources with the greatest total links were chosen. From the selected link, the largest set of connected items consists of 67 sources. The sizes of the circles in Figure 22 suggest the sources with large bibliographic coupling. “Lecture Notes in Computer Science” has a large source bibliographic coupling. Table 22 shows sources with bibliographic coupling, links, total strength links, and documents.

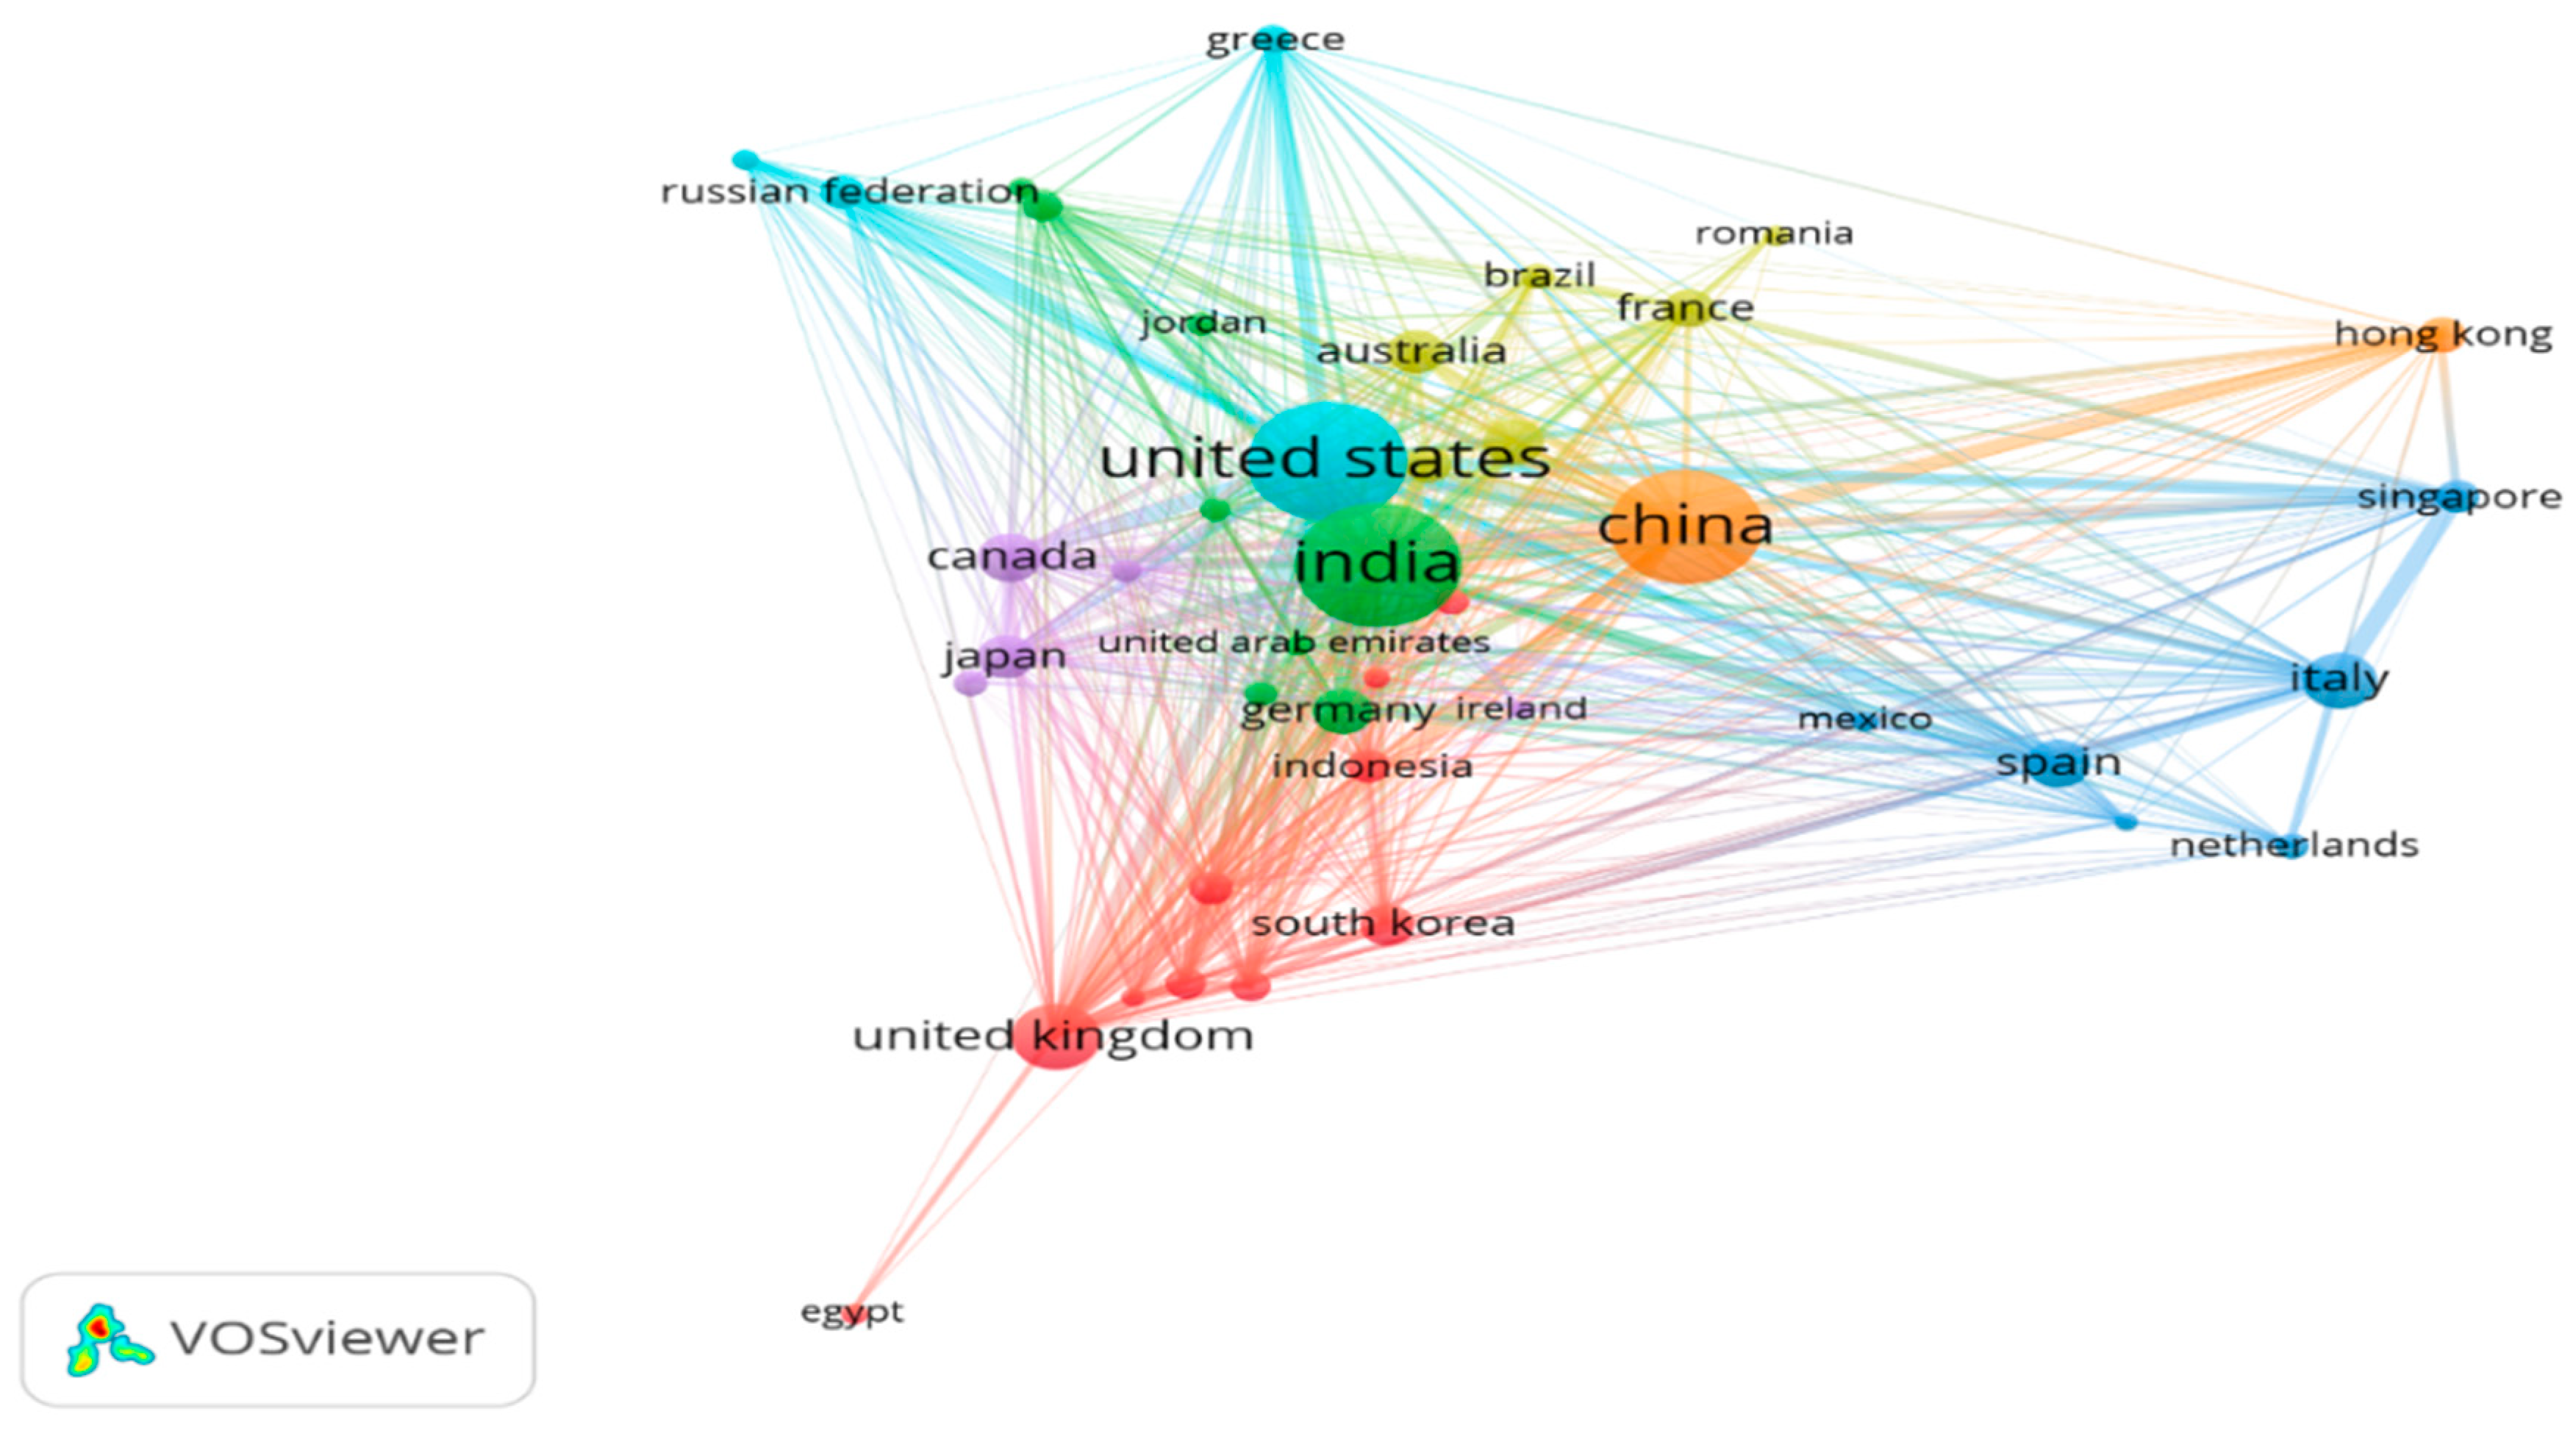
3.4.9. Analysis Based on Countries Bibliographic Coupling

In Countries Bibliographic Coupling (CBC), we obtained 82 countries. Then we selected the countries with a minimum of 3 (three) number of documents of country and a minimum of 3 (three) number of citations of country. Of the 82 documents, 43 met the threshold. Then for each of the 43 countries, the number of links with other countries was calculated. The countries with the greatest total links were chosen. From the selected link, the largest set of connected items consists of 42 countries. The sizes of the circles in Figure 23 suggest countries with large bibliographic coupling. We can observe that India, the United States, and China have large countries bibliographic coupling.
Figure 23 shows countries bibliographic coupling. Table 23 shows countries with bibliographic coupling, links, total strength links, and documents.

4. Summarizing Comments on Bibliometric Analysis of Text-Based Emotion Detection Using Artificial Intelligence

Artificial Intelligence has become a prominent solution to solve different complex problems in many areas. In the domain of Natural Language Processing (NLP), artificial intelligence has increased in present years. In this survey, the authors aimed to provide a brief review of the research being carried out in text-based emotion detection using artificial intelligence from different views. The authors considered Scopus and Web of Science databases studied concerning the attributes like the publication year, languages, source titles, citations, countries, publication types, subject areas, authors, and finding agencies. Network illustrations are also given to provide a quick perspective of different aspects like keyword-publications, publication-citations, authors-citations, etc. This bibliometric survey will be helpful to researchers who want to contribute to the specified research area. An important detail is that text-based emotion detection using artificial intelligence became well-known after 2017: After 2017, researchers shifted their attention to this field. In summary:
  • The majority of publications in this area are conference papers accompanied by articles on Scopus, whereas on Web of Science, most publications are articles.
  • English is the preferred language for publications. However, some publications are available in the Chinese language and very few in Turkish.
  • The top three countries/territories that made significant contributions to this field are India, the United States, and China both on Scopus and on Web of Science.
  • The majority of researchers in the subject area chose Computer Science and Engineering as their field of study.
  • The maximum number of publications of this area are available in “Lecture Notes in Computer Science” on the Scopus database and “IEEE access” on Web of Science.
  • “Buckley K.” is a well-known author who has made significant contributions in the field.
  • Most cited paper in this field is “Sentiment in short strength detection informal text.”
  • The maximum research fund was provided by the “National Natural Science Foundation of China” in this field.

5. Summarizing Comments on Qualitative Analysis of Text-Based Emotion Detection Using Artificial Intelligence

From the analyzed literature, the following major challenges have been identified:
(1).
Difficulties in detecting implicit emotions. One challenge is identifying emotions in the text when no emotion keywords or phrases have been used. Words and sentences used in the text can have different meanings. A single sentence can contain multiple emotions and views, which makes it difficult to detect multiple emotions. This issue needs to be addressed to improve the performance or accuracy of automated emotion detection systems.
(2).
Difficulty in extracting the semantic information. Many words in written text such as negations and modals affect emotion detection. Words and phrases used in different contexts convey different emotions. So, word semantic ambiguity is one of the issues in identifying correct emotion from the text.
(3).
Inefficient and Time-Consuming feature extraction and labeling. Most machine learning algorithms require efficient feature extraction to efficiently recognize emotions. However, manual feature extraction is time-consuming and an error-prone task. In addition, mislabeling of emotions may occur in the manual labeling process, making it a difficult task. Therefore, inefficient feature extraction and labeling can directly affect the accuracy of text-based emotion detection.
(4).
Classifying emotions according to their intensities. Written text can have words or phrases of varying degrees of associations with respect to sentiments and emotions. In detecting emotions from text, the strength of association with a word or a phrase helps to assign emotion scores/intensities to text. Thus, it becomes easy to annotate/label the text with intensities.
(5).
Detecting emotions from non-standard language. Users on online social platforms use sarcasm, irony, humor, etc., to express emotions. However, social media texts also contain informal words, slang words, misspellings, hashtags, emoticons, abbreviations, etc. Therefore, it becomes difficult to interpret such creative text for automatic text-based emotion detection systems.
(6).
Performance of existing systems. Major work in text-based emotion detection has been done using machine learning and deep learning techniques. However, most machine learning techniques require annotated datasets, which is time-consuming and dependent on human efficiency, affecting machine learning techniques’ performance. On the other hand, deep learning techniques are complex techniques it requires a large amount of data for training.
(7).
Imbalanced datasets. Very few datasets are available for research purposes, and most of the datasets are limited labeled imbalanced datasets. These datasets are built for specific experiments, and so are dependent on application domains. Machine learning and deep learning require large datasets, so these few imbalanced datasets restrict the work in text-based emotion detection.
The challenges in the field of Text-Based Emotion Detection using Artificial Intelligence are discussed in Table 24 as below:

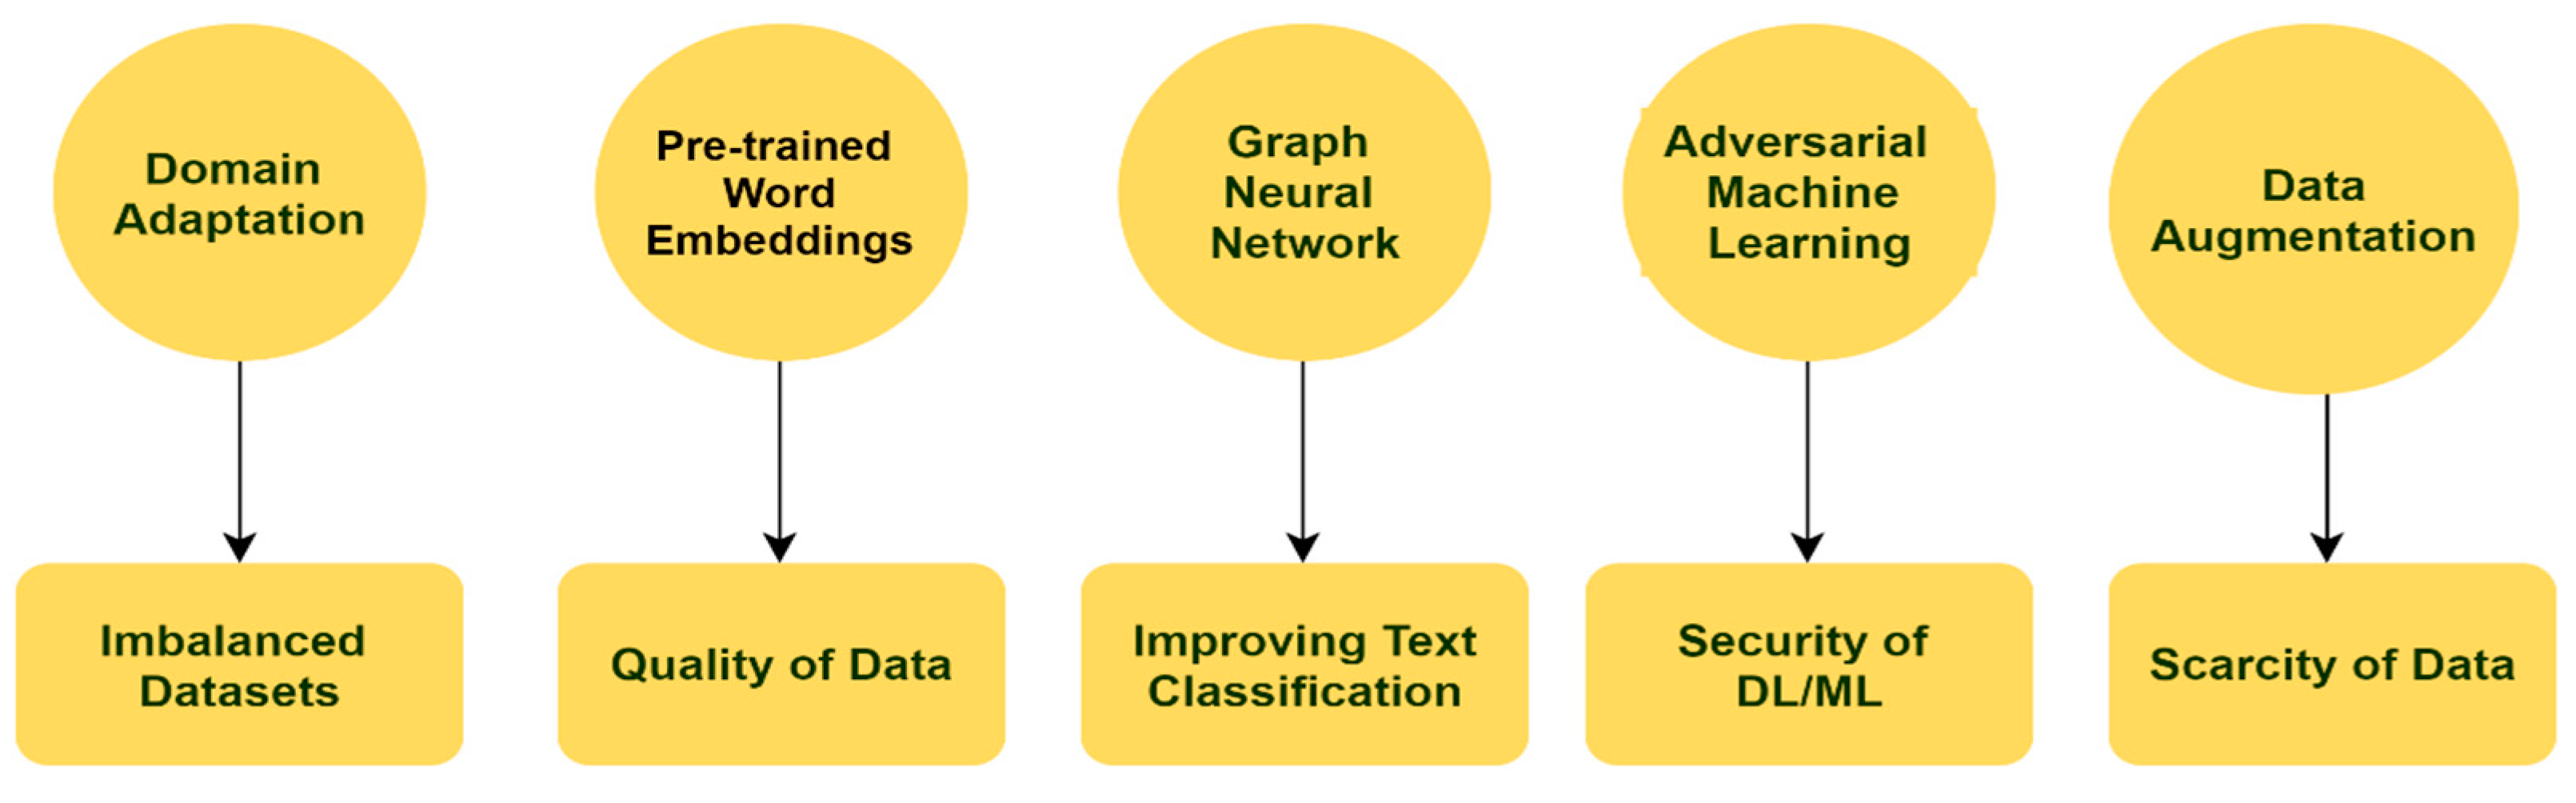
6. Future Directions for Text-Based Emotion Detection Using Artificial Intelligence

This survey focused on the contribution of the existing literature relevant to Text-Based Emotion Detection using Artificial Intelligence, so some future research directions are proposed in this section. Table 25 shows research gaps with future directions. We have identified major challenges such as imbalanced datasets, non-standard language, the performance of existing systems, text classification, etc. We have also studied the implemented solutions to solve these challenges. We have proposed some future and advanced directions to these challenges in terms of domain adaptation, transfer learning, ensemble methods, pre-trained models, data augmentation, etc. Figure 24 shows future directions.
  • Imbalanced Datasets—Problems with presently available datasets are limited labeled data, domain-dependent datasets, and imbalanced datasets. Solutions to these problems are domain adaptation and transfer learning. In domain adaptation, the deep learning model is trained in one kind of environment and tested in a different environment. Another possible solution is semi-supervised machine learning or deep learning algorithms.
  • Accuracy of Existing systems/Models—Ensemble methods with deep learning models can be used to improve existing systems’ performance, and accuracy. Ensemble learning combines the predictions from multiple neural network models. Moreover, performance can be improved by training models on large, domain-specific datasets.
  • Quality of data (Slang words/Emoticons)—A major problem with online social media texts are the use of informal language by users like sarcasm, irony, misspellings, grammatical mistakes, hashtags, emoticons, etc. Pretrained word embeddings or transformer-based word embeddings can be used to solve these problems.
  • Improving Text classification—One more problem is text classification, where deep learning techniques like Graph Neural Network (GNN) can be used to improve text classification.
  • Security of Machine Learning/Deep Learning Models—Another issue is the security of machine learning or deep learning models. The solution to this is adversarial machine learning. The machine learning algorithm is provided with malicious input that is misrepresentative or inaccurate data to misguide the algorithm to verify the algorithm’s security.
  • Scarcity of labeled/annotated data—Deep learning is hungry for data. However, it requires a large amount of data to train the deep learning models. Therefore, more data can produce better performance in deep learning models. Unavailability of labeled data can be solved with data augmentation techniques. Data augmentation techniques like back translation or a thesaurus can be used to solve the scarcity of data.

7. Conclusions

This survey paper provides important insights into text-based emotion detection’s existing approaches using artificial intelligence. It also represents the existing datasets available in this research domain. It is mainly based on the Scopus and Web of Science database platforms. This paper will help researchers know the predominant authors, publication sources, the largest cited publications, etc. Keyword occurrence will help the researchers to decide future directions in the research domain. The future directions and challenges have primarily been discussed: For more difficult emotion detection tasks, new datasets are required. Domain adaptation techniques are required to address technical requirements, such as the need for a large amount of labeled data. Deep learning and ensemble techniques need to be used to improve the robustness of existing systems. Finally, new approaches and datasets should be added to this research study to lower computational costs and improve performance. Artificial Intelligence applied to text-based emotion detection must remain a focus of interest and attract more research, thus producing more research articles, which will improve our understanding of this topic and help its use for worldwide application.

Author Contributions

Conceptualization, S.K. and S.P.; methodology, S.K. and S.P.; software, S.K.; validation, S.K., S.P., K.K., R.A. and V.V.; formal analysis, S.K.; investigation, S.K.; resources, S.K.; data curation, S.K. and S.P.; writing—original draft preparation, S.K.; writing—review and editing, S.P., K.K. and R.A.; visualization, S.K.; supervision, V.V.; project administration, S.P.; funding acquisition, K.K. All authors have read and agreed to the published version of the manuscript.

Funding

This work was supported by the Research Support Fund (RSF) of Symbiosis International (Deemed) University, Pune, India.

Institutional Review Board Statement

Not applicable.

Informed Consent Statement

Not applicable.

Data Availability Statement

Not applicable.

Conflicts of Interest

The authors declare no conflict of interest.

References

  1. Global Socially-Led Creative Agency-We Are Social. Available online: www.wearesocial.com (accessed on 30 March 2021).
  2. Acheampong, F.A.; Wenyu, C.; Nunoo-Mensah, H. Text-based emotion detection: Advances, challenges, and opportunities. Eng. Rep. 2020, 2, 12189. [Google Scholar] [CrossRef]
  3. Alswaidan, N.; Menai, M.E.B. A survey of state-of-the-art approaches for emotion recognition in text. Knowl. Inf. Syst. 2020, 62, 2937–2987. [Google Scholar] [CrossRef]
  4. Chaturvedi, I.; Cambria, E.; Cavallari, S.; Welsch, R.E. Genetic Programming for Domain Adaptation in Product Reviews. In Proceedings of the 2020 IEEE Congress on Evolutionary Computation (CEC), Glasgow, UK, 19–24 July 2020; pp. 1–8. [Google Scholar] [CrossRef]
  5. Topal, K.; Ozsoyoglu, G. Movie review analysis: Emotion analysis of IMDb movie reviews. In Proceedings of the 2016 IEEE/ACM International Conference on Advances in Social Networks Analysis and Mining (ASONAM), San Francisco, CA, USA, 18–21 August 2016; pp. 1170–1176. [Google Scholar] [CrossRef]
  6. Zhang, S.; Zhang, X.; Chan, J.; Rosso, P. Irony detection via sentiment-based transfer learning. J. Inf. Process. Manag. 2018, 56, 1633–1644. [Google Scholar] [CrossRef]
  7. Chronopoulou, A.; Baziotis, C.; Potamianos, A. An Embarrassingly Simple Approach for Transfer Learning from Pretrained Language Models. In Proceedings of the 2019 Conference of the North, Rockhampton, QLD, Australia, 16–19 January 2019. [Google Scholar]
  8. Basile, A.; Franco-Salvador, M.; Pawar, N.; Štajner, S.; China Rios, M.; Benajiba, Y. Combined neural models for emotion clas-sification in human chatbot conversations. In Proceedings of the 13th International Workshop on Semantic Evaluation, Minneapolis, MN, USA, 6–7 June 2019; pp. 330–334. [Google Scholar]
  9. Patil, S.; Joshi, S. Demystifying User Data Privacy in the World of IOT. Regul. Issue 2019, 8, 4412–4418. [Google Scholar] [CrossRef]
  10. Patil, S.G.; Joshi, S.; Patil, D. Enhanced Privacy Preservation Using Anonymization in IOT-Enabled Smart Homes. In Intelligent Decision Technologies 2016; Springer Science and Business Media LLC: Berlin/Heidelberg, Germany, 2019; pp. 439–454. [Google Scholar]
  11. Shaikh, A.; Patil, S. A survey on privacy enhanced role-based data aggregation via differential pri-vacy. In Proceedings of the 2018 International Conference on Advances in Communication and Computing Technology (ICACCT), Sangamner, India, 8–9 February 2018; pp. 285–290. [Google Scholar]
  12. Plutchik, R. A General Psycho Evolutionary Theory of Emotion; Elsevier: Amsterdam, The Netherlands, 1980; pp. 3–33. [Google Scholar]
  13. Lugovic, S.; Dunder, I.; Horvat, M. Techniques and applications of emotion recognition in speech. In Proceedings of the 2016 39th International Convention on Information and Communication Technology, Electronics and Microelectronics (MIPRO), Opatija, Croatia, 30 May–3 June 2016; pp. 1278–1283. [Google Scholar]
  14. Ekman, P. Basic emotions. Handb. Cogn. Emot. 1999, 98, 16. [Google Scholar]
  15. Colby, B.N.; Ortony, A.; Clore, G.L.; Collins, A. The Cognitive Structure of Emotions. Contemp. Sociol. A J. Rev. 1989, 18, 957. [Google Scholar] [CrossRef]
  16. Russell, J.A. A circumplex model of affect. J. Pers. Soc. Psychol. 1980, 39, 1161. [Google Scholar] [CrossRef]
  17. Russell, J.A.; Mehrabian, A. Evidence for a three-factor theory of emotions. J. Res. Pers. 1977, 11, 273–294. [Google Scholar] [CrossRef]
  18. Scherer, K.R. Appraisal theory. In Handbook of Cognition and Emotion; Dalgleish, T., Power, M.J., Eds.; Wiley: New York, NY, USA, 2005; pp. 637–663. [Google Scholar]
  19. Balahur, A.; Hermida, J.M.; Montoyo, A. Building and Exploiting EmotiNet, a Knowledge Base for Emotion Detection Based on the Appraisal Theory Model. IEEE Trans. Affect. Comput. 2011, 3, 88–101. [Google Scholar] [CrossRef]
  20. Carlo, S.; Alessandro, W. WordNet-Affect: An Affective Extension of WordNet. In Proceedings of the Fourth International Conference on Language Resources and Evaluation (LREC’04). 2004, Volume 4. Available online: http://www.lrec-conf.org/proceedings/lrec2004/pdf/369.pdf (accessed on 11 May 2021).
  21. Fellbaum, C. WordNet. In Theory and Applications of Ontology: Computer Applications; Springer Science and Business Media LLC: Berlin/Heidelberg, Germany, 2010; pp. 231–243. [Google Scholar]
  22. Tao, J. Context-based emotion detection from text input. In Proceedings of the 8th International Conference on Spoken Language Processing (ICSLP), Jeju Island, Korea, 4–8 October 2004; pp. 1337–1340. [Google Scholar]
  23. Ma, C.; Prendinger, H.; Ishizuka, M. Emotion estimation and reasoning based on affective textual interaction. In Affective Computing and Intelligent Interaction; Tao, J., Tieniu, T., Picard, R.W., Eds.; Springer: Berlin/Heidelberg, Germany, 2005; pp. 622–628. [Google Scholar]
  24. Perikos, I.; Hatzilygeroudis, I. Recognizing emotion presence in natural language sentences. In Engineering Applications of Neural Networks; Iliadis, L., Papado-poulos, H., Jayne, C., Eds.; Springer: Berlin/Heidelberg, Germany, 2013; pp. 30–39. [Google Scholar]
  25. Shivhare, S.N.; Garg, S.; Mishra, A. EmotionFinder: Detecting emotion from blogs and textual documents. In Proceedings of the International Conference on Computing, Communication & Automation, Greater Noida, India, 15–16 May 2015; pp. 52–57. [Google Scholar]
  26. Lee, S.Y.M.; Chen, Y.; Huang, C.R. A text-driven rule-based system for emotion cause detection. In Proceedings of the NAACLHLT 2010 Workshop on Computational Approaches to Analysis and Generation of Emotion in Text, CAA-GET’10; Association for Computational Linguistics: Stroudsburg, PA, USA, 2010; pp. 45–53. [Google Scholar]
  27. Udochukwu, O.; He, Y. A rule-based approach to implicit emotion detection in text. In Natural Language Processing and Information Systems. Lecture Notes in Computer Science; Biemann, C., Handschuh, S., Freitas, A., Meziane, F., Métais, E., Eds.; Springer: Cham, Switzerland, 2015; pp. 197–203. [Google Scholar]
  28. Nina, R.; Aleksandra, R. Business Sentiment Analysis. Concept and Method for Perceived Anticipated Effort Identification. In Proceedings of the 28th International Conference on Information Systems Development (ISD2019), Toulon, France, 28–30 August 2019. [Google Scholar]
  29. Kolekar, N.V.; Rao, G.; Dey, S.; Mane, M.; Jadhav, V.; Patil, S. Sentiment analysis and classification using lexi-con-based approach and addressing polarity shift problem. J. Theor. Appl. Inf. Technol. 2016, 90, 118–125. [Google Scholar]
  30. Aman, S.; Szpakowicz, S. Identifying Expressions of Emotion in Text. In Proceedings of the Text, Speech and Dialogue; Springer International Publishing: Berlin/Heidelberg, Germany, 2007; pp. 196–205. [Google Scholar]
  31. Ghazi, D.; Inkpen, D.; Szpakowicz, S. Hierarchical versus flat classification of emotions in text. In Proceedings of the NAACLHLT 2010 Workshop on Computational Approaches to Analysis and Generation of Emotion in Text, CAAGET’10, Los Angeles, CA, USA, 5 June 2010; pp. 140–146. [Google Scholar]
  32. De Bruyne, L.; De Clercq, O.; Hoste, V. LT3 at SemEval-2018 task 1: A classifier chain to detect emotions in tweets. In Proceedings of the 12th International Workshop on Semantic Evaluation, New Orleans, LA, USA, 5–6 June 2018; pp. 123–127. [Google Scholar]
  33. Suhasini, M.; Srinivasu, B. Emotion Detection Framework for Twitter Data Using Supervised Classifiers; Springer Science and Business Media LLC: Berlin/Heidelberg, Germany, 2020; pp. 565–576. [Google Scholar]
  34. Singh, L.; Singh, S.; Aggarwal, N. Two-stage text feature selection method for human emotion recognition. In Proceedings of 2nd International Conference on Communication, Computing and Networking, Lecture Notes in Networks and Systems; Springer: Singapore, 2019; Volume 46, pp. 531–538. [Google Scholar]
  35. Allouch, M.; Azaria, A.; Azoulay, R.; Ben-Izchak, E.; Zwilling, M.; Zachor, D.A. Automatic Detection of Insulting Sentences in Conversation. In Proceedings of the 2018 IEEE International Conference on the Science of Electrical Engineering in Israel (ICSEE), Eilat, Israel, 12–14 December 2018; Volume 2018, pp. 1–4. [Google Scholar]
  36. Baziotis, C.; Pelekis, N.; Doulkeridis, C. DataStories at SemEval-2017 Task 4: Deep LSTM with Attention for Message-Level and Topic-based Sentiment Analysis. In Proceedings of the 11th International Workshop on Semantic Evaluation (SemEval-2017), Vancouver, BC, Canada, 3–4 August 2017; pp. 747–754. [Google Scholar]
  37. Ezen-Can, A.; Can, E.F. RNN for Affects at SemEval-2018 Task 1: Formulating Affect Identification as a Binary Classification Problem. In Proceedings of the 12th International Workshop on Semantic Evaluation, New Orleans, LA, USA, 5–6 June 2018; pp. 162–166. [Google Scholar]
  38. Shrivastava, K.; Kumar, S.; Jain, D.K. An effective approach for emotion detection in multimedia text data using se-quence-based convolutional neural network. Multimed. Tools Appl. 2019, 78, 29607–29639. [Google Scholar] [CrossRef]
  39. Xiao, J. Figure Eight at SemEval-2019 Task 3: Ensemble of Transfer Learning Methods for Contextual Emotion Detection. In Proceedings of the 13th International Workshop on Semantic Evaluation, Minneapolis, MN, USA, 6–7 June 2019; pp. 220–224. [Google Scholar]
  40. Rathnayaka, P.; Abeysinghe, S.; Samarajeewa, C.; Manchanayake, I.; Walpola, M.J.; Nawaratne, R.; Bandaragoda, T.; Alahakoon, D. Gated recurrent neural network approach for multi-label emotion detection in microblogs. arXiv 2019, arXiv:1907.07653. [Google Scholar]
  41. Krommyda, M.; Rigos, A.; Bouklas, K.; Amditis, A. An Experimental Analysis of Data Annotation Methodologies for Emotion Detection in Short Text Posted on Social Media. Informatics 2021, 8, 19. [Google Scholar] [CrossRef]
  42. Kratzwald, B.; Ilić, S.; Kraus, M.; Feuerriegel, S.; Prendinger, H. Deep learning for affective computing: Text-based emotion recognition in decision support. Decis. Support Syst. 2018, 115, 24–35. [Google Scholar] [CrossRef] [Green Version]
  43. Choudrie, J.; Patil, S.; Kotecha, K.; Matta, N.; Pappas, I. Applying and Understanding an Advanced, Novel Deep Learning Approach: A Covid 19, Text Based, Emotions Analysis Study. Inf. Syst. Front. 2021, 1–35. [Google Scholar] [CrossRef]
  44. Scherer, K.R.; Wallbott, H.G. Evidence for universality and cultural variation of differential emotion response patterning. J. Pers. Soc. Psychol. 1994, 66, 310–328. [Google Scholar] [CrossRef]
  45. Alm, E.C.O. Affect in Text and Speech. Citeseer; The University of Illinois at Urbana-Champaign: Urbana, IL, USA, 2008. [Google Scholar]
  46. Rosenthal, S.; Farra, N.; Nakov, P. SemEval-2017 task 4: Sentiment analysis in Twitter. arXiv 2019, arXiv:1912.00741. [Google Scholar]
  47. Ghazi, D.; Inkpen, D.; Szpakowicz, S. Detecting Emotion Stimuli in Emotion-Bearing Sentences. Lect. Notes Comput. Sci. 2015, 2015, 152–165. [Google Scholar] [CrossRef]
  48. Mohammad, S.; Bravo-Marquez, F. WASSA-2017 Shared Task on Emotion Intensity. In Proceedings of the 8th Workshop on Computational Approaches to Subjectivity, Sentiment and Social Media Analysis, Copenhagen, Denmark, 8 September 2017. [Google Scholar]
  49. Buechel, S.; Hahn, U.; Schneider, N.; Xue, N. Readers vs. Writers vs. Texts: Coping with Different Perspectives of Text Understanding in Emotion Annotation. In Proceedings of the 11th Linguistic Annotation Workshop, Valencia, Spain, 3 April 2017; Volume 2017, pp. 1–12. [Google Scholar]
  50. Preoţiuc-Pietro, D.; Schwartz, H.A.; Park, G.; Eichstaedt, J.; Kern, M.; Ungar, L.; Shulman, E. Modelling Valence and Arousal in Facebook posts. In Proceedings of the 7th Workshop on Computational Approaches to Subjectivity, Sentiment and Social Media Analysis, San Diego, CA, USA, 16 June 2016; Volume 2016, pp. 9–15. [Google Scholar]
  51. Poria, S.; Hazarika, D.; Majumder, N.; Naik, G.; Cambria, E.; Mihalcea, R. MELD: A multimodal multi-party dataset for emo-tion recognition in conversations. arXiv 2018, arXiv:1810.02508. [Google Scholar]
  52. Demszky, D.; Movshovitz-Attias, D.; Ko, J.; Cowen, A.; Nemade, G.; Ravi, S. GoEmotions: A Dataset of Fine-Grained Emotions. In Proceedings of the Proceedings of the 58th Annual Meeting of the Association for Computational Linguistics, Online. 5–10 July 2020; pp. 4040–4054. [Google Scholar]
  53. Kumar, S.; Patil, S.; Bongale, A.; Kotecha, K.; Bongale, A.K.M. Demystifying Artifificial Intelligence Based Digital Twins in Manufacturing-A Bibliometric Analysis of Trends and Techniques. Available online: https://digitalcommons.unl.edu/libphilprac/4541/ (accessed on 11 May 2021).
  54. Zeynu, S.; Patil, S. Survey on prediction of chronic kidney disease using data mining classification techniques and feature selection. Int. J. Pure Appl. Math. 2018, 118, 149–156. [Google Scholar]
  55. VOSviewer. Available online: www.vosviwer.com (accessed on 5 April 2021).
  56. van Eck, N.J.; Waltman, L. Visualizing Bibliometric Networks, in Measuring Scholarly Impact: Methods and practice. In Measuring Scholarly Impact; Springer: Berlin/Heidelberg, Germany, 2014. [Google Scholar]
  57. Ortega, M.G.S.; Rodríguez, L.-F.; Gutierrez-Garcia, J.O. Towards emotion recognition from contextual information using machine learning. J. Ambient. Intell. Humaniz. Comput. 2020, 11, 3187–3207. [Google Scholar] [CrossRef]
  58. Lai, Y.; Zhang, L.; Han, D.; Zhou, R.; Wang, G. Fine-grained emotion classification of Chinese microblogs based on graph convolution networks. World Wide Web 2020, 23, 2771–2787. [Google Scholar] [CrossRef]
  59. Acheampong, F.A.; Nunoo-Mensah, H.; Chen, W. Transformer models for text-based emotion detection: A review of BERT-based approaches. Artif. Intell. Rev. 2021, 1–41. [Google Scholar] [CrossRef]
  60. Huang, C.; Trabelsi, A.; Zaïane, O. ANA at SemEval-2019 Task 3: Contextual Emotion detection in Conversations through hierarchical LSTMs and BERT. In Proceedings of the 13th International Workshop on Semantic Evaluation, Minneapolis, MN, USA, 6–7 June 2019. [Google Scholar]
  61. Huang, Y.-H.; Lee, S.-R.; Ma, M.-Y.; Chen, Y.-H.; Yu, Y.-W.; Chen, Y.-S. EmotionX-IDEA: Emotion BERT–An affectional model for conversation. arXiv 2019, arXiv:1908.06264. [Google Scholar]
  62. Mohammad, S.; Bravo-Marquez, F. Emotion Intensities in Tweets. In Proceedings of the 6th Joint Conference on Lexical and Computational Semantics (*SEM 2017), Vancouver, BC, USA, 3–4 August 2017. [Google Scholar]
  63. Bouazizi, M.; Ohtsuki, T.O. A Pattern-Based Approach for Sarcasm Detection on Twitter. IEEE Access 2016, 4, 5477–5488. [Google Scholar] [CrossRef]
  64. Rendalkar, S.; Chandankhede, C. Sarcasm Detection of Online Comments Using Emotion Detection. In Proceedings of the 2018 International Conference on Inventive Research in Computing Applications (ICIRCA), Coimbatore, India, 11–12 July 2018; pp. 1244–1249. [Google Scholar]
  65. Majumder, N.; Poria, S.; Peng, H.; Chhaya, N.; Cambria, E.; Gelbukh, A. Sentiment and Sarcasm Classification with Multitask Learning. IEEE Intell. Syst. 2019, 34, 38–43. [Google Scholar] [CrossRef] [Green Version]
  66. Rajadesingan, A.; Zafarani, R.; Liu, H. Sarcasm Detection on Twitter. In Proceedings of the Eighth ACM International Conference on Web Search and Data Mining, Huston, TX, USA, Shanghai, China, 31 January–6 February 2015; pp. 97–106. [Google Scholar]
  67. Kumar, A.; Garg, G. Empirical study of shallow and deep learning models for sarcasm detection using context in benchmark datasets. J. Ambient. Intell. Humaniz. Comput. 2019. [Google Scholar] [CrossRef]
  68. Ahanin, Z.; Ismail, M.A. Feature extraction based on fuzzy clustering and emoji embeddings for emotion classification. Int. J. Tech. Manag. Inf. Syst. 2020, 2, 102–112. [Google Scholar]
  69. Huang, F.; Li, X.; Yuan, C.; Zhang, S.; Zhang, J.; Qiao, S. Attention-Emotion-Enhanced Convolutional LSTM for Sentiment Analysis. IEEE Trans. Neural Networks Learn. Syst. 2021, 1–14. [Google Scholar] [CrossRef]
  70. Kouw, W.M.; Loog, M. An introduction to domain adaptation and transfer learning. arXiv 2019, arXiv:1812.11806v2. [Google Scholar]
  71. Ahmad, Z.; Jindal, R.; Ekbal, A.; Bhattachharyya, P. Borrow from rich cousin: Transfer learning for emotion detection using cross lingual embedding. Expert Syst. Appl. 2020, 139, 112851. [Google Scholar] [CrossRef]
  72. Li, H.; Guevara, N.; Herndon, N.; Caragea, D.; Neppalli, K.; Caragea, V.; Squicciarini, A.; Tapia, A.H. Twitter Mining for Disaster Response: A Domain Adaptation Approach, Short Paper–Social Media Studies. In Proceedings of the 12th International Conference on Information Systems for Crisis Response and Management, Kristiansand, Norway, 24–27 May 2015. [Google Scholar]
  73. Krawczyk, B. Learning from imbalanced data: Open challenges and future directions. Prog. Artif. Intell. 2016, 5, 221–232. [Google Scholar] [CrossRef] [Green Version]
Figure 1. Text preprocessing along with process flow of text-based emotion detection using artificial intelligence.
Bdcc 05 00043 g001
Figure 2. Comparative analysis of different emotion models.
Bdcc 05 00043 g002
Figure 3. Approaches used for text-based emotion detection.
Bdcc 05 00043 g003
Figure 4. Methodological Outline.
Bdcc 05 00043 g004
Figure 5. Number of Publications per Year (2005–2021) on text-based emotion detection using artificial intelligence.
Bdcc 05 00043 g005
Figure 6. Geographic locations of research related to text-based emotion detection.
Bdcc 05 00043 g006
Figure 7. Categorization of research done in various subject areas combined from Scopus and Web of Science.
Bdcc 05 00043 g007
Figure 8. Combined analysis of funding agencies from Scopus and Web of Science.
Bdcc 05 00043 g008
Figure 9. Analysis based on Web of Science source titles.
Bdcc 05 00043 g009
Figure 10. Analysis based on Scopus source titles.
Bdcc 05 00043 g010
Figure 11. Top Productive Authors on Scopus.
Bdcc 05 00043 g011
Figure 12. Top Productive Authors on Web of Science.
Bdcc 05 00043 g012
Figure 13. Network of highly cited authors with co-authors, source title, and publication title.
Bdcc 05 00043 g013
Figure 14. Clustered network of authors with co-authors, source title, and publication title.
Bdcc 05 00043 g014
Figure 15. Keyword co-occurrence network diagram.
Bdcc 05 00043 g015
Figure 16. Co-authorship network diagram.
Bdcc 05 00043 g016
Figure 17. Alluvial diagram of authors, source titles, and year of publication for highly cited publications.
Bdcc 05 00043 g017
Figure 18. Citation document correlation using a network graph.
Bdcc 05 00043 g018
Figure 19. Highest cited authors using a network graph.
Bdcc 05 00043 g019
Figure 20. Highest cited sources using a network graph.
Bdcc 05 00043 g020
Figure 21. Author Bibliographic Coupling using a network graph.
Bdcc 05 00043 g021
Figure 22. Source Bibliographic Coupling using a network graph.
Bdcc 05 00043 g022
Figure 23. Countries Bibliographic Coupling using a network graph.
Bdcc 05 00043 g023
Figure 24. Future Directions for text-based emotion detection Using AI.
Bdcc 05 00043 g024
Table 1. Different application domains of text-based emotion detection.
Application
Domain
DetailsReferences
Product
Reviews
Emotion detection on Amazon product reviews for different products and in different languages using deep learning techniques.[4]
Movie
Review
Introduced the concept of movie emotion maps based on movie reviews using machine learning techniques.[5]
Social
Media
Proposed a model based on transfer learning and attention-based neural network, used to identify context inconsistency for detecting irony in Twitter.[6]
Discussion
Forum
Proposed simple transfer learning approach using pre-trained models for text classification tasks.[7]
Chatbots/
Conversational
systems
Developed a model to detect English textual conversations between a chatbot and a human using deep learning techniques.[8]
Table 2. Qualitative analysis of the relevant literature according to key parameters.
PaperEmotion ModelDatasetAlgorithm/Technique/
Method
ObjectiveAdvantagesDisadvantagesEvaluation Measures
(%)
Emotions
Detected
Public Monitoring
[22]
(2004)
Categorical
Emotion Model—
OCC Model
Speech corpusKeyword-based
Approach
Emotion Detection for Chinese datasetSimple
Approach
Many mis-
labeled
emotions
NAJoy, Fear,
Anger, Hate,
Sadness, Surprise
[24]
(2013)
Categorical
Emotion
Model—
Ekman Model
Self-
created
Keyword-based
approach, Sentence Splitting, Sentence dependency graph
Detect emotional
state of sentence
Specify the emotional word strength.Used self-corpus. can be extended to detect complex emotionsNAHappiness, Anger, Sadness, Disgust, Fear, Surprise
[34]
(2019)
Categorical
Emotion
Model—
Ekman Model
ISEARMachine Learning approach, Used Chi-square, and POS tagger, SVM classificationRecognize the human emotions from the unstructured text documentsSolved the long-standing semantic
extraction problem,
Performance
improvement
Ignored relation between
features
72.43
(Accuracy)
Happiness,
Sadness, Anger, Fear, Disgust,
Surprise
[28]
(2020)
--Self-
Created
Rule based approach with unsupervised machine learning algorithmPresented a concept of business sentiment to interpret the contextual intricacy of business process workerUsed valence rules based on semantic and syntactic
information.
Improved
performance
Small dataset usedNAPositive, Neutral, Negative.
[43]
(2021)
--CrowdFlowerAdvanced deep learning based
RoBERTa model
To study emotions expressed by people in early months of Covid-19 Performance improvementLimited hashtags used for data collection.
Limited period data used.
80.33
(Accuracy)
happiness, fear
anger, anxiety, joy, sadness
Chatbots/Conversational Systems
[23]
(2005)
Categorical
Emotion
Model—
Ekman Model
Chat
system
Keyword Spotting technique at
Sentence Level
Emotion recognition from the text-based chat systemEasy
Approach
Weak strategy used for
negation
NAHappiness,
Anger,
Sadness, Fear,
Disgust, Surprise
[8]
(2019)
--SemEval-2019BERT, USE,
Bi-LSTM with deep attention process at the sentence level.
To detect emotions conversations between a human and a ChatbotUse of
different deep
learning
sub-models
Accuracy for happy is smaller than
angry, sad
77.00
(F-Score)
Sad, Happy,
Angry, and Others
[39]
(2019)
--SemEval-2019Deep Learning
approach,
Pretrained
language models ULMFiT, BERT, OpenAI’s GPT
The proposed
approach for
contextual emotion
detection
Informal
writing
considered in preprocessing,
Use of
semantic
information
Accuracy for happy is smaller than
angry, sad
76.86
(F-Score))
Happy, Sad,
Angry, Or Others
[35]
(2018)
--Manually builtMachine Learning approach, Classifiers SVM, decision tree, NB, and the tree
bagger
Proposed a system to aid children to detect insulting wordsSVM provided the highest accuracy.Ignoring contextual information resulted in misclassification.
-No semantic representation in the model.
76.9
(Accuracy)
Clearly Insulting Clearly Non-
Insulting,
Sentences -
Insulting Or
Non-Insulting
Social Media
[25]
(2015)
Categorical Emotion Model—
Parrot Model
BlogsOntology,
hierarchy based with keyword spotting technique
Detect emotions from blogs and textual
documents
Improved
accuracy as compared to other techniques
-Does not overcome all limitations.
-No use of
semantic
information
79.75
(Accuracy)
Love, Anger,
Sadness, Joy, Fear, Surprise,
[26]
(2010)
Dimensional Emotion Model Turner’s
Model
Sina WeiboLinguistic Rule-BasedRule-based emotion cause detection for Chinese microblogging siteLinguistic rules
constructed
Showed poor performance47.95
(F-Score)
Anger, Fear,
Happiness, Sadness, Surprise.
[27]
(2015)
Categorical Emotion Model—
OCC Model
ISEAR, SemEval-2007, AlmRule-Based
Approach using lexicon and syntactic information.
Detect implicit
emotions
Syntactic and lexicon
Information used
Sensitive to the content of the text,
Poor
performance for Emotion Label—Fear
51.3/57.3/65.5
(F-Score)
Joy/Happy, Fear/Fearful,
Anger/Angry-
Disgusted
sadness/Sad,
Disgust
[30]
(2007)
Categorical
Emotion Model—
Ekman Model
AmanMachine Learning approach, Naïve Bayes and SVM
Algorithm
Emotion detection on a corpus of the blog post-Used
emoticons
information
-SVM
performed
better
Did not use
semantic,
syntactic,
features
73.89
(Accuracy)
Happiness, Anger, Sadness, Surprise, Disgust, Fear
[31]
(2010)
Categorical
Emotion Model—
Ekman Model
AmanMachine Learning approach, Hierarchical approach 2-Level, and 3-Level, SVM AlgorithmProposed a hierarchical approach for highly imbalanced structure datasets-Reduced
influence of the class size on
performance
-Hierarchical is better than flat class
Did not utilize
semantic, syntactic,
features
50.86
(F-Score)
Happiness, Anger
Sadness, Disgust, Fear, Surprise
[33]
(2020)
Dimensional Emotion model—
Russell’s
Circumplex Model
Twitter
(Sentiment
140)
NB and K-NN
Machine Learning techniques.
Proposed a system to detect expressed emotions based on their tweetsNB showed high accuracy compared to KNN.Contextual
information extraction in sentences is low
72.06
(Accuracy)
Happy-Active Class Happy-Inactive Class Unhappy-Active Class Unhappy-Inactive Class
[32]
(2018)
Categorical
Emotion Model—
Ekman Model
SemEval-2018Machine Learning algorithms SVM, linear SVM, logistic regression, and RFDeveloped a multi-class emotion classification system for
English tweets
-Utilized broad range of
features
-For each feature, a customized model built.
Unbalanced data set impacted performance52.00
(Jaccard Accuracy)
Anger, fear, joy, disgust, surprise, pessimism, trust, love anticipation, sadness, optimism
[36]
(2017)
--SemEval-2018Deep Learning
approach, Bi-LSTM with deep attention mechanism at
Message Level and Topic Level
Multi-label emotion detection
in English tweets
-The vocabulary and
expressions preservation, spell
correction
performed
Out-of-vocabulary words problem58.80
(Jaccard
Accuracy)
Positive, Negative, Neutral
[37]
(2018)
Categorical
Emotion Model
SemEval-2018Deep Learning
approach using
Bi-GRU
Proposed multi
binary classification to model
various affective
categories of Twitter post
Use of binary models to
handle unbalanced data.
Use of emoji embeddings
No use of affect lexicons39.80
(Jaccard
Accuracy)
Fear, Anger, Joy, Surprise, Disgust, Pessimism, Trust, Love Anticipation, Sadness, Optimism.
[40]
(2019)
--SemEval-2018Deep learning
approach using
Bi-GRU with pyramid attention
network
Proposed emotion detection in microblogs using
Pyramid Attention Network based model
Capture multiple emotions in a single text. Use of semantics and context featuresLow recognition of understated classes58.90
(F-Score)
Anger, Trust, Joy
Fear, Anticipation,
Disgust, Optimism, Love, Sadness,
Surprise,
Pessimism
[41]
(2021)
Dimensional Emotion Model—Plutchik’s Wheel of EmotionsTweets_ Annotated
_to_
emotions
Deep learning and Machine learning approach using LSTM, SVM-SGD XGBoost, Naive Bayes, Decision Tree, Random forestTo detect the emotions in a short text post from Online Social MediaFully annotated dataset created for TweetsAccuracy of
anticipation, trust emotions low compared to other emotions.
91.9
(Accuracy)
Anger, Joy, Trust, Fear, Disgust,
Sadness, Surprise,
Anticipation
[19]
(2012)
Componential
Emotion
Model—
Appraisal Model
ISEAR
SemEval –
2007
Deep Learning
approach using LSTM
Presented a new knowledge base—EmotiNet for storing and representing affective reaction and evaluated the same using deep learning
algorithms
Appraisal based model proved flexible in terms of
accuracy
Limited in domain knowledge42.2
(Precision)
Anger, Disgust, Guilt, Fear,
Sadness, Joy, And Shame
[42]
(2018)
Categorical
Emotion Model and
Dimensional Emotion Model
Alm,
ISEAR,
Twitter
Machine learning
algorithms, Random Forest, SVM, and Deep Learning technique Bi-LSTM with pre-trained models
Proposed text-based emotion detection in decision support systems using multi-class classificationPerformance improvement over traditional methodsThe system
evaluated on the small dataset
23.2
(F-Score)
Joy, Trust, Sadness, Disgust, Fear, Anger, Anticipation, Surprise
[29]
(2016)
--Reviews from customized shopping portal Machine learning with bag-of-words (BoW) modelProposed a system to classify sentiments in product reviewsAddressed polarity shift problem by using modifying negationsUsed customized dataset --Positive, Negative, Neutral
Multimedia Systems
[38]
(2019)
Categorical
Emotion Model—
Ekman Model
TV
transcript
Deep Learning
approach using Convolutional
neural networks with max pooling.
Detecting emotions in multimedia textLearning
semantics and context features
Ambiguity
between classes like anger and disgust,
happiness and surprise
72.48
(F-Score)
Happiness, Fear, Sadness, Anger, Disgust, Surprise
Table 3. Publicly available datasets for detecting emotions in text.
Sr. No.Emotion
Datasets
Collection Platform UsedEmotions LabeledLink
1ISEAR
(1997)
[44]
Obtained in
cross-cultural studies
from 37 countries
Joy, Fear, Anger,
Guilt, Sadness, Shame, And Disgust
https://www.kaggle.com/shrishrivas/isears-dataset (accessed on 5 July 2021)
2Cecilia Oves dotter Alm’s Affect data (2005) [45]Constructed from
story Tales
Angry, Fearful, Sad, Happy, Surprise,
And Disgusted
http://people.rc.rit.edu/~coagla/affectdata/index.html (accessed on 5 July 2021)
3Crowdflower (2007)Constructed from
40,000 tweets
Surprise, Sadness, Happiness, Fun, Anger, Love, Worry, Boredom, Hate, Relief Enthusiasm, Neutral, Emptyhttps://www.crowdflower.com/wpcontent/uploads/2016/07/text_emotion.csv (accessed on 6 July 2021)
4SemEval (2012)
[46]
Three variations according to data from google news, news headlines, major newspapers, tweets, conversationsJoy, Sadness, Fear,
Anger, Surprise,
Disgust
http://web.eecs.umich.edu/~mihalcea/downloads.html (accessed on 6 July 2021)
5Emotion-Stimulus data (2015) [47]Contains 1594 emotion-labeled sentences, Frame Nets’ annotated data.Joy, Sadness, Fear,
Anger, Surprise,
Disgust
http://www.site.uottawa.ca/~diana/resources/emotion_stimulus_data (accessed on 5 July 2021)
6Aman (2016)
[30]
Constructed from blog postsHappiness, Disgust, Sadness, Fear, Anger, Surprise, No Emotion, Mixed EmotionAvailable on request
7WASSA-2017
[48]
Constructed from tweetsJoy, Sadness, Fear, And Angerhttp://saifmohammad.com/WebPages/EmotionIntensity-SharedTask.html (accessed on 6 July 2021)
8Emobank
(2017)
[49]
News headline, blogs, newspapers, essays, fiction, travel guides, and lettersJoy, Fear, Sadness,
Anger, Surprise,
Disgust
https://github.com/JULIELab/EmoBank (accessed on 6 July 2021)
9The Valence and Arousal
Facebook data (2018) [50]
Built from 2895
Facebook posts
Joy, Fear, Sadness,
Anger, Surprise,
Disgust
http://wwbp.org/downloads/public_data/dataset-fb-valence-arousal-anon.csv (accessed on 6 July 2021)
10MELD dataset (2018) [51]Friends TV show’s dialogues and utterances were used to compile
this dataset.
Joy, Fear, Anger,
Sadness, Disgust,
Surprise, Neutral
https://github.com/SenticNet/MELD (accessed on 7 July 2021)
11GoEmotions
(2020) [52]
58k carefully
curated comments
extracted from
Reddit
Amusement, Disgust, Remorse, Sadness, Admiration, Grief, Anger, Gratitude, Love, Pride, Annoyance, Approval, Caring, Confusion, Desire, Optimism, Disappointment, Disapproval, Embarrassment, Excitement, Curiosity, Fear, Joy, Nervousness, Realization, Relief, Surprise,https://github.com/google-research/google-research/tree/master/goemotions (accessed on 7 July 2021)
Table 4. Representative data collection procedure.
Search Query“Text-Based*”
AND
“Artificial Intelligence*” OR “Deep Learning*” OR “Machine Learning*” OR “Natural Language Processing*.”
AND
“Emotion Detection*” OR “Sentiment analysis*” OR
“Emotion Analysis*” OR “Emotion Recognition*” OR “Chatbots,”
OR “Conversational agents*” OR “Social Media*” OR “Twitter” OR
“Facebook” OR “Reddit” OR “Instagram” OR “Reviews”
Scopus 1011Web of Science 234
Selection CriteriaPaper Language—English
Document Types—Conference Paper,
Article, Review, Conference Review
Publication Years—2005 to 2021
Research Areas—Computer Science, Engineering, Psychology,
Decision Sciences, Social Sciences
Scopus 827Web of Science 83
Removing DuplicatesTotal 910
Duplicates 08
Publications
for analysis
Combined from Scopus and Web of Science
902
Table 5. Publications in different languages in the Scopus and Web of Science databases.
Publication LanguageScopusWeb of Science
English82783
Chinese202
Portuguese1-
Slovenian1-
Spanish1-
Turkish13
Korean-4
Russian-1
Table 6. Publication types on the Scopus and Web of Science databases on Text-based Emotion Detection.
Publication TypeScopusWeb of Science
Conference Paper454-
Article23183
Conference Review131-
Review11-
Table 7. Yearly Publication Count from Scopus and Web of Science.
YearPublication Count N (%)
Scopus (N = 827)Web of Science (N = 83)
20052 (0.24)-
20063 (0.36)1 (1.20)
20075 (0.60)-
20086 (0.72)2 (2.40)
20099 (1.08)-
201014 (1.69)1 (1.20)
201115 (1.81)1 (1.20)
201221 (2.53)1 (1.20)
201327 (3.26)4 (4.81)
201431 (3.74)2 (2.40)
201540 (4.83)4 (4.81)
201655 (6.65)7 (8.43)
201755 (6.65)8 (9.63)
201897 (11.72)12 (14.45)
2019127 (15.35)15 (18.07)
2020160 (19.34)23 (27.71)
2021184 (22.24)4 (4.81)
Table 8. Fifteen major contributing countries in the field of text-based emotion detection using artificial intelligence.
CountryScopusWOS
India1459
United States13420
China12039
United Kingdom404
Italy312
Canada232
Spain232
Taiwan212
Germany202
Japan188
Australia175
South Korea163
Pakistan116
Singapore114
Bangladesh131
Table 9. Subject Area Analysis by combining from Scopus Database and Web of Science.
Subject AreaScopusWeb of ScienceTotal
Computer Science75074824
Decision Sciences86-86
Engineering26627293
Psychology12416
Social Sciences661076
Table 10. Prominent funding agencies combined from Scopus and Web of Science.
Funding AgenciesScopusWOS
National Natural Science Foundation of China4916
European Commission162
National Science Foundation183
Ministry of Education China111
Ministry of Science and Technology Taiwan52
Japan Society for The Promotion of Science23
Economic Social Research Council31
National Basic Research Program of China21
Table 11. Top ten publication sources on Web of Science (N = 83).
RankSource TitlesPublication
Count, N (%)
1IEEE access11(13.25)
2Expert systems with applications3(3.61)
3International journal of advanced computer science and applications3(3.61)
4Journal of intelligent fuzzy systems3(3.61)
5Journal of intelligent fuzzy systems applications in engineering and technology3(3.61)
6Concurrency and computation practice experience2(2.41)
7Empirical software engineering2(2.41)
8IEEE transactions on affective computing2(2.41)
9Information processing management2(2.41)
10Information systems and e business management2(2.41)
Table 12. Top ten publication sources on Scopus (N = 827).
RankSource TitlesPublication Count,
N (%)
1Lecture Notes in Computer Science 130 (15.71)
2Advances in Intelligent Systems and Computing40 (4.83)
3Communications in Computer and Information Science30 (3.62)
4ACM International Conference Proceeding Series19 (2.29)
5Ceur Workshop Proceedings19 (2.29)
6IEEE Access11 (1.33)
7Procedia Computer Science9 (1.08)
8Expert Systems with Applications7 (0.84)
9International Journal of Innovative Technology and Exploring Engineering7 (0.84)
10Information Systems and E Business Management6 (0.72)
Table 13. Top 10 most cited authors, publication title, and the number of citations.
AuthorsPublication TitleNo. of
Citations
Thelwall M. et al.Sentiment in short strength detection informal text1028
Borth D. et al.Large-scale visual sentiment ontology and detectors using adjective-noun pairs354
Zhang L. et al.Deep learning for sentiment analysis: A survey322
Poria S. et al.Sentic patterns: Dependency-based rules for concept-level sentiment analysis208
Araque O. et al.Enhancing deep learning sentiment analysis with ensemble techniques in social applications200
Sun S. et al.A review of natural language processing techniques for opinion mining systems197
Kolosnjaji B. et al.Deep learning for classification of malware system call sequences190
Giatsoglou M. et al.Sentiment analysis leveraging emotions and word embeddings141
Bravo-Marquez F. et al.Meta-level sentiment models for big social data analysis132
Yadollahi A. et al.The current state of text sentiment analysis from opinion to emotion mining127
Table 14. The top 20 author keywords, their total link strength, and occurrences.
KeywordLinksTotal
Link
Strength
OccurrencesKeywordLinksTotal Link
Strength
Occurrences
Deep
Learning
40130155Emotion Recognition161418
Machine
Learning
45134147Affective Computing141616
Natural
Language
Processing
39118124Text
Classification
171316
Sentiment
Analysis
398194Twitter171316
Artificial
Intelligence
348189Big Data141315
Emotion
Detection
345786Convolutional
Neural
Network
151214
Text Mining243741Data
Mining
181314
Social Media242428Deep
Neural
Networks
101113
Opinion Mining282224Neural
Network
131113
Emotion191418Emotion Analysis13912
Table 15. Top 10 authors with their links and number of documents published.
AuthorsLinksDocumentsAuthorsLinksDocuments
Zhang L.812Zhou y.76
Wang Y.138feng s.65
Zhang Y.128Zhou g.95
Li X.136li s.74
Zhang J.86li z.44
Table 16. Number of citations per year from Scopus and Web of Science.
YearCitation Count
Scopus
Citation Count
Web of Science
2015273058
2016599767
20171074480
201820155123
201935939212
202051655290
20211575480
Table 17. A citation analysis of the top five publications on Web of Science.
Title2015201620172018201920202021Sub
Total
>2015Total
Citations
Ontology-based sentiment analysis of twitter posts252223322621815710167
Author gender identification from text1314191412908122103
A survey of multimodal sentiment analysis0001236221080080
Twitter user profiling based on text and community mining for market analysis129101396261465
Sentiment analysis of Chinese micro-blog text based on extended sentiment dictionary00061927456056
Table 18. A citation analysis of the top ten publications on Scopus.
Title2015201620172018201920202021Sub
Total
>2015Total
Citations
Sentiment in short strength detection informal text114114124135136136297882381026
Relation classification via convolutional deep neural network246389135199190297290729
Big data deep learning: Challenges and perspectives154267113149120385440544
Deep neural nets as a method for quantitative structure-activity relationships6334584104118374270427
Large-scale visual sentiment ontology and detectors using adjective noun pairs4160515071501233519354
Deep learning for sentiment analysis: A survey00010101150573180318
Sentic patterns: Dependency-based rules for concept-level sentiment analysis353827304019132025207
Enhancing deep learning sentiment analysis with ensemble techniques in social applications004266482231990199
A review of natural language processing techniques for opinion mining systems0010425569201961197
Deep learning for classification of malware system call sequences00838726481900190
Table 19. Highly cited authors, links, and citations.
AuthorsLinksCitationsAuthorsLinksCitations
Buckley K.221109Liu K.2730
Thelwall M.221109Zhao J.2730
Cai D.191026Dahl G.E.8427
Kappas A.191026Liaw A.8427
Paltoglou G.191026Ma J.8427
Table 20. Highly cited sources, links, citations, and publication year.
SourceLinksCitationsYear
Journal Of The American Society For Information Science And Technology1211092011
IEEE Access67612019
Expert Systems With Applications106702015
Lecture Notes In Computer Science In Artificial Intelligence215792016
Knowledge-Based Systems44542013
Journal Of Chemical Information And Modeling24272015
Wiley Interdisciplinary Reviews: Data Mining And Knowledge Discovery24002017
Information Fusion21962017
Communications In Computer And Information Science81172017
Table 21. Authors with bibliographic coupling, links, total strength links, and citation.
AuthorsLinksTotal Strength LinksCitations
Zhang L.127115397
Balahur A.91211154
Wang Y.4125104
Zhang Y.9614655
Cambria E.77261407
Hermida J.M.87194145
Li X.4617219
Montoya A.86173147
Zhang J.709839
Zhou Y.4096105
Table 22. Sources with bibliographic coupling, links, total strength links, and citations.
SourceLinksTotal Strength LinksDocuments
Lecture Notes In Computer Science in Artificial Intelligence63480129
Advances In Intelligent Systems And Computing5220139
Communications In Computer And Information Science5413230
IEEE Access5813022
ACM International Conference Proceeding Series5010519
Ceur Workshop Proceedings5114118
Expert Systems With Applications424310
Procedia Computer Science27388
Lecture Notes In Electrical Engineering33306
Multimedia Tools And Applications28166
Table 23. Countries with bibliographic coupling, links, total strength links, documents, and citations.
CountriesLinksTotal Strength LinksDocumentsCitations
United States4019571332949
China3912591212077
India39950144768
Italy3749430248
Canada3848622955
United Kingdom39464401321
Singapore3243611441
Spain3834623445
Malaysia35235991
Saudi Arabia37235950
Table 24. Challenges identified from the Qualitative Analysis.
ChallengesImplemented SolutionsReferences
Failure to detect implicit emotions
Failure to extract the semantic information
Inefficient and Time-Consuming feature extraction and labeling
Classifying emotions according to their intensities
Transformer-based word embeddings for contextual information extraction.
Improving classification accuracies using Machine learning algorithms.
Applying Deep Learning algorithms like GNNs for improving classification.
Best-Worst Scaling (BWS) Annotation Scheme.
[35,57,58,59,60,61,62]
Detecting sarcasmA pattern-based approach using Part-Of-Speech tags and No. of interjection words.
A Deep Neural Network-based Multitask Learning System.
[63,64,65,66,67]
Affected by text quality—Slang Words, IronyTransfer learning—Transferring the knowledge base to enhance limited annotated irony datasets.[6,61]
Unrobustness of some techniques
Improve the accuracy of existing systems by optimizing them.
Ensemble of attention-based Deep neural networks and fuzzy clustering.[6,59,68]
Imbalanced Datasets.Domain Adaptation—Training a model on labeled data from a source domain and testing an unlabeled target domain.
Transfer Learning—Transferring knowledge from a Large dataset to a Small dataset, thus improving the system’s accuracy.
Attention Based Deep Learning Techniques.
[7,36,69,70,71,72,73]
Table 25. Summary of research gaps with future directions.
Sr. No.Research GapFuture Directions
1Unavailability of ready datasets/corpora covering all aspects of the data. Further, this field is lacking labeled/annotated datasets.Domain Adaptation
Transfer Learning
Multi-Modality
2There is a need to expand the research domain to detect implicit emotions, mislabeled emotions, inefficient and time-consuming feature extraction tasks.Transformer-based word embeddings
Improving classification accuracies using machine learning algorithms and deep learning algorithms like GNN’s
3Reinforcing robustness of some techniques/algorithms and improving the accuracy of existing systems by optimizing them.Ensemble methods
Deep Learning methods
Publisher’s Note: MDPI stays neutral with regard to jurisdictional claims in published maps and institutional affiliations.

