Abstract
Coral reefs are undergoing a severe decline due to ocean acidification, seawater warming and anthropogenic eutrophication. We demonstrate the applicability of Deep Learning (DL) for following these changes. We examined the distribution and frequency appearance of the eleven most common coral species at four sites in the Gulf of Eilat. We compared deep learning with conventional census methods. The methods used in this research were natural sampling units via photographing the coral reef, line transects for estimating the cover percentage at the four test sites and deep convolutional neural networks, which proved to be an efficient sparse classification for coral species using the supervised deep learning method. The main research goal was to identify the common coral species at four test sites in the Gulf of Eilat, using DL to detect differences in coral cover and species composition among the sites, and relate these to ecological characteristics, such as depth and anthropogenic disturbance. The use of this method will produce a vital database to follow changes over time in coral reefs, identify trend lines and recommend remediation measures accordingly. We outline future monitoring needs and the corresponding system developments required to meet these.
1. Introduction
Coral reefs are the most diverse marine ecosystem, evolved over eons of favorable, stable climatic conditions [1,2,3]. The current, exponentially accelerating Global Climate Change driven [4,5], ocean warming and seawater acidification endanger their very survival. The warming destabilizes the symbiosis between corals and their endosymbiotic algae that provide the energy base of the coral holobiont and of the entire reef ecosystem [6,7]. The acidification shifts the balance from skeletal carbonate deposition to its dissolution. These stressors are further aggravated by anthropogenic eutrophication, shoreline development and, in some instances, diving pressure. The documentation and monitoring of many coral reefs in diverse and distant locations is of paramount importance for tracing trends and predicting their rates. Without such real-time, ongoing information no corrective, preventing and bioremediation measures can be planned, executed and evaluated. Stressors evidently cause decrease in live coral cover, juvenile recruitment and reduction in species diversity. The highly diverse coral reefs of the Gulf of Eilat (Aqaba) are of special interest and concern, as they are the main basis of the economy of surrounding communities in both Israel and Jordan. They are among the most diverse reefs [8], but have suffered from a rare low tide exposing them for a week [9] in 1970, heavy rain [10] and chronic oil pollution [11]. The stratification in the Northern Gulf of Eilat/Aqaba follows a well-known annual cycle of well-mixed conditions in winter, surface warming in spring and summer, maximum vertical temperature gradient in late summer and erosion of stratification in fall [12]. The cooling of the Gulf’s waters following the eruption of Mount Pinatubo in 1991 upset that pattern and led to a period of unusually deep mixing that injected nutrients into the photic zone [13]. That eutrophication of the waters surrounding the reefs resulted in proliferation of green algae smothering corals [14]. To the above-listed traumatic events has to be added the deleterious anthropogenic eutrophication of the Gulf due to fish farming [11]. These events and processes, as well as the forthcoming Red-Dead Canal, call for frequent, detailed monitoring of any changes in the status of the coral reefs of the Gulf. Two main health indicators are live coral cover and species diversity.
Coral Classification in the Gulf of Eilat
Traditional, manual methods were used by Loya and Slobodkin [8] in the Gulf of Eilat for coral classification and species inventory. One of the most serious technical problems that occurs using these methods for classifying the corals is that the identification of many underwater species is difficult. Furthermore, coral pigmentation and morphology are plastic with environmental forcing functions like light and current, eliciting wide phenotypic variability [15,16]. Whenever confronted with the slightest doubt concerning the species of a certain coral underlying the transect, a small piece is sampled and put into a plastic bag carrying an identification number. Later, the coral samples are bleached clean, with concentrated solution of KOH, for purposes of identification and preservation [9], a tedious and destructive practice, limited by sample size. Machine learning methods such as deep learning seek to avoid these difficulties, profiting from the latest advances in computerized handling of large quantities of visual images [17]. In the research of Loya and Slobodkin, 1971, [8] color photographs were taken using a camera with a flash attachment. For close-ups, a Rolleiflex camera in a Roll marine underwater case was used. A measuring tape was spread over the reef and divers recorded the projected length of all the organisms and substrate underneath the line transect to a resolution of 1 cm. Photographs were taken at 1 m intervals along a transect, in order to measure live coverage of different species on the photographs and thus to save time underwater. However, many small species and juvenile colonies, as well as species which typically grow beneath other colonies, do not show up in the photographs. The line transects, implemented for the first time in marine ecology study by Loya and Slobodkin, 1971, [8], have become the most commonly used ecological method for studying benthic communities in the marine environment. In their research that took place in the Gulf of Eilat, regular monitoring of the permanent belt transects for a period of 20 months yielded approximately 3000 photographs of more than 4000 corals belonging to 100 species (Loya, 1972) [9]. One of the indexes used to estimate the diversity in the coral reefs is the Wiener‒Shannon index, which takes into account the richness of the species and the degree of uniformity (evenness) in the diffuser, and thus there is also an emphasis on the presence/absence of rare species. This index is good for comparing between years or between sites, but its numerical value has no real meaning. Thus, it is difficult to know what the difference in values means other than that a high index is “better” than a low index, i.e., indicates a greater variety.
In the present study we demonstrate the applicability and advantages of our research and benefits of using deep learning, which are reliability and efficiency in terms of time and resources. The significance and novelty of this research is in working with “large data”. Only that proven refinement allows the application of a global scale and synchronized monitoring of the status of coral reefs. Only such monitoring can address the urgent ecological need of classifying corals, following changes in live coral cover, in reduction in species diversity and decline in recruitment. All of these are indispensable for tracing future trends in coral reef ecology and taking measures to prevent further reef deterioration, as well as assessing the efficiency of bioremediation measures. The urgency of such long-term monitoring of reef sections under different stressors is illustrated specifically by the case of the reefs in the Gulf of Aqaba (Eilat). So far, the classification of corals has been performed by using painstaking, time-consuming manual methods, which highly limit its performance and usefulness. We demonstrate the adaptation and application of deep learning neuronal networks for classifying corals in the Gulf of Eilat reefs for eleven species at four sites. Our study provides the tools for developing a routine monitoring of the health of the reefs of Eilat, by expanding it to more coral species and analyzing changes in live cover and in diversity.
The innovations of our study are the test of DL applicability to discrimination among coral species; selecting and testing of the most efficient DL network and method for coral identification; providing tools to follow climate change effects on the coral reefs of the Gulf of Eilat, allowing the establishment of a baseline prior to the opening of the Red-Dead Canal and the real-time monitoring of its effects on the structure and biodiversity of the Gulf’s coral reefs; and providing foundation benchmark data for the benefit of future studies in the region.
For that purpose we chose four reef sites. The study sites were chosen on the basis of their accessibility and central location within the Eilat Coral Reserve. Furthermore, they are highly diverse, offering the opportunity to choose the most common species and determining their share of the entire coral assemblage. The chosen sites allow the variability over space (between sites) to be studied and finally the possible effects of human-mediated disturbances to be examined, by comparing the quantity and cover percentage at the most disturbed site of the four.
2. Materials and Methods
Methods used in this work to classify the coral reef species: “Natural sampling units” via photographing the coral reef during daytime, line transects for estimating the cover percentage at the four test sites in the Gulf of Eilat and deep convolutional neural networks as an efficient sparse classification for coral species using a supervised deep learning method called Convolutional Neural Networks (CNNs). The Cochran‒Mantel‒Haenszel test was performed to compare the presence and proportions of coral species abundance, measured using different methods across multiple sites, and their presence and relative abundance in different sites using each method. Post hoc analysis was performed with a pairwise Fisher test with False Discovery Rate (FDR) correction for multiple comparisons. Species coverage percentage was compared using a one-way ANOVA, followed by a Tukey post hoc analysis.
2.1. Study Sites
Eilat Coral Beach Nature Reserve (NR). This site has a well-developed fringing reef near the shore and massive stony coral abundance through the entire depth gradient down to 50 m depth. This is the most developed, complex, rich and diverse coral reef in the Gulf of Eilat. The study sites were chosen on the basis of their accessibility and central location within the Eilat Coral Reserve. Furthermore, they are highly diverse, offering the opportunity to choose the most common species and determine their share of the entire coral assemblage. The chosen sites allow the variability over space (between sites) to be studied and the possible effects of human-mediated disturbances to be examined, by comparing the quantity and cover percentage at the most disturbed site of the four with reference sites at different distances from North Beach.
Three sites (1–3) were chosen for training of the classifiers; the fourth was added as a test (Figure 1).
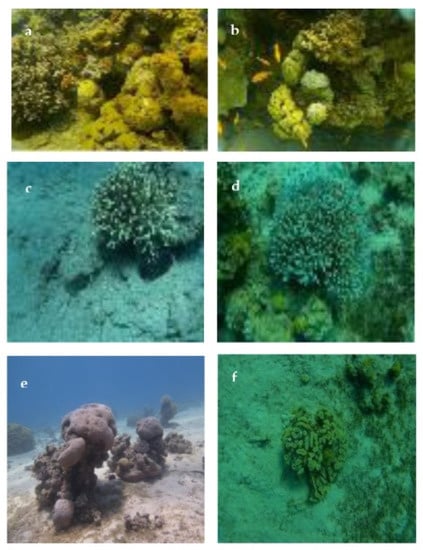
Figure 1.
Coral reefs at the four study sites in the Gulf of Eilat. (a,b) Coral Reefs sites 2 and 3, (c,d) Coral reef at site 1, (e,f) Coral reef at site 4.
Coral-reef classification was divided into the following steps:
- Photographing the corals.
- Line transects for estimating the cover percentage at the four test sites in the Gulf of Eilat.
- Deep learning convolutional neural networks as an efficient classification of coral species.
2.2. Coral Diversity and Coverage
Providing a reliable method that estimates biodiversity across space and through time is essential for motivating the public to protect biodiversity, for designing the species of marine protected areas and for monitoring their effectiveness.
One of the indexes used to estimate the diversity in the coral reefs is the Wiener‒Shannon (H) index using EstimateS, which is a free software application that computes a variety of biodiversity statistics, estimators and indices based on biotic sampling data (Colwell, 1994) [18]. In this approach the species diversity is calculated by accumulating data on each section until an estimate is made based on the maximum number of sections made, taking into account rare species. The results are given as an estimate of species diversity for each site in its entirety based on line section data and estimates calculations. On cumulative length “area” (of corals versus number of colonies) it was found that the value of the index based on counting is slightly higher than the value based on area.
2.3. Photographing and Analysis
At each site thousands of “point natural photos” were taken in addition to 700 h of underwater videos, at 30 frames per second (Raphael et al., 2020, [19,20]). Of the still images, 5500 were chosen as they were considered to be of sufficient quality for the initial DL analyses. Thousands of high quality video frames were then used for the subsequent ecological study (Figure 2).
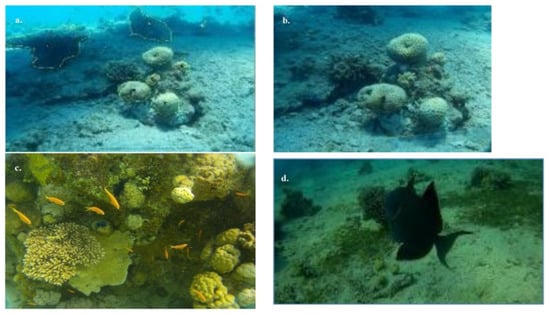
Figure 2.
(a) Choosing the common coral species. (b) Measuring the corals species. (c) Full coverage of the coral reef. (d) Partial coverage of the coral reef.
2.4. Data Analysis
The four tested sites differed by composition; the cover percentage was estimated by point sampling using the method of “natural sampling units”. The software applications that were used to analyze the cover percentage were Fiji ImageJ and CPCe software (Coral Point Count with Excel extensions) and Windows-based software that provides a tool for the determination of coral cover using transect photographs (see Appendix A and Appendix B). A specified number of spatially random points are distributed on a quadrat image, and coral species lying under these points are identified. The estimated and current results were used for further examination of the differences between repeated measures. The cover percentage was checked at the four test sites, using the method of line transects, to assess which of the measured ecological parameters were most predictive. The statistical analysis was done using R statistics software.
3. Results
Throughout the study, eleven common coral species were recorded.
The results are divided into two sections:
- Coral species quantities and coverage percentage of each of the common coral species at each site (sites 1–4) using each method (point estimated and Fiji ImageJ)
- Deep learning coral classification data.
3.1. Coral Species Quantities
The common coral species were observed in each method and on each site using point estimated and Fiji ImageJ methods as shown in Table 1.

Table 1.
Common coral species at studied sites (1–4).
3.2. Comparison between Methods
Corals percentage coverage was measured in two different methods at four sites:
General comparison between methods shows that coral proportions were not significantly different between the two methods within different sites (Cochran‒Mantel‒Haenszel test, X2(3) = 3.5084, p = 0. 3197) (see Figure 3 and Figure 4).
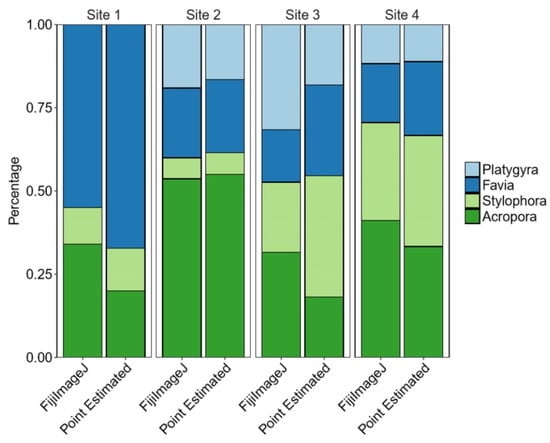
Figure 3.
The proportions of each coral in each method and on each site for four coral species (percent).
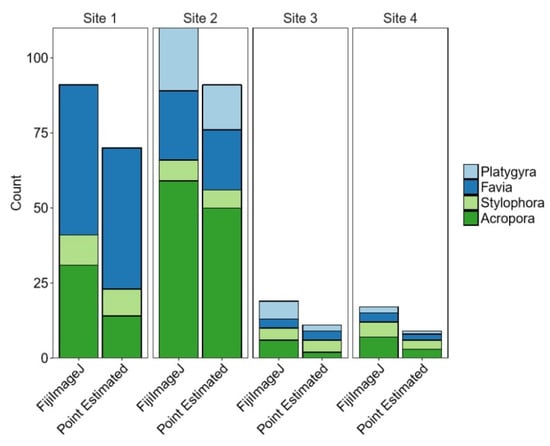
Figure 4.
Counts of each coral in each method and on each site for four coral species.
3.3. Comparison between Sites
General comparison between the sites taking into account the different methods (=repeats):
Proportions were significantly different between sites, within each method (Cochran‒Mantel‒Haenszel test, X2(9) = 110.67, p < 0.0001) (see Figure 5).
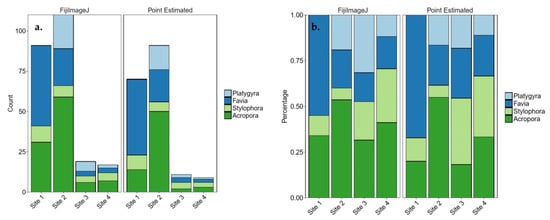
Figure 5.
The proportions of each coral in each method and on each site for four coral species. (a) absolute numbers, (b) percent.
3.4. Comparison between Each Pair of Sites Using Each Method
The Cochran‒Mantel‒Haenszel test was performed to compare proportions of corals that were measured with different methods across multiple sites and proportions of corals in different sites within each method. Post hoc analysis was performed with a pairwise Fisher test with false discovery rate (FDR) correction for multiple comparisons.
Coral proportions were not significantly different between the two methods within different sites (Cochran‒Mantel‒Haenszel test, Χ2(3) = 3.5084, p = 0.3197). In contrast, proportions were significantly different between sites, within each method (Cochran‒Mantel‒Haenszel test, Χ2(9) = 110.67, p < 0.0001). Specifically, proportions in site 1 were significantly different to proportions in sites 2 and 3 (p < 0.0001), but there was no difference between sites 2 and 3 (p = 0.0921) (see Table 2).
Table 2.
Comparison between each pair of sites by each method for four coral species.
The highest coverage percentage in sites 1–4 was observed for Acropora. Stylophora has the highest coverage percentage in site 1 and the lowest in site 2. Favia has the highest coverage percentage in site 2 and the lowest in site 1; Platygyra has the highest coverage percentage in site 4 and the lowest in site 2 (see Figure 6).
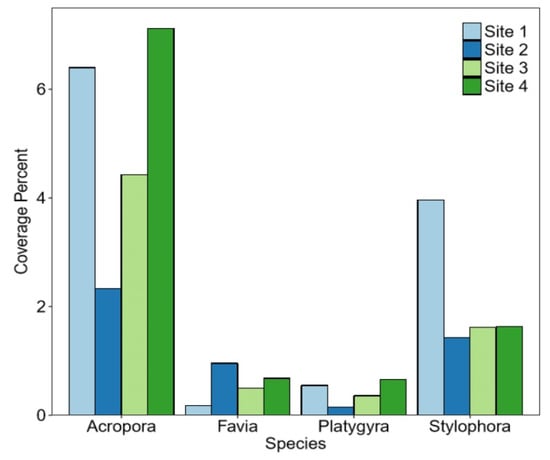
Figure 6.
Complete coverage at each site for each coral species.
The coverage percentage of the common coral species in a descending order from the highest to the lowest was observed for Acropora, Stylophora and Favia, and the lowest coverage percentage was found for Platygyra (see Figure 7).
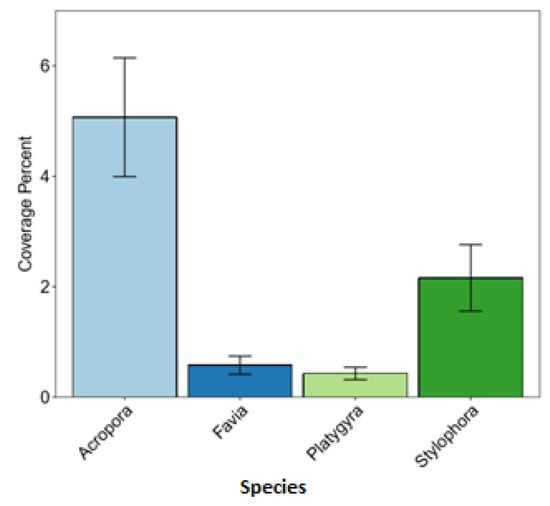
Figure 7.
Coverage percentage of four coral species.
3.5. Comparing the Coverage Percentages of Different Coral Species
3.5.1. One-Way ANOVA Test Results
There was a statistically significant difference between the coverage percentage of the species (one-way ANOVA, F(3,12) = 11.9, p = 0.000657) (see Table 3).
Table 3.
ANOVA test results for four coral species.
3.5.2. Tukey Post Hoc Test
A Tukey post hoc test showed that the coverage of Acropora was significantly higher than all other species (Favia—p = 0.0013, Platygyra—p = 0.001, Stylophora—p = 0.028), but the coverage of Favia was not significantly different than Platygyra and Stylophora.
There was no statistically significant difference between the coverage of Platygyra and Favia (p = 0.998), no statistically significant difference between the coverage of Stylophora-Favia (p = 0.324) and no statistically significant difference between the coverage of Stylophora-Platygyra (p = 0.255) (see Table 4).
Table 4.
Multiple comparisons of means for four coral species.
3.5.3. Coverage Estimation
Each dot indicates the estimated coverages respectively per image. A Pearson correlation test was preformed displaying correlation coefficient and p value. A definite p value means there is a link between the variables (sites). The correlation coefficient (corr) is a measure of the strength of the relationship between the variables. A value between 0 and 1 indicates a positive relationship. Values closer to 1 indicate a strong bond (see Figure 8).
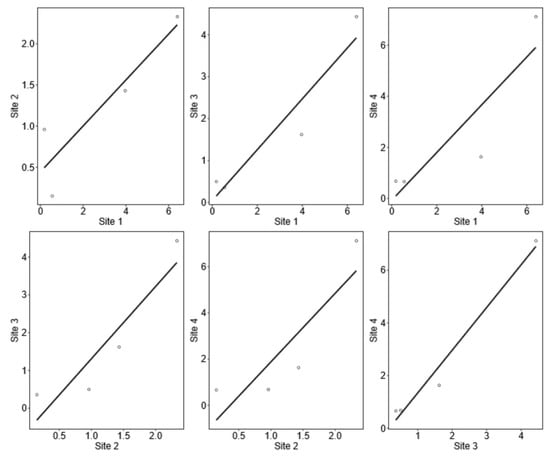
Figure 8.
Coverage estimation for all four coral species (Acropora, Favia, Platygyra, Stylophora).
3.6. Correlation of Coverage Percentage between the Different Sites
There is a correlation between sites 1–3 and sites 3–4 (see Table 5).
Table 5.
Test results of correlation for four coral species between the four sites.
3.7. Comparing the Coverage Percentages of Eleven Coral Species
The coverage percentage of the common coral species in a descending order from the highest to the lowest was observed for Acropora, Lobophyllia, Stylophora, Goniastrea, Montipora, Cyphastrea, Porites, Favia, Platygyra and Pavona (see Figure 9).
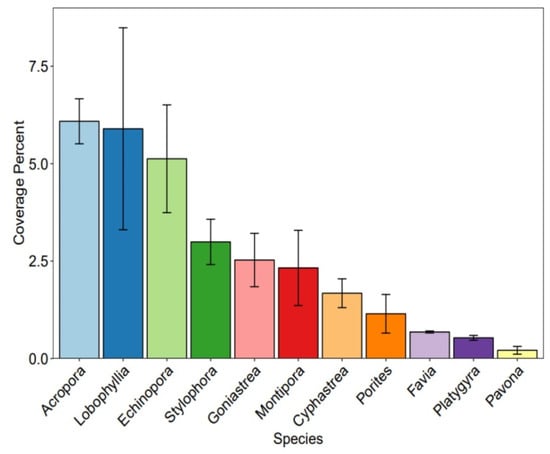
Figure 9.
Coverage percentage of the common coral species.
3.8. Deep Learning Results for Eleven Species (ResNet-50)
Coral species including Platygyra, Stylophora and Lobophyllia were identified in a higher accuracy than species like Acropora, Favia, Echinopora, Cyphastrea, Goniastrea, Pavona, Porites and Monttipora with ResNet-50network (see Figure 10).
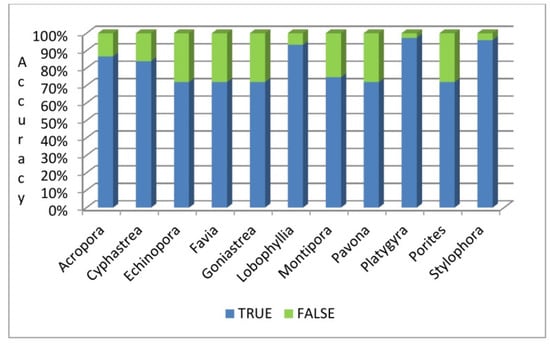
Figure 10.
Accuracy (%) of the eleven coral species classification.
The branching corals (B) and massive corals (M) groups are displayed in Figure 11.
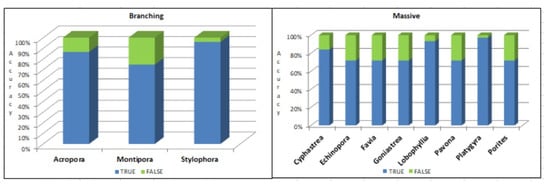
Figure 11.
Deep Learning results for eleven species.
3.9. Comparing between Branching (B) and Massive (M) Species (ResNet-50)
A T-test on the coral species performed using ResNet-50 was marked as “True” in order to compare between branching (B) and massive (M) coral species.
Coral species were marked “True” via branching (B) (see Table 6).
Table 6.
T-test results for branching coral species.
An alternative hypothesis was checked:
The results show that the “True” difference in means is not equal to 0.
Confidence interval of 95% was checked: −0.1257214, 0.2946103.
Sample estimates were made (see Table 7).
Table 7.
T-test means results for coral species in groups B and M (ResNet-50).
3.10. Comparing between M Species
Pierson correlation between all species was performed in order to check if there is a significant correlation between each pair. In the case of a significant correlation, the corrected FDR is performed.
Pearson’s Chi-squared test results are shown in Table 8.
Table 8.
Chi-squared test results for M species.
Results obtained using traditional, non DL methods:
- There is no difference between the methods: Fiji ImageJ and “Point estimated”, applied at each site.
- There is a significant difference among live coral cover and number of coral colonies among the four sites, using any method.
- The difference in relative species’ coverage among the four sites using both methods was significant.
- The relative coral species cover among the four sites was not significantly different when determined using the two methods.
- The species differed significantly in their coverage percentage.
3.11. Deep Learning Results
Four test sites including 5500 images (500 images for each species)
The images were classified for eleven coral classes and divided into validation, testing and training data. The training data included 3850 images, 825 images for “Test” and 825 images for “Validation”.
The “Test” data results show that the highest accuracy was observed for Platygyra (97.33%), followed by other coral species including Stylophora (96%), Lobophyllia (93.33%), Acropora (86.66%), Cyphastrea (84%), Montipora (74.66%), Echinopora, Favia, Goniastrea and Pavona, and Porites showed the lowest accuracy of 72% (see Table 9).
Table 9.
Deep learning test results of eleven coral species.
Table 10.
Cross validation accuracy results.
Table 11.
Cross validation results.
Results obtained using DL:
- High accuracy of 90% was attained in a preliminary test by applying the method of deep learning for classifying 400 images of four common coral species.
- The method was proven by applying training results from three sites on a fourth external site with accuracy of 80.13%.
- Using cross validation results prove that the model can predict new data from additional sites that were not used in the training.
- The system has difficulty in distinguishing among similar coral species.
- Species with salient features are identified with high accuracy
4. Discussion
The described novel computerized classification method for coral reef images can be configured to meet different dataset characteristics (e.g., the size of the dataset, number of classes, class types, etc.). We compared several Convolutional Neural Network (CNN) architectures such as VGG-16 and ResNet-50 and used transfer learning. ResNet-50 was used on a dataset containing eleven classes of coral species on a large number of images (5500), far more than the amount of images used in other studies.
The classification of underwater coral images is challenging due to the large number of coral species, the great variance among images of the same coral species, the lightning conditions and the fact that several species tend to appear together, leading to increasing overlapping among different classes. We have demonstrated that we were able to overcome these inherent difficulties and to outperform classical methods that require a high human intervention, proving that CNNs are an excellent technique for automatic classification of underwater coral images. ResNet-50 was the best CNN routine, considering its fast performance and high accuracy.
The results from these tests show that accuracy of identification was high in species with distinct features or unique morphologies, underscoring the importance of salient features in increasing accuracy of identification as is evident in the following list.
Studied species in decreasing order of identification accuracy:
- Species with a unique shape like Platygyra showed highest accuracy results of 97.33%.
- Branching corals like Stylophora with typical finger-like branches that vary in width and have blunt tips are classified with slightly lower accuracy of 96%.
- Species like Lobophyllia with either flat or domed colonies were classified with accuracy of 93.33%.
- Acropora species that grow either as slender or broad branches achieved 86.66%.
- Species with a distinct morphology like Cyphastrea showed accuracy of 84%.
- Species like Montipora were classified with accuracy results of 74.66%.
- Dome-shaped or flat similar species like Favia, Goniastrea, Pavona, Porites and Echinopora are classified with accuracy results of 72%.
Future refinement aimed at distinguishing species with similar colony morphologies will require high resolution closeup images, allowing calyx feature comparisons.
Such surface texture images would also be required in order to provide unambiguous identification of colonies of a single species, of different sizes and shapes, needed to obtain population age structures and recruitment data.
5. Conclusions
- DL is capable of distinguishing between coral and non-coral benthos.
- DL can reliably identify corals, based on colony morphology.
- Computerized coral image analyses are the most powerful, unique tools for studying the ecology of coral reefs, relying on vast real-time datasets that provide the information needed for the following:
- Comparing sites, as these are revealed by the DL study and suggest an explanation of differences among them in a real coverage and species abundance.
- Quantifying the differences in abundance among species and allowing attribution of such differences to sensitivity, longevity, competition and K vs. r strategies.
- Documenting the efficiency of legislative and bioremediation measures in coral reef conservation and recovery over time.
- Producing time series for long term trend analyses and predictions.
- Constructing the age structure of species, to analyze recruitment patterns.
- Generating species diversity estimates.
Author Contributions
A.R. wrote the manuscript with input from all co-authors. Z.D. shared his extensive experience and guided the authors with a deeper understanding of the coral reefs and marine ecosystems. D.I. actively participated throughout the research process. N.S.N. helped and advised on deep learning throughout the research process. N.S.N. helped with and advised on deep learning throughout the research process. All authors have read and agreed to the published version of the manuscript.
Funding
This research received no external funding.
Institutional Review Board Statement
Not applicable.
Informed Consent Statement
Not applicable.
Data Availability Statement
The datasets generated during and/or analyzed during the current study are available from the corresponding author on reasonable request.
Acknowledgments
The authors thank Irit Shoval from the Scientific Equipment Center of the Faculty of Life Sciences at Bar-Ilan University for helping with the data analysis and processing of the results. We also thank Jennifer Benichou Israel Cohen from the Statistics Unit at Bar-Ilan University for helping with presentation of the results and preparation for statistical analyses. We thank Sharon Victor for her help with formatting the manuscript. No funding was received for this research.
Conflicts of Interest
The authors declare no conflict of interest. The funders had no role in the design of the study; in the collection, analyses, or interpretation of data; in the writing of the manuscript, or in the decision to publish the results.
Appendix A
Appendix A.1. Applications Used
At the laboratory 100 orderly points were sampled in each image using the software program CPCe and for each point it was determined whether or not there is a coral. The results were processed to determine the cover percent of the corals in each picture and the average and standard deviation were calculated for each site from the total of all the pictures taken at each site.
Appendix A.2. Coral Current Cover Using CPCe Software

Figure A1.
Coral common species.
Appendix B
Stitching Coral Reef (Panorama)

Figure A2.
Labeled corals example image.
References
- Bellwood, D.R.; Hughes, T.P.; Folke, C.; Nyström, M. Confronting the coral reef crisis. Nat. Cell Biol. 2004, 429, 827–833. [Google Scholar] [CrossRef] [PubMed]
- Maor-Landaw, K.; Karako-Lampert, S.; Ben-Asher, H.W.; Goffredo, S.; Falini, G.; Dubinsky, Z.; Levy, O. Gene expression profiles during short-term heat stress in the red sea coralStylophora pistillata. Glob. Chang. Biol. 2014, 20, 3026–3035. [Google Scholar] [CrossRef] [PubMed]
- Teplitski, M.; Krediet, C.J.; Meyer, J.L.; Ritchie, K.B. Microbial Interactions on Coral Surfaces and Within the Coral Holobiont. In The Cnidaria Past, Present and Future; Springer: Berlin/Heidelberg, Germany, 2016; pp. 331–346. [Google Scholar]
- Hoegh-Guldberg, O.; Mumby, P.J.; Hooten, A.J.; Steneck, R.S.; Greenfield, P.; Gomez, E.; Harvell, C.D.; Sale, P.F.; Edwards, A.J.; Caldeira, K.; et al. Coral Reefs Under Rapid Climate Change and Ocean Acidification. Science 2007, 318, 1737–1742. [Google Scholar] [CrossRef] [PubMed]
- Roberts, J.M.; Murray, F.; Anagnostou, E.; Hennige, S.; Gori, A.; Henry, L.A.; Fox, A.; Kamenos, N.; Foster, G.L. The Cnidaria, Past, Present and Future; Goffredo, S., Dubinsky, Z., Eds.; Springer International Publishing: Berlin/Heidelberg, Germany, 2016; pp. 593–606. [Google Scholar]
- McClanahan, T.R.; Ateweberhan, M.; Muhando, C.A.; Maina, J.; Mohammed, M.S. Effects of climate and seawater tem-perature variation on coral bleaching and mortality. Ecol. Monogr. 2007, 77, 503–525. [Google Scholar] [CrossRef]
- Gravili, C. Zoogeography of Hydrozoa: Past, Present and a Look to the Future. In The Cnidaria Past, Present and Future; Springer: Berlin/Heidelberg, Germany, 2016; pp. 95–107. [Google Scholar]
- Loya, Y.; Slobodkin, L.B. The coral reefs of Eilat (Gulf of Eilat, Red Sea). Symp. Zool. Soc. London 1971, 28, 117–139. [Google Scholar]
- Loya, Y. Community structure and species diversity of hermatypic corals at Eilat, Red Sea. Mar. Biol. 1972, 13, 100–123. [Google Scholar] [CrossRef]
- Loya, Y. Possible effects of water pollution on the community structure of Red Sea corals. Mar. Biol. 1975, 29, 177–185. [Google Scholar] [CrossRef]
- Loya, Y. The Coral Reefs of Eilat—Past, Present and Future: Three Decades of Coral Community Structure Studies. In Coral Health and Disease; Springer Science and Business Media LLC.: Berlin/Heidelberg, Germany, 2004; pp. 1–34. [Google Scholar]
- Carlson, D.F.; Fredj, E.; Gildor, H. The annual cycle of vertical mixing and restratification in the Northern Gulf of Ei-lat/Aqaba (Red Sea) based on high temporal and vertical resolution observations. In Deep Sea Research Part I: Oceanographic Research Papers; Springer: Berlin/Heidelberg, Germany, 2014; Volume 84, pp. 1–17. [Google Scholar]
- Lazar, B.; Erez, J.; Silverman, J.; Rivlin, T.; Rivlin, A.; Dray, M.; Iluz, D. Recent environmental changes in the chemicalbio-logical oceanography of the Gulf of Aqaba (Eilat). In Aqaba-Eilat, the Improbable Gulf. Environment, Biodiversity and Preservation; Magnes Press: Jerusalem, Israel, 2008; pp. 49–61. [Google Scholar]
- Genin, A.; Lazar, B.; Brenner, S. Vertical mixing and coral death in the Red Sea following the eruption of Mount Pinatubo. Nat. Cell Biol. 1995, 377, 507–510. [Google Scholar] [CrossRef]
- Dubinsky, Z.; Iluz, D. Corals and Light: From Energy Source to Deadly Threat. In The Cnidaria, Past, Present and Future; Springer Science and Business Media LLC.: Berlin/Heidelberg, Germany, 2016; pp. 469–487. [Google Scholar]
- Bhattacharya, D.; Agrawal, S.; Aranda, M.; Baumgarten, S.; Belcaid, M.; Drake, J.L.; Erwin, D.; Foret, S.; Gates, R.D.; Gruber, D.F.; et al. Comparative genomics explains the evolutionary success of reef-forming corals. eLife 2016, 5, 5741. [Google Scholar] [CrossRef] [PubMed]
- Beijbom, O.; Edmunds, P.J.; Kline, D.I.; Mitchell, B.G.; Kriegman, D.J. Automated annotation of coral reef survey images. In Proceedings of the 2012 IEEE Conference on Computer Vision and Pattern Recognition, Providence, RI, USA, 16–21 June 2012; pp. 1170–1177. [Google Scholar]
- Colwell, R.K.; Coddington, J.A. Estimating terrestrial biodiversity through extrapolation. Philos. Trans. R. Soc. B Biol. Sci. 1994, 345, 101–118. [Google Scholar] [CrossRef]
- Raphael, A.; Dubinsky, Z.; Iluz, D.; Netanyahu, N.S. Neural Network Recognition of Marine Benthos and Corals. Divers 2020, 12, 29. [Google Scholar] [CrossRef]
- Raphael, A.; Dubinsky, Z.; Iluz, D.; Benichou, J.I.C.; Netanyahu, N.S. Deep neural network recognition of shallow water corals in the Gulf of Eilat (Aqaba). Sci. Rep. 2020, 10, 12959. [Google Scholar] [CrossRef] [PubMed]
Publisher’s Note: MDPI stays neutral with regard to jurisdictional claims in published maps and institutional affiliations. |
© 2021 by the authors. Licensee MDPI, Basel, Switzerland. This article is an open access article distributed under the terms and conditions of the Creative Commons Attribution (CC BY) license (https://creativecommons.org/licenses/by/4.0/).