1. Introduction
According to the World Bank, financial inclusion is immensely important as it contributes to reducing poverty and boosting prosperity. Financial inclusion plays a major role in the World Bank’s Sustainable Development Goals [
1]. The G20 has dedicated itself to promoting international financial inclusion and reaffirmed its pledge to adopt the G20 Digital Financial Inclusion High Level Principles. The World Bank Group considers financial inclusion a key factor in eliminating extreme poverty and fostering shared prosperity. Financial inclusion has consistently been a focus of IMF’s and World Bank’s financial sector reforms. In emerging markets such as Asia, Africa, and South America, financial inclusion is particularly important [
2]. It promotes affordable access to formal financial services that can boost overall economic growth and well-being. Often, those who need financial inclusion most, such as low-income families and micro businesses, have little or no access to financial services [
3].
Even if financial services are readily available, awareness among the target groups must be heightened in order to obtain buy-in. Marketing could potentially fill this gap. Given the need to satisfy a large customer base with individualized interactions, marketers can no longer rely on intuitive heuristics targeting the lowest common denominator. They need to find preferences, align messaging, customize value, and use the right channels for everyone. The growing need in advancing financial solutions means artificial intelligence (AI) can play a crucial role to enable providers to better understand the needs of potential customers. The problem which AI needs to solve should be customer-centered instead of product-centered. AI is uniquely capable of helping humans to understand the prospective customers’ preferences by deciphering patterns in the data.
However, until recently it has remained challenging for anyone who was untrained in computer programming to develop AI-based predictive models. This paper attempts to bridge the gap for financial service provider (FSP) analysts through a no-coding, AI-assisted probabilistic reasoning approach that allows them to examine counterfactual scenarios.
To understand the behavioral dynamics of target customers who may benefit from inclusive finance, this paper sets out four research questions aimed at exploring: (1) the characteristics of the legacy dataset used in this research, (2) the best-case scenario where customer purchase intent is highest, using a single criterion, (3) the best case using multi criteria, and (4) the worst case where the purchase intent is lowest.
The methods section describes the AI-based Bayesian Network approach and the dataset used in this paper. In the results section, the outcomes of the descriptive and predictive analytics are reported. The results are then discussed along with managerial implications and ethical considerations. The paper concludes by reiterating the democratization of AI through the application of a user-friendly AI tool (Bayesialab) and AI-Thinking in the context of financial inclusion.
1.1. Financial Inclusion for Social Good
To advance financial inclusion would involve making fundamental financial products and services such as payments, remittance, savings, loans and insurance accessible and affordable to individuals and small businesses. Financial access lets households and organizations prepare anything from long-term plans to unforeseen emergencies. Other financial services, including credit and insurance, are more likely to be used as account holders to expand their small businesses. In turn, it could lead to increased investments in education and healthcare, and consequently improve the overall quality of the lives of people who were previously underserved by FSPs.
Supporting the most vulnerable with tangible financial inclusion allows us to contribute toward the World Bank’s Sustainable Development Goals [
1]. Access to inclusive finance is crucial, particularly for the lower-income segment of the world’s population. This ensures capital to be deployed to the right place for the right reason at the right time. The low-income segment can still benefit from financial products if they have a telephone, despite not owning any bank account. Financial inclusion enables low-income households to be more resilient to economic shocks and can boost financial literacy at the population level.
1.2. Advancing Financial Inclusion for Social Good Using AI
The marketing of financial products or services to the currently unserved may add value to them, because they may not even be aware of such products or services that could help them save money, or obtain credit they need. FSPs have more valuable financial data than any other industry, and process a huge volume of transactions, which is a rich source of data that can be mined to determine what customers need. This is where AI can contribute towards social good [
4,
5,
6]. The value of the mined data could be harnessed if the conditions for success could be ranked by its relative importance. Prioritizing the most crucial conditions could help FSPs generate business insights in order to focus energies in the most impactful areas.
The application of AI [
7] and machine learning on legacy data can help financial institutions to anticipate how customers might respond to their marketing. Predicting the conditions that potential customers may respond poorly to marketing efforts is important. Potential customers would resonate well with financial offerings that provide versatility for them to adjust to changing circumstances in life.
Nevertheless, FSPs might not be doing enough in using their data to address the needs of potential customers. Through making better use of their data and the right expertise, FSPs can boost their performance with AI. However, there might be instances where FSPs are not ready to invest heavily in an integrated AI platform yet. Would it not be great if AI could be democratized so that financial professionals who may not be computer scientists or software programmers can also utilize it to better serve their potential customers?
The predictions generated by AI could inspire them to make recommendations by suggesting new directions and ideas based on customer data. Marketers can better understand their customers and trends and even find new business opportunities with tools that enable AI and human collaboration [
8]. Marketing teams will understand how certain concepts resonate with certain customer segments. This can lead to more questions and hypotheses for further AI-based analysis that is motivated by human creativity. A major factor toward this future would be the willingness of marketers to shed preconceived notions of what success should look like and become more open-minded to what success could look like. By using AI to analyze data, marketing teams can surface new findings, such as new patterns in the data, unexploited channel possibilities, or new target audiences. As AI uncovers incremental efficiencies, human analysts can raise questions that lead to changes in innovative strategies to address the needs of potential customers better. This can improve confidence between the potential customers and the FSP which offers them those innovative solutions. This could also further propel the FSP towards overall business transformation. It can be unnerving to move from using a non-AI-based deterministic machine that does exactly what you say to it, to a probabilistic AI-based machine that explores many options relentlessly. However, the upside is swift discovery. Marketing team cultures that are open-minded to change and invest in both people and technology will enable their teams to be future-proof and drive their businesses to successful transformation [
9].
The use of AI can ameliorate the asymmetry of information between the FSP and potential customers. Consequently, the FSP can extend credit or offer other financial services to micro companies or individuals which traditional banks do not support due to the lack of collaterals. We have the ability to develop and use AI for the betterment of humanity. Although AI can be relied to present predictions, humans are still required to take the lead in analyzing those predictions instead of being unquestionably led by AI. To facilitate the discussion on human-led analysis, we will introduce the concept of AI-Thinking in the following section.
1.3. The Theoretical Grounding of AI-Thinking
AI-Thinking is the way humans think when interacting with AI. Conceptualized by Zeng [
10], it is a framework that challenges people to discover new insights from data patterns generated from machine learning—a branch of AI.
In “classical” information communications technology (ICT), the computer systems simply execute the program designed by humans step-by-step in a deterministic manner. The ICT system cannot autonomously solve problems without humans. In AI-enhanced systems, humans do not have to tell the computers how to solve problems in a step-by-step deterministic manner. The AI-systems can learn and adapt as they interact with humans and their environment, thus freeing up humans to make better use of their time. Therefore, after AI has analyzed the problems in detail for humans, humans can engage in AI-Thinking to ask further questions (and even question the validity of the AI analysis itself). Subsequently, the human can interpret the contexts (and not just the content of the previously hidden patterns that have been revealed by AI) in multiple predictive scenarios via AI-empowered counterfactual multi-criteria optimization computational simulations to explore different possible outcomes. The simplest way to do that is for humans to intuitively ask “what-if?” questions to explore different hypothetical scenarios, so that AI can calculate the different outcomes for humans, who can then ponder and explore them even deeper.
The concept of “AI-Thinking” can be understood as follows: “AI” refers to the use of artificial intelligence as a tool, while “thinking” refers to the reasoning involving human-in-the-loop (HuIL) [
11]. AI-Thinking enables FSPs to identify new business opportunities which can lead to collaboration with experts from multidisciplinary fields [
12]. To be able to understand and interpret the technical results generated by AI, the FSP team must be adequately informed on the way information is processed by AI. In this context, for example, they would need to be aware of how Bayesian theorem works.
AI-Thinking is not to be mistaken as a linear way of generating thoughts. Rather, it is a type of complex human awareness involving the convergence of two simultaneous modes of cognition that eventually reaches a state of “vital simultaneities” [
13]. One mode is the analysis initiated by humans using AI which meaningfully informs human-centric logical reasoning, while the other mode is a human-centric logical reasoning that informs deeper analysis using AI. The two modes are inextricably connected and are not easily separated. That is the power of AI-Thinking. Because of the use of AI, humans can be empowered to do more thinking, and not less thinking. This is an empowering paradox indeed. With AI-Thinking, humans are expected to lead in the interpretation of the results produced by AI, and not be blindly led by it. Humans will continue to play a key cognitive role while AI supplements with its massive computing power.
1.4. Democratization of AI Implementation for FSP Analysts Who Are Not Computer Scientists
It is a common perception that AI is hard to understand [
14]. Nevertheless, AI has become so commonly deployed across myriad industries that it has heralded a new wave of industrial revolution. Hence, it is important for training people to solve problems not just using skills from any professional field, but also from AI as well. The use of AI-Thinking as a form of educational scaffolding for training people who are not computer scientists helps them to better understand AI. Consequently, they would be able to pose meaningful human-centric questions for substantive discussions with the various stakeholders [
15]. In this paper, a no-coding AI-based approach is illustrated to suggest how AI can assist in the intuitive use of human-centric probabilistic reasoning to interpret the counterfactual results generated by predictive models.
1.5. Research Problem and Questions
Knowledge about the application of AI has become a skill that companies would like their employees to possess—whether or not they were specifically taught in school [
16]. Is there a simple approach for beginners so that people who are unfamiliar with machine learning or advanced mathematical algorithms can also implement projects using AI? Moreover, is there any user-friendly AI program that can be easily used by novices in computer simulation scenarios to experiment with different variables? How easy would it be to share ideas from the AI-analyzed data by means of human-centric reasonings so that FSPs who are not familiar with computer science or mathematics can also understand and participate in discussions? The present paper argues that such an approach could be worth considering by beginners to AI. The probabilistic reasoning AI-based Bayesian Network (BN) approach [
17,
18,
19] is one such approach that is suitable for novices. Nonetheless, it would not be prudent to put unquestionable trust in the findings provided by the AI software. Humans should still demonstrate leadership when working with AI. For instance, the predictive models and results created by AI could be carefully considered via the analytical conceptual notions of AI-Thinking.
Logical thinking, probabilistic reasoning and data-driven machine learning are the paradigms that have informed the conceptual foundation of AI-Thinking [
20]. The use of AI as an analysis tool, the representation of data-driven complex information, as well as the development of AI are exemplars of cognitive involvement in AI-Thinking [
21]. Using this approach, predictive models can be intuitively used to address problems in real-world issues, as human-centric probabilistic reasoning-driven AI-Thinking is similar to human thinking [
22].
In this regard, the exemplars in the present paper are intended to offer opportunities for educing (drawing out) AI-Thinking. For instance, when considering how the prediction of the conditions would theoretically result in better or worse outcomes, AI-Thinking could be used. In probabilistic reasoning (for example through the probabilistic Bayesian reasoning approach) and in data-driven machine learning (for example, discovery of hidden patterns of relationships between variables), the cognitive scaffolds of AI-Thinking may also be utilized [
23].
The key benefit of BN is that its clear probabilistic theory helps users to intuitively understand the processes involved. It allows predictive reasoning as questions can be asked to determine the resulting probability of any outcome when it is provided with observational evidence. To ease beginners of AI into the concept of probabilistic reasoning using BN, the current paper will utilize a simple BN model. This predictive BN model can be used to assess the amount of direct and/or integrative influences which the variables might exert on the probability of good or bad outcomes on the prospective customer’s purchase intention toward the financial product or service being offered by the FSP. Further, BN modeling is used because it has been known for its reliability in real-world predictive applications [
24,
25]. To explore the “behavioral dynamics” of the FSP’s prospective customers, the key research questions that guide the current paper are:
- RQ1:
What is the current characterization of the variables and the outcomes (the purchase intention of the financial inclusion product) from the descriptive analysis of the dataset?
- RQ2:
From single-criterion predictive modeling analysis of the dataset, what are the optimized best-case scenario conditions that could result in a high level of purchase intention?
- RQ3:
From single-criterion predictive modeling analysis, what are the worst-case scenario conditions to avoid, so that a low level of purchase intention does not become the outcome?
- RQ4:
From multi-criteria predictive modeling analysis of the dataset, what are the optimized best-case scenario conditions that could result in a high level of purchase intention?
2. Methods
2.1. Reasons for Utilizing the AI-Based BN Approach
As a cornerstone of AI and machine learning, BN is widely used in AI research [
26], and is regarded as one of the simplest AI techniques for novices, as it is based upon human-centric probabilistic reasoning under uncertainty [
27]. Hence, the AI-based BN approach is akin to the intuitively probabilistic human reasoning process in real world situations [
28]. In combination with rising processing power in affordable computer hardware, BN has gained momentum in the research arena in recent years, despite its reputation for being computationally intensive [
29]. BN is ideal for non-parametric data studies since the model’s base parameters are not required to assume normal parametric distributions [
30,
31,
32]. The BN approach allows researchers to carry out simulations by incorporating prior knowledge into in-silico computational models. Consequently, if researchers use Bayesian data analysis methods, numerous rounds of tests for the null hypothesis [
33,
34,
35] become needless. Researchers have also utilized BN to quantify the concept of Mutual Information, as expounded in Claude Shannon’s Information Theory [
36] to measure the probability of commonality between two data distributions which may not be parametric. In real-world applications, BN excels in counterfactual simulations of conditions and their effects when uncertainty persists [
37].
2.2. The Bayesian Theorem
A brief introduction to the Bayesian paradigm is presented here. Readers who are interested in learning more deeply about BN may examine the research done by Cowell, Dawid, Lauritzen, and Spiegelhalter [
38], and by Jensen [
39].
Developed by Thomas Bayes [
28], and published posthumously by his friend in 1763, the Bayesian theorem is based on the mathematical formula (see Equation (1)).
where
H refers to the hypothesis, and
E represents the evidence gathered from observation.
P(H|E) symbolizes the conditional probability of the hypothesis
H. It analyzes the probability of
H becoming true given the condition that the evidence gathered
E is also true. This is referred to as the posterior probability, because it analyzes the likelihood of the hypothesis
H being true by measuring the probability that evidence
E impacts the outcome of the hypothesis
H.
P(H) represents the independent probability of the outcome of the hypothesis H being true. P(E) represents the independent probability of the evidence E being true. They are also known as the prior or marginal probabilities—P(H) and P(E), respectively. P(E|H) symbolizes the conditional probability of the evidence E being true, given the condition that the hypothesis H is also true. The expression P(E|H)/P(E) symbolizes the supportive basis which the hypothesis H is warranted by the evidence E.
2.3. The Research Model
The main aim of this paper is to demonstrate one way of how a FSP in a developing economy could harness AI to utilize data from an existing legacy database to explore opportunities of identifying segments of potential customers whom it could approach to offer financial inclusive products and services to. The secondary purpose is to provide exemplars of how humans could take the lead when using AI by educing (drawing out) AI-Thinking. In this paper, opportunities of where AI-Thinking could be applied will be highlighted when analysts use AI to machine-learn data for hidden relations between the variables. Such examples are not meant to promote BN as the best method to educe AI-Thinking. Rather, it is to allow researchers in FSPs to focus on the reliability of AI-based analytical approaches in a more general sense. As they utilize AI to analyze the data more deeply, they could raise more questions with stakeholders regarding the marketing of financial solutions to prospective customers, and in turn use AI to further simulate the outcomes of different scenarios. In other words, it is much more important to ask questions and explore opportunities for problem solving than to try to find the ever-elusive correct answer.
The Bayesian method is chosen as it is a technique that can be used to model the performance levels of systems using the Markov blanket conceptual framework [
40] and the Response Surface Methodology (RSM) [
41,
42,
43,
44]. They are proven engineering techniques to measure the probabilities of the relations between the theoretical constructs—even though they are not physically connected.
In subsequent sections, the detailed BN models will be presented. The present paper suggests a simple Bayesian technique to illustrate how non-computer scientists can also use AI-based methods to explore possible hidden motifs in a legacy dataset. To present this easy-to-use form of AI, the following will be explored:
Descriptive analysis of “what has happened?”
Objective: to discover the hidden relationships between variables and the outcomes in the data to answer RQ1. For descriptive analysis, BN modeling will automatically use the parameter estimation algorithm to detect the data distribution of each column in the data set.
Predictive analysis using “what-if?” hypothetical scenarios
Objective: to answer RQ2, RQ3, and RQ4, predictive modeling is used to perform simulations with parameters that can be controlled and varied in certain amounts, in order to predict counterfactual results in the purchase intentions of the prospective customers regarding the financial inclusive products and services being offered to them. Subsequently, the BN’s predictive efficiency will be assessed using techniques that include the gains curve, the lift curve, reliability, Gini index, lift index, calibration index, the binary log-loss, the correlation coefficient R, the coefficient of determination R2, root mean square error (RSME), and normalized root mean square error (NRSME).
2.4. Data Source
The current paper provides an approach that encourages discussions via predictive modeling analysis of a FSP’s marketing-related legacy dataset hosted by University of California at Irvine Machine Learning Repository [
45]. This legacy dataset was selected because it is archetypal of what a financial firm might already have collected from its years of operations before the advent of AI. Data from 2008 to 2013 was compiled by the donors Moro, Cortez and Rita. Presumably, the influence of the global financial crisis in 2008 might have shaped the characteristics of the data. The dataset comprised 45,211 rows of data. The dataset is disproportionate, with only 6,557 records (12.38%) that are associated with successful outcomes. The dataset is summarized in
Table 1.
2.5. AI-Based Machine Learning Software Used
The software that will be utilized in this paper is Bayesialab [
46]. After the dataset was imported into Bayesialab, the first thing it does is to search for any anomalies or missing values in the data. If missing values are found in the dataset, the AI software is capable of analyzing the overall structural features of that entire dataset before producing the predicted values through machine learning. The AI software employs the Structural EM as well as the Dynamic Imputation algorithms to estimate the missing values [
47]. Even though there were some missing values (10.8% of the data in the legacy database), they were predictively filled in by the AI software. Continuous-scale data points in multiple columns can be discretized by the AI software. The algorithm R2-GenOpt used in this example was an algorithm to maximize the R2 coefficient between the discrete and continuous variables [
48].
2.6. Overview of the Machine-Learning Approach
Before presenting the results of the machine learning process, here is a brief overview of the nomenclature used to describe the BN structure. The variables of interest are referred to as nodes, (both round and cornered rectangles representing histogram data distribution). Such nodes can symbolize categorical variables, discrete numerical variables, or discrete continuous variables. Although BN can handle continuous variables, this paper focuses on discrete variables, because classifying variables heuristically as high, mid, and low levels facilitates dialogue between multiple stakeholders in the FSP.
Visual constructs in the BN consist of nodes (variables) and arrows (probabilistic connections). Each node includes the distribution of the corresponding variable data. The arches or arrows connecting the nodes represent the likelihood of association between the variables [
49].
It should be remembered that the BN in this study is the result machine-learned by Bayesialab in probabilistic structural equation modeling (PSEM) mode. It is not a causative model diagram, so the arrows are not causal. They represent probabilistic relationships between parent and child nodes.
BN is suitable for evaluating the relationships between nodes (variable variables) and calculate how they may influence future outcomes of purchase intent levels. Conversely, given the final outcome, BN can also be used to conduct counterfactual inference in the nodes (variables). Examples will be discussed in the predictive analytics segments within the current paper to show how counterfactual simulations can be used with BN. If we wish to find out the conditions which would contribute to a high probability of purchase intention of the financial product or service, we may simulate such scenarios in the BN.
The relation between every pair of linked nodes (variable) is determined by its Conditional Probability Table (CPT). It contains the probabilities of mutual information between the data distribution of the parent node and the child node [
50]. In the CPT, the AI software can automatically machine-learn from the dataset and derive the data distribution values of each variable/node.
3. Results
3.1. Descriptive Analytics: What Are the Current Conditions in the Collected Data?
Section 3.1,
Section 3.2 and
Section 3.3 address RQ1. Supervised machine learning by using a naïve Bayes model is the easiest form of AI for novices to understand. Hence, it is used to analyze how input variables may influence outcomes. Descriptive analytics was first performed on the data to understand the features of the informational motif. Next, AI-based BN predictive modeling will use the machine-learned informational motif to produce simulations of scenarios to forecast counterfactual conditions. Such counterfactual results can inform FSP stakeholders involved in marketing the financial products about the conditions needed to achieve their desired target.
Figure 1 shows the results of the descriptive analytics.
In the collected data, 88.39% of the prospective customers contacted responded “no” in their intent to purchase the product (represented by the node “desired_target”). Only 11.61% responded “yes” in their purchasing intent.
The characteristics of the conditions that tend to influence this outcome is interpreted as follows. Most of the potential customers are in their 30s (42.64% of the total number of prospects), and there are less prospects in their 40s (around 18.97%) and 50s (around 14.94%). However, only 9.04% of the potential customers are young people in their 20s. Most of them work in “blue-collar” jobs (21.53%), followed by 20.92% who work in “management” jobs, 16.80% in “technician” jobs, and 11.44% in “admin” jobs. The remaining prospects identify their job categories as “entrepreneur” (3.29%), “housemaid” (2.74%), “retired” (5.01%), “self-employed” (3.49%), “services” (9.19%), “student” (2.07%), “unemployed” (2.88%), and “unknown” (0.64%). The highest education level of most prospective customers is “secondary” (51.32%), followed by “tertiary” (29.42%), “primary” (15.15%), and “unknown” (4.11%). More than half of them are married (60.19%), 11.52% are divorced, and 28.29% are single.
Slightly more prospective customers (55.74%) have a housing loan than those who do not (44.26%). The majority (98.20%) of the prospective customers do not have their credit in default, and only 1.80% do. The majority (83.96%) do not have personal loans.
Most of the prospective customers were contacted in the months of May (30.45%), June (11.81%), July (15.25%), August (13.82%), and November (8.78%). The FSP did not reach out much to prospective customers in the months of January (3.10%), February (5.86%), March (1.06%), April (6.49%), September (1.28%), October (1.63%), and December (0.47%). Further, it did not seem to matter which day the prospective customers were contacted, as the data was almost evenly distributed across the days of the month. The data also shows that 64.77% were contacted by the FSP via cellular phone, 6.43% via fixed line telephone, while the method used to contact the remaining 28.08% was unknown. The data also shows that overall, the potential customers have been contacted most frequently within the first six days of the month (17.77%), and least frequently between the 22nd day and the 26th day of the month. The duration of contact with most prospective customers (33.91%) is within 128 s, followed by 242 s (29.74%), 386 s (17.66%), 579 s (9.56%), and 852 s (5.36%). Only 3.77% of the prospective customers have been last contacted in the duration of 1268 s or more.
In the “campaign” node, the most prevalent frequency that a potential customer has been contacted is three times (39.87% of the prospects). The median frequency that an individual customer has been contacted is seven times (16.17% of the prospects). Only 5.15% of the potential customers have been contacted 15 times or more. The highest frequency of contacts performed before this campaign and for this client is between one to three times (72.88%), followed by between three and seven times (20.09%). Only 7.03% of the potential customers have been contacted 16 times or more. The number of days that passed by after the potential customer has been last contacted from a previous campaign is 224 days (28.66% of the total prospects), followed by 404 days (25.42%), 140 days (22.61%), and 309 days (16.73%). Only 3.66% of the prospects have been contacted within 62 days from a previous campaign. On the other hand, only 2.92% of the prospective customers have been last contacted 531 days or more from a previous campaign. Outright “failure” occurred 10.84% of the time while “success” was scarce (only 3.34%). However, the outcome of most of the contacted prospects was “unknown” (81.75%).
3.2. Mean-Target Total Effects Analysis
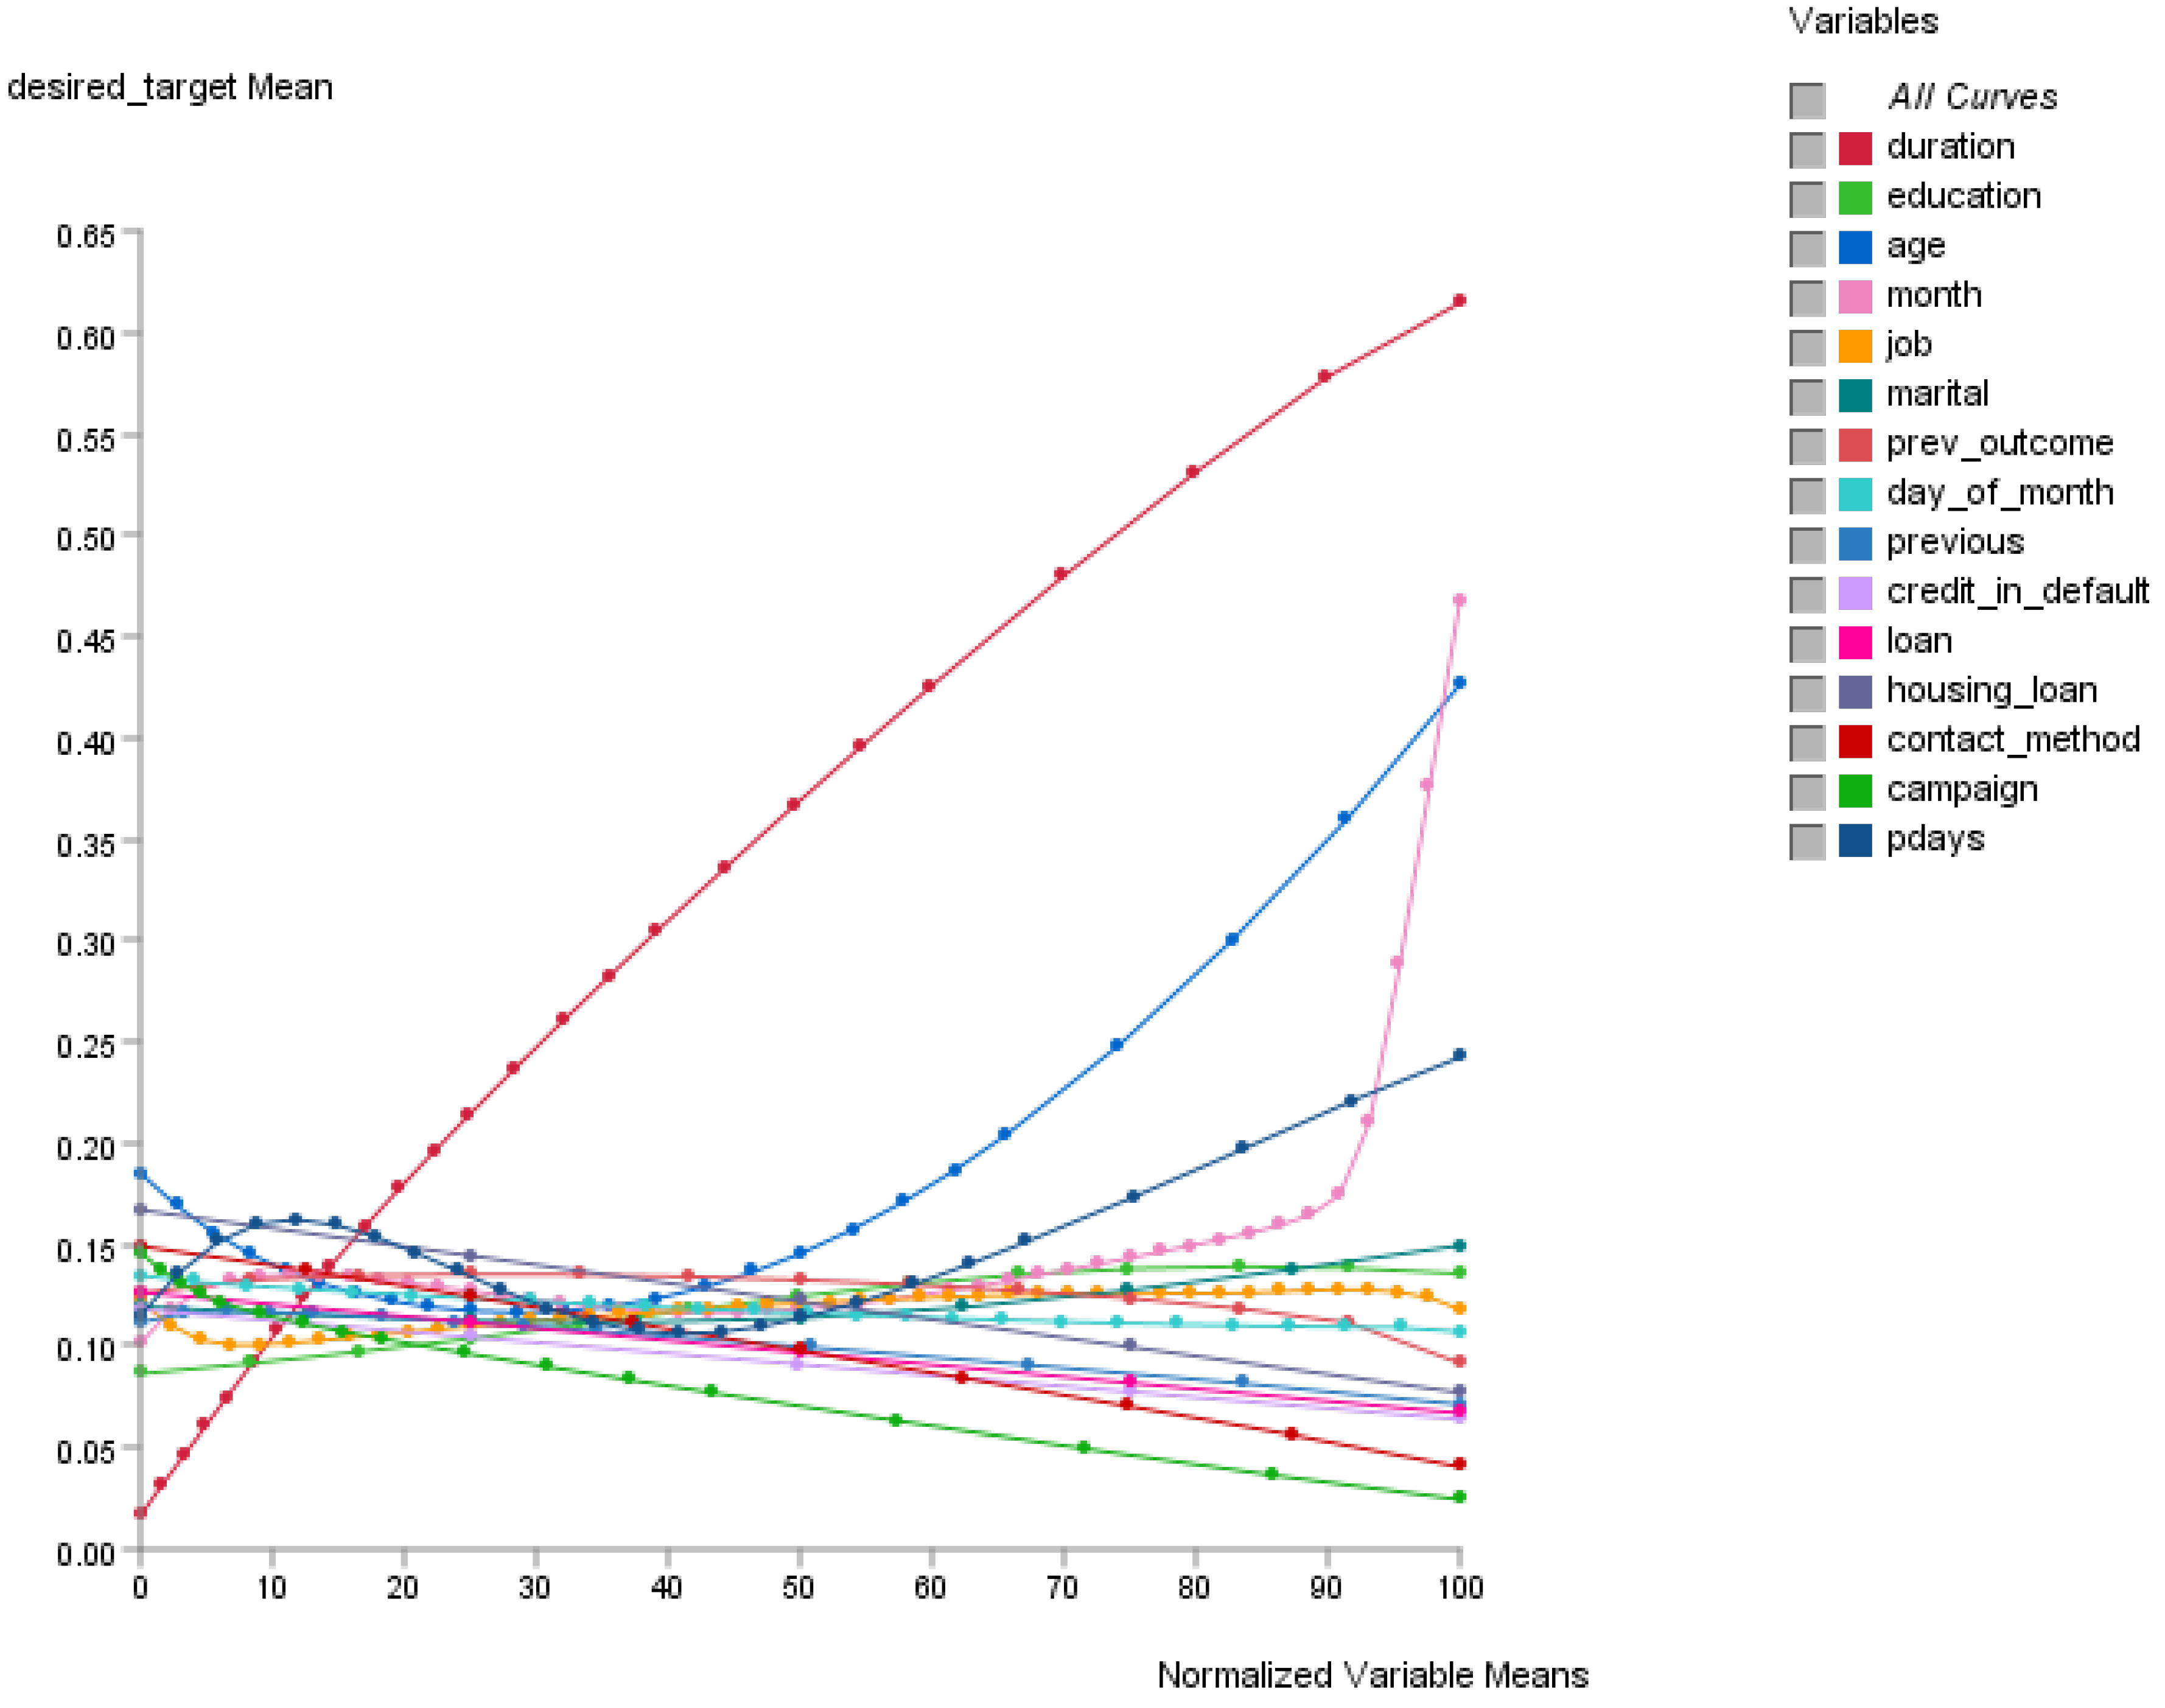
The Total Effects function in Bayesialab can be used to display effects on the target node in the BN. As observed in
Figure 2, the total effects of the variables on the target node (the outcome of desired_target) suggest that their relationships are almost never perfectly linear. In this situation, it would be impossible to utilize classical linear regression approaches. In the calculation of the likelihood of how curvilinear information from the variables will affect the outcome, the AI-based BN excels. This is because the concept of the Markov Blanket [
40], together with Response Surface Methodology (RSM) [
41,
42,
43,
44], can be used for the optimization of the relationships between variables for computational predictive modeling.
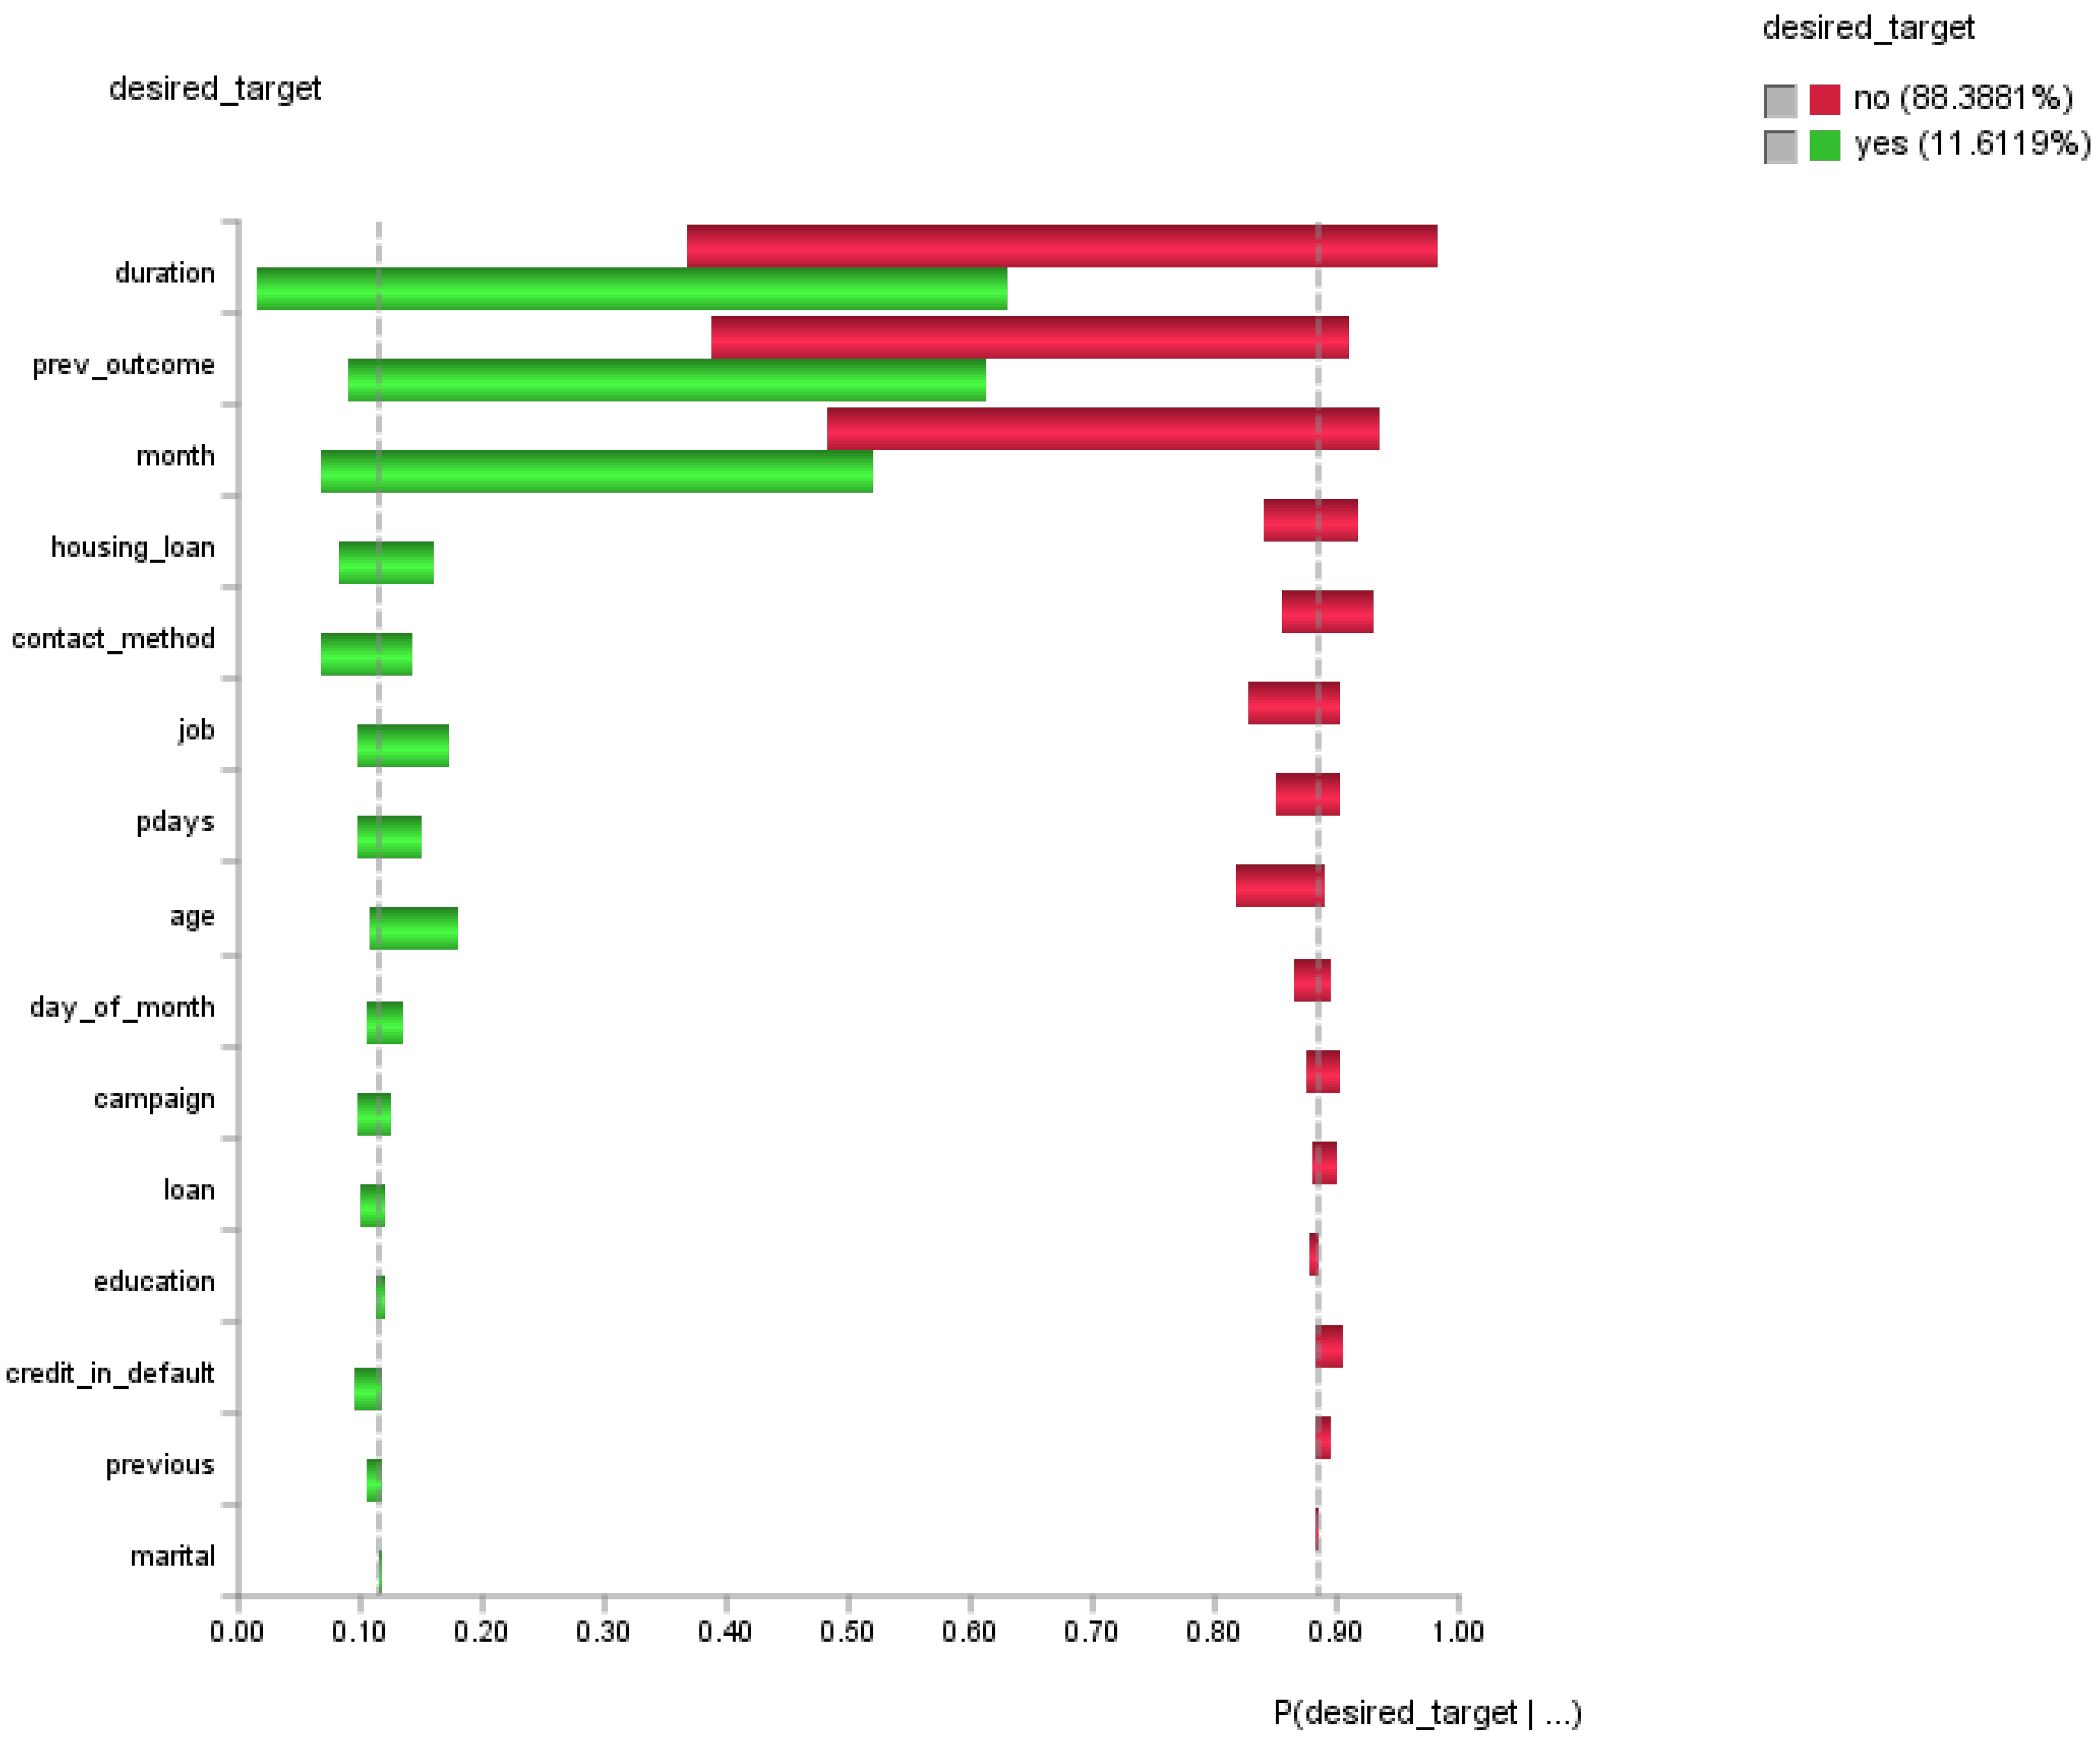
3.3. Sensitivity Analysis of the Variables that Influence the Prospective Customer’s Purchase Intent
Sensitivity analysis can be used for reporting the variables that are most influenced by uncertainty. By knowing each variable’s range of variability under uncertainty, the analyst could potentially exercise caution on the most sensitive indicators, as they could affect the eventual outcome [
51]. A tornado chart (see
Figure 3) was used to visualize the variables that could contribute (positively or negatively) to the outcome. The red bars highlight the variables which contribute to undesired outcome (desired_target = no); the green bars highlight the variables which contribute to desired outcome (desired_target = yes). In general, the longer horizontal bars require more attention whereas the shorter ones do not.
The preliminary results from the sensitivity analysis suggest that priority in attention should be given to improve the duration of the contact with customer (duration), outcome of the previous marketing campaign (prev_outcome), and last contact month of year of the current campaign (month).
3.4. Predictive Modeling Analysis: What Conditions Should Exist If We Wish to Achieve the Desired Outcome?
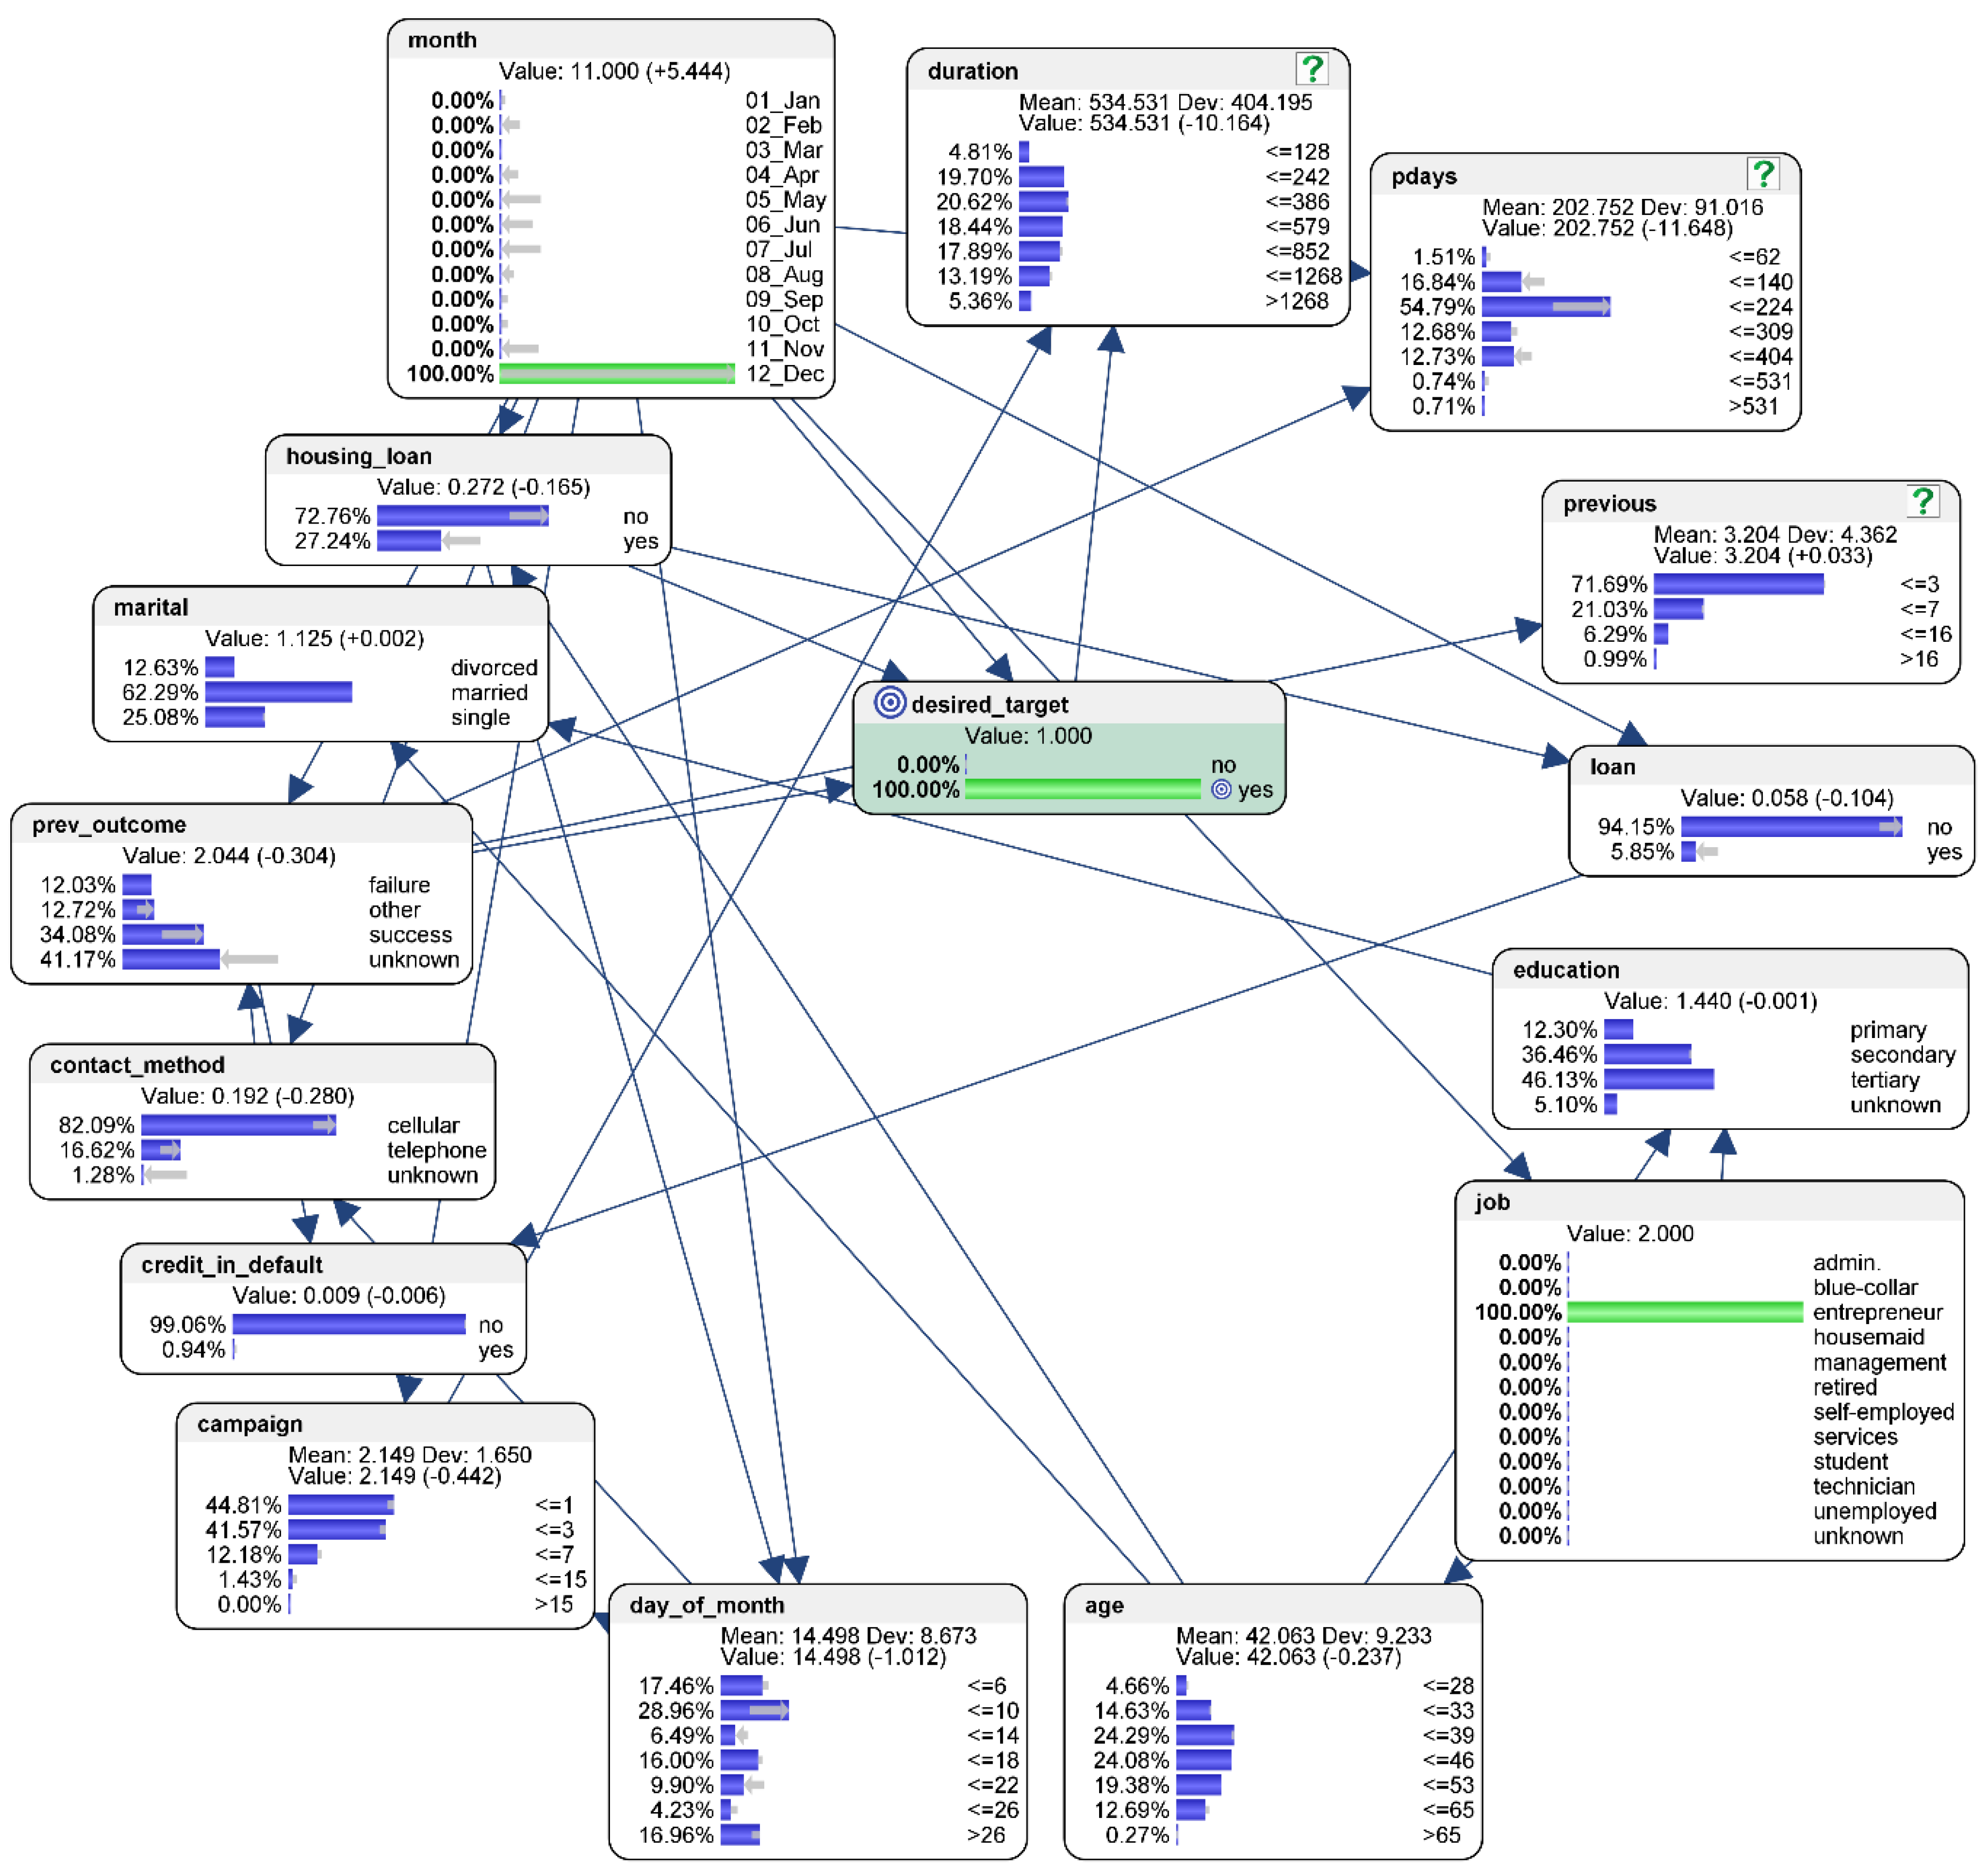
The single-criterion predicted counterfactual results for the best-case scenario are as follows (see
Figure 4). To address RQ2, suppose the desired outcome is that 100% of the potential customers would respond “yes” in the purchase intention to the financial inclusive product or service being offered by the FSP to them. To calculate the conditions for the best-case scenario, hard evidence is applied so that there is 0% of “no” in the “desired_target” node (compared to the original baseline level of 88.39% who responded “no”), and 100% of “yes” (compared to the original baseline level of 11.61% who responded “yes”) in their purchasing intent.
The characteristics of the conditions that tend to influence the best-case scenario could be interpreted as follows. The counterfactual simulation suggests that the probability of achieving the desired target would be higher if the FSP could reach out to younger people in their 20s, or to more people who work in “management” jobs, or to those who are have received “tertiary” level education. Marital status, however, has negligible influence on the outcome of the desired target.
The probability of achieving the desired target would be higher if the prospective customers do not have an existing housing or personal loan. The probability would also be higher if the prospective customers who are contacted do not have their credit in default.
The counterfactual simulation suggests that, instead of contacting prospective customers more frequently in some months, efforts to contact them should be more evenly spread out across the different months of the year. To achieve that, more efforts should be spent to contact the prospective customers in the months of February, March, April, September, October, and December. The probability of achieving the desired target is not affected by day of the month on which the prospective customer is contacted, as shown in the “day_of_month” node. The probability would also be higher if the prospective customers could be contacted by the FSP via cellular phone, or if the duration of contact could be lengthened.
When it comes to marketing campaigns, the counterfactual simulation suggests that the probability of achieving the desired target would be higher if the prospective customers are not contacted more than three times during the current and previous campaign. Further, if the last contact with the customer from a previous campaign was within 224 days, the probability of achieving the desired target would be higher too. Similarly, a previous successful contact of the same customer would suggest a higher probability of achieving the desired target.
3.5. Predictive Modeling Analysis: What Are The Conditions to Avoid to Prevent the Worst-Case Scenario from Happening?
The single-criterion predicted counterfactual results for the worst-case scenario are as follows (see
Figure 5). To address RQ3, simulation of the worst outcome assumes that 100% of the potential customers would respond “no” in the purchase intention to the financial product or service being offered by the FSP. To simulate the worst-case scenario, hard evidence is applied so that there is 100% of “no” in the “desired_target” node (compared to the original baseline level of 88.39% who responded “no”), and 0% of “yes” (compared to the original baseline level of 11.61% who responded “yes”) in their purchasing intent.
The characteristics of the conditions that tend to influence the worst-case scenario could be interpreted as follows. The counterfactual simulation suggests that the probability of achieving the desired target would be lower if the FSP reduces its efforts to reach out to more young people in their 20s, or those who work in “management” jobs, or have “tertiary” level education. The data suggests that marital status has negligible influence on the outcome of the desired target.
The simulation also suggests that the probability of achieving the worst outcome would be higher if the prospective customers already have an existing housing or personal loan. However, the probability of achieving the worst outcome would not be affected if prospective customers do not have their credit in default, since those types of customers should not be selected by the FSP marketing team in the first place.
The counterfactual simulation has shown that the worst outcome would occur if prospective customers are contacted primarily in the months of May, June, July, and August, whilst neglecting them in the rest of the year. However, the probability of achieving the worst outcome is not affected by day of the month on which the prospective customer is contacted. Contact via cellular phone or shorter duration of contact would likely produce worse outcomes.
In terms of marketing, the probability of achieving the desired target would be lower if the prospective customers are contacted more than three times in the current campaign but the number of times contacted in the previous round has negligible influence on the worst-case scenario outcome. If the number of days that passed by after the potential customer has been last contacted from a previous campaign is increased to 404 days (compared to 224 days in the original baseline), then the worst case is more likely to happen. The same outcome applies if the previous marketing campaign was “unknown” for that individual prospective customer.
3.6. Multi-Criteria Optimization Predictive Analytics: What are the Conditions Needed for Successful Marketing to Entrepreneurs in the Month of December?
Besides single criterion predictive analytics, the AI-based BN can also perform multi-criteria predictive modeling. To illustrate this powerful predictive capability, we can analyze the scenario posited by RQ4. It supposes that the FSP wishes to simulate the conditions needed for successfully offering a financial product or service in the month of December, specifically to small business operators who are currently underserved. To simulate the multi-criteria optimization scenario, hard evidence is applied so that there is 100% of “yes” in the “desired_target” node, 100% in the month of December in the “month” node, and 100% in “entrepreneur” in the “job” node. The multi-criteria predicted counterfactual results for the best-case scenario are as follows (see
Figure 6).
The characteristics of the conditions that could influence this multi-criteria optimization scenario are interpreted as follows. The counterfactual simulation suggests that the probability of achieving the desired target would be higher if the FSP increases its efforts to reach out to more people who are between 33 to 46 years old. However, the probability of achieving the multi-criteria outcome would not be affected by the entrepreneur’s level of education, or marital status.
The counterfactual simulation also suggests that the probability of achieving multi-criteria outcome would be higher if the prospective customers do not already have an existing housing or personal loan. There is no impact on the multi-criteria outcome when prospective customers do not have their credit in default, since those types of customers should not be selected by the FSP’s marketing team in the first place.
The results suggest that the probability of achieving the multi-criteria outcome can be increased if the prospective customer is contacted between the first 6th and 10th day of the month, via cellular phone or telephone, and if the duration of contact is around 386 s.
For the current campaign, the probability of achieving the multi-criteria outcome would be higher if the prospective customers are contacted no more than three times. In comparison, the number of contacts performed before this campaign and for this type of client has negligible influence on the worst-case scenario outcome. There is higher probability of achieving the multi-criteria outcome if the previous campaign was also successful, or less than 224 days has passed after the customer was last contacted from a previous campaign.
3.7. Evaluation of the Predictive Performance of the AI-Based Bayesian Network Model
3.7.1. Evaluation of the Predictive Performance using Target Cross-Validation by K-Folds
The BN model’s predictive performance can be assessed using tools such as the gains curve, lift curve, and cross-validation by k-folds. The results after target evaluation cross-validation by k-folds on the data distribution of each node in the BN are as follows. The Overall Precision was 90.2900%; the Mean Precision was 64.3216%; the Overall Reliability was 88.8423%; the Mean Reliability was 80.4018%; the Gini Index was 71.3673%; the Relative Gini Index was 80.8223%; the Lift Index was 2.5362; the Relative Lift Index was 80.6252%; the Receiver Operating Characteristic (ROC) Index was 90.4112%; the Calibration Index was 66.5590%; the Binary Log-Loss was 0.2305; the Correlation Coefficient R was 0.5766; the Coefficient of Determination R2 was 0.3324; the Root Mean Square Error (RMSE) was 0.2631; and the Normalized Root Mean Square Error (NRSME) was 26.3140%.
3.7.2. Evaluation of the Predictive Model using the Gains Curve and the Lift Curve
The gains curve (see
Figure 7) consisted of the blue diagonal line depicting the gains without using this predictive model. The red line delineated the gains after utilizing this predictive model. The Gini index of 71.37% and relative Gini index of 80.82% suggested that the gains of this predictive model was good as it was reasonably high.
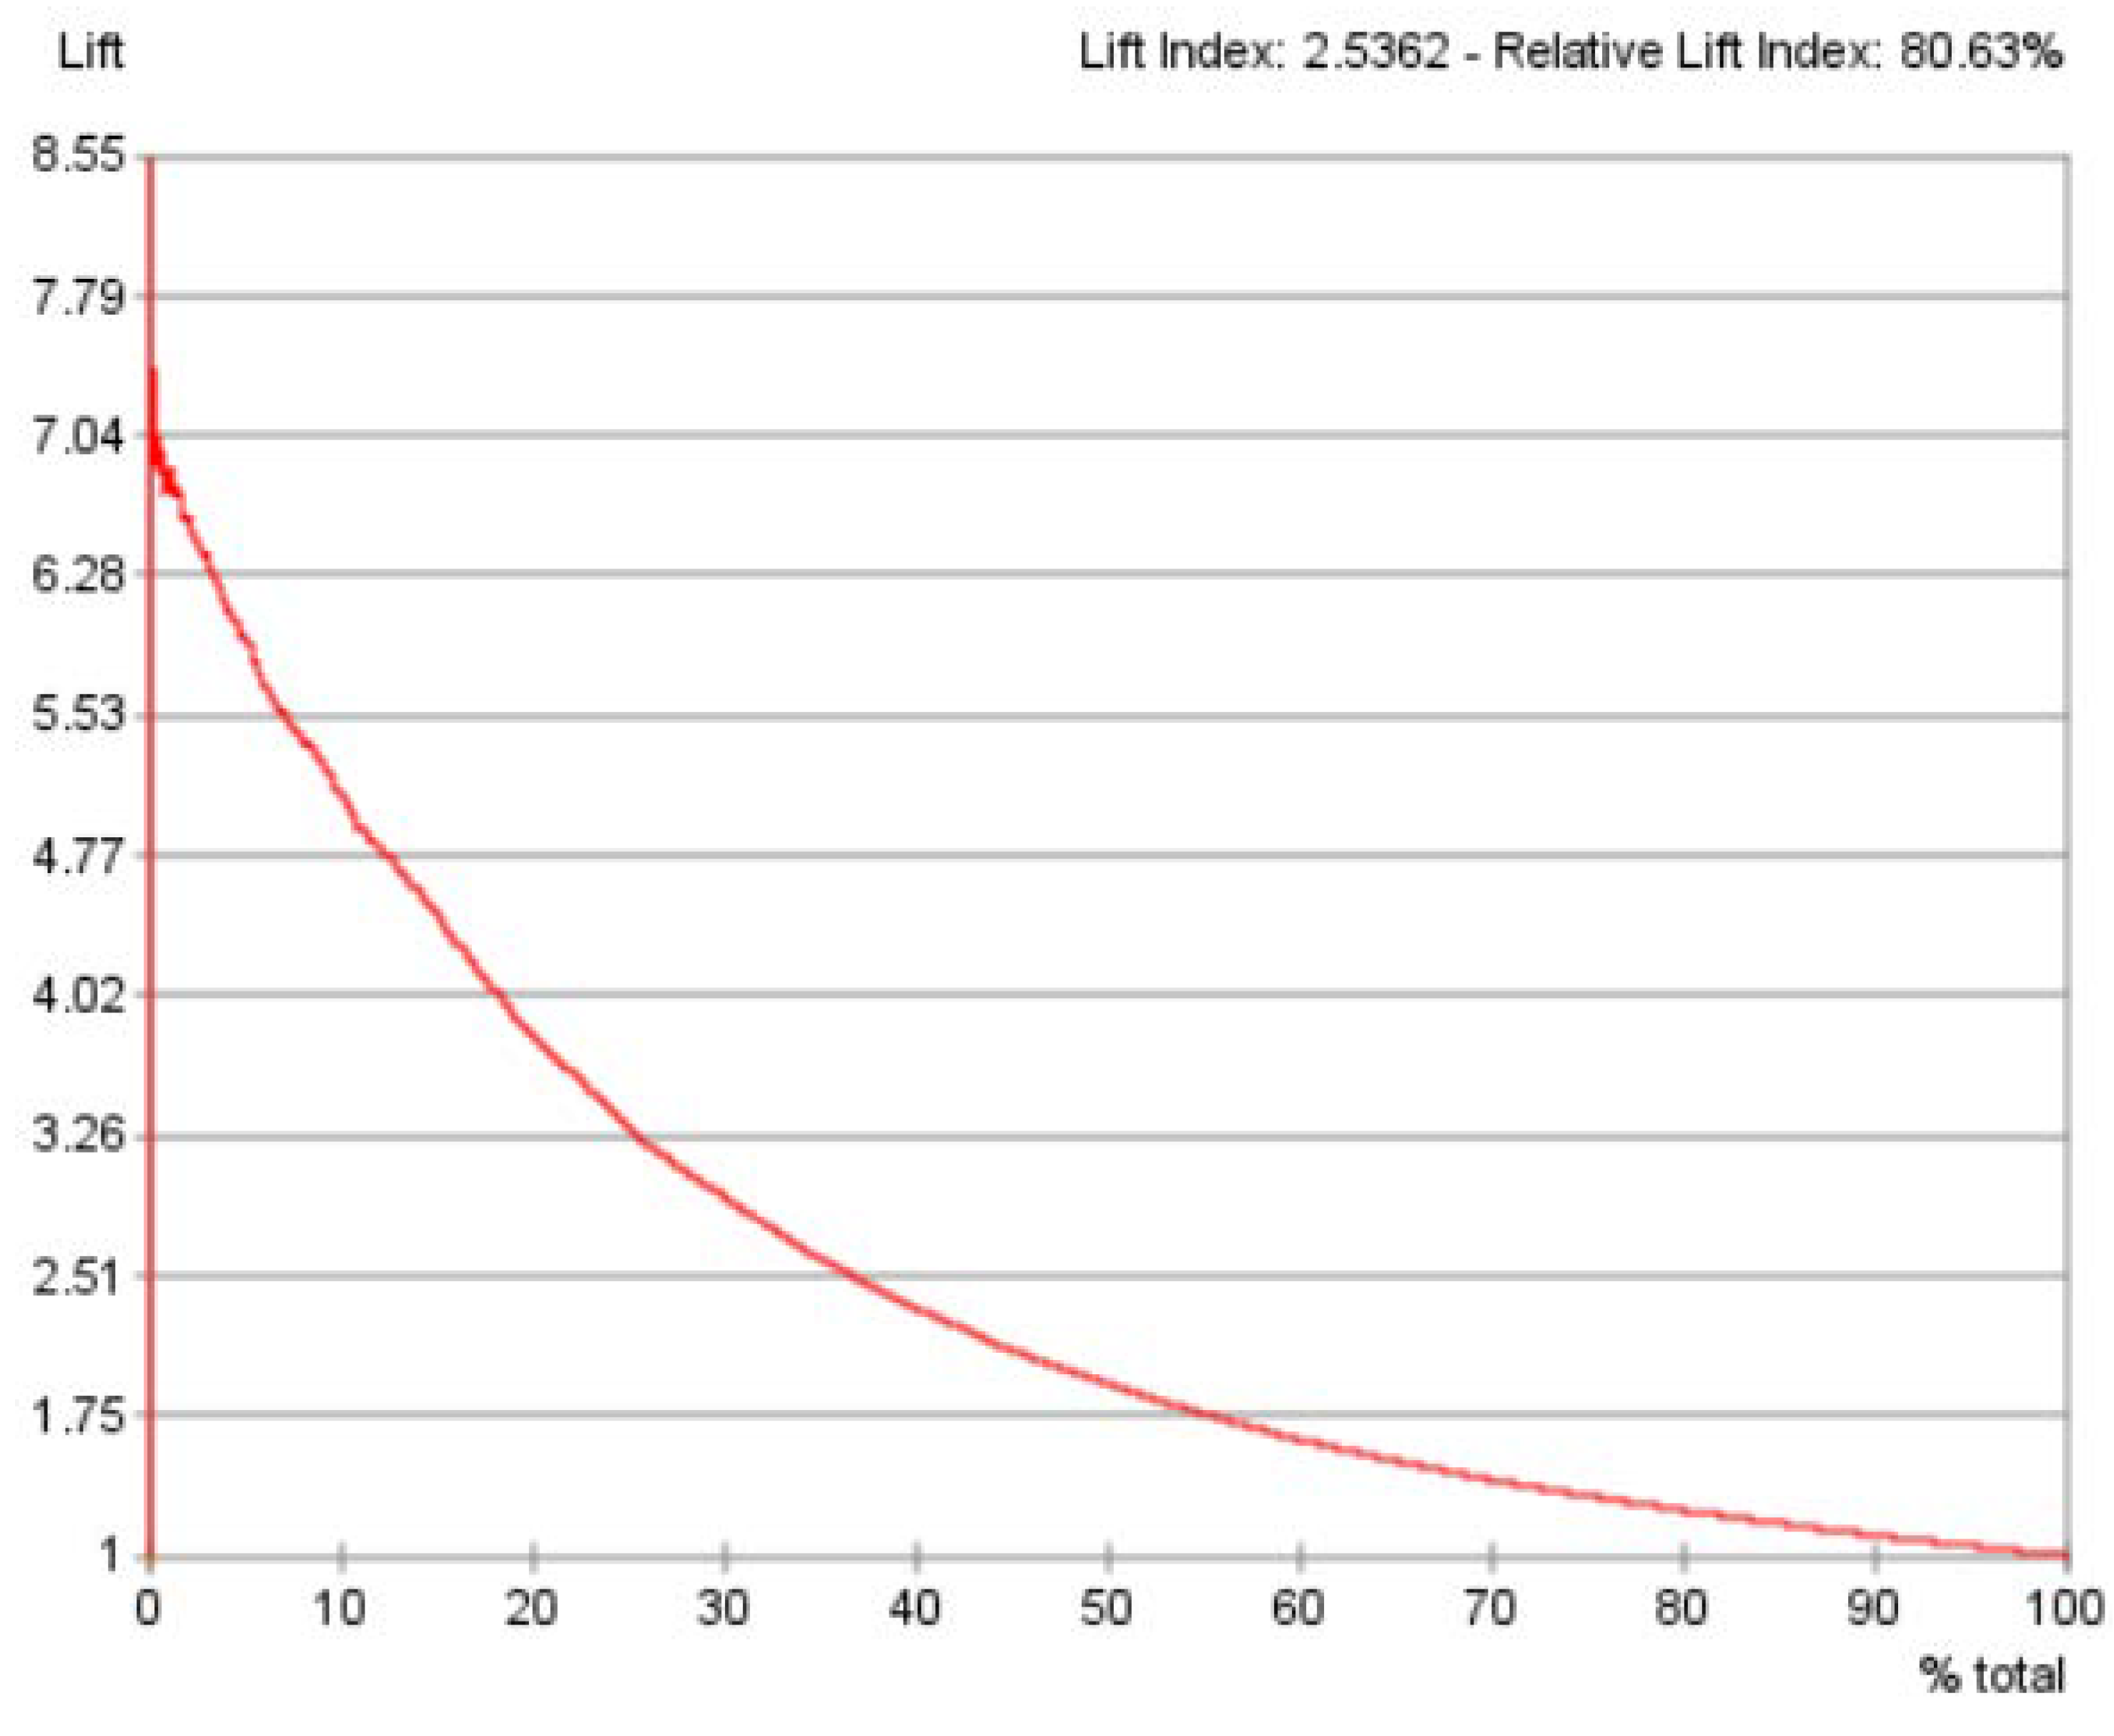
From the results of the previous gains curve, the lift curve (see
Figure 8) was generated. The best lift was around 7.04. The lift index of 2.5362 and relative lift index of 80.63% suggested that this predictive model yielded good performance. Considered together, the gains curve, and the lift curve indicated that the overall predictive performance of this BN model was good.
3.7.3. Using AI-Thinking to Consider the Limitations of the Study and AI
AI-Thinking can also be used here to ponder upon the limitations of this study, and also the constraints of the AI-based BN technique delineated thus far. The exploratory nature of BN predictive analytics in this research makes theoretical counterfactual results possible for discussions by experts from various business verticals in an FSP. However, the discursive counterfactual conjectures may not be conclusive. The present paper used only one approach in machine-learning for illustration purposes. In addition, this machine-learning approach was only applicable to BN models developed from the current dataset. Therefore, caution must be taken when determining the potential relationships between variables (nodes) in the BN model. The results rely on the dataset generated by the computational model, as with any simulations analysis. The BN model used in the current study was based on the naïve Bayes algorithm, as it is suitable for exploratory studies that do not assume causal node relationships. However, analysts should strive to find alternative models that could better describe the dataset.
The assessment techniques for the BN’s predictive performance, and the limitations of the study and the constraints of the AI-based BN technique have been described. Next, the discussion and the conclusion will be presented.
4. Discussion
4.1. Managerial Implications in the Use of AI by FSPs to Advance Financial Inclusion
Traditional FSPs in emerging markets might be interested in learning how to leverage on data using AI-based predictive modeling to foster financial inclusion, but they might have constraints on internal capacity or skills. Further, the value of legacy data may be underestimated by many FSPs. At first, it might seem that legacy data about previous encounters with the prospective customers might not yield much new information for practical insights. This paper provides examples of how FSPs can leverage on legacy data using a user-friendly, no-coding approach for fostering financial inclusion through actionable insights.
Data-driven predictive modeling via the use of AI can potentially help FSPs to learn more about their prospective customers, provide more meaningful interaction, and offer relevant financial products. Speaking to prospective customers continues to be a good source of knowledge to better understand their needs for promoting access to inclusive finance. Analysis of legacy data provides tremendous potential for promoting financial inclusion, in which prospective customer segments can be approached with greater probability of success. In this paper, the predictive analytics used went beyond descriptive statistics to search for trends in data that can be used to forecast the prospective customers’ purchase intentions. These actionable insights may be used to customize actions through more focused financial product designs or promotions via personalized marketing campaigns.
Given the strategic value of the legacy data analysis and its meaningful impact on fostering financial inclusion, managerial implications must be taken into account. For instance, cross-cutting corporate collaborations must be considered, in addition to delivering value to the specific objectives for individual business verticals. Coordination and collaboration between all business stakeholders in the FSP will be required. A working group consisting of members of each functional role or department is a good idea. Senior management and those interested in charting the organization’s strategic course to advance financial inclusion should be in the working group.
Data-driven communication across the organization can help to tear down the barriers between departmental silos. It encourages a big-picture view across business verticals as they strive together to advance financial inclusion. FSPs should be prepared to incorporate changes to effectively innovate, whether that means using different ways to look at old data or to implement new data and processes into existing structures.
4.2. Ethical Considerations in the Use of AI: An AI-Thinking Approach
AI offers tremendous benefits for economic growth, societal progress, as well as enhancements to human financial well-being. As the discipline of AI grows, it starts to expand into fields of decision-making, such as credit rating and banking, and can have significant impact on people’s lives. The ethical and moral issues associated with AI are important issues which need to be further explored in studies by researchers with expertise in myriad disciplinary and professional domains.
For example, the development of the AI program depends heavily on a vast volume of data, including personal and private data. For a start, these data must be carefully handled in order to avoid abuse and exploitation [
52]. Both the data per se and the action of recording it may cause privacy-related risks. It is, therefore, important to consider what should be recorded and who should take charge of recording the action, and who can have access to the data and records.
Another important aspect is human prejudice, such as gender bias [
53] and racial bias [
54], which could be unintentional. Since an AI system is typically developed by humans utilizing human-made datasets, current assumptions, prejudices might arise from the training data that contains human biases [
55]. Thus, research on how to design and train AI systems without human bias is worthy of further exploration in future studies. In the attempts to formulate ethical guidelines for AI, human ethics should also be considered to improve current ethical norms, and to strengthen our interpretation of ethical concepts and moral values in the AI era.
5. Conclusions
AI-Thinking can help FSPs to think and to re-think about how AI can assist humans to build stronger relationships with their prospective customers. Those who are not yet served by the traditional banking sector will benefit from new technologies such as AI-driven innovations and investments to boost productivity, increase living standards, unleash entrepreneurial capacity, and reduce economic inequalities. At the investment level, the FSP must switch from business models that seek quick returns to ones that provide potential customers with continued financially-inclusive support over the long term. Banks have historically relied heavily on “negative credit history” in which the credit review is carried out mainly by analyzing past problems with the customer. The major challenge is to do all this while creating the right organization vision, mission, and principles that must all have a higher purpose.
FSPs concerned with financial inclusion could use predictive analytics to simulate the scenarios that could not easily be achieved in the real world. The AI-based BN approach in the paper could be used to model a multitude of scenarios for estimating best and worse outcomes of the prospective customers’ purchase intentions. Other user-friendly BN software applications, such as GeNie by BayesFusion [
56], or Netica by Norsys [
57], or Bayes Server [
58], could also utilize the examples in the current paper. The examples in this paper could be easily adapted by interested FSP analysts to analyze their data.
This paper contributes significantly to the literature by offering an easy-to-use approach that does not require programming skills, so that the use of AI can be democratized and beginner users of AI can also carry out predictive modeling through probabilistic reasoning, which is similar to human thinking. As probabilistic reasoning is intuitively easy to understand, multiple stakeholders across business verticals in FSPs—rather than only computer scientists—can also utilize AI-Thinking and AI to develop predictive models which could contribute to advancing financial inclusion.


