Cooking Is Creating Emotion: A Study on Hinglish Sentiments of Youtube Cookery Channels Using Semi-Supervised Approach


Abstract
:1. Introduction
- RQ1. Which machine learning classifier works best for classifying the Hinglish text?
- RQ2. What are the useful patterns in the viewers’ comments?
- RQ3. What are the potential capabilities of using machine learning techniques in favour of Youtuber perspectives?
- RQ4. Do we find that the prospective digital approach supports the provider in the long run?
2. Related Work
- Text pre-processing
- Text categorization
- Machine learning
- Sentiment analysis
- A study on cookery channels
2.1. Text Pre-Processing
2.2. Text Categorization
- Single-label versus multi-label text categorization
- Document-pivoted versus category-pivoted categorization
- Hard categorization versus Ranking categorization
2.3. Machine Learning
Deep Learning
2.4. Sentiment Analysis
2.4.1. Sentiment Analysis on Hinglish
2.4.2. Sentiment Analysis Using Semi-Supervised Approach
2.5. A Study of Cookery Channels
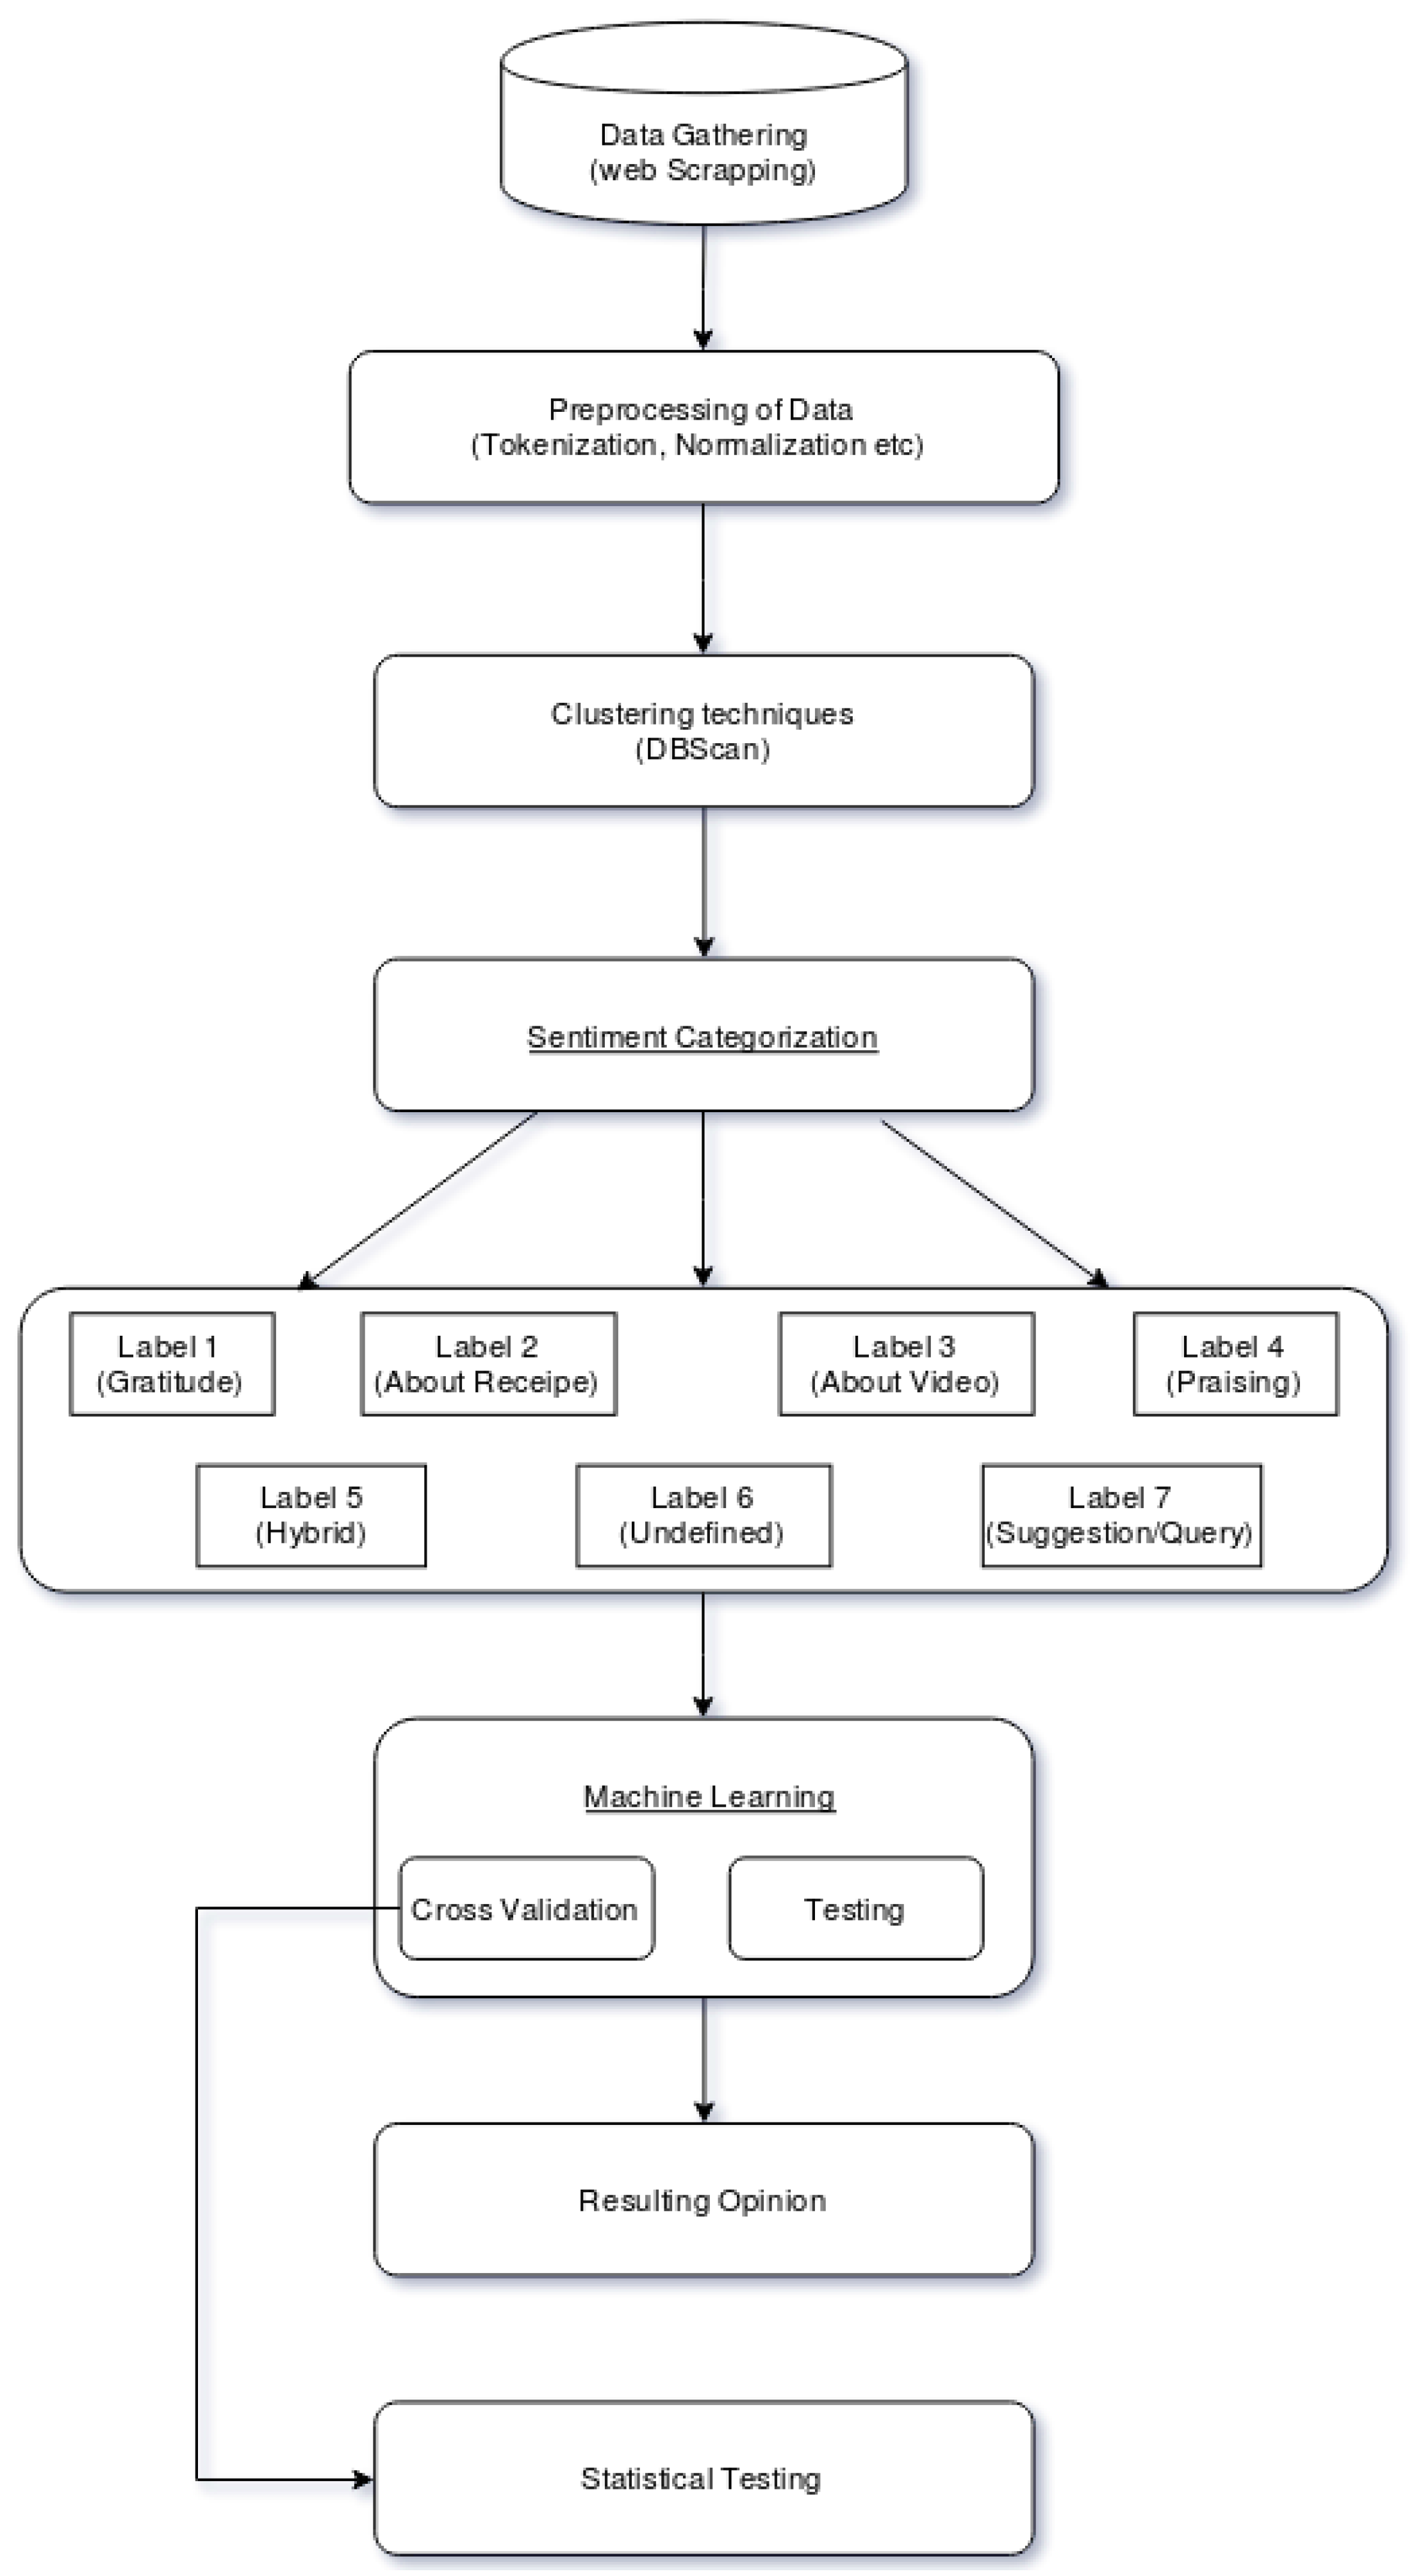
3. Methodology
- Data gathering: The data was gathered from the Youtube API. The top two cookery channels, named Nisha Madhulika Cooking Channel and Kabita’s Kitchen, were taken.
- Preprocessing: Preprocessing was done after gathering the data. Preprocessing includes the removal of stopwords, null values, numbers, special characters and punctuation, converting the document into lower case, tokenization and stemming.
- Clustering techniques: Clustering was done on our dataset to label the data. DBSCAN was used to cluster the data and then categorizations were made from the clusters.
- Sentiment categorization: The seven categorizations, as shown in Table 2, were made using the thematic analysis.
- Machine learning: Machine learning techniques were employed on the dataset. Cross validation was done on 70% of the training dataset and testing was done on the remaining 30% test dataset.
- Resulting opinion: We got the validation score after applying the machine learning models to the test dataset.
- Statistical testing: Statistical testing was done on the training score to be assured that the results were not got by chance.
3.1. Datasets
3.2. Experimental Methodology
3.2.1. Preprocessing
3.2.2. Clustering Techniques
3.2.3. Bag of Words
- Count occurence: This counts the number of times each word token appears in the document. The reason behind the usage of this approach is that keywords or important signals occur repetitively. The importance of the word is represented by the number of occurences of that word. The higher the frequency, the more important.
- Term frequency and inverse document frequency: In this approach, it is assumed that high frequency might not provide much information gain. In other words, more weight is contributed to the model by rare words. In tf-idf, words that appear regularly in few documents are given the highest rating and words that appear regularly in every document are given the lowest rating.
- Term frequency: Term Frequency (TF) is simply the ratio of the occurrence of each word token to the total number of word tokens in the document. The condition becomes more important for the summary presentation when the term has higher frequency.
3.2.4. Building the Machine Learning Model
4. Results
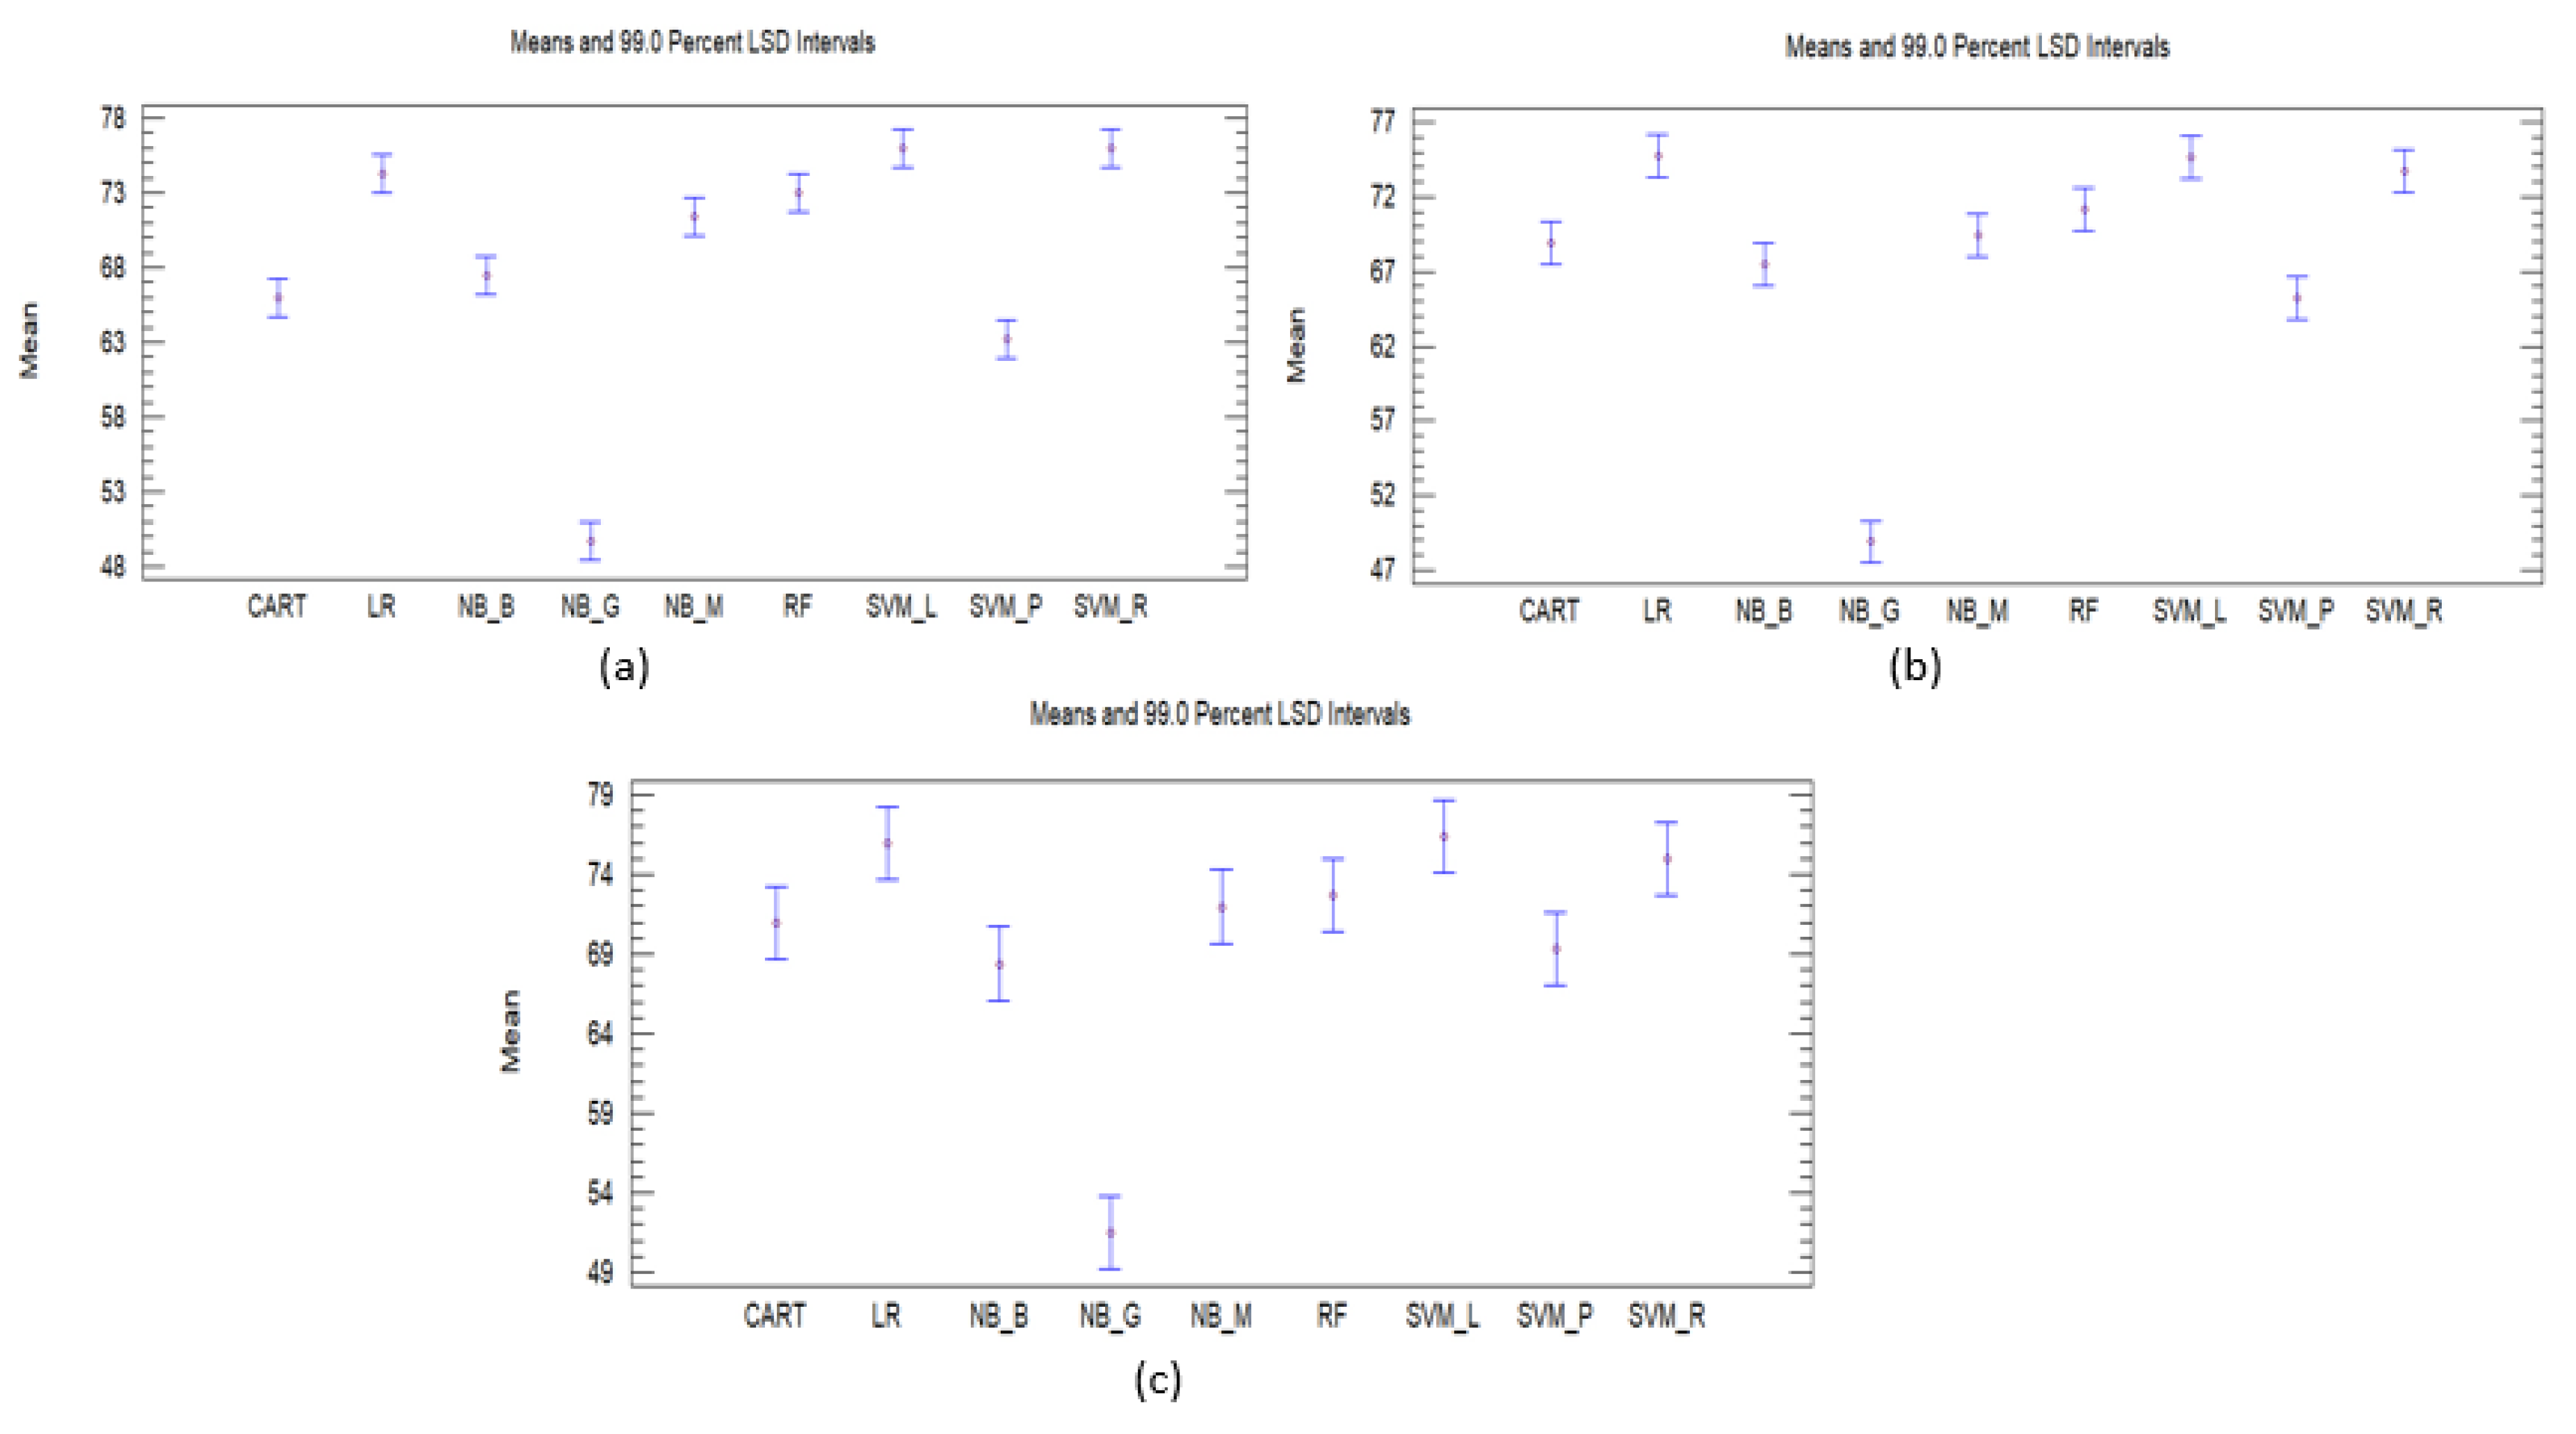
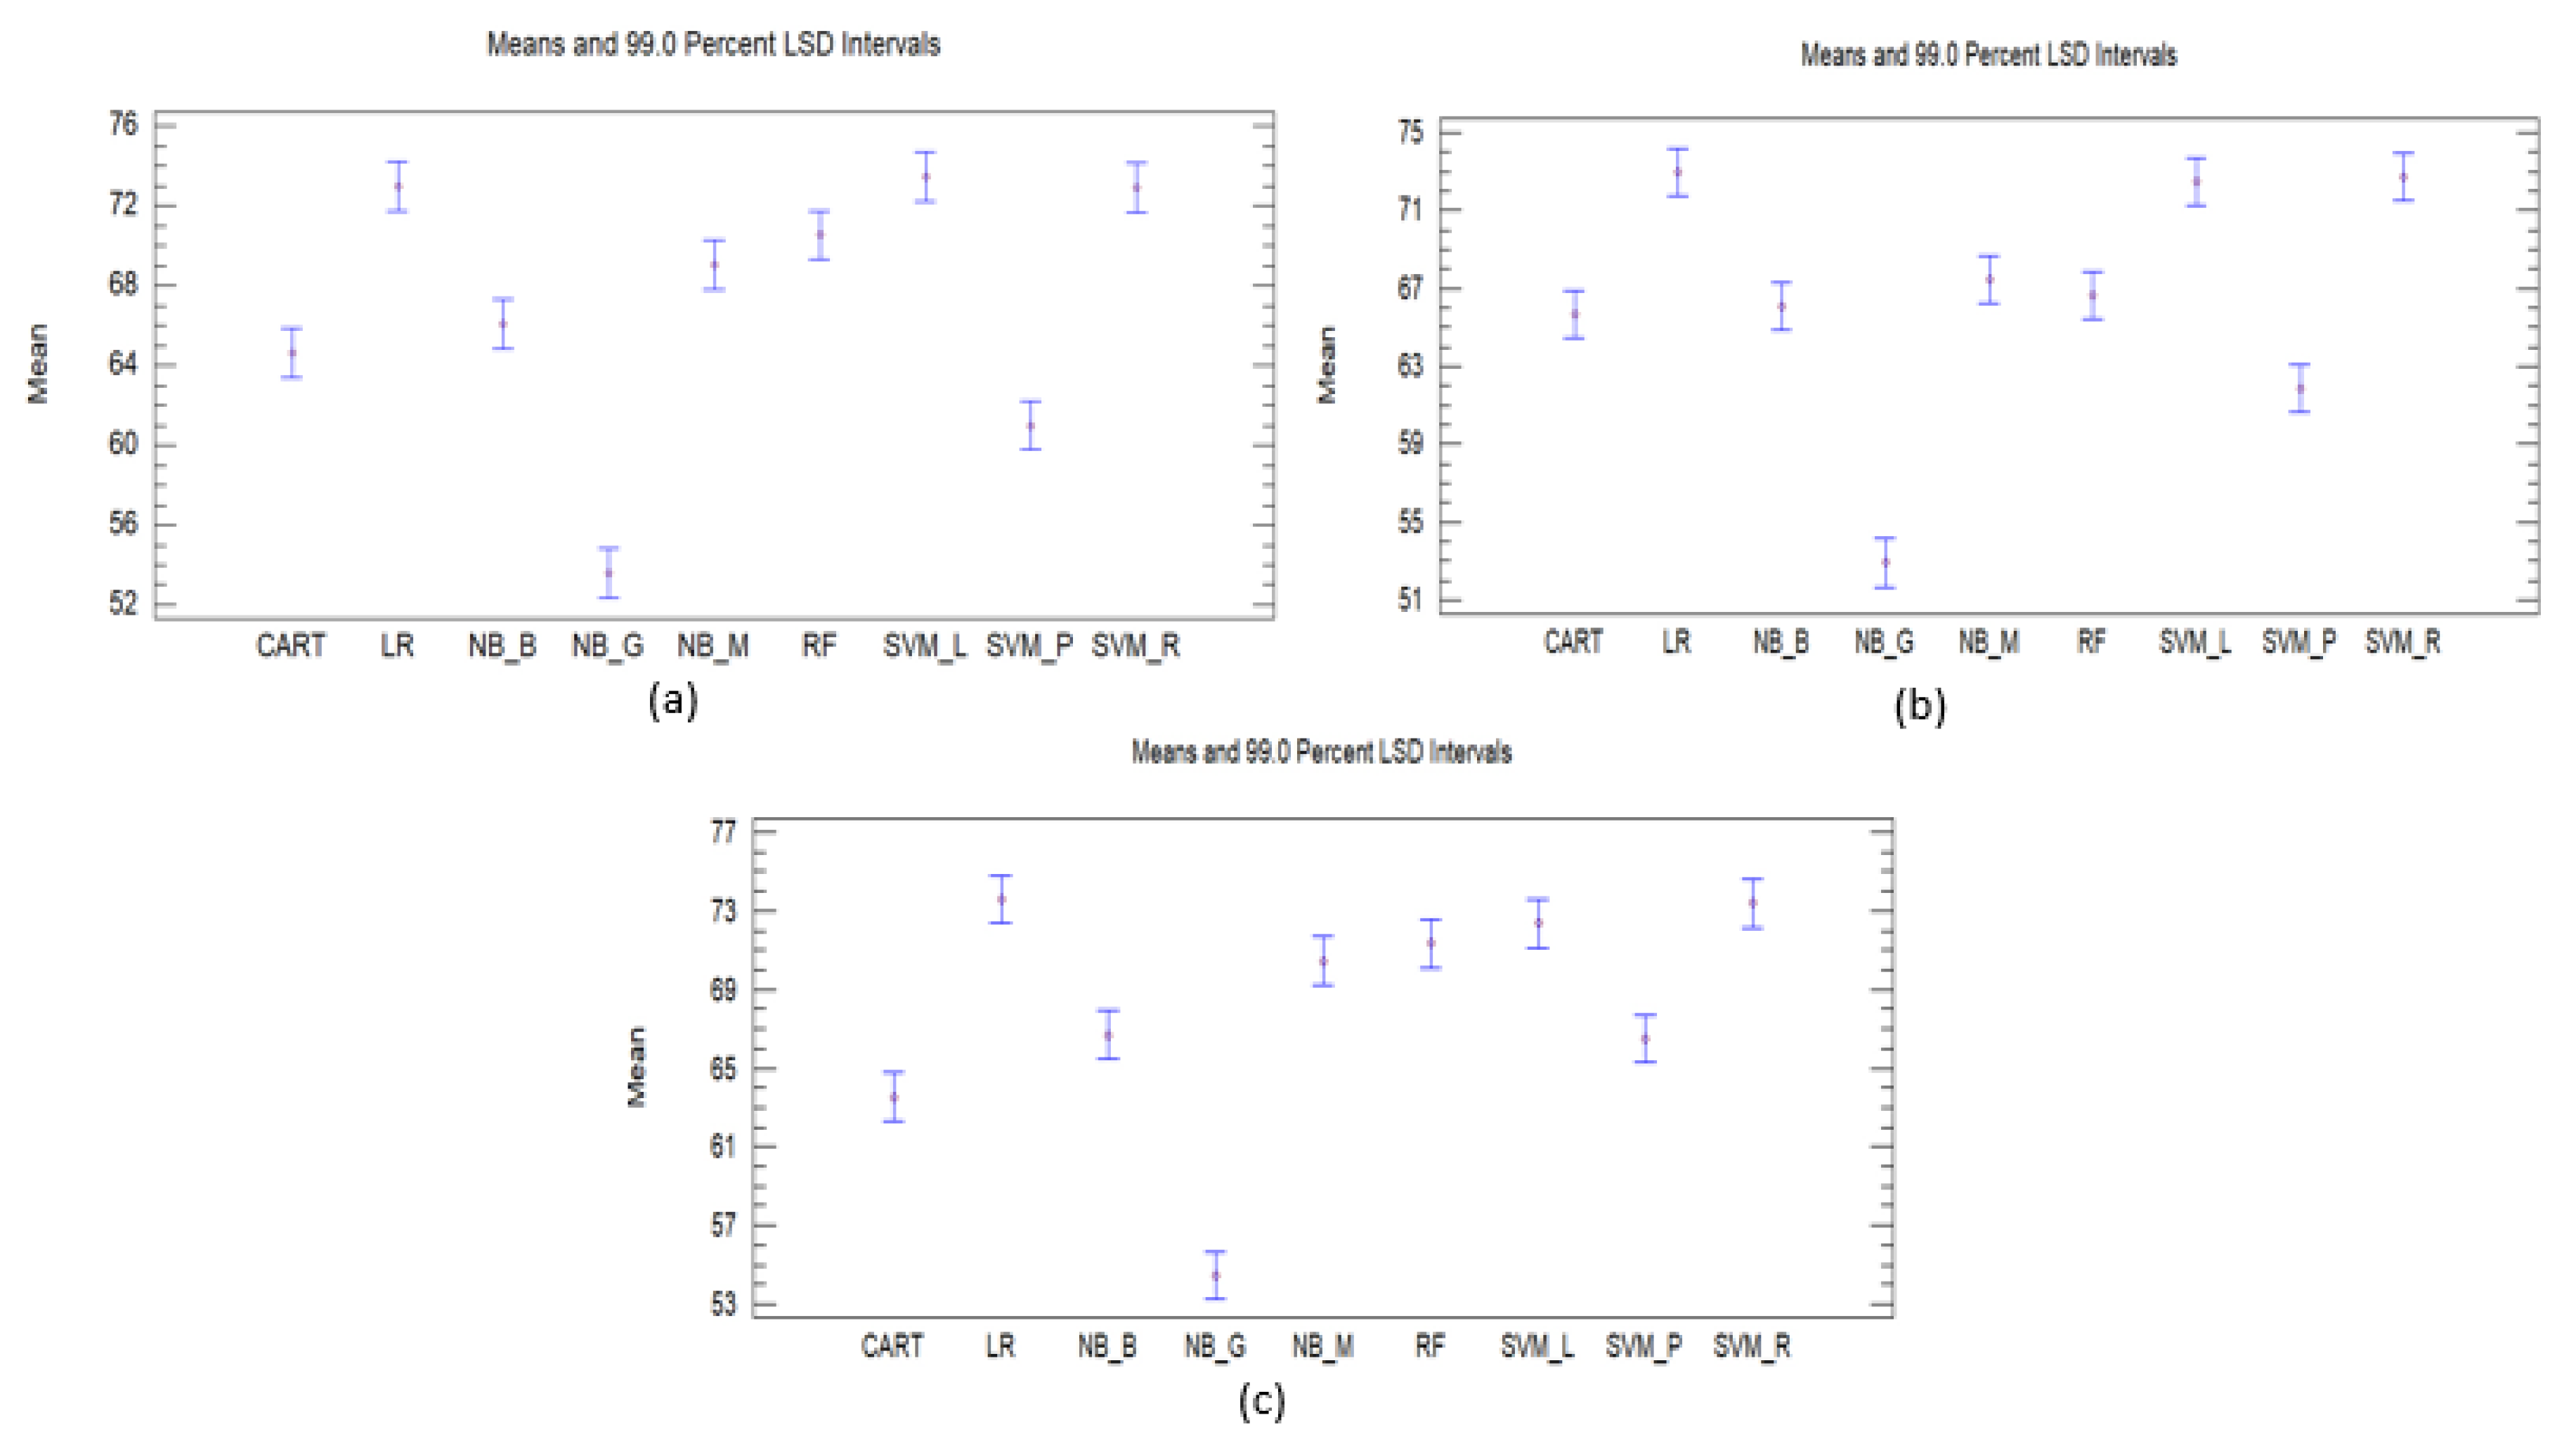
Statistical Testing
5. Discussion
5.1. Limitations
5.2. Findings
6. Conclusions and Future Work
Author Contributions
Funding
Conflicts of Interest
Abbreviations
| RF | Random Forest |
| NB-M | Multinomial Naive Bayes |
| NB-B | Bernoulli Naive Bayes |
| NB-G | Gaussian Naive Bayes |
| LR | Logistic Regression |
| SVM-L | Linear Support Vector Machine |
| SVM-P | Polynomial Support Vector Machine |
| SVM-R | Gaussian Support Vector Machine |
| CART | Decision Trees |
| DBSCAN | Density-based spatial clustering of applications with noise |
| LSD | Least significant difference |
| POS | Part of speech |
| BoW | Bag of words |
| RQ | Research Questions |
| MaxEnt | Maximum Entropy |
References
- Smith, K. Youtube Statistics. 2019. Available online: https://www.brandwatch.com/blog/Youtube-stats/ (accessed on 26 March 2019).
- Mitter, S. Youtube Monthly User Base Touches 225 Million in India, Reaches 80 pc of Internet Population. 2018. Available online: https://yourstory.com/2018/03/Youtube-monthly-user-base-touches-225-million-india-reaches-80-pc-internet-population (accessed on 26 March 2019).
- Maniou, T.A.; Bantimaroudis, P. Hybrid salience: Examining the role of traditional and digital media in the rise of the Greek radical left. Journalism 2018. [Google Scholar] [CrossRef]
- Zhao, J.; Gui, X. Comparison research on text pre-processing methods on twitter sentiment analysis. IEEE Access 2017, 5, 2870–2879. [Google Scholar]
- Pang, B.; Lee, L.; Vaithyanathan, S. Thumbs up?: Sentiment classification using machine learning techniques. In Proceedings of the ACL-02 Conference on Empirical Methods in Natural Language Processing; Association for Computational Linguistics: Stroudsburg, PA, USA, 2002; Volume 10, pp. 79–86. [Google Scholar]
- Martineau, J.C.; Finin, T. Delta tfidf: An improved feature space for sentiment analysis. In Proceedings of the Third International AAAI Conference on Weblogs and Social Media, San Jose, CA, USA, 17–20 May 2009. [Google Scholar]
- Pang, B.; Lee, L. A sentimental education: Sentiment analysis using subjectivity summarization based on minimum cuts. In Proceedings of the 42nd Annual Meeting on Association for Computational Linguistics, Barcelona, Spain, 21–26 July 2004; Association for Computational Linguistics: Stroudsburg, PA, USA, 2004; p. 271. [Google Scholar]
- Kaushik, A.; Naithani, S. A Study on Sentiment Analysis: Methods and Tools. Int. J. Sci. Res. (IJSR) 2014, 4, 287–292. [Google Scholar]
- Kaushik, A.; Naithani, S. A comprehensive study of text mining approach. Int. J. Comput. Sci. Netw. Secur. (IJCSNS) 2016, 16, 69. [Google Scholar]
- Liu, B. Sentiment Analysis and Opinion Mining. 2012. Available online: https://www.cs.uic.edu/~liub/FBS/SentimentAnalysis-and-OpinionMining.pdf (accessed on 10 April 2019).
- Xia, R.; Zong, C.; Li, S. Ensemble of feature sets and classification algorithms for sentiment classification. Inf. Sci. 2011, 181, 1138–1152. [Google Scholar] [CrossRef]
- Neethu, M.; Rajasree, R. Sentiment analysis in twitter using machine learning techniques. In Proceedings of the 2013 Fourth International Conference on Computing, Communications and Networking Technologies (ICCCNT), Tiruchengode, India, 4–6 July 2013; pp. 1–5. [Google Scholar]
- Domingos, P.; Pazzani, M. On the optimality of the simple Bayesian classifier under zero-one loss. Mach. Learn. 1997, 29, 103–130. [Google Scholar] [CrossRef]
- Gupte, A.; Joshi, S.; Gadgul, P.; Kadam, A.; Gupte, A. Comparative study of classification algorithms used in sentiment analysis. Int. J. Comput. Sci. Inf. Technol. 2014, 5, 6261–6264. [Google Scholar]
- Da Silva, N.F.; Hruschka, E.R.; Hruschka, E.R., Jr. Tweet sentiment analysis with classifier ensembles. Decis. Support Syst. 2014, 66, 170–179. [Google Scholar] [CrossRef]
- Abdi, A.; Shamsuddin, S.M.; Hasan, S.; Piran, J. Deep learning-based sentiment classification of evaluative text based on Multi-feature fusion. Inf. Process. Manag. 2019, 56, 1245–1259. [Google Scholar] [CrossRef]
- Arora, M.; Kansal, V. Character level embedding with deep convolutional neural network for text normalization of unstructured data for Twitter sentiment analysis. Soc. Netw. Anal. Min. 2019, 9, 12. [Google Scholar] [CrossRef]
- Vinodhini, G.; Chandrasekaran, R. Sentiment analysis and opinion mining: A survey. Int. J. 2012, 2, 282–292. [Google Scholar]
- Zhang, L.; Ghosh, R.; Dekhil, M.; Hsu, M.; Liu, B. Combining Lexicon-Based and Learning-Based Methods for Twitter Sentiment Analysis; Technical Report HPL-2011; HP Laboratories: Palo Alto, CA, USA, 2011. [Google Scholar]
- Bilal, M.; Israr, H.; Shahid, M.; Khan, A. Sentiment classification of Roman-Urdu opinions using Naive Bayesian, Decision Tree and KNN classification techniques. J. King Saud Univ. Comput. Inf. Sci. 2016, 28, 330–344. [Google Scholar] [CrossRef]
- Uysal, A.K. Feature Selection for Comment Spam Filtering on Youtube. Data Sci. Appl. 2018, 1, 4–8. [Google Scholar]
- Sharma, A.; Nandan, A.; Ralhan, R. An Investigation of Supervised Learning Methods for Authorship Attribution in Short Hinglish Texts using Char and Word N-grams. arXiv 2018, arXiv:1812.10281. [Google Scholar]
- Timoney, J.; Davis, B.; Raj, A. Nostalgic Sentiment Analysis of Youtube Comments for Chart Hits of the 20th Century. In Proceedings of the 26th AIAI Irish Conference on Artificial Intelligence and Cognitive Science, Dublin, Ireland, 6–7 December 2018; pp. 386–395. [Google Scholar]
- Trinto, N.I.; Ali, M.E. Detecting Multilabel Sentiment and Emotions from Bangla Youtube Comments. In Proceedings of the 2018 International Conference on Bangla Speech and Language Processing (ICBSLP), Sylhet, Bangladesh, 21–22 September 2018; pp. 1–6. [Google Scholar]
- Ravi, K.; Ravi, V. Sentiment classification of Hinglish text. In Proceedings of the 2016 3rd International Conference on Recent Advances in Information Technology (RAIT), Dhanbad, India, 3–5 March 2016; pp. 641–645. [Google Scholar]
- Kaur, H.; Mangat, V.; Krail, N. Dictionary based Sentiment Analysis of Hinglish text. Int. J. Adv. Res. Comput. Sci. 2017, 8, 816–823. [Google Scholar]
- Khan, F.H.; Qamar, U.; Bashir, S. A semi-supervised approach to sentiment analysis using revised sentiment strength based on SentiWordNet. Knowl. Inf. Syst. 2017, 51, 851–872. [Google Scholar] [CrossRef]
- Silva, N.F.F.D.; Coletta, L.F.; Hruschka, E.R. A survey and comparative study of tweet sentiment analysis via semi-supervised learning. Acm Comput. Surv. (CSUR) 2016, 49, 15. [Google Scholar] [CrossRef]
- Benkhelifa, R.; Laallam, F.Z. Opinion extraction and classification of real-time Youtube cooking recipes comments. In International Conference on Advanced Machine Learning Technologies and Applications; Springer: Cairo, Egypt, 2018; pp. 395–404. [Google Scholar]
- Bianchini, D.; De Antonellis, V.; De Franceschi, N.; Melchiori, M. PREFer: A prescription-based food recommender system. Comput. Stand. Interfaces 2017, 54, 64–75. [Google Scholar] [CrossRef]
- Pugsee, P.; Niyomvanich, M. Comment analysis for food recipe preferences. In Proceedings of the 2015 12th International Conference on Electrical Engineering/Electronics, Computer, Telecommunications and Information Technology (ECTI-CON), Hua Hin, Thailand, 24–27 June 2015; pp. 1–4. [Google Scholar]
- Yu, N.; Zhekova, D.; Liu, C.; Kübler, S. Do good recipes need butter? Predicting user ratings of online recipes. In Proceedings of the IJCAI Workshop on Cooking with Computers, Beijing, China, 3–9 August 2013. [Google Scholar]
- Kaushik, A.; Kaur, G. Youtube Cookery Channels Viewers Comments in Hinglish. 2019. Available online: https://zenodo.org/record/2841848 (accessed on 3 July 2019).
- Maudhika, N. Youtube Nisha’s Madhulika Cookery Channel. 2019. Available online: https://www.Youtube.com/user/NishaMadhulika (accessed on 6 March 2019).
- Kabita. Youtube Kabita’s Kitchen Cookery Channel. 2019. Available online: https://www.Youtube.com/channel/UCChqsCRFePrP2X897iQkyAA (accessed on 15 March 2019).
- Python. Python Link. 2019. Available online: https://www.python.org/ (accessed on 2 March 2019).
- Scikit. Scikit Version Link. 2019. Available online: https://scikit-learn.org/stable/ (accessed on 7 March 2019).
- Alberto, T.C.; Lochter, J.V.; Almeida, T.A. TubeSpam: Comment Spam Filtering on Youtube. In Proceedings of the 2015 IEEE 14th International Conference on Machine Learning and Applications (ICMLA), Miami, FL, USA, 9–11 December 2015; pp. 138–143. [Google Scholar] [CrossRef]
- Ketchum, C. The essence of cooking shows: How the food network constructs consumer fantasies. J. Commun. Inq. 2005, 29, 217–234. [Google Scholar] [CrossRef]


| Authors | Language | Datasets | Methods Used | Results |
|---|---|---|---|---|
| Neethu et al. [12] | English | Twitter posts about electronic products | SVM, Naive Bayes, MaxEnt and ensemble classifier | 90 (SVM, MaxEnt and ensemble classifier) |
| Domingos et al. [13] | English | Multiple sources | Naive Bayes | 96.9 (Naive Bayes) |
| Da Silva et al. [15] | English | Twitter posts about products | NB-M, RF, SVM and LR | 84.89 (Ensemble with lexicon) |
| Zhang et al. [19] | Cantonese | Internet Restaurant reviews | Naive Bayes and SVM | 95.6 (Naive Bayes) |
| Bilal et al. [20] | Roman-Urdu and English | Blogs | Naïve Bayes, CART and KNN | 97.50 (Naive Bayes) |
| Sharma et al. [22] | Hinglish | Different machine learning and feature selections | 95.07 (SVM with n-gram) | |
| Timoney et al. [23] | English | Youtube videos | Naive Bayes and CART | 86.09 (CART) |
| Trinto et al. [24] | Bangla, English and Romanized text | Youtube comments | 3 class multilabel and 5 class multilabel | 65.97 (3 class multilabel) |
| Ravi Kumar and Ravi Vadlamani [25] | Hinglish | Facebook comments | Information gain, gain ratio, chi-squared and correlation with supervised machine learning algorithms | 86 (TF-IDF, gain ratio and radial basis function neural network) |
| Kaur et al. [26] | Hinglish | Movie reviews from different sources | Classification algorithms | Prospective future work |
| Khan et al. [27] | English | Movie data and Amazon product review data | Lexicon based with the machine learning | 86.50 (Senti-Cosine with model selection) |
| Silva et al. [28] | English | Twitter comments | Graph-based, wrapper-based, and topic-based methods with SVM-L | 67.34 (SVM-L) |
| Benkhelifa et al. [29] | English | Youtube cooking recipes comments | Proposed algorithms for the subjectivity and sentiment classification | 95.3 (Sentiment classification) |
| Bianchini et al. [30] | English | Recipe dataset | Filtering algorithms | PREFer system is developed |
| Pugsee et al. [31] | English | Food data | SentiWordNet | Tool is made for the user to make their decision about the food recipe |
| Yu et al. [32] | English | Online recipes | Multi-class SVM | Reviews information is reliable |
| Pang et al. [5] | English | Movie review | Naive Bayes, MaxEnt, SVM with uni-grams, bi-grams and POS | 82.9 (SVM with unigram) |
| Pang, Bo and Lee [7] | English | Movie review | Naive Bayes, MaxEnt, SVM | 86.4 (Naive Bayes) |
| Xia et al. [11] | English | Movie reviews from Amazon | Naive Bayes, MaxEnt, SVM with feature selection techniques like uni-gram, bi-grams, dependency grammar and joint feature | 88.65 (WR-based ensemble) |
| Martineau et al. [6] | English | Movie review data | SVM with delta tf-idf | 99.8 (Subjectivity classification) |
| Labels | Description |
|---|---|
| Label-1 (Gratitude) | This gives a description about gratitude. Here the users show their gratitude to the chef. For instance: thank aunty g, thank you, thank you much, thank you so much madam, thank mem, thank u much mem. |
| Label-2 (About recipe) | This gives a description about the recipe. Here the users express their views about the recipe, whether it is good, tasty, delicious, etc. For instance: yummy, very delicious, delicious, yummy nice one, nice yummy, very nice yummy, very testi, very testy, testy, tasty, so tasty, very tasty, very nice recipe mam, nice recipe. |
| Label-3 (About video) | This gives a description about the video. Here the users express their views about the video, whether the video is good or not, long or short, etc. For instance: nice, superb, awesome, wow, nyc, super mam, very nice mam, super, nice aunty, wow nice mam, nice video, very nice, good, so good, nice Nisha mam, mast, nic, really nice, awesome nisha ji, wonderful, nice mem, nyc aunty ji. |
| Label-4 (Praising) | This gives a description about praising the chef. Here the users express their admiration to the chef. For instance: you sweet, sweet, r great, great, u r good mam, u best, u amazing, u r awesome mam. |
| Label-5 (Hybrid) | In this label we combined two or more labels. Suppose users are expressing their gratitude and admiration to the chef, then it is labelled as hybrid. For instance: thank you for this nice recipe!! |
| Label-6 (Undefined) | Those comments made by the user which are not defined in any category are kept in this label. Here the user is not talking about the recipe, video or not paying gratitude to the chef. They are also not praising the chef or asking any questions of the chef. For instance: please reply mam. |
| Label-7 (Suggestion or queries) | This label describes the questions asked by the users. Here users either ask for suggestions or put their queries about the recipe to the chef. For instance: Which flour to be used? What is the substitute for this or that? What if we do this or that? |
| Dataset | Label 1 | Label 2 | Label 3 | Label 4 | Label 5 | Label 6 | Label 7 | Total Comments |
|---|---|---|---|---|---|---|---|---|
| Nisha Madhulika | 700 | 700 | 700 | 700 | 700 | 700 | 700 | 4900 |
| Kabita’s Kitchen | 700 | 700 | 700 | 700 | 700 | 700 | 700 | 4900 |
| Algorithm | Classification Techniques |
|---|---|
| CART | Decision tree |
| LR | Logistic regression |
| NB-B | Bernoulli Naïve Bayes |
| NB-G | Gaussian Naïve Bayes |
| NB-M | Multidimensional Naïve Bayes |
| RF | Random forests |
| SVM-L | Support vector machine with linear kernel |
| SVM-P | Support vector machine with polynomial kernel |
| SVM-R | Support vector machine with gaussian kernel |
| Method | Parameter | Nisha Madhulika | Kabita’s Kitchen | ||||
|---|---|---|---|---|---|---|---|
| tf-idf | Count | Term | tf-idf | Count | Term | ||
| LR | C | 10 | 10 | 10 | 10 | 10 | 10 |
| NB-B | 0.1 | 0.1 | 0.1 | 0.1 | 0.1 | 0.1 | |
| NB-M | 1.0 | 0.1 | 0.1 | 1.0 | 0.1 | 0.1 | |
| RF | # trees | 80 | 50 | 100 | 100 | 100 | 100 |
| SVM-L | C | 1.0 | 1.0 | 1.0 | 1.0 | 1.0 | 1.0 |
| SVM-P | C | 0.1 | 0.001 | 0.001 | 0.01 | 0.1 | 0.01 |
| 100 | 10 | 100 | 10 | 10 | 100 | ||
| SVM-R | C | 1000 | 100 | 100 | 1000 | 1000 | 1000 |
| 0.001 | 0.01 | 0.001 | 0.001 | 0.001 | 0.1 |
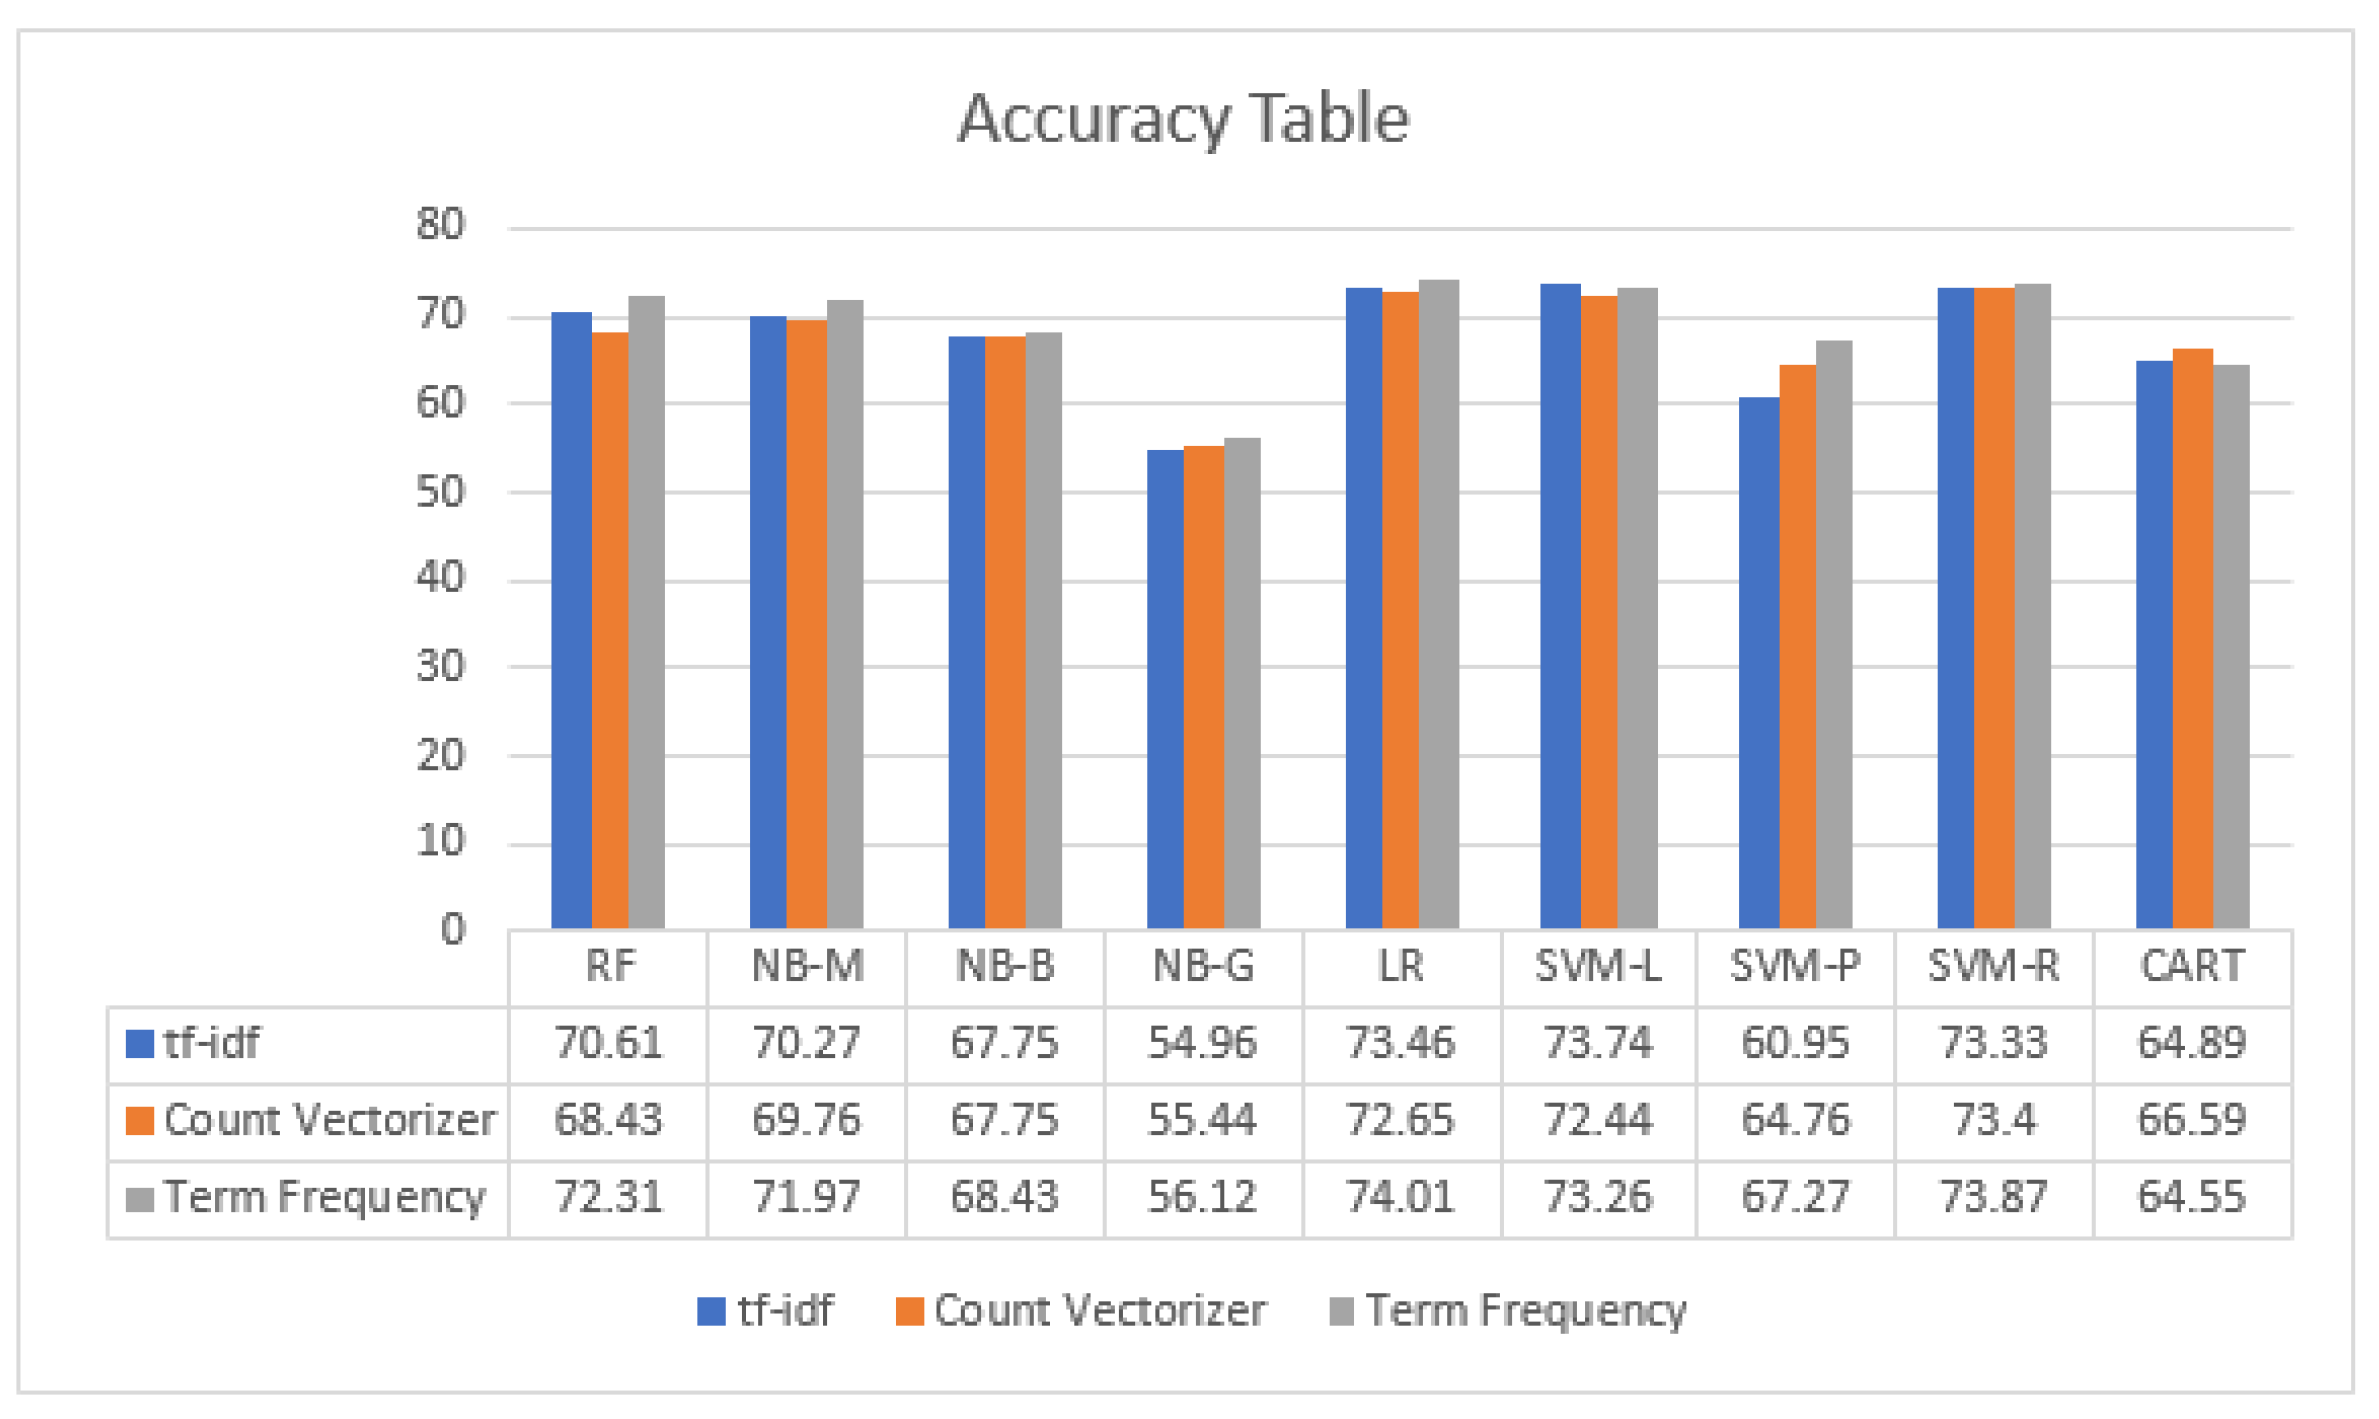
| Vectorizer | Algorithm | Accuracy | F1-Score | Recall | Precision | MCC |
|---|---|---|---|---|---|---|
| RF | 70.61 | 70.61 | 70.61 | 71.63 | 65.89 | |
| NB-M | 70.27 | 69.57 | 70.27 | 71.13 | 65.64 | |
| NB-B | 67.75 | 66.22 | 67.75 | 66.50 | 62.63 | |
| NB-G | 54.96 | 52.83 | 54.69 | 52.10 | 47.27 | |
| Tf-IDf | LR | 73.46 | 73.73 | 73.46 | 74.54 | 69.15 |
| SVM-L | 73.74 | 73.94 | 73.67 | 75.15 | 69.48 | |
| SVM-P | 60.95 | 62.84 | 60.95 | 72.33 | 56.69 | |
| SVM-R | 73.33 | 73.42 | 73.33 | 74.03 | 68.98 | |
| CART | 64.89 | 64.88 | 64.89 | 65.28 | 59.12 | |
| RF | 68.43 | 69.21 | 69.52 | 70.24 | 64.64 | |
| NB-M | 69.76 | 69.02 | 69.79 | 69.30 | 64.90 | |
| NB-B | 67.75 | 66.22 | 67.75 | 66.50 | 62.63 | |
| NB-G | 55.44 | 53.47 | 55.44 | 53.50 | 48.38 | |
| Count vectorizer | LR | 72.65 | 72.77 | 72.65 | 73.26 | 68.15 |
| SVM-L | 72.44 | 72.48 | 72.44 | 73.07 | 67.95 | |
| SVM-P | 64.76 | 64.52 | 64.76 | 68.64 | 59.69 | |
| SVM-R | 73.40 | 73.56 | 73.40 | 74.11 | 69.03 | |
| CART | 66.59 | 66.45 | 66.59 | 67.27 | 61.20 | |
| RF | 72.31 | 72.41 | 72.31 | 72.88 | 67.75 | |
| NB-M | 71.97 | 71.62 | 71.97 | 71.97 | 67.40 | |
| NB-B | 68.43 | 67.07 | 68.43 | 67.36 | 63.40 | |
| NB-G | 56.12 | 54.16 | 56.12 | 53.91 | 49.03 | |
| Term frequency vectorizer | LR | 74.01 | 74.04 | 74.01 | 74.70 | 69.79 |
| SVM-L | 73.26 | 73.47 | 73.26 | 74.57 | 68.98 | |
| SVM-P | 67.27 | 68.89 | 67.27 | 74.55 | 63.03 | |
| SVM-R | 73.87 | 73.95 | 73.87 | 74.44 | 69.59 | |
| CART | 64.55 | 64.94 | 64.55 | 65.80 | 58.74 |
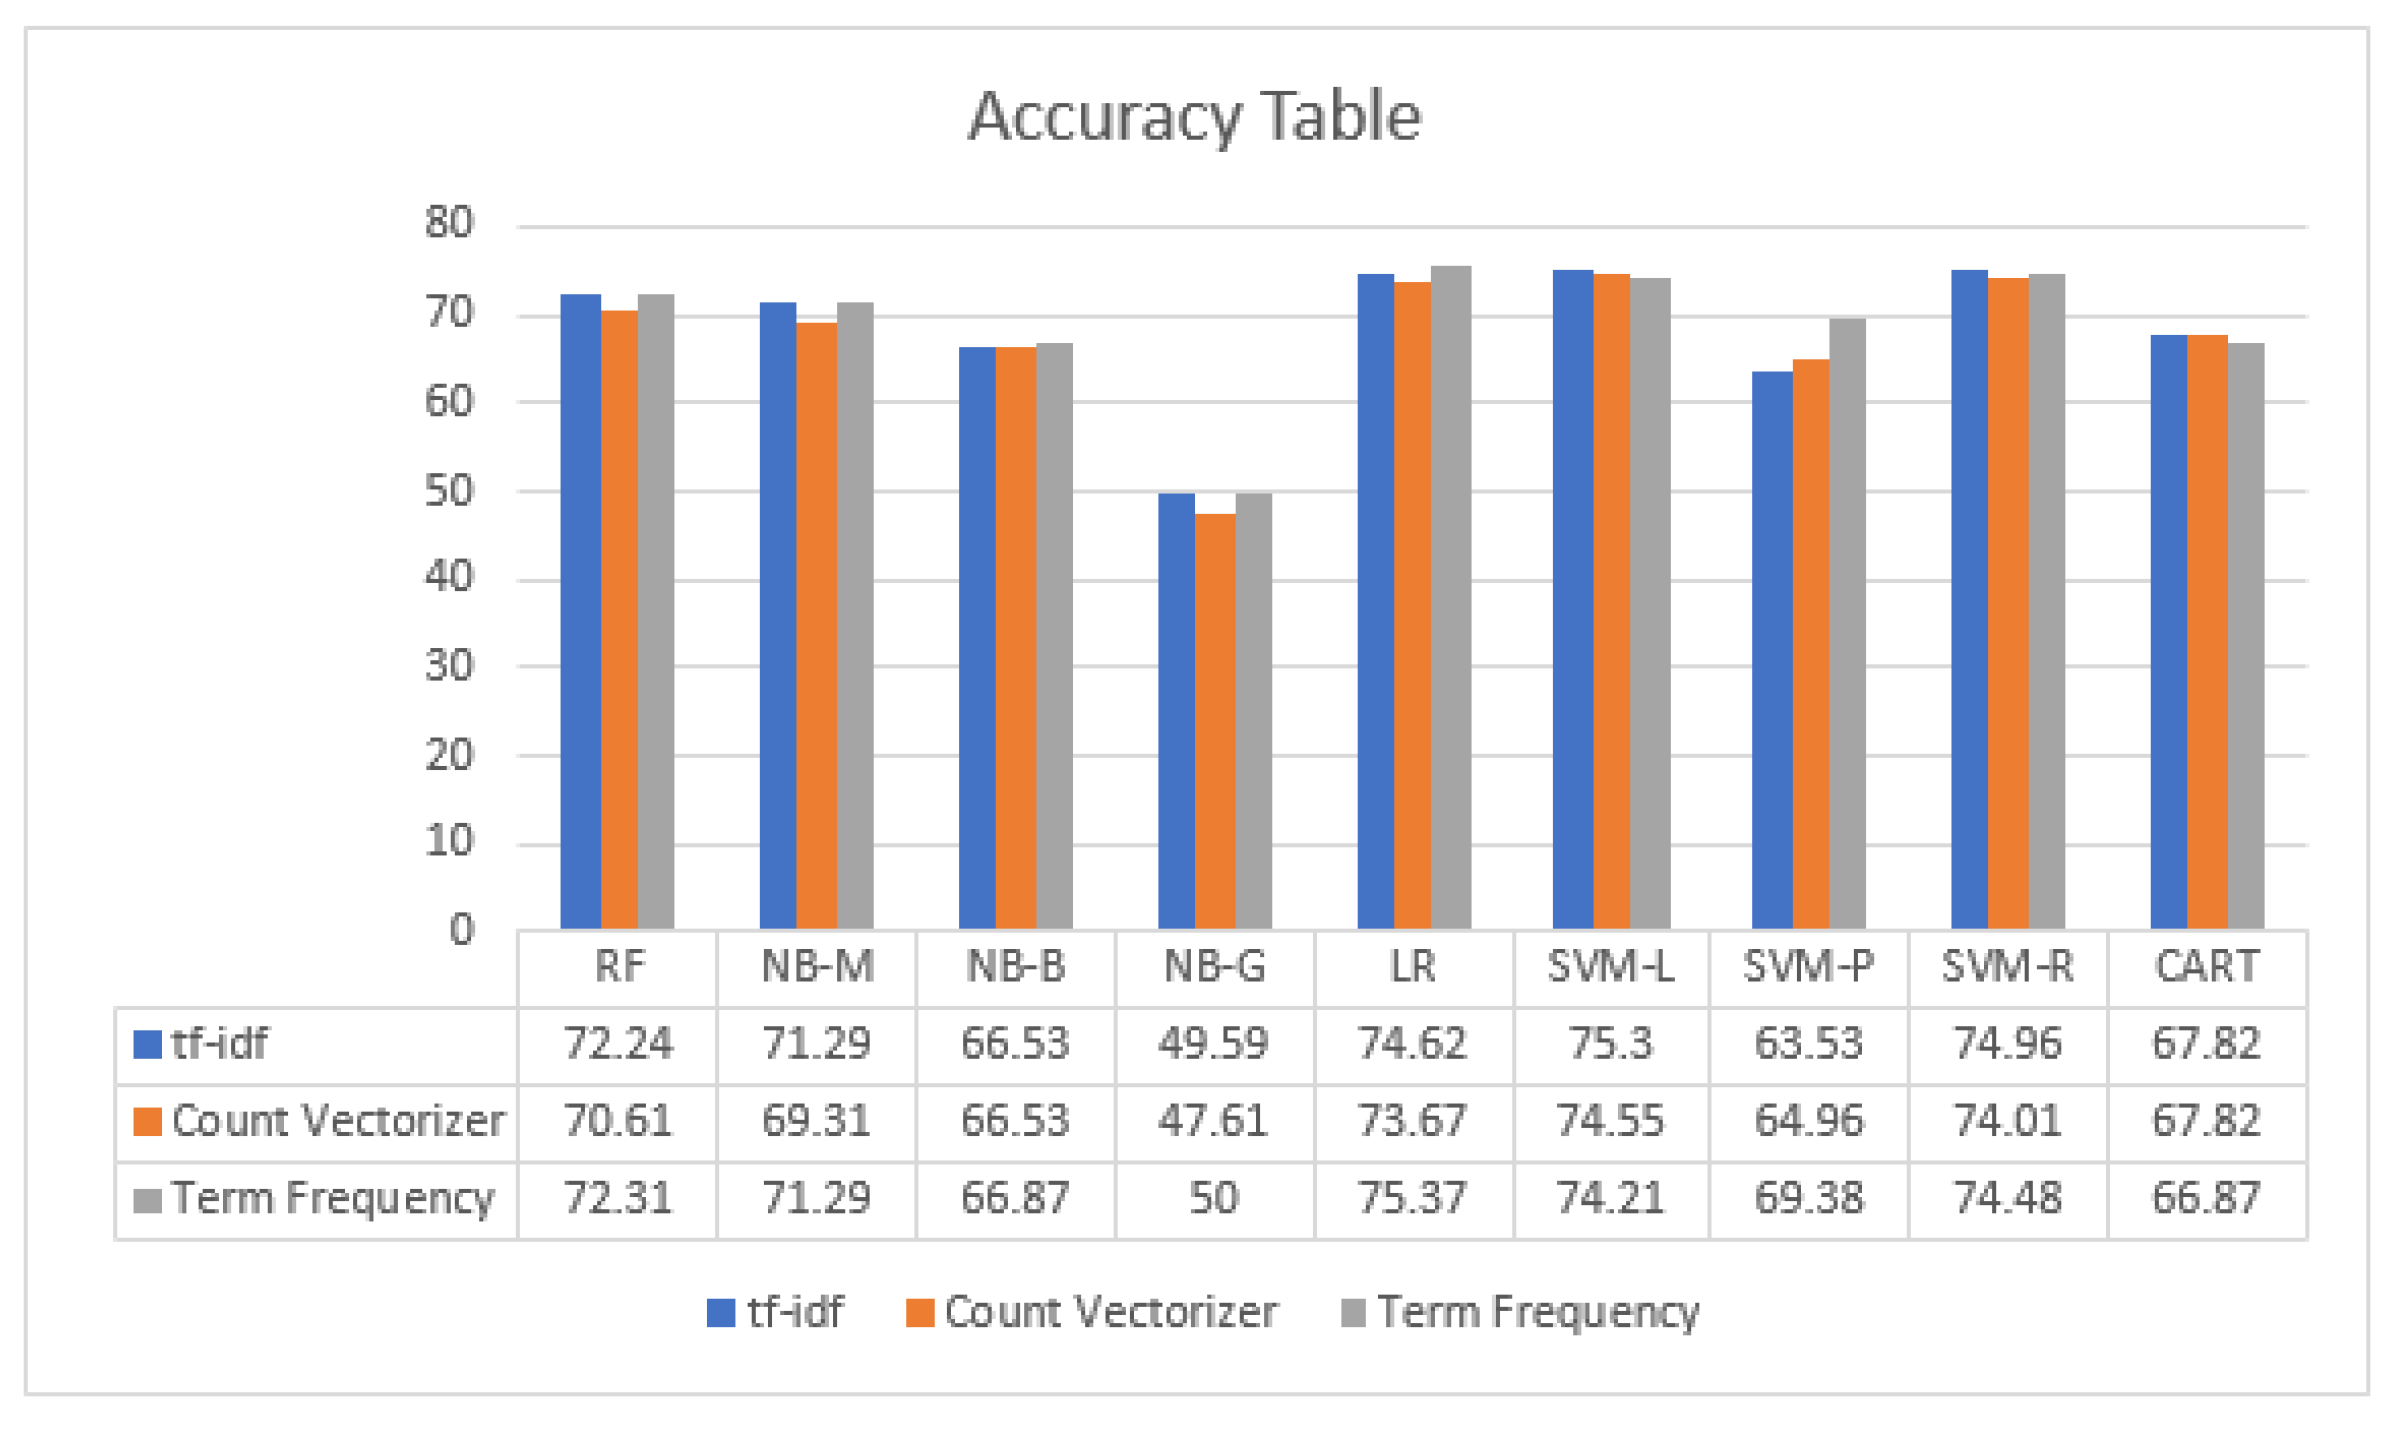
| Vectorizer | Algorithm | Accuracy | F1-Score | Recall | Precision | MCC |
|---|---|---|---|---|---|---|
| RF | 72.24 | 72.56 | 72.24 | 74.51 | 67.96 | |
| NB-M | 71.29 | 70.72 | 71.29 | 72.10 | 66.76 | |
| NB-B | 66.53 | 65.28 | 66.53 | 66.46 | 61.35 | |
| NB-G | 49.59 | 48.32 | 49.59 | 49.41 | 41.57 | |
| Tf-IDf | LR | 74.62 | 74.74 | 74.62 | 75.63 | 70.53 |
| SVM-L | 75.30 | 75.41 | 75.30 | 76.56 | 71.38 | |
| SVM-P | 63.53 | 65.48 | 63.53 | 73.38 | 59.35 | |
| SVM-R | 74.96 | 75.03 | 74.96 | 75.77 | 70.91 | |
| CART | 67.82 | 67.84 | 67.82 | 68.85 | 62.62 | |
| RF | 70.61 | 70.08 | 70.61 | 73.32 | 62.62 | |
| NB-M | 69.31 | 68.67 | 69.31 | 68.98 | 64.32 | |
| NB-B | 66.53 | 65.28 | 66.53 | 66.46 | 61.35 | |
| NB-G | 47.61 | 46.47 | 47.61 | 48.84 | 39.34 | |
| Count vectorizer | LR | 73.67 | 73.71 | 73.67 | 74.45 | 69.39 |
| SVM-L | 74.55 | 74.63 | 74.55 | 75.95 | 70.51 | |
| SVM-P | 64.96 | 64.25 | 64.96 | 70.91 | 60.33 | |
| SVM-R | 74.01 | 74.03 | 74.01 | 75.15 | 69.85 | |
| CART | 67.82 | 67.74 | 67.82 | 69.48 | 63.74 | |
| RF | 72.31 | 72.61 | 72.31 | 73.94 | 67.90 | |
| NB-M | 71.29 | 70.90 | 71.29 | 71.16 | 66.58 | |
| NB-B | 66.87 | 65.64 | 66.87 | 66.70 | 61.71 | |
| NB-G | 50.00 | 48.87 | 50.00 | 50.32 | 42.05 | |
| Term frequency vectorizer | LR | 75.37 | 75.42 | 75.37 | 76.19 | 71.38 |
| SVM-L | 74.21 | 74.20 | 74.21 | 75.09 | 70.06 | |
| SVM-P | 69.38 | 70.53 | 69.38 | 75.12 | 65.29 | |
| SVM-R | 74.48 | 74.64 | 74.48 | 75.88 | 70.43 | |
| CART | 66.87 | 66.98 | 66.87 | 67.58 | 61.41 |
© 2019 by the authors. Licensee MDPI, Basel, Switzerland. This article is an open access article distributed under the terms and conditions of the Creative Commons Attribution (CC BY) license (http://creativecommons.org/licenses/by/4.0/).
Share and Cite
Kaur, G.; Kaushik, A.; Sharma, S. Cooking Is Creating Emotion: A Study on Hinglish Sentiments of Youtube Cookery Channels Using Semi-Supervised Approach. Big Data Cogn. Comput. 2019, 3, 37. https://doi.org/10.3390/bdcc3030037
Kaur G, Kaushik A, Sharma S. Cooking Is Creating Emotion: A Study on Hinglish Sentiments of Youtube Cookery Channels Using Semi-Supervised Approach. Big Data and Cognitive Computing. 2019; 3(3):37. https://doi.org/10.3390/bdcc3030037
Chicago/Turabian StyleKaur, Gagandeep, Abhishek Kaushik, and Shubham Sharma. 2019. "Cooking Is Creating Emotion: A Study on Hinglish Sentiments of Youtube Cookery Channels Using Semi-Supervised Approach" Big Data and Cognitive Computing 3, no. 3: 37. https://doi.org/10.3390/bdcc3030037
APA StyleKaur, G., Kaushik, A., & Sharma, S. (2019). Cooking Is Creating Emotion: A Study on Hinglish Sentiments of Youtube Cookery Channels Using Semi-Supervised Approach. Big Data and Cognitive Computing, 3(3), 37. https://doi.org/10.3390/bdcc3030037