1. Big Data, Knowledge, and Value
The global amount of data is exploding. For 2020, according to Hilbert & López [
1], the global information capacity can be estimated as four zettabytes (four billion terabytes), with this number doubling every 3 years. Data are everywhere; it is omnipresent and overflowing. In the words of Anderson [
2],
more is different—what applies for water is analogically the case for data. With this new dimension in quantity, data get a new quality. For this trend, this global phenomenon and its exploitation, the term big data has spread. It has been said that big data is the metaphorical oil of the 21
st century because the ability to refine and use big data will be a key success factor for businesses as well as economies. The Beckman Report on Database Research [
3] calls big data “a defining challenge of our time.” Despite all the hype, the term big data is not necessarily optimistically connoted—think of similar terms such as big money, big oil, big pharma, or big government. Whereas many practitioners and researchers focus on the opportunities of big data, Clarke [
4] suggests considering the risks because automated and purely data-based decisions raise ethical questions about the limits of predictive control. More and more machine data mean proportionally less and less human knowledge in society. The attention span and memory of humans are limited; thus, the ratio between what we do know in relation to what is stored and processed in computer systems (i.e., knowledge versus data) is exponentially decreasing. Without saturation in data growth, the percentage of data that humans understand and control will become infinitesimally small and practically equal to zero.
Creating value from big data relies on supporting decisions with new knowledge generated from data analysis [
5]; yet, analyzing data is only possible given a set of data science skills. Knowledge, which Wheeler [
6] understands as “an answered question, a problem resolved” and “a means of control, not a state of mind” is the key to creating value from data. Still, most approaches to big data research aim primarily at data storage, computation, and analytics instead of knowledge and value that could and should be the result of big data processing. Accordingly, This study proposes a knowledge-based and value-oriented approach to big data management: focusing on knowledge processes and value chains when designing technical information systems for coping with big data. The question that drives the presented research is how big data management can be designed to help knowledge emerge and, consequently, create value. The proposed reference model for big data management creates a link between information technology and business value and aims at closing a research gap for the subject of big data management in the border area between the fields of computing and management sciences. The intention of this study is to provide a frame of reference for the technical sciences to orient the engineering of information systems for big data processing toward the generation of knowledge and value. Building on a previous version of the proposed model [
7,
8], this article contributes an in-depth literature survey on value creation from big data, an epistemological conceptualization of big data management as a cognitive system, and three use cases of big data management in practice that empirically validate the truth correspondence of the proposed reference model.
This article is structured as follows: After this introduction, the second section describes the big data challenge in general and technologies to address it. The third section discusses approaches for managing data aligned with value creation. The fourth section provides an epistemological theory of emergent knowledge and cognitive systems that can be applied for knowledge-based big data management. In the fifth section, this theory is instantiated in the field of business intelligence, thus interpreting big data management as a cognitive system whose success depends on effectuation and intelligence. In the sixth section, three cases of big data management in industrial settings are described and mapped to the proposed reference model.
Section 7 presents conclusions and points for further research.
2. The Big Data Paradigm
In the sense of “more is different,” big data is a class of data whose quantity brings forth new qualities. Based on a report of the META Group [
9], Gartner coined the most common definition of the term big data that addresses volume (vast amounts of data), velocity (fast data streams), and variety (heterogeneous content), the three Vs that specify the big data challenge. Based on that, Schroeck et al. [
10] defined big data with the qualities of high velocity, large volume, wide variety, and uncertain veracity, and have thus added a fourth V, concerned with uncertainties in data, to the definition. Demchenko et al. [
11] identified a fifth V, that of value, concretized as “the added-value that the collected data can bring to the intended process, activity or predictive analysis/hypothesis.” This 5V model of big data, in contrast to the other two mentioned definitions, poses a value question for big data theory. In 2015, the definition of big data was standardized by the NIST Big Data Public Working Group: “Big Data consists of extensive datasets primarily in the characteristics of
volume,
variety,
velocity, and/or
variability that require a
scalable architecture for efficient storage, manipulation, and analysis” [
12]. Although this context-free V-model of big data has been set as the standardized definition, NIST (2015a, pp. 10–11) acknowledges that there are many other definitions and interpretations of the term big data in contexts other than volume, such as less sampling, new data types, analytics, data science, value, and cultural change. This must be considered when talking about big data with practitioners. Daniel Gillick, senior research scientist at Google, characterized big data as “a cultural shift in which more and more decisions are made by algorithms” and that “big” is not about volume, but about “the pervasive nature of this change.” [
13] In the past, data have been in short supply. Value creation from data relied on carefully selecting samples from the population to draw reliable conclusions. It is only now, with the ubiquity of information systems, that data are generated abundantly. The enormous number of observations makes conclusions from data astonishingly reliable, even though epistemologically, there are many open questions about the validity of data-driven propositions [
6].
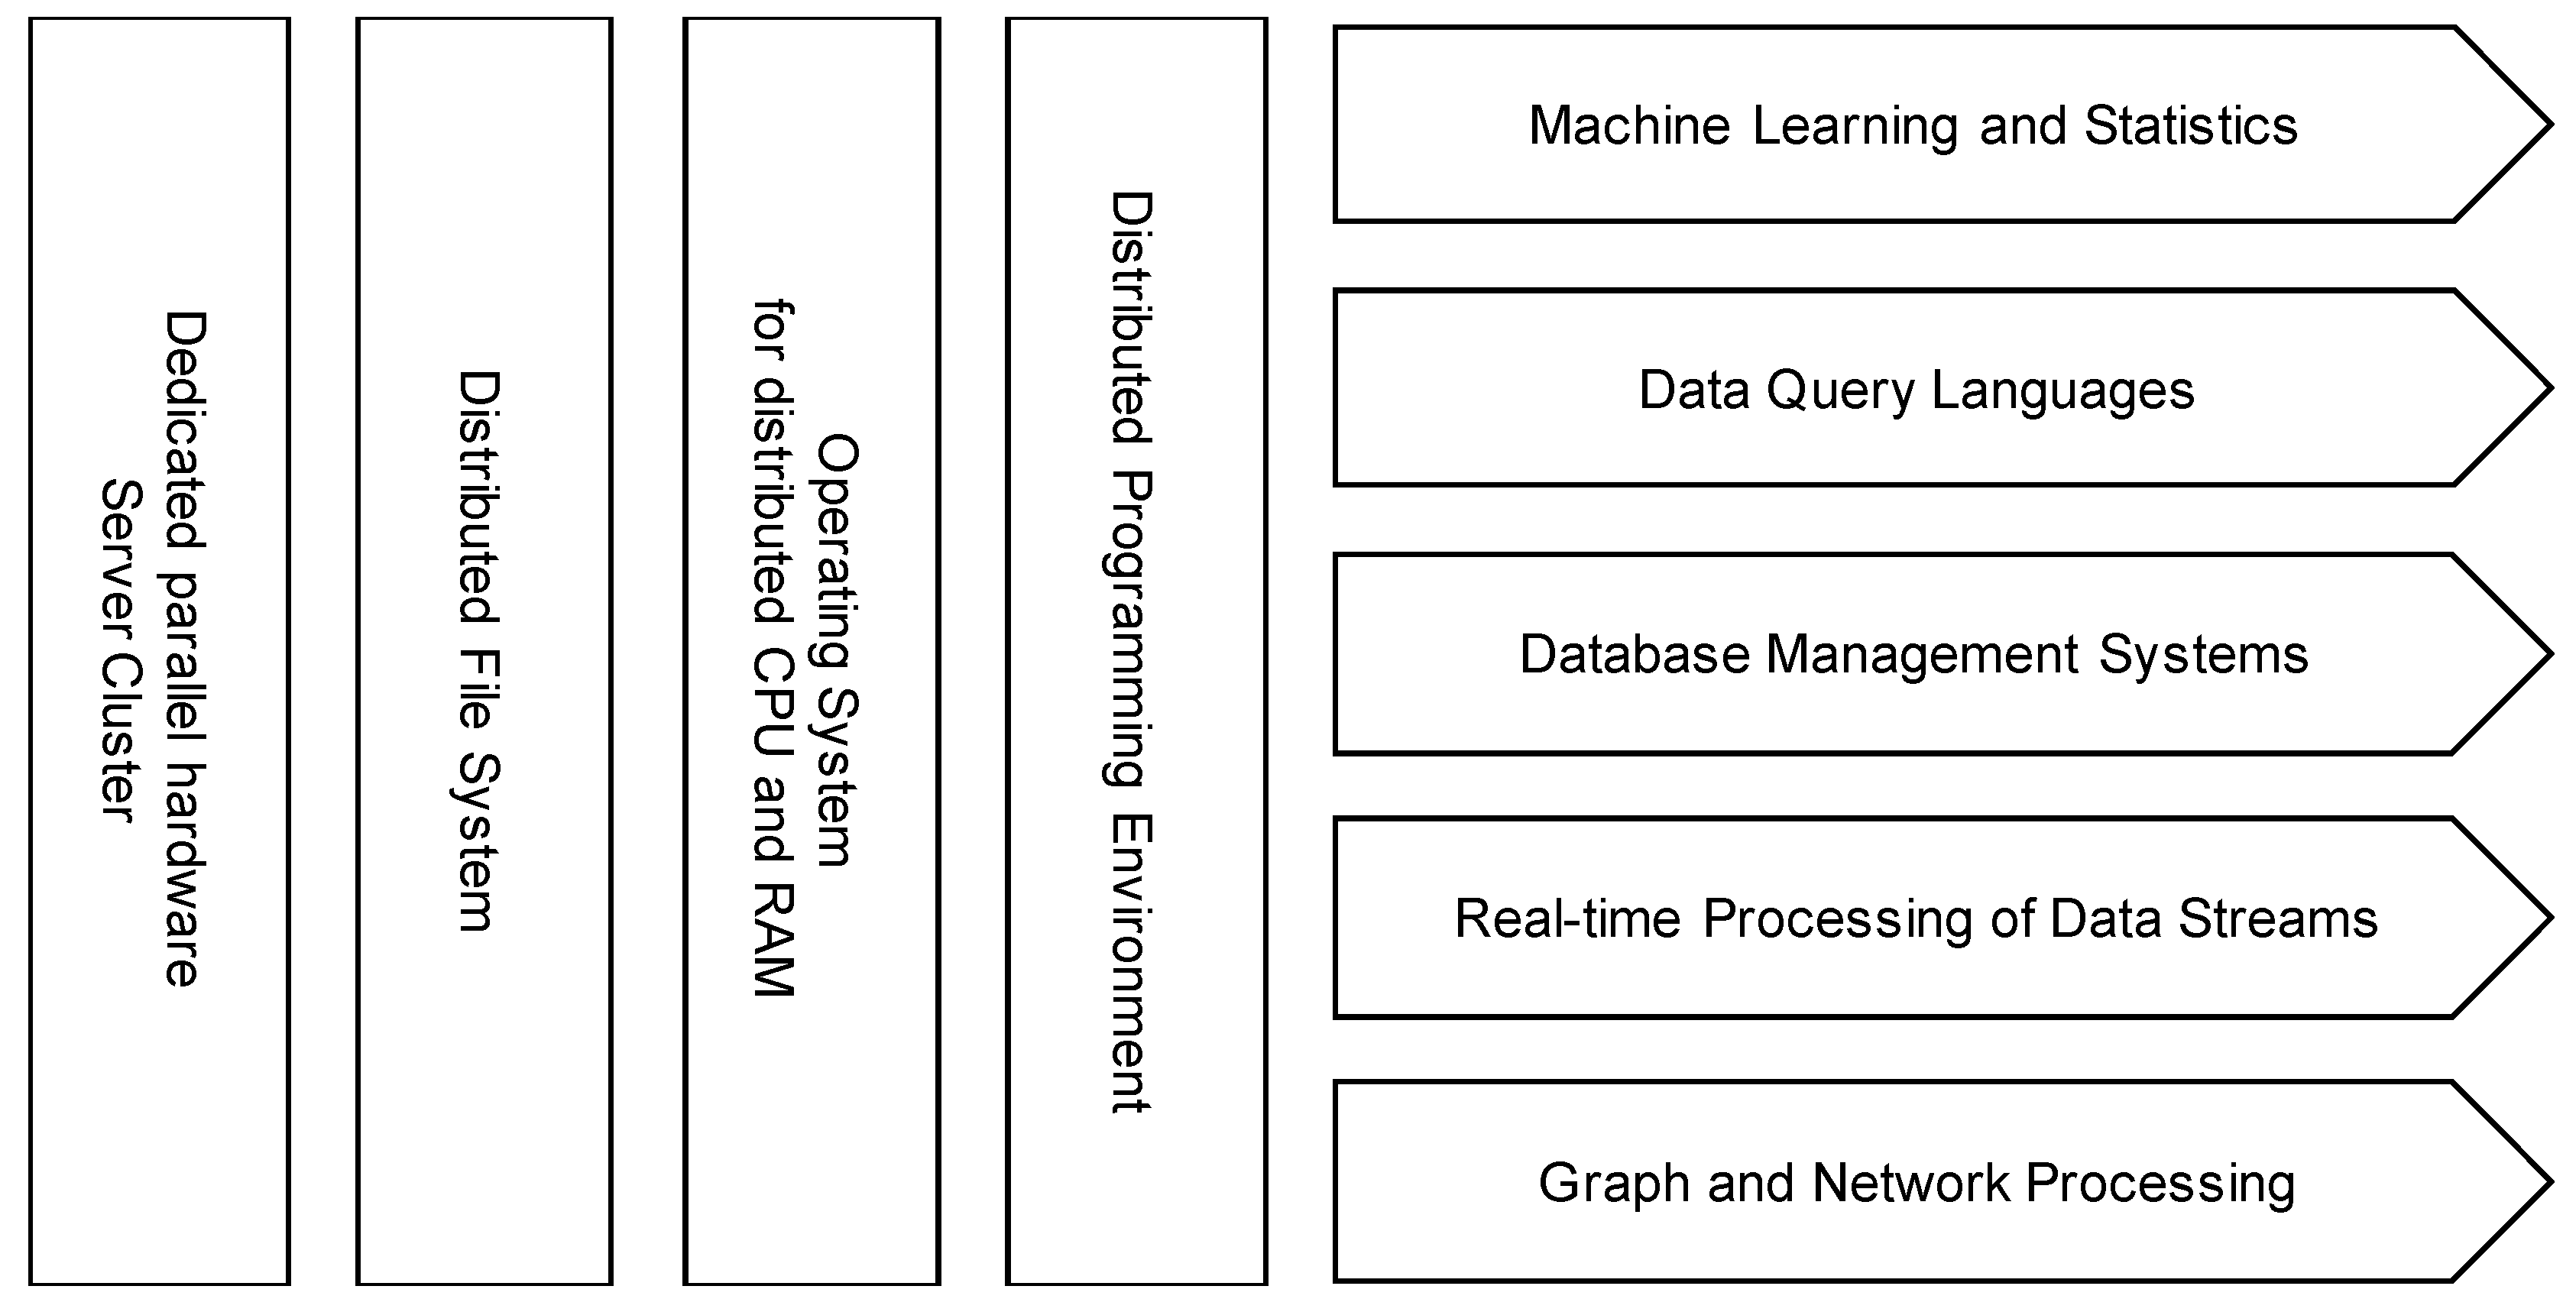
Technologically, the NIST standard defines the
big data paradigm as “the distribution of data systems across horizontally coupled, independent resources to achieve the scalability needed for the efficient processing of extensive datasets.” However, this paradigm of parallel processing is also important for the processing of real time data streams. For storage, processing, and analysis of big data, this kind of distributed storage and processing environment (DSP) architecture has been commonly adopted. The
Hadoop ecosystem of software tools, as described by Landset et al. [
14], is a well-known systems architecture for big data processing. Singh & Reddy [
15] describe two reference architectures for big data analytics: the
Hadoop Stack and the
Berkeley Data Analysis Stack. Both are based on parallel computing using clusters of commodity hardware. For parallel programming, the former is based on Hadoop MapReduce, whereas the latter is based on Apache Spark, which can compute faster because of in-memory processing [
16]. Yet, both stacks show similar components that are generalized and summarized in
Figure 1. The computing power to tackle large datasets is based on parallelization with dedicated parallel hardware clusters. Using distributed file systems and cluster operating systems, cluster resources such as storage, memory, and processors can be managed centrally. To distribute processing on different machines, both stacks use distributed programming mechanisms. With these components, applications such as machine learning and statistics, data querying, database systems, data stream processing, and graph analysis can be performed even on very large datasets and on massive streams of real time data.
3. Data Management: Creating Value from Data
Contrary to the technological perspective, the management perspective of big data focuses on value-related questions. Sheng et al. [
17] analyzed the concept of big data in the management domain and observed methods of value creation from data in many contexts such as organization, operations, and marketing information management. However, they only described the domains of application but not the generic process of data management to turn data into application. To this end, the NIST Big Data Public Working Group has defined a
data life cycle model. This process model consists of four stages: collection, preparation, analysis, and
action. The last stage “involves processes that use the synthesized knowledge to generate value” [
12]. This value creation is concretized in the NIST big data reference architecture [
18] in the form of data consumers, for which
access to analytics and
visualization of analytics results have the highest value in the information value chain as well as in the IT value chain.
The OECD has published a similar model that is termed
data value cycle [
5]. This model consists of a cycle of five connected steps, each taking as input the output of the previous step iteratively: datafication, big data, data analytics, knowledge base, and decision-making, which again can be input to step one, and so on. Additionally, the model describes value added for growth and well-being as a result of enhanced decision-making supported by the knowledge base that stems from the analysis of big data. This model explains value creation from big data in terms of decision support.
However, there are three drawbacks to the NIST and OECD models. First, decision support is not the only way to create value from data. For example, data-driven innovation and data-based products that create value directly from selling access to data. There, the knowledge base itself is of value for a business, not the decisions that it supports. Therefore, one extension of the theory is possible in generalizing from decision support to a more generalized concept that includes other ways to effectuate the results from data analytics. This layer could be called data effectuation. Second, the knowledge base is not only a result of data analytics, and knowledge does not only influence decision-making. Many forms of learning and codification contribute to practically all the steps in the data value cycle. For example, education of data scientists is crucial for data analytics. As another example, data analytics is an iterative process where generated knowledge feeds back into new versions of analytic processes. Therefore, the model could be extended to use knowledge-related processes as a cross-section function in big data management. This layer could be called data intelligence. Third, it remains unclear how exactly the knowledge base leads to better decisions. This layer of action in the NIST data life cycle model, specifically the visualization and access that are central in the NIST reference architecture, is missing in the OECD model. This layer could be called data interaction.
On the issue of concretization of the idea of value creation from data, Davenport [
19] adds interesting thoughts to the literature with a concept termed
Analytics 3.0. In the words of Davenport, “Data analysis used to add the most value by enabling managers to make better internal decisions. The new strategic focus on delivering value to customers has profound implications for where analytics functions sit in organizations and what they must do to succeed.” According to Davenport, decision support is just one part of the data-driven value creation process. A more recent approach is to feedforward analytics results to products and services of a company directly to create value for customers. With this customer-centric approach, value creation from data is extended from decision support within the organization to supporting operations of an organization on the market. In the words of Davenport & Dyché [
20], “The primary value from big data comes not from the data in its raw form, but from the processing and analysis of it and the insights, products, and services that emerge from analysis.” Therefore, data effectuation should be oriented toward a market and business perspective.
More recently, Lim et al. [
21] proposed a framework for value creation from data that is based on nine factors: data source, data collection, data, data analysis, information on the data source, information delivery, information user, value in information use, and network of the service provider. This framework is based on the idea that value is created by utilizing the information generated by data analysis. Although this framework focuses on interatction, it does not answer the questions about effectuation and intelligence, or how exactly this information is applied and how the knowledge in this context is managed.
Based on this literature survey, this study proposes a reference model for big data management that closes the above-mentioned gaps. It incorporates the big data definition of the 5V model; the value-oriented approach of the OECD model; and the focus on action, visualization, and access of the NIST model, and it adds the market focus of Davenport. Hence, the issues of data interaction and data effectuation and especially the focus on knowledge management in the big data life cycle (data intelligence) provides an extension to these existing approaches.
4. A Theory of Cognitive Systems and Emergent Knowledge
The creation of value from data is closely linked to the knowledge that data analytics generates. This knowledge has an important distinctive feature: It is neither explicit nor tacit, in the classical sense of Polany [
22], but
emergent according to the definition of Patel and Ghoneim [
23]. In fact, data analysis is a form of knowledge-intensive work that can be characterized as an emergent knowledge process corresponding to the definition of Markus et al. [
24]. According to Kakihara & Sørensen [
25], knowledge is generally “a result of emergent processes of knowing through human subjective interpretations, or sense-making.” This especially applies to knowledge that is generated by data scientists working with big data. The knowledge that big data analytics generates emerges from the interaction of data scientists and end-users with existing datasets and analysis results.
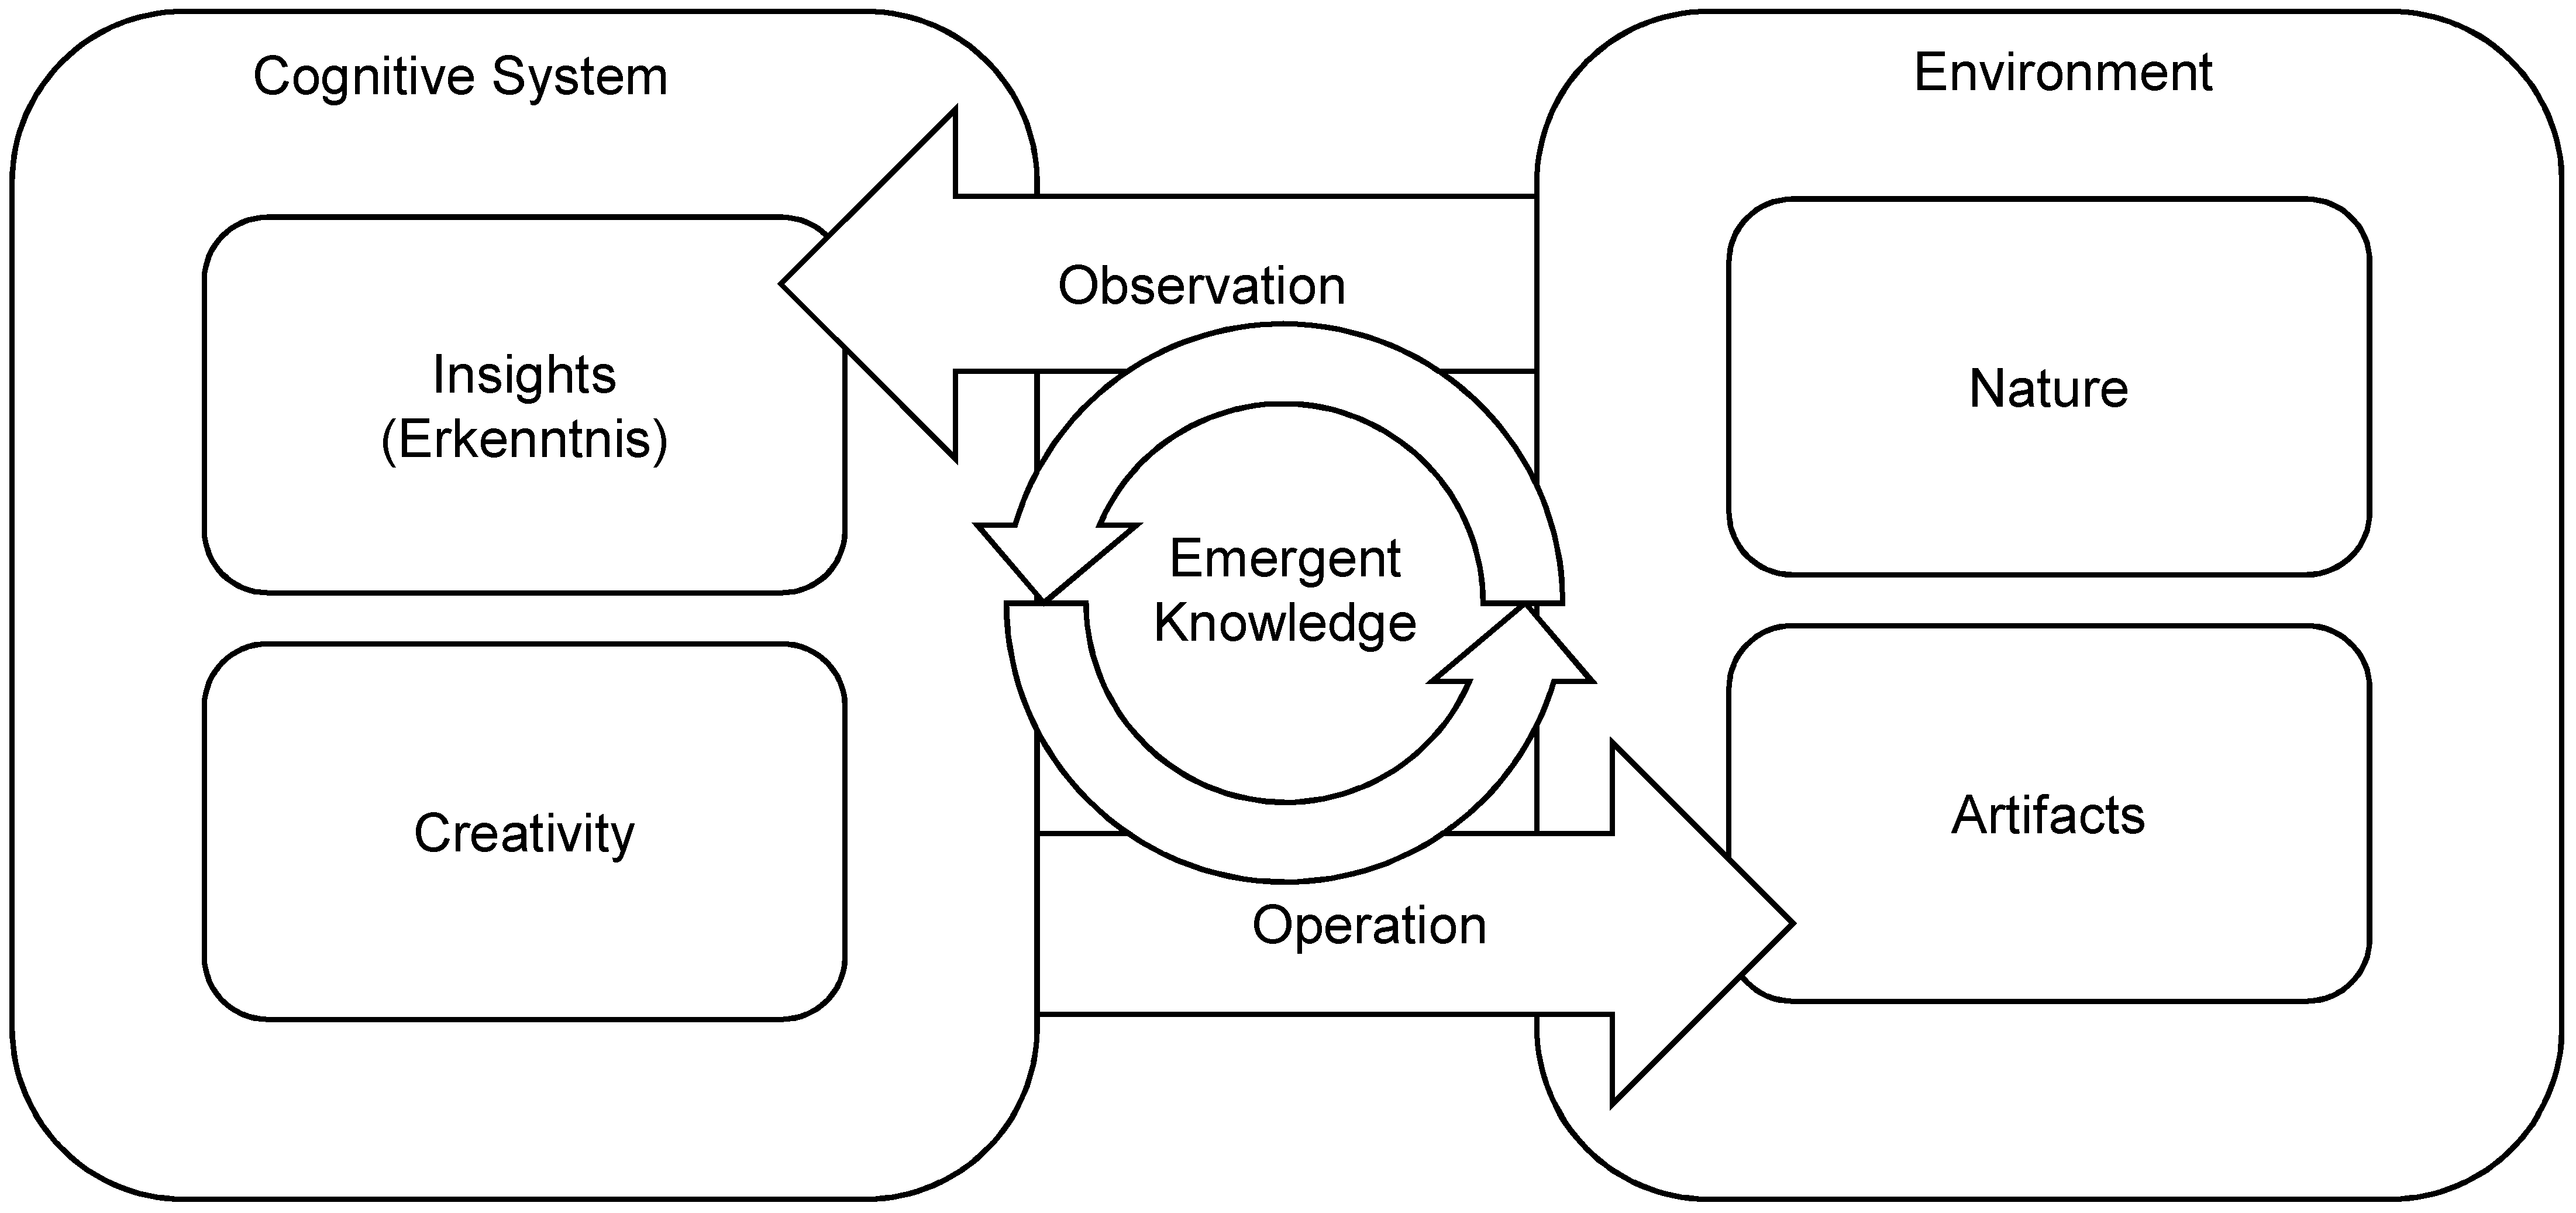
Knowledge emerges by closed loops of observation and operation. This concept can be summarized as
knowing through making [
26]. If we take this basic feedback loop into account, we can construct a theory of emergent knowledge as illustrated in
Figure 2. The proposed model will build upon and deepen the theory of Niklas Luhman [
27], who presented a radically constructivist epistemology: a priori,
all is one; only observation constructs distinctions. To begin with, observation creates a contrast between subject and object, between the observer and the
environment; Luhmann calls the observer “erkennendes System,” which is roughly translated into English as
cognitive system.
In addition to the basic distinction between subject and object, the proposed model introduces two further ontological distinctions. First, the epistemic source of a system’s observation, its environment, can be divided into nature, that which is independent from and untouched by the system, and artifacts, changes in the environment that are the product of the system’s operation. Second, the epistemic source of the system’s operation can be divided into two different aspects: By realizing distinguishable signals in the environment, the system constructs insights (called Erkenntnis in German idealistic epistemology). Yet for the creation of artifacts, cognitive systems draw upon an ingenious intuitive force that can be called creativity. Advanced cognitive systems bring forth new modes that cannot be observed directly in nature. In the artifacts, in the changes that the subject generates in the environment, the effect of creativity is observable, which closes the outer loop of emergent knowledge generation.
This proposed theory of emergent knowledge states that knowledge emerges by the interaction of a cognitive system with its environment, by creating artifacts using its creativity, and by observing the effects of its own operation to gain insights. The proposed model theorizes that knowledge emerges not by passive observation, but by iterative closed loops of purposefully creating and observing changes in the environment. In contrast to the classic observational theory of empirical knowledge, this model presents an operational theory of emergent knowledge. In the next section, we will apply this model to big data management.
5. Big Data Management as a Cognitive System
The Oxford Dictionary defines the term
management as “the process of dealing with or controlling things or people.” Based on this definition, in combination with the 5V model of big data proposed by Demchenko et al. [
11],
big data management (BDM) can be defined as a process of controlling flows of large-volume, high-velocity, heterogeneous and/or uncertain data to create value. Managing big data is not an end in itself: Successful BDM creates value in the real world. The aim of the proposed reference model is to provide a frame of reference for creating value from big data which is closely linked to knowledge emergence from data analysis, according to the theory of emergent knowledge developed in the previous section.
As a sociologist, Niklas Luhmann certainly had social systems in mind when he wrote about cognitive systems.
Business intelligence (BI), by articulation and data selection, serves as a catalyst of organizational knowing [
28]. In organizations that make use of big data, BI [
29] can be seen as a socio-technical cognitive system.
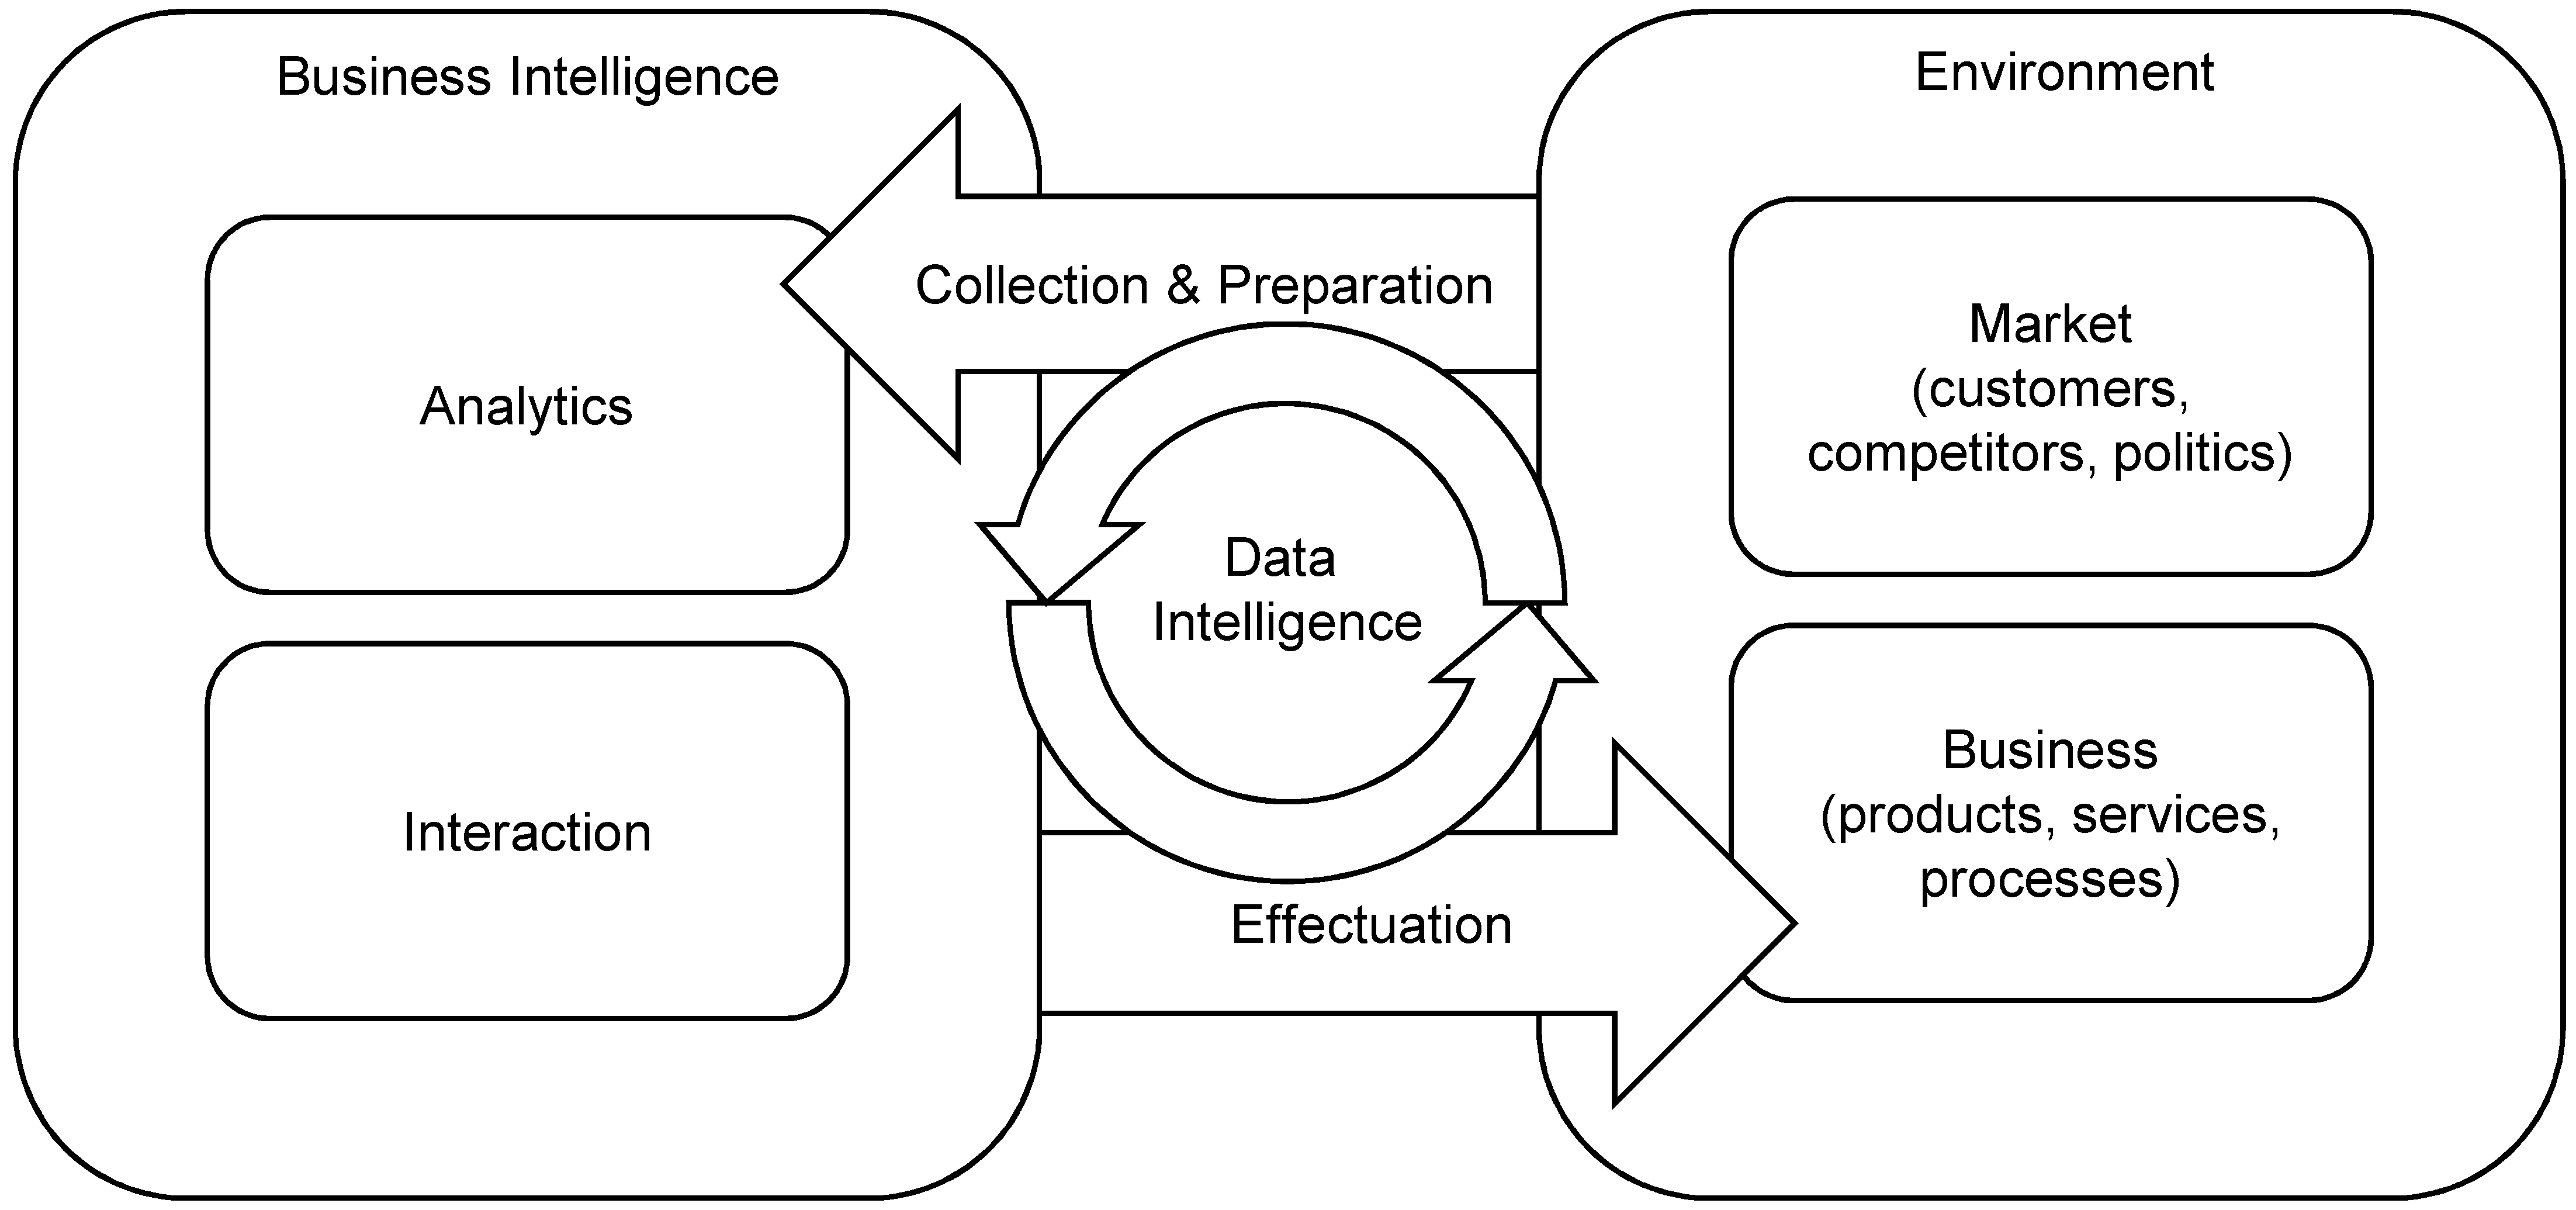
As seen in
Figure 3, for BI, the
environment consists of the
business and the
market it acts on. The market is independent of BI, and thus, its parameters such as customers, competitors, politics, and so on, represent natural, that is, a priori, aspects of the environment. However, BI can inform the business, and thus, optimized artifacts such as products, services, or processes, are the result of BI operations. As a cognitive system, BI observes its environment by
collection and preparation of (possibly big) data from various sources. Based on that, BI processes construct new insights from these observations by the application of
data analytics to the integrated database. The creative aspect of BI comes from the
interaction of human analysts and decision makers with the data analytics processes. This interaction can, for example, be performed by a data scientist who performs explorative, interactive analyses or, in another instance, by a manager who interacts with a forecasting dashboard. BI creates value for the business if the results of analytics and interactions have a direct positive
effect on the business, if it is effectuated by optimizing products, services, decisions, and processes. According to the theory of emergent knowledge presented in the last section, knowledge emerges if BI, as a cognitive system, interacts with and observes its environment iteratively. This is signified by the data intelligence loop in
Figure 3. As an example, closed-loop analytic customer relationship management (CRM) continuously optimizes analytic marketing campaigns based on CRM data in connection with outcomes from past campaigns in a closed epistemic loop. Thus, outcomes of past actions are integrated into future observations.
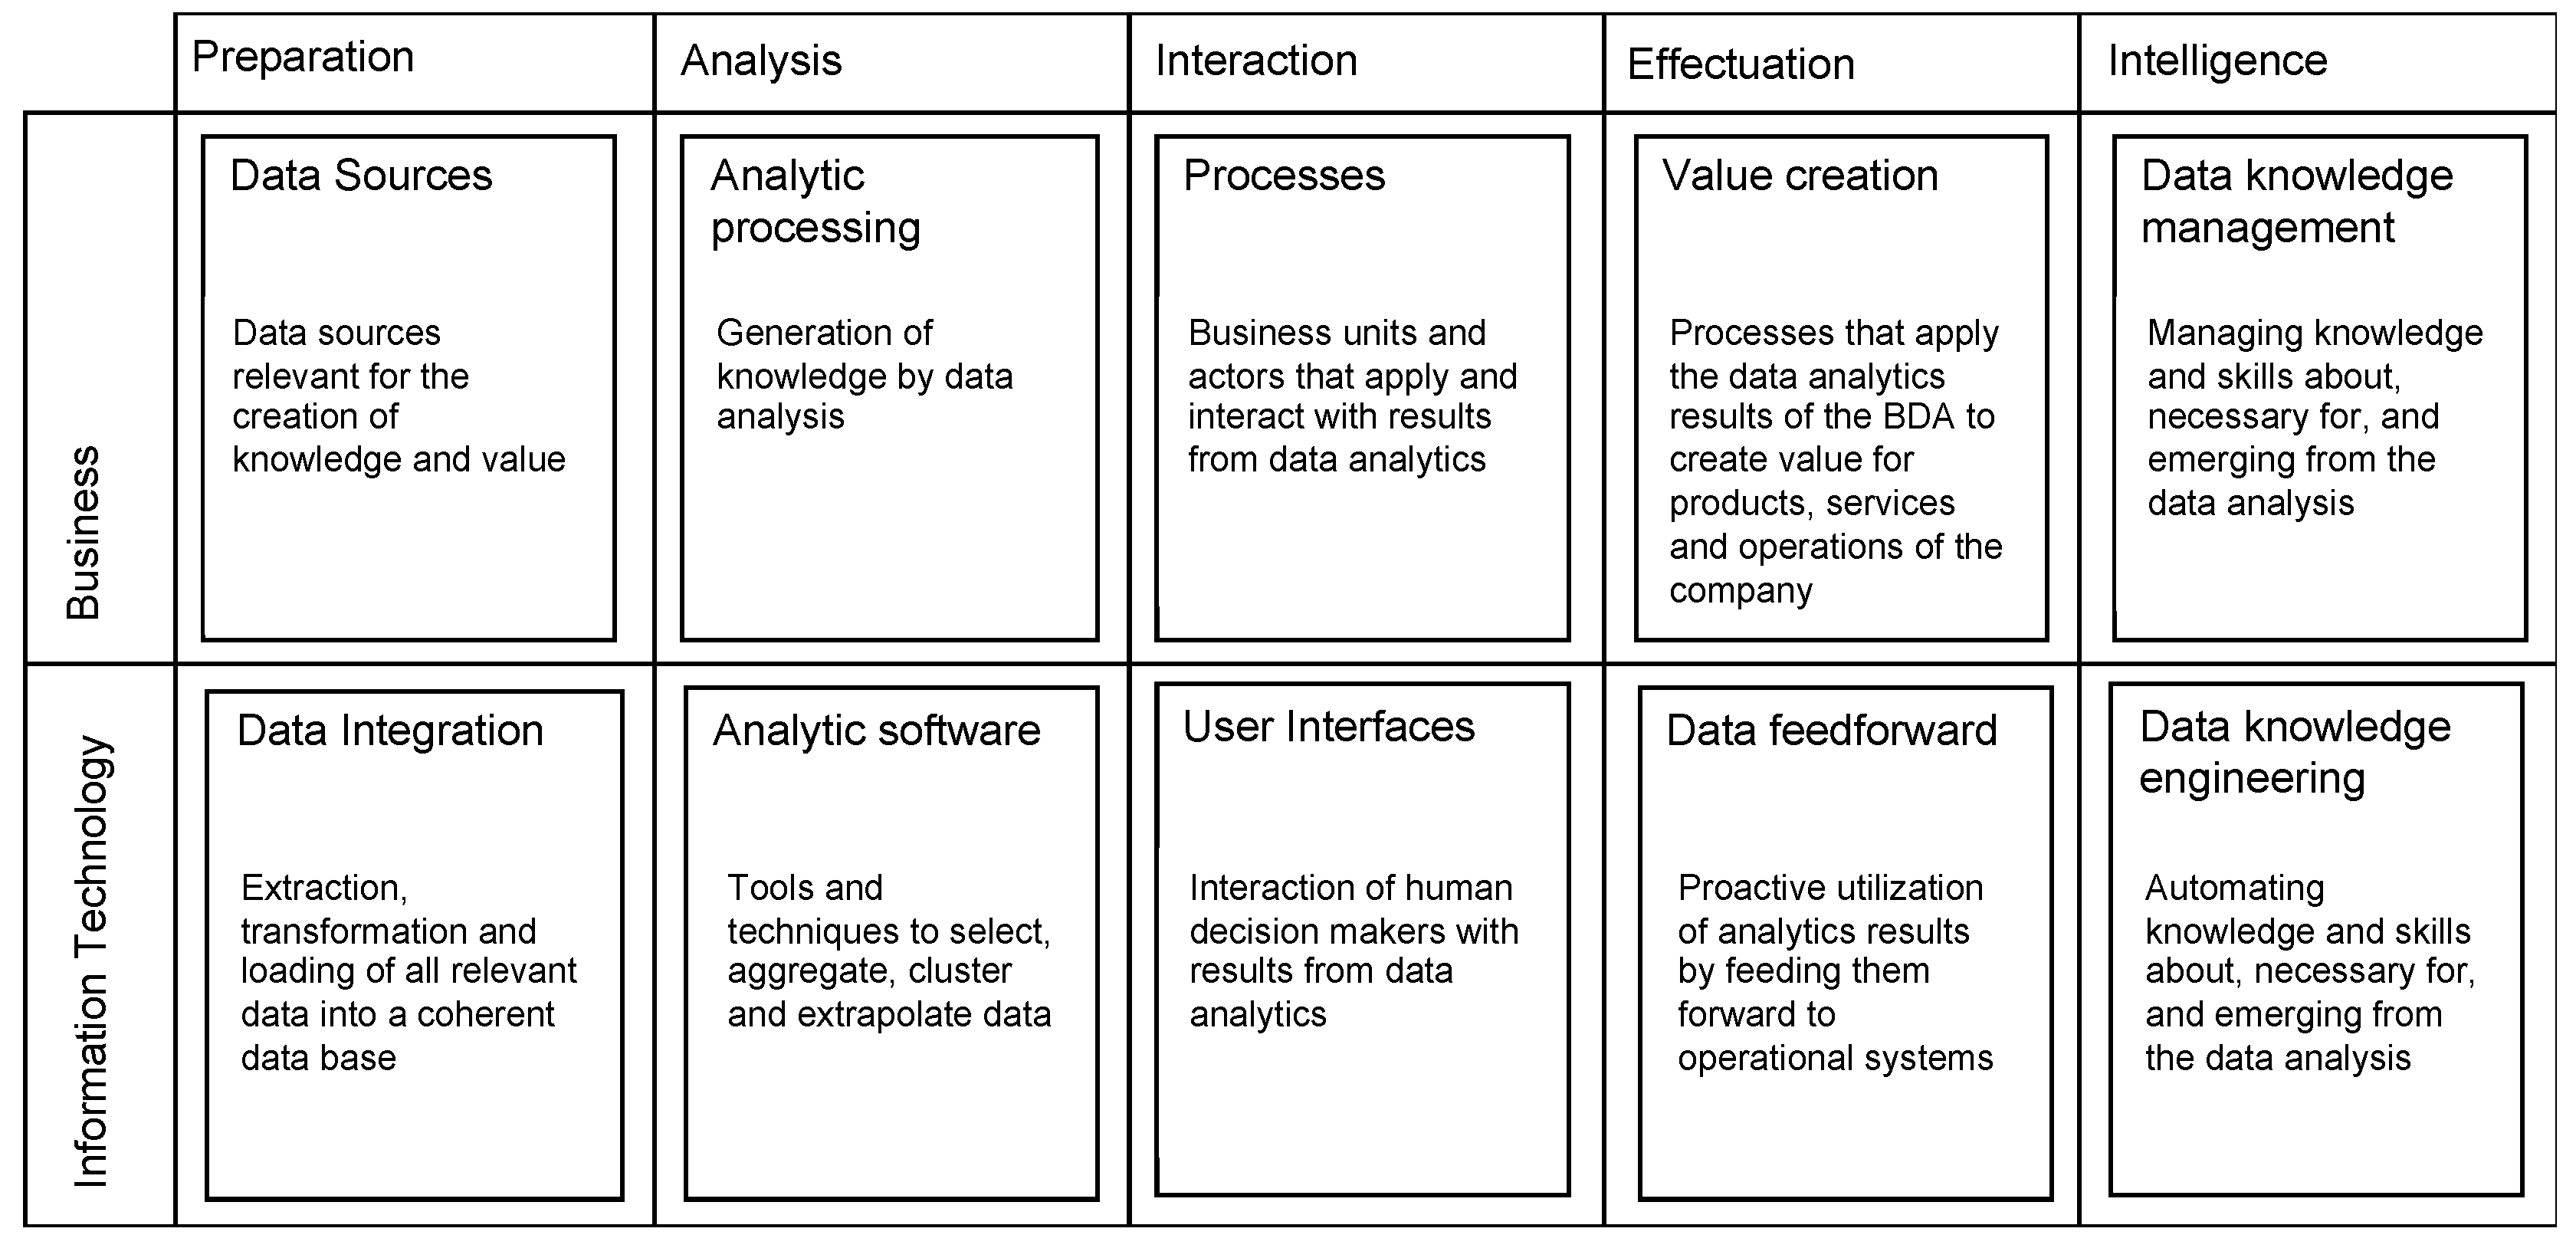
The management of big data consists of the optimization of the aspects of data preparation, data analytics, data interaction, and data effectuation as well as the successful management of the emergent knowledge in this process, which can be called data intelligence.
Data preparation can be defined as the combination of data from different sources into a single platform with consistent access for analytics. In the age of big data, existing data sources overflow with potentially usable data. However, these need to be prepared with a considerable effort so that the data become analyzable. This process involves database systems as well as interfaces to data sources. Here, special care must be taken for scalability with regard to the big data characteristics of volume, velocity, and variety of the data sources.
Data analytics is the transformation of raw data into usable information [
30] using analytic processes and tools. With respect to big data, analytic and machine learning platforms operate on a scalable, parallel computing architectures. In this step, data science methods are applied, which the NIST [
9] defined as “the extraction of actionable knowledge directly from data through a process of discovery, or hypothesis formulation and hypothesis testing” (p. 7).
Data interaction consists of mutual interferences of users and data analysis results that generate individual and organizational knowledge. It is important to note that data analysis results are in fact nothing but more data unless users interact with them. At this point, helpful user interfaces, user experience design, and data visualization can be designed to promote the interaction of data analytics and the organization.
Data effectuation means utilization of the data analysis results to create value in products, services, and operations of the organization. Effectuation logic focuses not on causalities but on the possibilities that can be achieved with given means and resources. In the sense of Drechsler & Hevner, [
31], viewing big data management from an effectuation point of view leverages the existing possibilities of designing new applications with given data resources.
Data intelligence refers to the ability of the organization to acquire and apply knowledge and skills [
32] in data management, and it can be understood as knowledge management and knowledge engineering applied for all steps of the data life cycle. This process involves three types of knowledge and skills. First, there is knowledge generated
from data, such as organizational communication of analytics results; second, knowledge
about data and data management, such as metadata management and data methodology; and third, knowledge and skills necessary
for data analytics and management, such as knowledge and education management for data scientists and data consumers. Data intelligence is a knowledge-driven cross-platform function that ensures that these knowledge assets are optimally deployed, distributed, and utilized over all layers of BDM.
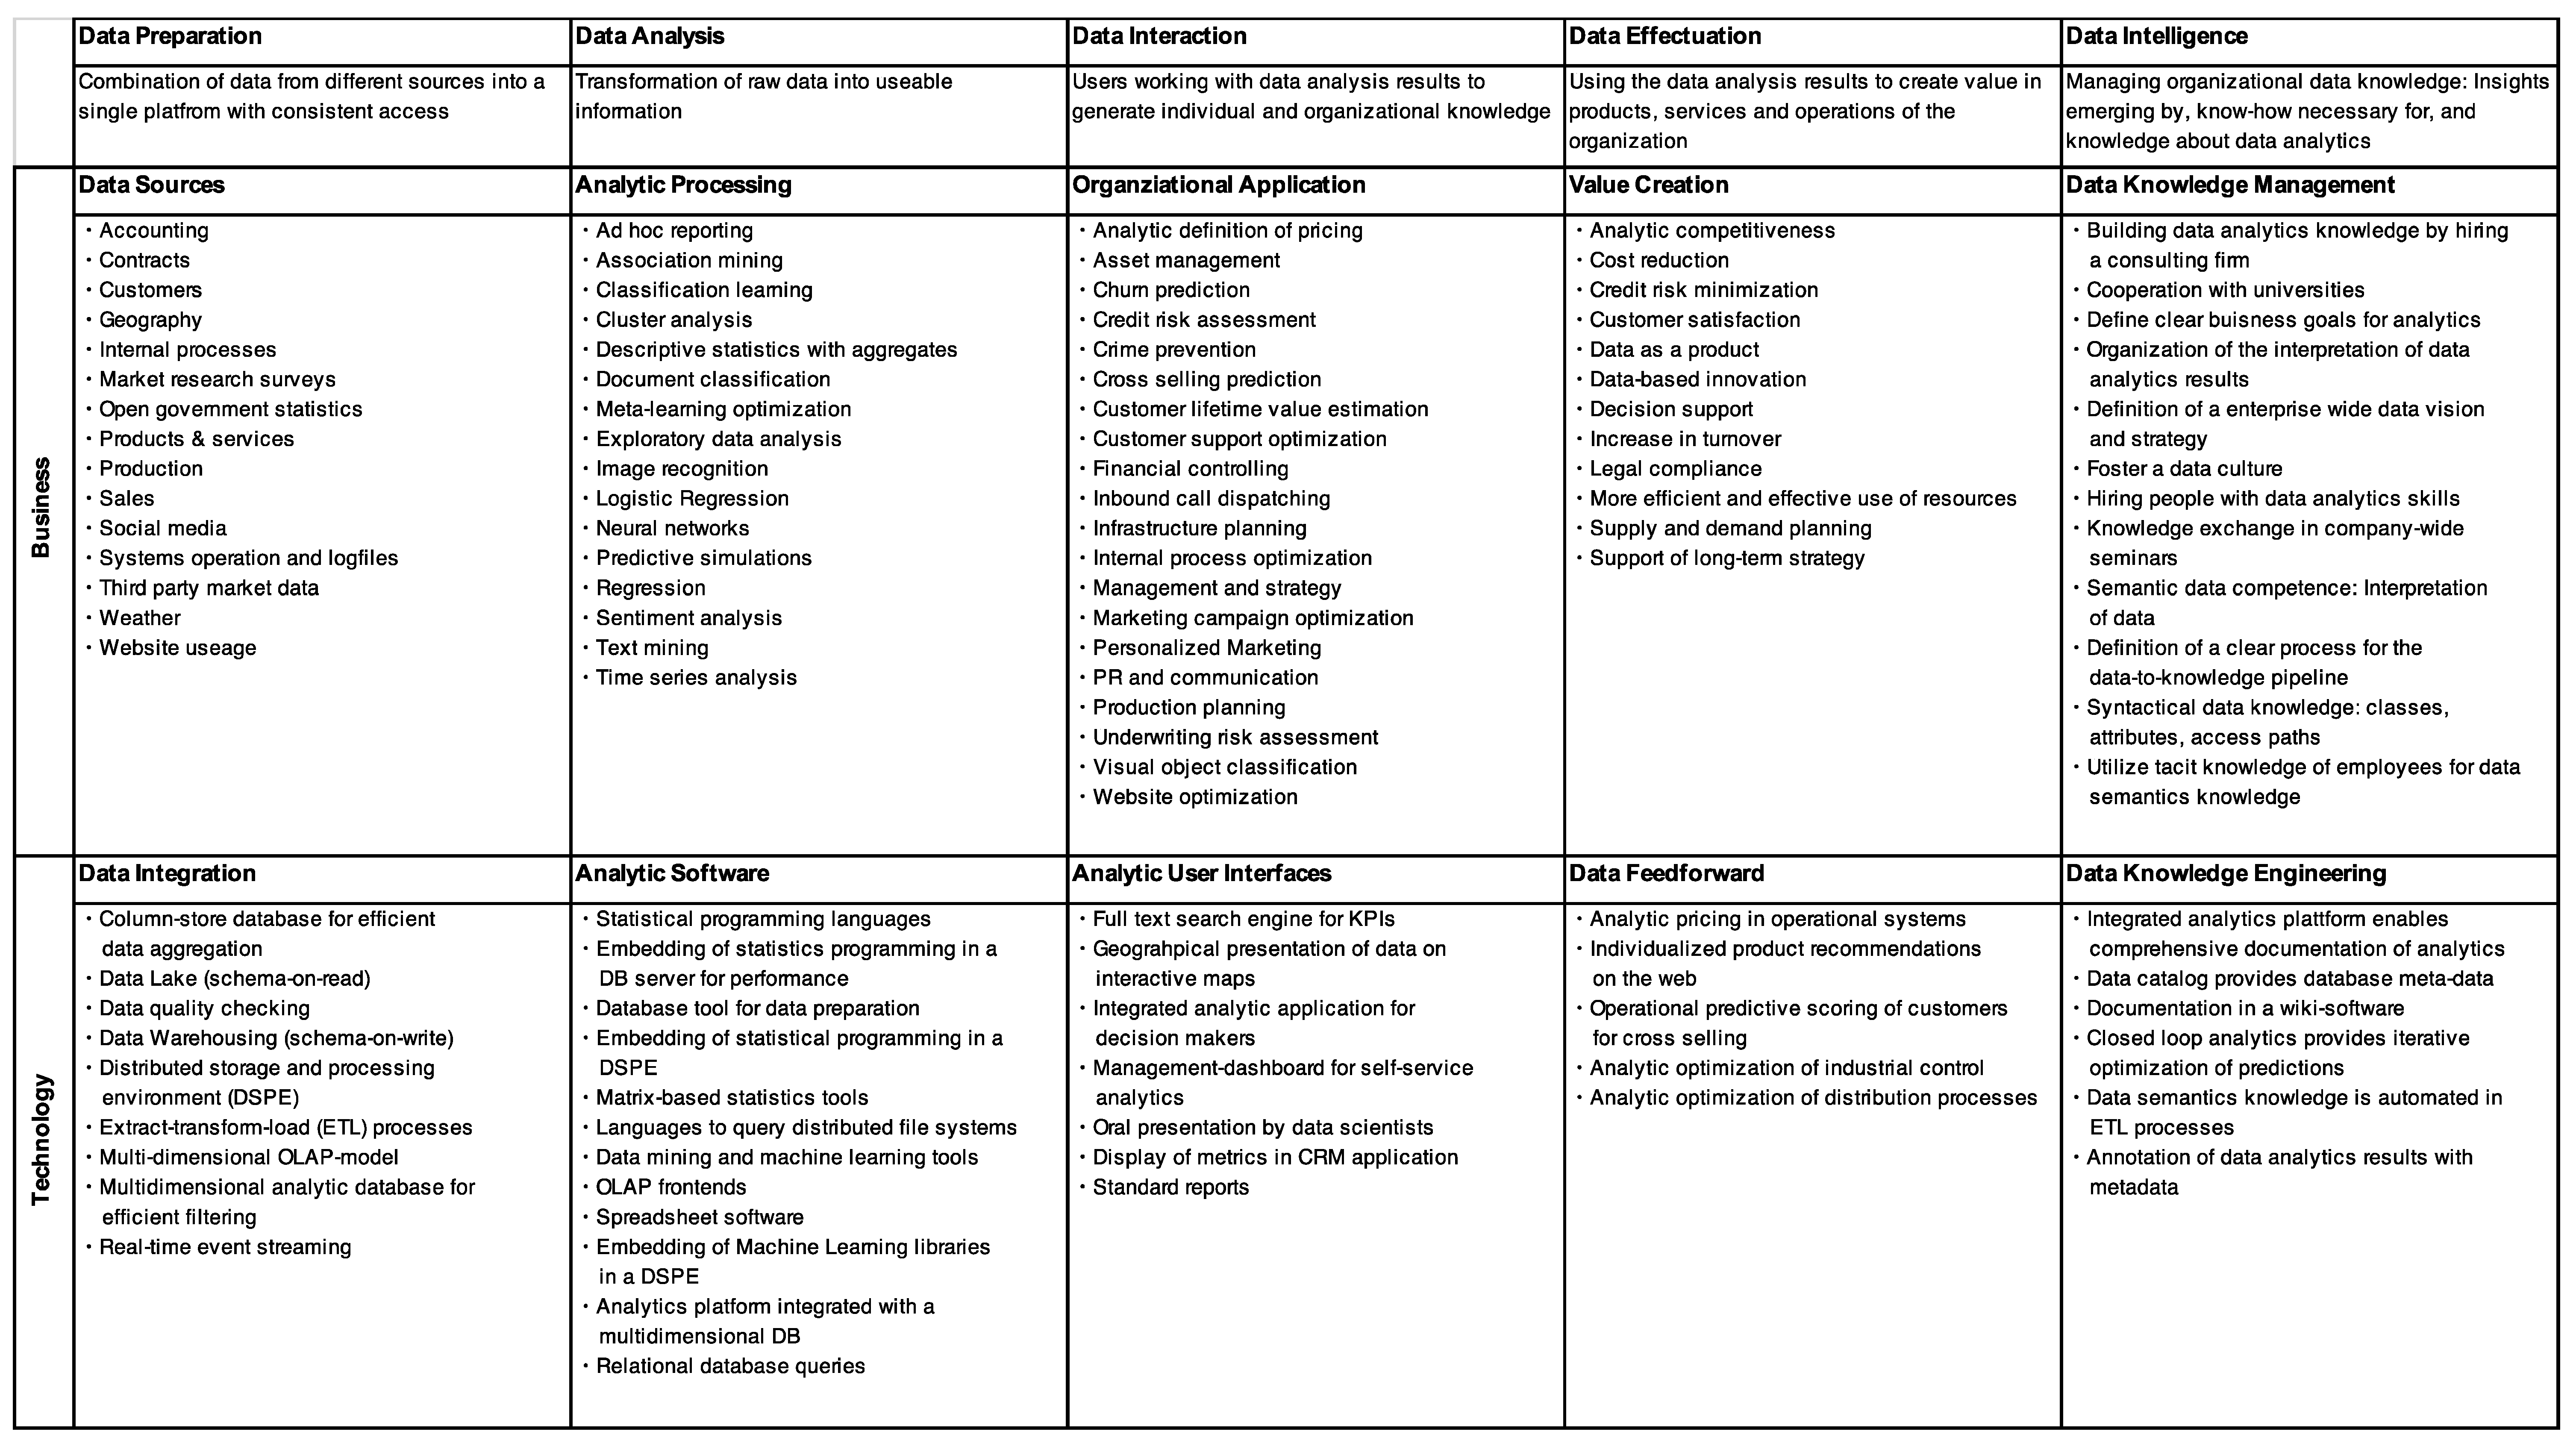
To ensure effective BDM that is focused on value creation, business–IT alignment [
33] is an important principle. Business and IT must work together in each layer of BDM to create value from data. Accordingly,
Figure 4 depicts the reference model in more detail. It adds, for each layer in the management model in
Figure 3, business aspects in connection with information technology (IT) aspects that can implement solutions for the corresponding model layer. The resulting reference model is called a big data management canvas (BDMC), in analogy to the business model canvas by Osterwalder & Pigneur [
34], because it can be applied as a blueprint to metaphorically paint big data solutions. The model provides 10 fields of action for describing and planning big data applications, which are described in more detail in
Figure 4. The goal of this model is to provide a frame of reference for big data processing information systems that is integrated with business value creation. It can be applied to either describe existing big data systems or to plan new big data applications.
6. Big Data Management in Practice: Case Studies Mapped to the Proposed Model
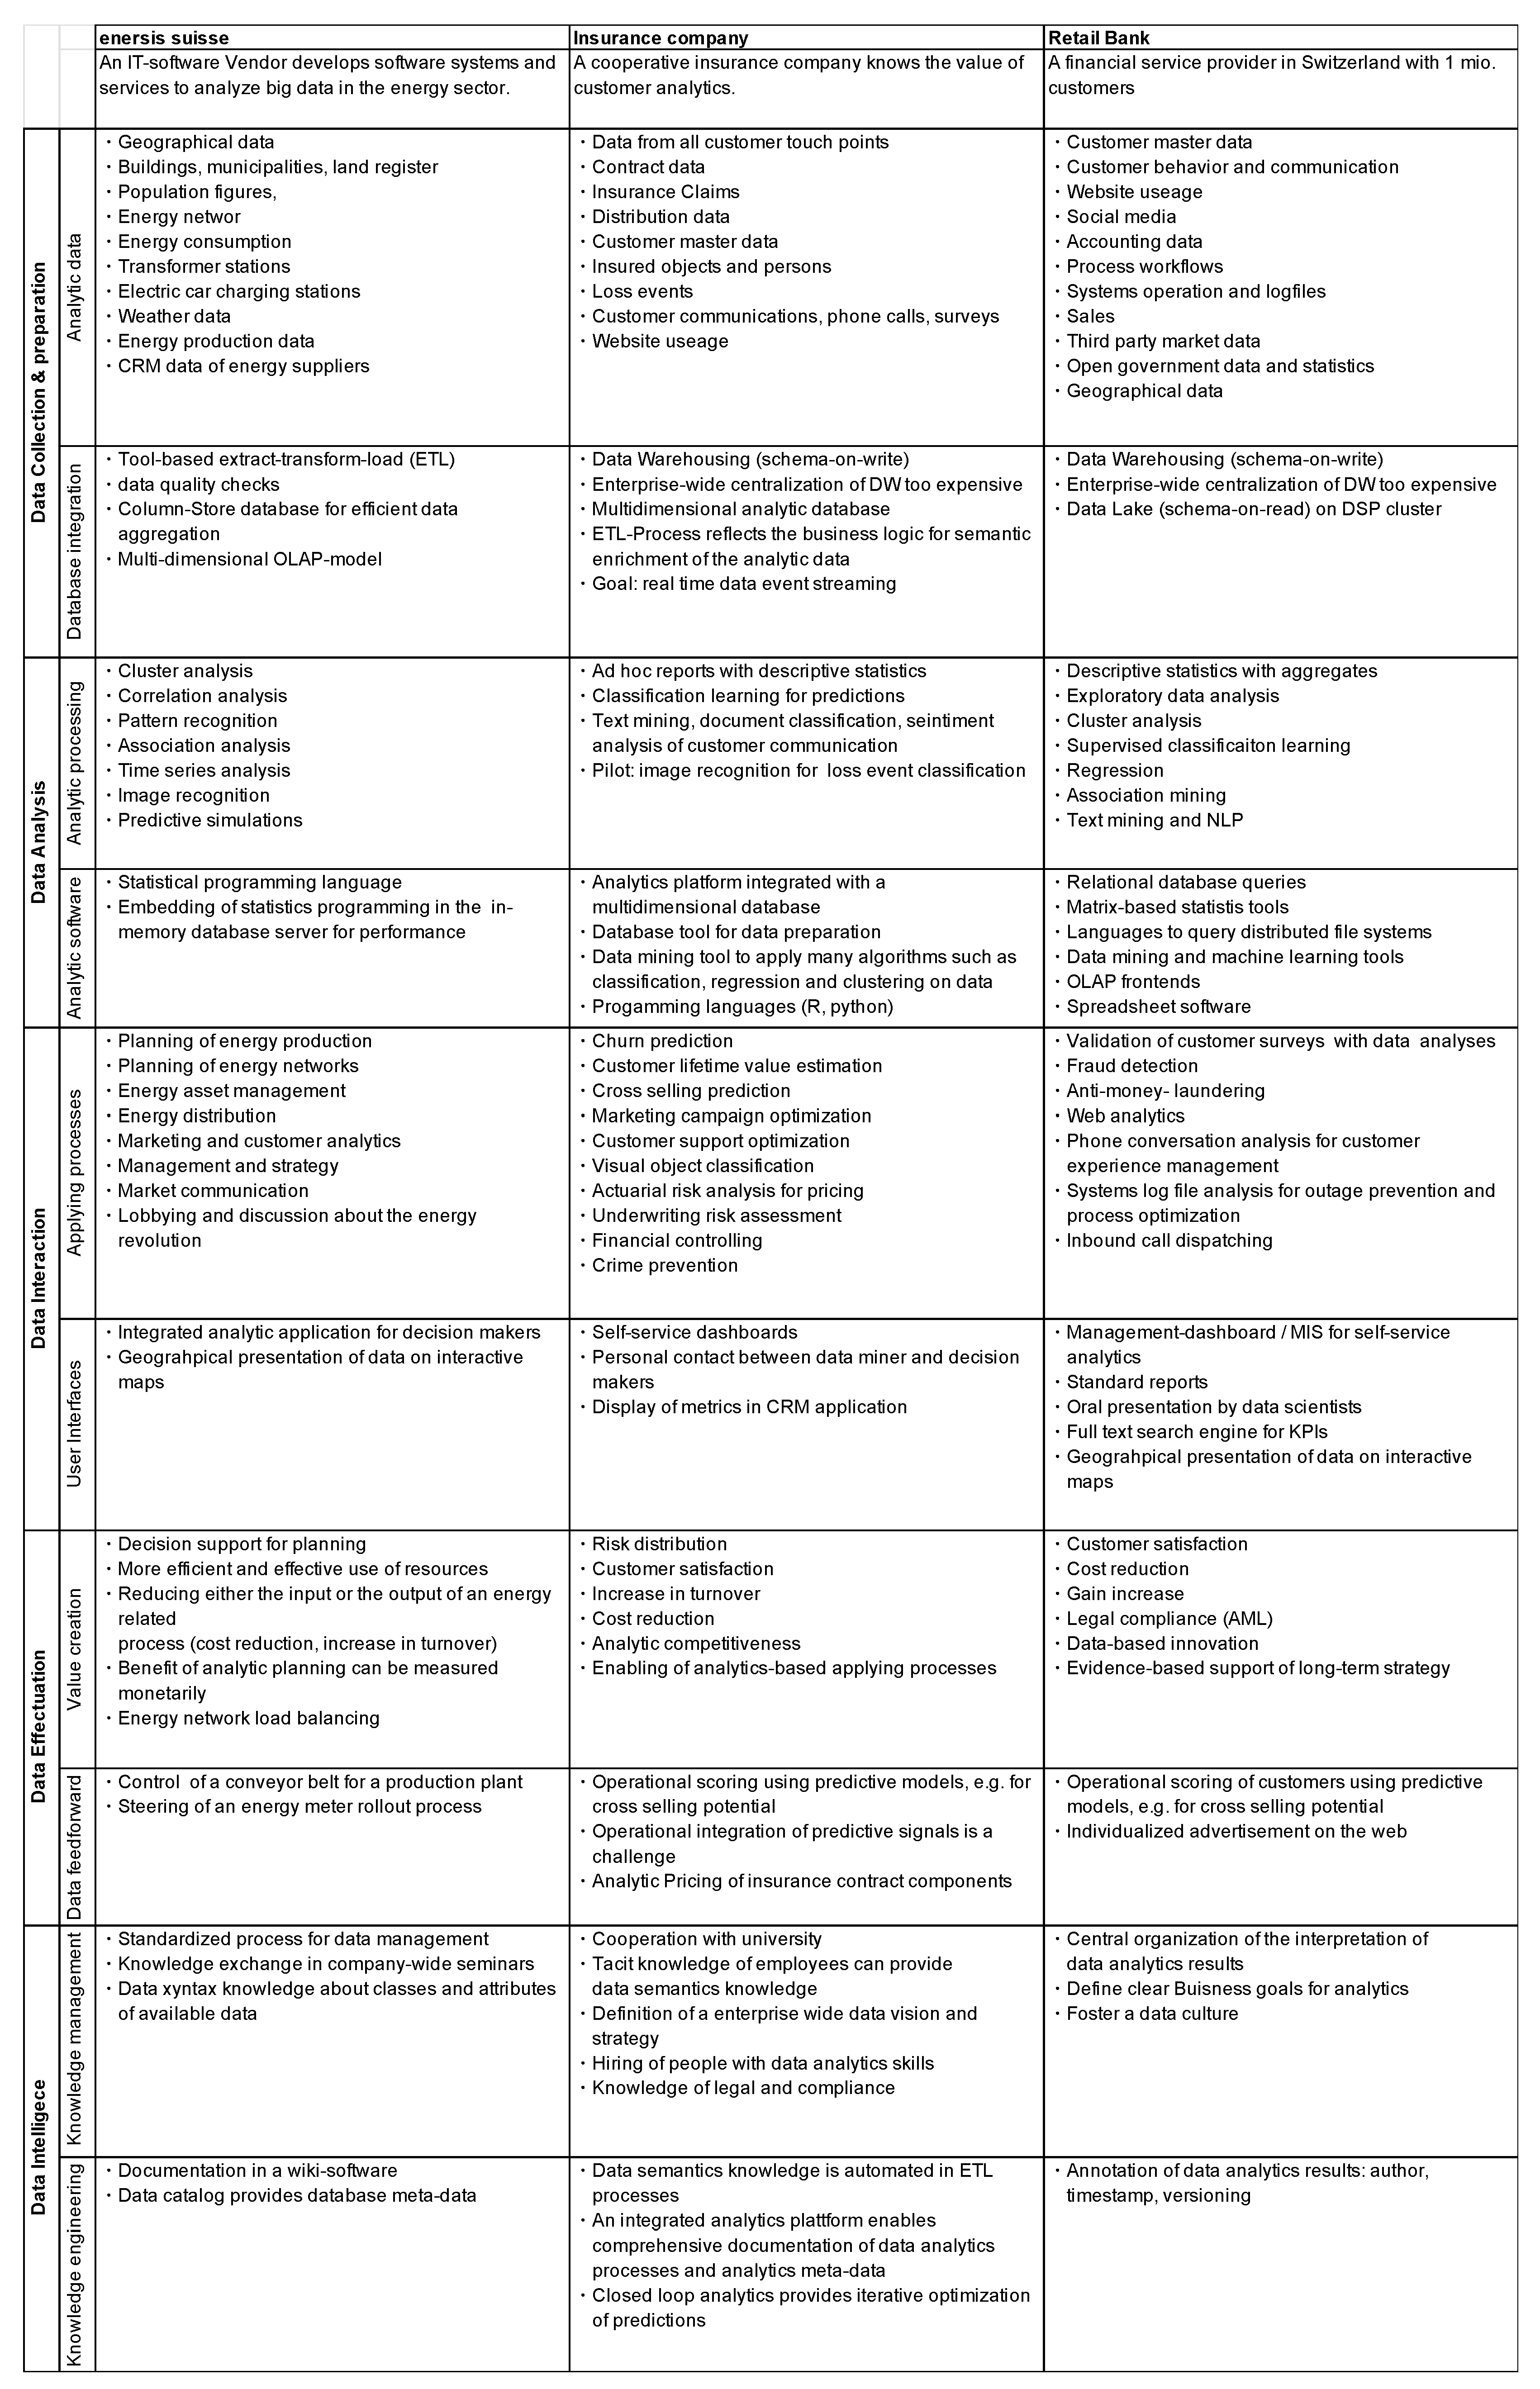
To validate the reference model developed in the previous sections, three cases of BDM in existing companies in Switzerland are described. These cases are presented in the form of stories that provide non-theoretical knowledge in the sense of Alter [
35]. These qualitative empirical observations serve to validate the BDMC reference model. If the cases provide observable instances that can be mapped to the fields of action in the proposed model, then there is evidence for a correspondence of the model with reality. Methodologically, the case descriptions are based on qualitative interviews with three experts that are representatives of the observed companies: the CEO of enersis suisse AG, a decision support systems producer; the head of customer and data analytcis at an insurance company; and the head of BI at a large retail bank. The BDMC reference has been applied to structure the interviews, and for each field of action, the approaches that are adopted by the company to solve the corresponding data management issues were recorded. Also, the BDMC guided the interviews and the editing and categorization of the raw interview notes.
Figure 5 summarizes a mapping of big data management solutions observed in the cases to the fields of action in the proposed reference model. As can be seen, several different approaches for all proposed fields of action are applied in practice.
Figure 6 summarizes this mapping of observed big data management aspects to fields of action in the big data management canvas according to
Figure 4. In the following paragraphs, the case descriptions are reported in detail.
6.1. Case 1: Enersis Suisse AG
Enersis suisse AG is an IT-software vendor in Bern, Switzerland that makes big data analytics systems for visual energy analytics. The company employs 45 people, of which 37 work in information technology. Big data is the core business of enersis, as it develops software systems and services to analyze big data in the energy sector.
The data enersis analyses are focused on the diverse processes of the energy revolution. Data are recorded about many aspects of energy production, consumption, planning, and optimization. Enersis integrates data about energy-related processes from its customers’ source information systems. In principle, enersis does not produce data content itself but delivers value by combining, layering, and creating information out of the data. In actual projects, enersis mainly works with historical data. However, there are cases in which real-time sensor data is recorded, for example, traffic measurement with internet of things (IoT) devices.
Enersis follows a “digital-twin” approach to modeling energy systems. It integrates a comprehensive data-based model of the real-world environment (cities, states, buildings, population figures, energy networks, consumption, transformer stations, electric car charging stations, and even weather data). Additionally, enersis buys proprietary data, acquires open data, and integrates data from local energy companies to gain information about municipalities, land registration, and consumption data. Furthermore, enersis integrates production data and information about the customers of energy suppliers. Analytic data are integrated in a central database with an extensive extract-transform-load (ETL) process that involves data quality checks. For this stage, enersis uses an ETL tool. This data acquisition and integration process is completely decoupled from the decision support application. Validation of data and quality analysis are performed before the data are loaded into analytic platforms. The data analysis and decision support system of enersis is database independent and works on a relational databases However, for processing big data, enersis uses a high-performance in-memory database system. For a client project, a coarse monthly granularity of historization is sufficient, as the systems are focused on planning processes and long-term decision support.
Data science at enersis suisse AG applies mainly statistical data analysis: cluster analysis, correlation analysis, and pattern recognition. The main question is usually which facts are related to which other facts, an analytic technique called association analysis. Time series analysis is also applied to validate the quality of the data themselves. Enersis also uses approaches of machine learning, neural networks, and predictive analytics. For example, an energy network operator wanted to classify digital images of power poles to determine their state or any need of repair automatically. Yet, until now, most of the problems could be solved with classical statistics and mostly with correlation analysis.
Data analysis is integrated in the value-added process of enersis. The company delivers data analytics results in a user interface as a service to its customers. Enersis delivers new information to optimize decision processes of its customers in the energy business. These processes include planning of energy production, energy networks, energy asset management, distribution, management and strategy, market communication, and even data for lobbying and discussion about the energy revolution. Enersis’s software application provides a standard software platform, where all the data analytics results are integrated, visualized, and communicated interactively to the customers and decision makers. Besides data integration, the platform’s value is to communicate new insights in the form of data science results simply and understandably. The visualizations encompass geographically structured illustrations, time series graphs, statistical diagrams, and cluster plots. As an example, the smart heat feature calculates plans and simulates effects for building isolation improvements in municipal areas. The user can interact with the DSS app to explore the possibilities to save heating energy.
Enersis suisse AG generates information for its customers as the basis for planning and decision-making. Often, data analysis is applied for simulation of effects of decisions in the energy business. Customers push to measure the effect of this decision support in terms of money. Usually, the goal of enersis’s customers is a more efficient and effective use of means, to reduce either the input or increase the output of an energy-related process. In some cases, the effect of decision support can be directly expressed monetarily. For example, the rollout of smart energy meters was optimized with a decision matrix so that write-offs of existing energy meters and installation costs were minimized. As another example, the deployment of a conveyor belt in a factory was optimized to save on-site power.
As data science is the core business of enersis suisse AG, the company has a lot of practical know-how in this area. It has created a standardized process for the establishment and integration of new analyses into its platform. To foster knowledge exchange between employees, communication is encouraged within the company. This knowledge exchange is institutionalized in the form of weekly seminars that are well liked by the employees. Furthermore, technical and data-science-related know-how about data analytics processes is documented in a wiki software application to secure reusability. It turned out that the enersis internal data catalog is invaluable for data scientists to get to the right data to generate insights. Therefore, enersis has started to document collections and fields in an analytic database, a metadata catalog for what enersis calls data knowledge management. The data catalog provides knowledge to data scientists about available content and its location. This data knowledge increases the productivity of data analysis.
6.2. Case 2: A Large Cooperative Insurance Company
The second case is a cooperative insurance company in Switzerland with headquarters in Bern. The insurance employs about 5000 people of which 500 work in IT. The company has a turnover of about 3.6 million CHF. The insurance company is currently developing a vision and strategy for data analysis.
At every customer touchpoint, data are collected. Interesting for analysis are all internal data, such as contract data, information on insured persons, insured objects, loss events, and claim settlements. Customer communication and website usage are also relevant. Anonymous evaluations of website usage and performance are already eavluated today, but the linking of website usage with specific internal customer profiles is not yet possible.
The IT solution for customer analytics is a multidimensional database that reads data from the customer data mart. Raw data are automatically prepared from various sources, integrated, and inserted into a technically meaningful structure. The insurance company operates several data warehouses that integrate and historicize data from different systems. Centralization of all analytic databases into a single enterprise data warehouse (EDWH) was not feasible because it was too expensive. Current efforts for data integration tend toward a data streaming pipeline. The goal for data integration is real-time event streaming, so that customer analytics can process all data events from all possible sources.
The customer analytics team uses many analysis methods. The team supports ad hoc analysis of business issues. For example, quick analyses of the number of customers or contracts with specific criteria are created for the sales reps. Automatic classification methods such as logistic regression are used for predictions: who will cancel, who will buy, in which region, how campaigns can be optimized, who will respond to a message, etc. Text mining is appplied to analyze customer feedback in terms of customer satisfaction. Information was automatically obtained from free text of customer communications. For this purpose, sentiment analysis and automatic text categorization was applied. The company is currently working on a proof of concept with image analysis together with an external research center. In the insurance environment, image recognition would be suitable for damage classification.
For customer analytics, a multidimensional database with an integrated analytics system collects and stores all relevant customer data for analytics. This database is embedded in a holistic analytics solution with various tools for data preparation, data analysis, and metadata management. There is a database tool that can be used to prepare data for analysis. This makes it possible to connect, filter, and provide different data sources in the right format for analysis. Despite a lot of automation, data scientists must do most of the data preparation themselves. Eighty percent of the time in a data mining project is spent on data preparation. For analytics, data scientists sometimes use R and Python for specific tasks but mostly use the data mining tool integrated with the analytics database that enables the application of machine learning algorithms such as classification, regression, and clustering of the data.
Business divisions want to work with numbers to make decisions. The actuary calculates insurance rates with calculated risk based on existing claims data. These analyses are included in the pricing process. In underwriting, statistics are used to evaluate the risk of a contract to decide whether to insure it. Currently, the use of text analysis for risk analysis is also being examined. In sales, an attempt is made to sell products based on cross-selling predictions. For this purpose, customer categories are generated based on data analysis. On the one hand, clustering algorithms can divide customers into meaningful groups. On the other hand, predictive analytics and classification algorithms can generate leads by predicting the product affinity of prospective customers based on past sales data. Another process optimized with data analytics is customer support. With text analytics, customer feedback is classified and categorized by sentiment to gain information about the potential for improvement from the customer’s point of view. The process of accounting is also data-based and generates key figures for management decisions.
For the interaction of business processes with analysis results, there are so-called dashboards, which present standardized key figures interactively on a website. For more complex analyses, communication takes place via direct contact between data scientists and managers. Often, questions are answered in repeated feedback loops with the business managers and the findings are presented in slides or numerical tables. When it comes to dashboards, there are several different solutions. The company wants to go one step further and use unified dashboard technology for all analytical applications. UX designers are also involved in analytical applications to make the user journey as easily understandable as possible.
The business value of data analytics has several dimensions. First, the insurance business has always been based on data analysis. The distribution of risks that insurance creates is based on the analysis of probabilities of loss events and the expected values of losses. These analyses are included in the tariff classification and thus, in the prices of insurance products. Second, the optimization of products, services, and processes based on data analysis should be applied to better serve the customer base. Knowledge about the customers should be used to improve their satisfaction. Third, another effect is the increase in sales. Marketing analysis is intended to identify customers who are more likely to respond to an advertising campaign. Furthermore, data analysis can reduce costs by making inefficiencies transparent. Another aspect is analytic competitiveness. When a Fintech company offers to automate everything, the insurance company needs to have the know-how to compete. In addition, as a last point, there are dependent processes within the company’s operations that make data analysis necessary.
The insurance company has already implemented several pilots and proofs of concept for data-driven projects with onetime results or isolated user interfaces and dashboards. The difficulty is to integrate the data analysis into the existing processes and to feed the analysis results forward to the operative systems on a regular basis automatically. One application that is already fully operationalized is product affinity scores. An algorithm rates customers for their purchase probability daily. These forecasts are fed forward into the sales platform where a product affinity value can be displayed in the customer dossier.
Regarding data intelligence, data know-how, or the knowledge about how data are generated and what the data mean are immensely important. With insurance data, a lot of expertise is necessary regarding the definition and interpretation of key figures. Therefore, specialists can help data scientists interpret existing data and acquire new data. Regarding data science skills, although there are a few data scientists, most employees have no know-how in data analytics. That is why the company has to hire new employees to build up data analysis skills. Accordingly, the insurance company cooperates with universities. For example, it has set up a research lab for analytics together with a public university. Several doctoral students are researching analytic crime prediction and analytic customer relationship management. Furthermore, to set the basic conditions for data analysis in the company, a data strategy is being developed that defines how to work with data across the entire company. As part of the vision development, the value of data analytics is discussed. Another important aspect of the data strategy is data protection for compliance.
Data know-how has been partially automated. The customer data mart pulls raw data from source systems and prepares the data for best use. However, the documentation of data is not optimal. The metadata are only partly described. The data science team is a small team focused on the core business. The team has a wiki software, but it is not used frequently. However, because data analysis is done with a comprehensive tool, the work is documented there. A user can tell when a model was last updated. There is a separate data structure in the data analysis platform where files and metadata are stored for all analyses. There are several libraries in the database where analysis jobs are stored. There are projects for which tables are generated. The output of forecasting models can be saved and stored in the libraries. Other descriptive documents, such as spreadsheets and presentations, can be stored uniformly in this structure. This toolset embeds data analysis in a digital work environment that documents tools, data, projects, and results.
6.3. Case 3: A Retail Bank
The third case study describes a financial service provider located in Bern, Switzerland. The company has a turnover of 100 million CHF, serves around 3 million customers, and employs 3500 people. The company has a strategic data-driven approach, and the company has invested in the development of applying data science in many business processes, such as risk management, investment, controlling, and financial planning.
The bank records data mainly in two categories: signals external to the company and signals from internal business processes. External signal recording is mostly focused on customer behavior and customer interaction with the company. Market data are recorded either using customer polls or on social media. Internal data recording is mostly applied to either accounting, process workflows, or systems operation. From their information system’s records, a wide range of data sources for analytics is accumulated. From the logging of customer interaction with their IT systems, a wide range of attributes is recorded in digital data, such as sociodemographic customer attributes, product sales, customer contacts in all marketing channels, financial transactions, website usage data and clickstreams, and a transparent history of email communications of customers with their customer consultants. From accounting and controlling, there results another source of valuable data on internal business processes. Furthermore, the bank has realized that system logfiles of IT-supported workflows present a valuable source of information for the optimization of business processes in marketing, operations, and compliance. In addition to data it collects itself, the bank integrates other third-party data sources, such as open government data, statistics, geographical data, and external market data such as company ratings, structures, turnovers, and employee numbers. To integrate analytic data, the bank has implemented several different data warehousing solutions. There are systems for dispositive data integration with different process-specific focuses for accounting and controlling, marketing, customer relationship management, anti-money laundering, and management information. Similar to the case of the insurance company, the project of consolidating all analytic data in one single enterprise-wide data warehouse turned out to be too expensive and not agile enough. In a new approach with big data technologies, the bank switched to a schema-on-read architecture. Currently, a data-lake architecture based on a distributed storage and processing environment (DSP) is being implemented, where all relevant analytic data are copied and archived in source system format. The data warehouse system encompasses the legacy relational core DWH, a DSP cluster, a tool server, and a metadata repository.
The bank has invested in the establishment of a data science department with specialists competent in data analytics. This team employs a wide range of methods to answer management questions and to support decisions with data analyses: descriptive statistics, exploratory data analysis, clustering, classification, regression, association mining, and natural language processing. With a wide range of possibilities, the data analysts employ existing, well-known analysis methods that best fit the task. The bank experiments with new forms of analytics such as social media analytics and text analytics. The bank applies sentiment analysis on customer mail communications to optimize customer satisfaction. To support data science with analytic software platforms, the analysts apply classical relational database queries; statistical programming languages; languages to query the DSP; matrix-based data mining tools; OLAP frontends and even, in some cases, spreadsheet software.
Prognostic models and algorithms play an important role in different areas of the bank’s business such as the validation of customer polls with data warehouse analyses, fraud detection, anti-money laundering, web analytics, and phone conversation analysis for customer experience management, systems log file analysis for outage prevention and process optimization, and inbound call dispatching to minimize customer waiting times and to automatically connect customers with the best fitting consultant. Results from data analyses interact with people and processes in many ways. There is a management dashboard for self-service analytics. Standard reports are generated on a regular basis and are published and provided for download on the intranet. Often, data scientists present results from complex data analyses orally to the management. For fast access to decision support information, a full-text search engine for key performance indicators has been implemented recently. Some geographical decision support information is presented on interactive maps.
The most important effects of data analytics for the bank are either cost reduction or gain increase. Based on analytics, products have been discontinued or prices have been raised; inefficient production processes have been optimized; and marketing activities, sales, and new money inflow have been increased. However, there are other important effects of analytics at the bank, for example, compliance. The ability to comply with anti-money laundering regulations is empowered by data analytics. Moreover, another effect is data-based innovation. New products have been launched that are directly based on data analytics. For example, an optional opt-in app allows bank customers to subscribe to third-party promotions and discount offers that are individualized based on analysis of their transaction data. Additionally, another effect of data analysis is support of long-term strategy analysis. In general, the basic rule is a data-driven business approach, where decisions are, in principle, to be supported by data. Usually, decisions are elaborated using variants and data analytics to asses these variants. This leads to qualitatively better and more objective decisions and correspondingly better consequences.
Not only are results from data analysis communicated to human decision makers but they are also fed forward to operational systems. For example, sales opportunities are detected using data analytics. These leads are fed forward to downstream systems. Results from next-best-product cross-selling analyses are displayed in the customer relationship management software. These sales leads are also fed forward to the web application and the inbound call center for individualized advertisement. Another example is the feedforward of analytic credit risk assessment to credit card and mortgage applications to support the decisions for credit limits.
The company realized that a knowledge-based approach to big data management is essential. The meaning of key performance indicators is usually documented to clarify their meaning. Yet, data-knowledge, the interpretation of data analytics results, is not organized centrally. For specific analytics results, it is important to find out which analyst produced the analysis, the time of creation, and whether the data are still valid. Therefore, a current project introduces metadata management to annotate data analytics results. The goal is to annotate data in all stages of the life cycle. Reports are annotated with metadata, such as measures, dimensions, sources, authorship, creation timestamp, and applied filters, providing knowledge about the data analytics process.

