Article

Usage of the Term Big Data in Biomedical Publications: A Text Mining Approach

Department of Clinical Epidemiology, Biostatistics, and Bioinformatics, Amsterdam UMC, University of Amsterdam, Meibergdreef 9, 1105AZ Amsterdam, The Netherlands
*
Author to whom correspondence should be addressed.
Big Data Cogn. Comput. 2019, 3(1), 13; https://doi.org/10.3390/bdcc3010013
Submission received: 16 January 2019 / Revised: 30 January 2019 / Accepted: 1 February 2019 / Published: 6 February 2019

Abstract

:
In this study, we attempt to assess the value of the term Big Data when used by researchers in their publications. For this purpose, we systematically collected a corpus of biomedical publications that use and do not use the term Big Data. These documents were used as input to a machine learning classifier to determine how well they can be separated into two groups and to determine the most distinguishing classification features. We generated 100 classifiers that could correctly distinguish between Big Data and non-Big Data documents with an area under the Receiver Operating Characteristic (ROC) curve of 0.96. The differences between the two groups were characterized by terms specific to Big Data themes—such as ‘computational’, ‘mining’, and ‘challenges’—and also by terms that indicate the research field, such as ‘genomics’. The ROC curves when plotted for various time intervals showed no difference over time. We conclude that there is a detectable and stable difference between publications that use the term Big Data and those that do not. Furthermore, the use of the term Big Data within a publication seems to indicate a distinct type of research in the biomedical field. Therefore, we conclude that value can be attributed to the term Big Data when used in a publication and this value has not changed over time.

1. Introduction

With approximately 3700 documents mentioning Big Data in the PubMed library between 2011 and the time of writing, it can be said that the term Big Data is widely used in biomedical research. This, however, does not mean that a clear-cut meaning of the term is being applied, as can be attested from the many publications—both formal and informal—written on the subject. This sentiment is underwritten in publications such as Tian et al. [1] and Mayer-Schonberger et al. [2], which state that there is no rigorous definition of Big Data and it remains something of a work-in-progress. The reasons above, in conjunction with a massive increase in use in the last few years [3], raises the question of what value the term holds when used in a scientific document.
By comparing documents that use the term with those that do not, one can find out what distinguishes these two groups of documents from each other and determine how well they can be separated [4]. We further refer to these two groups respectively as Big Data (BD) and non-Big Data (NBD) documents. The degree to which BD can be separated from NBD documents gives insight in the value of the Big Data term, and inspecting the distinctive features tells us something about its meaning. The influence of some hype effect can be measured through the change of value of the term over time.
In our work we are particularly interested in discovering differences between BD and NBD documents in the scope of biomedical research literature. Our hypothesis is that the term BD describes research with common characteristics that are distinguishable from those found in other biomedical research. Also, we hypothesize that through overuse or hype, the meaning of the term has become diluted over time. In this study, we therefore investigate the following questions:
  • How well can documents that use the term BD be distinguished from documents that do not use the term in a comparable corpus?
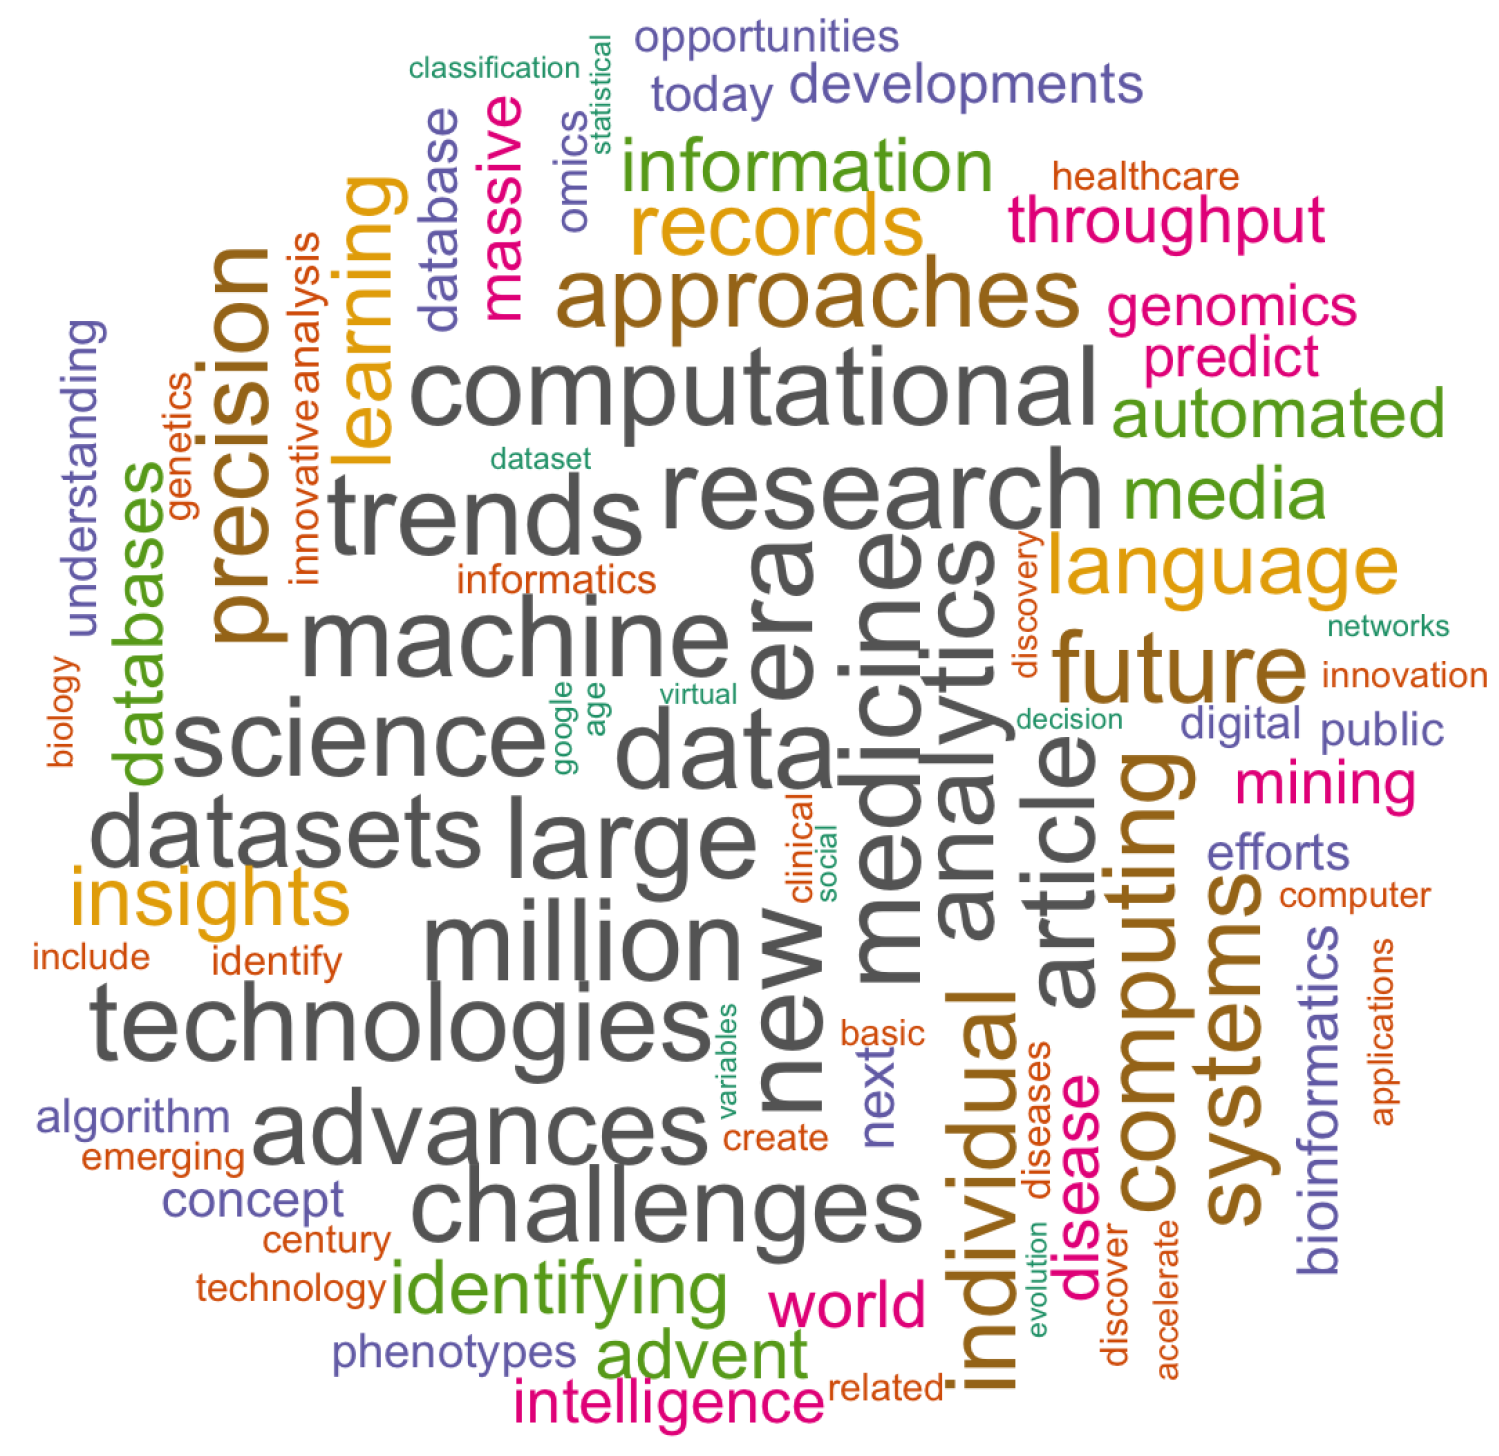
  • What are the distinguishing features between BD and NBD documents?
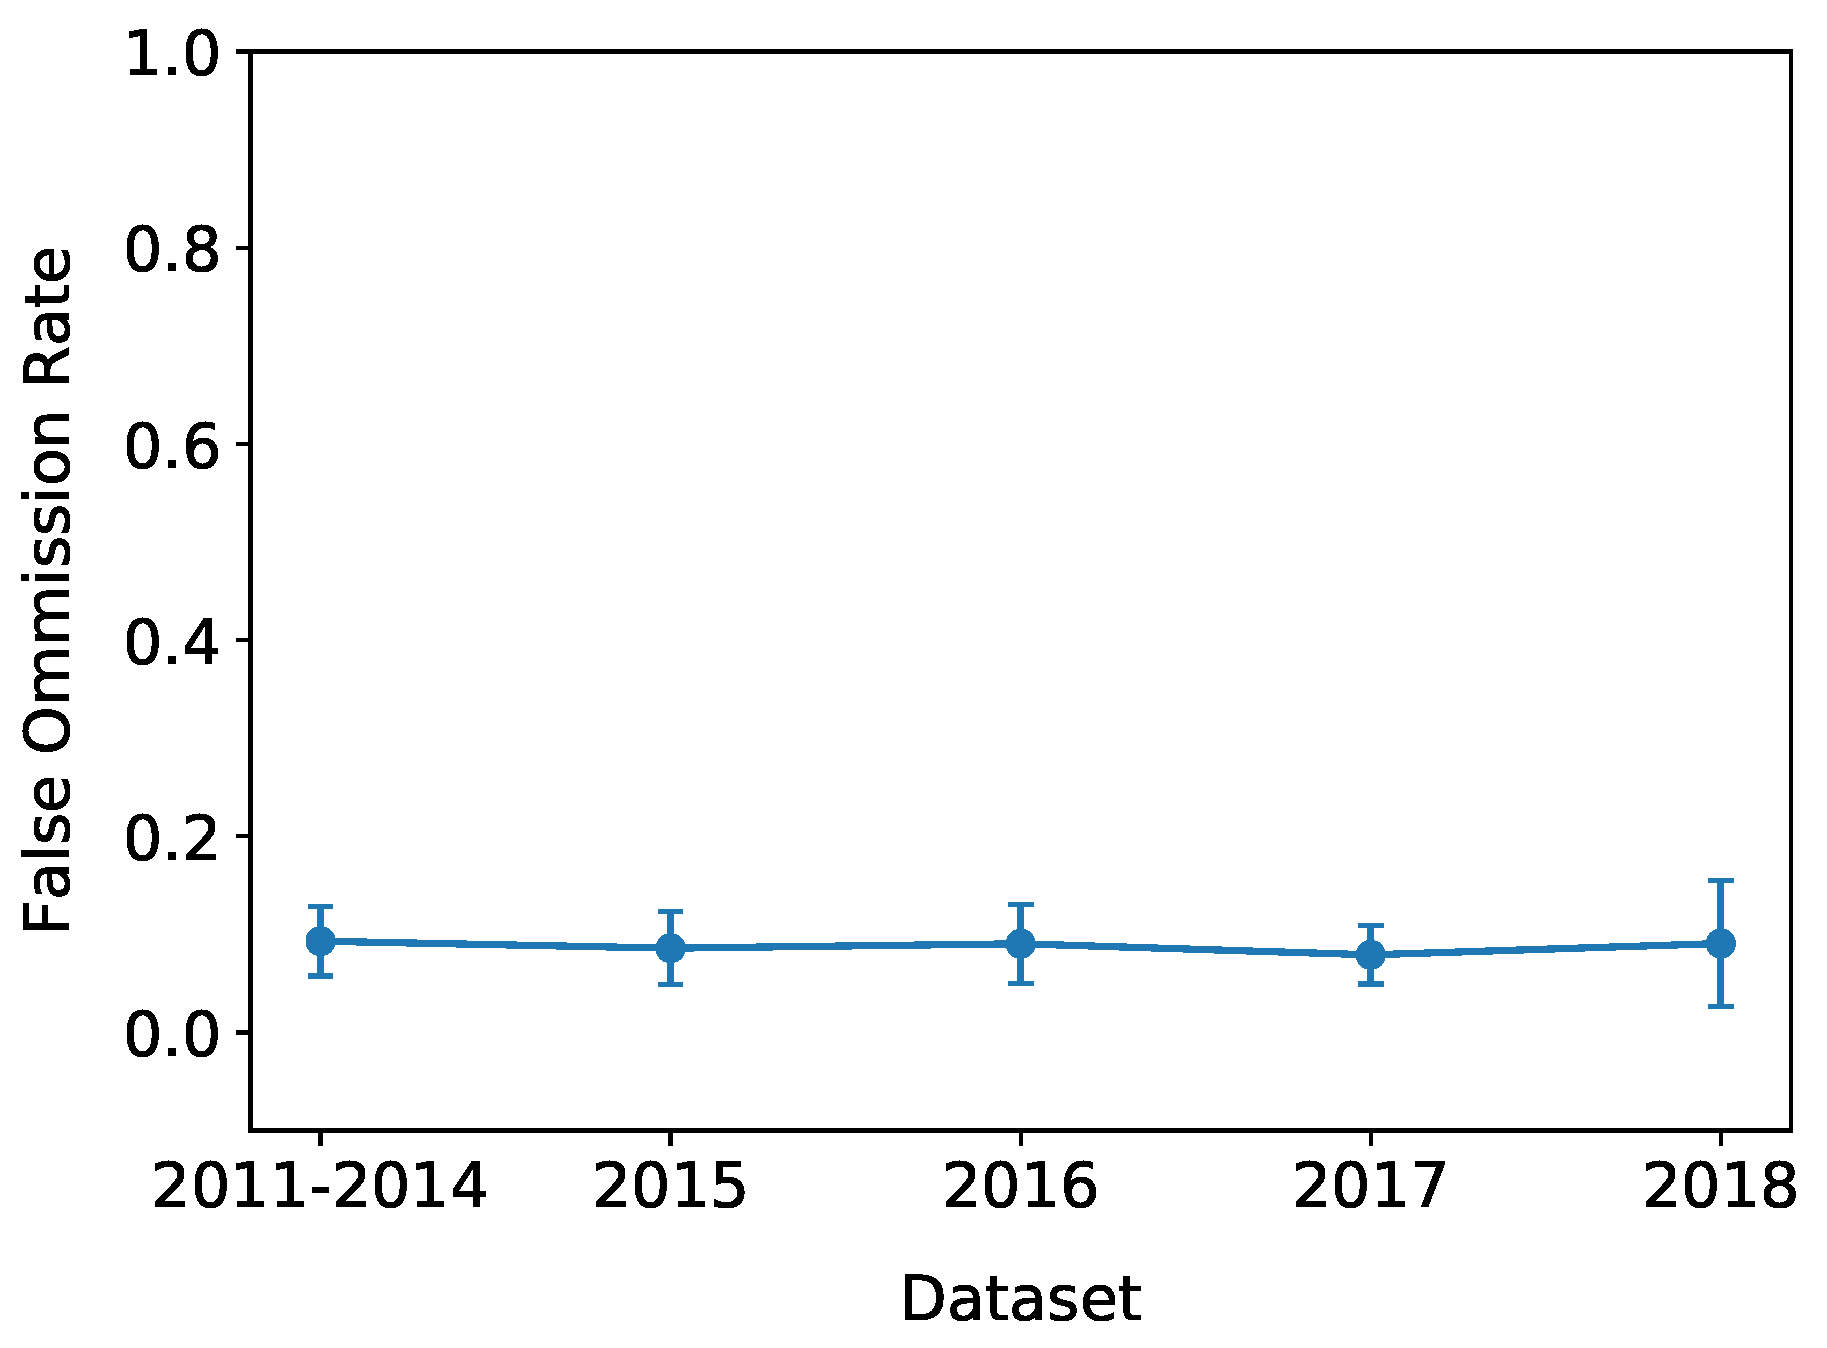
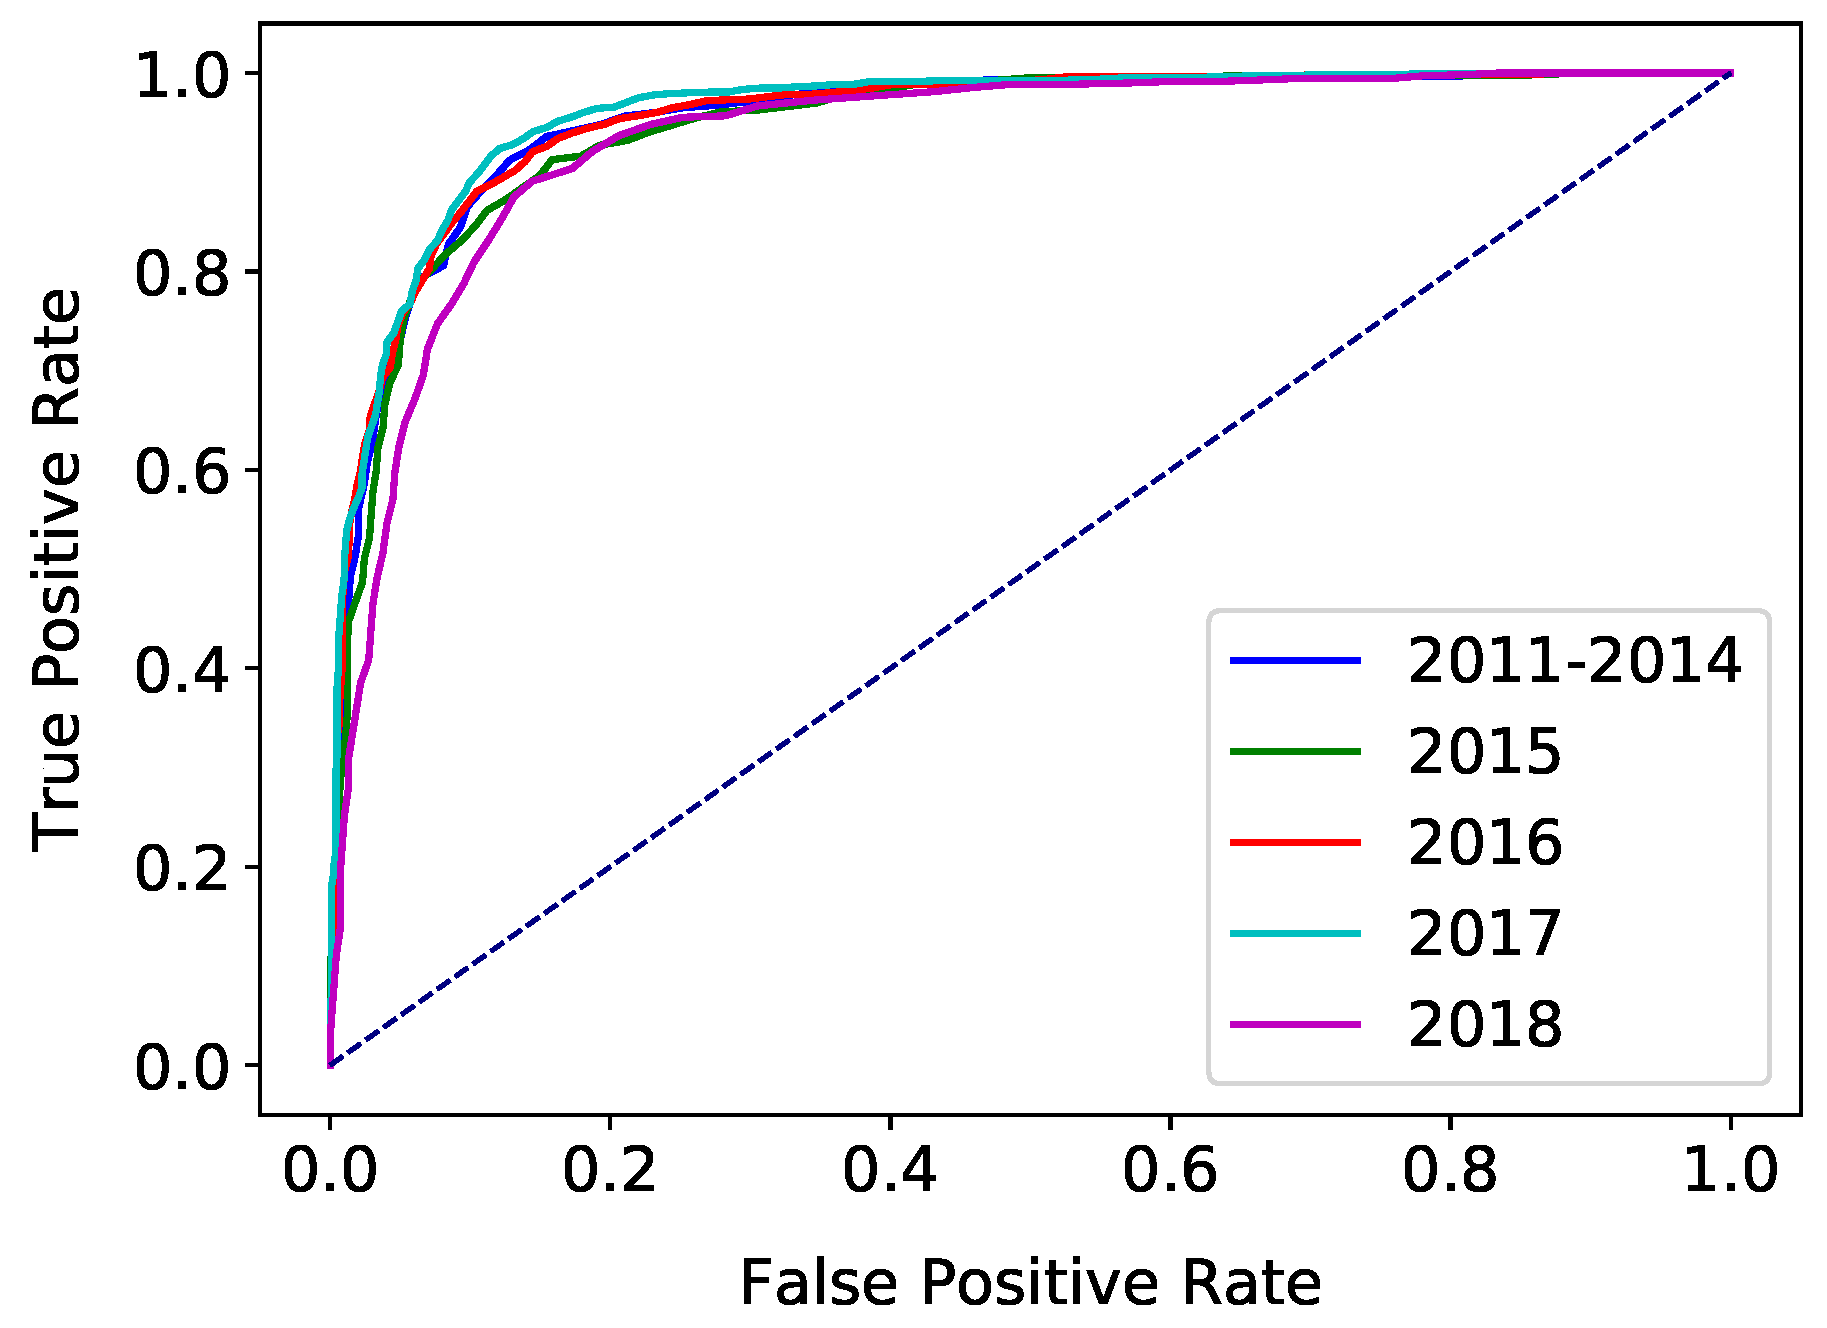
  • Does the distinguishability of BD and NBD documents change over time?
The large number of published literature makes it nigh impossible for a researcher to keep up with the status quo [5]. Therefore, we seek answers to these questions through text mining on a corpus of BD and NBD documents from two biomedical literature databases. The label BD or NBD was given based on the presence or absence of the term Big Data in the title or abstract. BD and NBD documents were cleaned and preprocessed to be used as input to a machine learning classifier that trains a model to determine the most distinguishing features. To assess the stability of the applied methods multiple datasets were created and tested, each with a different random mix of documents. Features that were selected consistently were used in further analysis.
This work builds on previous research published in conference proceedings [6]. In this previous work we also investigate whether BD and NBD documents are distinguishable using text mining tools. There we concluded that BD biomedical research articles can be reliably identified. Here we extend that work, the BD corpus in the current study has nearly doubled in size and we analyze a larger portion of the available scientific documents. Furthermore, the analysis methods were adapted and simplified.

2. Related Work

The meaning of BD is being discussed at various levels. In 2001 Gartner published a report which in hindsight is often referred to as the first description of BD. It defines the term through information technology challenges described by three Vs: volume, velocity, and variety [7]. This definition has had many additions and adaptations over time and a relatively stable six Vs (volume, velocity, variety, veracity, value, and variability) are in common use presently [8].
At an informal level, various blogs have debated about the usage of the term BD, and the hype that surrounds it. These blogs cover a wide spectrum of opinions expressed by members of the scientific community and industry. At one end of the spectrum we have ‘The emperor’s new clothes’, by Levi [9], which states that BD appears to be a fad with many potential downfalls in the medical field. On the other end, some state that BD has become the ‘new normal’ in information processing. Gartner describes that the aspects of BD have evolved into various other areas such as data science [10]. IBM states that BD techniques are no longer an option, but a necessity [11]. The large majority, however, adopt definitions of BD that often focus on technological aspects such as the storing and processing of data [12,13].
While blogs are informal and subjective sources, there are also many researchers investigating the meaning of BD more systematically. Some approached this in a qualitative manner by analyzing existing definitions, describing similarities and differences, and merging them into an overarching definition. For example, De Mauro et al. [14] looked at 15 existing definitions and derived four overarching aspects that define BD: Information describes the aspects directly related to data such as its volume and variety; Technology and Methods describe the techniques to make use of data; and lastly Impact describes the value—either scientific or economic—that data may generate. Others are, for example, Ward et al. [15] and Gandomi et al. [16] which assess existing (industry) definitions to find and describe common aspects between them. There is also research focused on definitions within a specific research area, such as: Kudva et al. [17] for smart cities, Wolfert et al. [18] for smart farming, and Hashem et al. [19] for cloud computing. These studies are aimed at helping researchers identifying the intersections between the research area that they know and BD.
Other researchers applied quantitative methods and extracted common features from research publications. Hansmann et al. [20] identified topics in a corpus of BD publications and described them in the light of existing definitions. They concluded that BD is described by data, information technology infrastructure, and methods of data analysis. Similarly, our previous work [21] mined the topics of BD publications and matched them against the six BD Vs and the definition posed by [14]. We concluded that while some Vs are often identified (volume, velocity, value), the presence of aspects from the definition of de Mauro et al. is especially strong.
More closely related to the research in this paper is the work of Hahn et al. [3] who analyzed the changes in popularity of specific areas in bioinformatics over time. They gathered a set of scientific literature and applied a keyword and topic modelling-based analysis. Their results show that the term Big Data has a massive increase in popularity over time and several research areas of bioinformatics are shifting to BD techniques.
The previously mentioned studies attempted to understand and define BD in the broad scope of a research field, including methodological aspects. The meaning of BD, however, has also been derived from the characteristics of datasets alone. By applying a taxonomy [22] of potential BD aspects to 26 datasets, Kitchin et al. [23] investigated which aspects are common in ‘Big’ datasets. They concluded that velocity and exhaustivity (i.e., the dataset is a sample or n = a l l ) are the most distinguishing aspects. Moreover, they stated that volume and variety, which are traditionally related to BD, do not qualify as meaningful aspects without velocity or exhaustivity.
As it can be seen from the above, the term Big Data may be used to describe different aspects. Defining BD only through dataset characteristics, as proposed by Kitchin et al., provides a narrow perspective, excluding aspects such as methods and technology that are included by many others. Depending on the point of view, BD definitions may overlap but are often not fully in agreement with each other. Therefore, when the term Big Data is used in a scientific document, it is unclear what it really means and whether this is a marker of unique characteristics.

3. Data and Methods

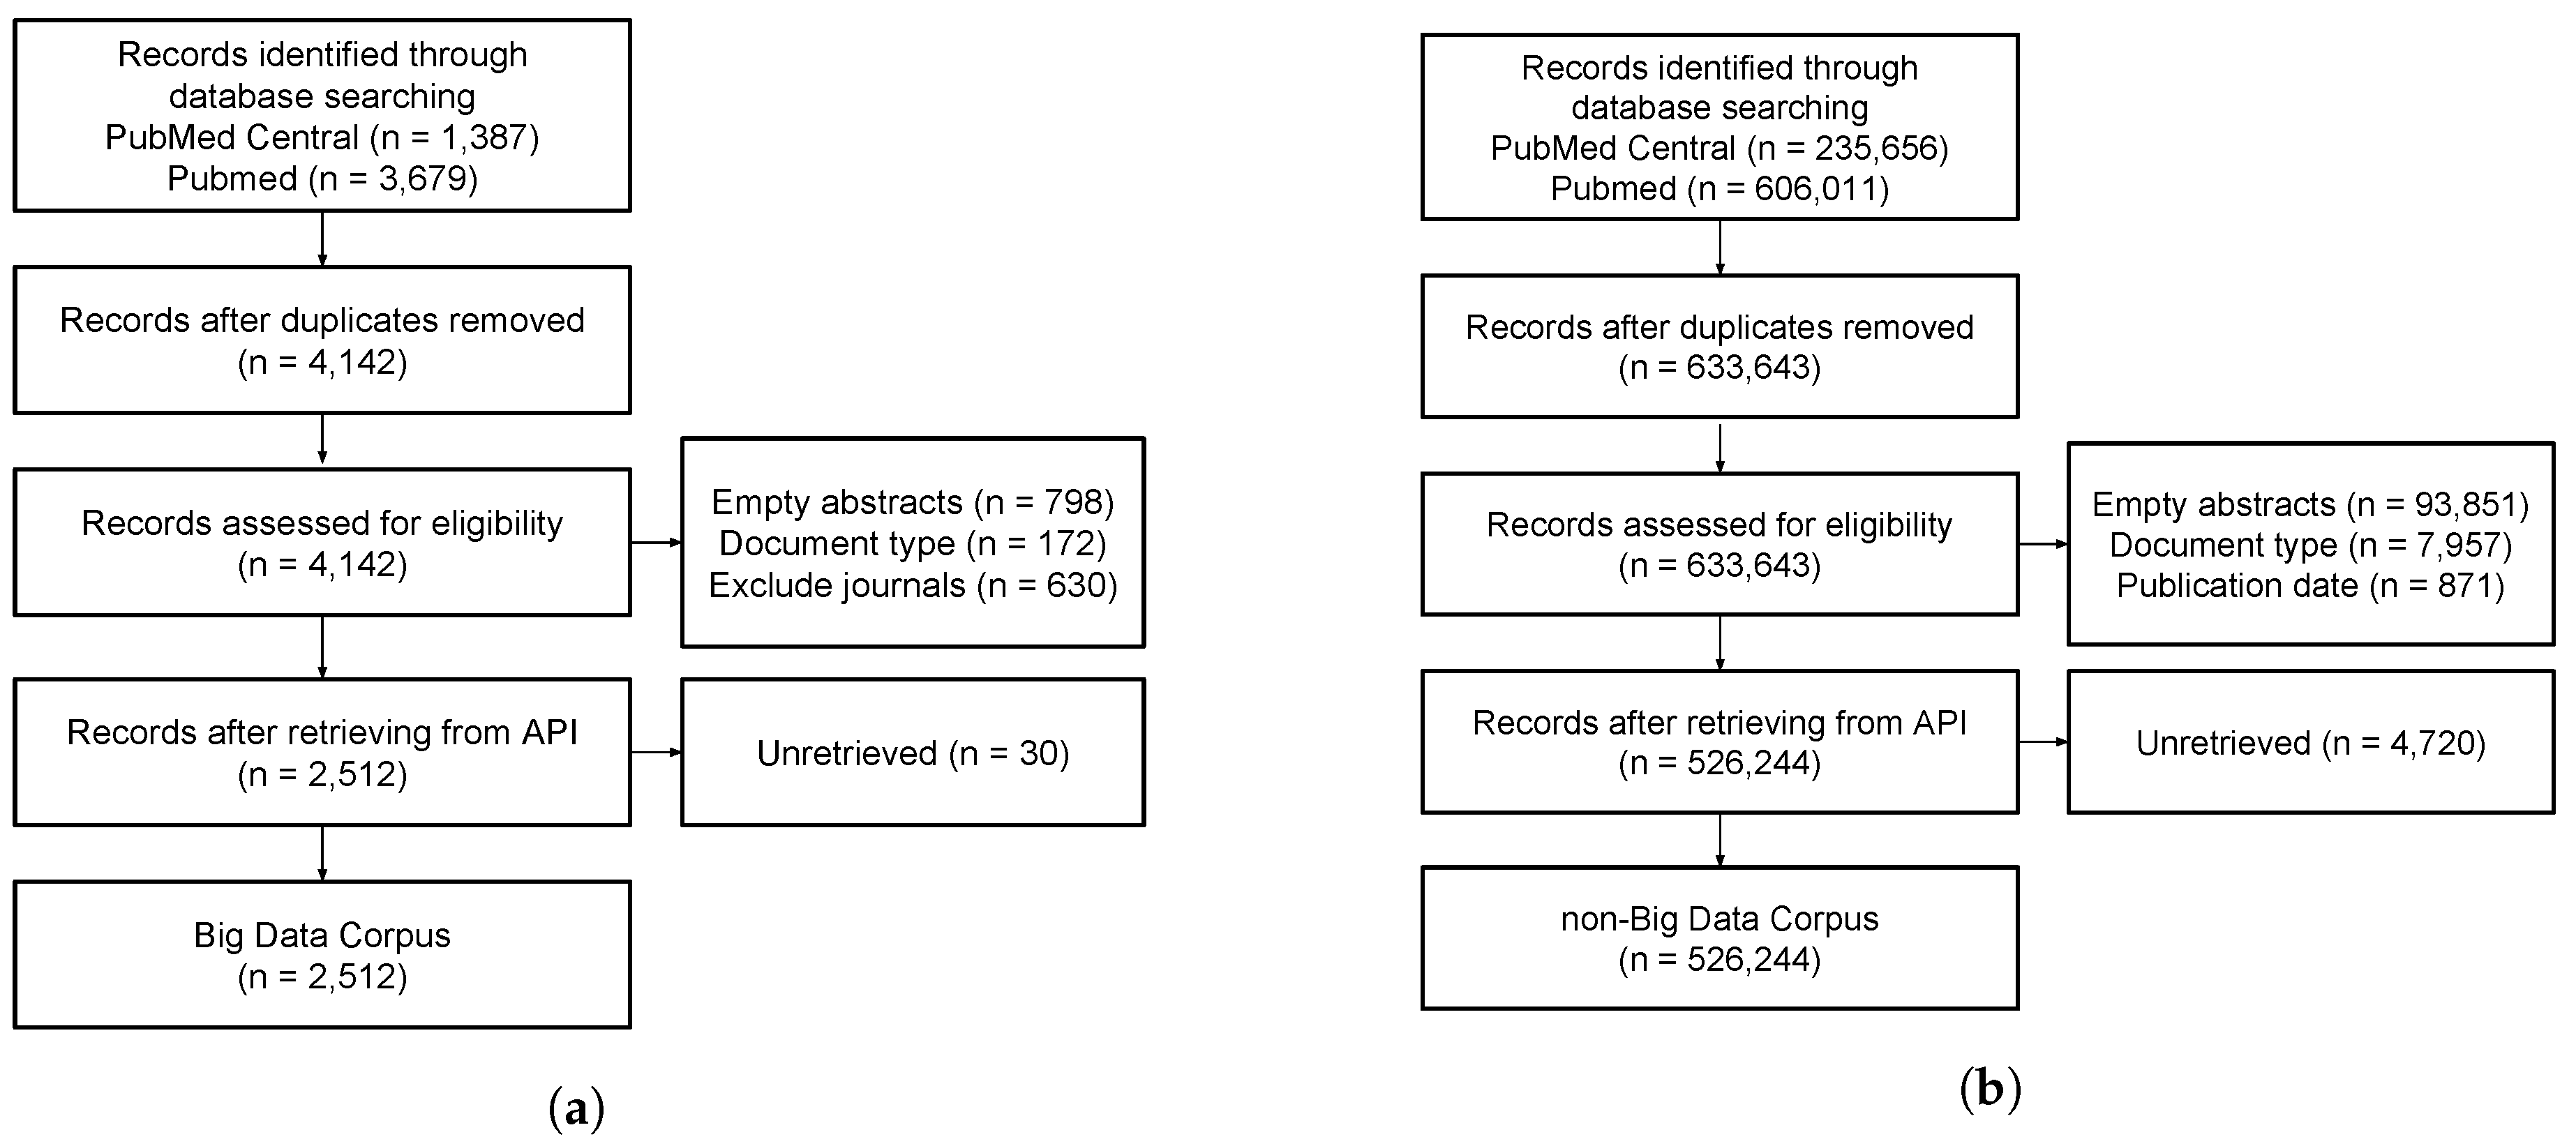
3.1. Corpus Collection

The corpora were obtained through querying and cleaning of BD publications, and then matching these to NBD publications through new querying and cleaning steps. Overviews are shown in Figure 1a,b respectively. The implementation of the methods described in this section can be found on GitHub [24].

3.1.1. BD Corpus

BD documents were collected from PubMed and PubMed Central (PMC) using the Entrez Programming Utilities API [25]. We searched for the literal use of the term “Big Data” in either the title or abstract. The following search queries were used:
  • PubMed (“Big Data”[TIAB] OR (big[TI] AND data’[TI])).
    AND (“2011/01/01”[PDAT]: “3000/12/31”[PDAT]) AND English[Language].
  • PMC (“Big Data”[TI] OR “Big Data”[AB]) AND (“2011/01/01”[PDAT]: “3000/12/31”[PDAT]).
The query did not allow distance between the words ‘big’ and ‘data’ to minimize the number of irrelevant results. For the same reason we limited the search to publications after 2011. Note that 3000/12/31 is the default value that PubMed uses when no limit is given for the end date. We noticed that documents containing the term “Big Data” between single quotes were not returned by the PubMed search, therefore the sub-query (big[TI] AND data’[TI]) was added and the gathering was repeated.
The search used the esearch function of the Entrez API, which yielded 3679 PubMed and 1387 PMC results. With the efetch function the following information was retrieved and stored in a local database: titles, abstracts, and metadata (i.e., publication date, publication type, DOI, journal, journal ISSN, and journal ISO).
An overview of the cleaning process is shown in Figure 1a, and the steps are described in order below.
(1) Some documents had to be removed as they could not be retrieved by the efetch function. (2) Documents with empty abstracts were removed as they did not contain enough data to be useful in the classification. (3) In our previous study [6] we observed that documents such as comments and letters to the editor have different structure and content, therefore documents other than research papers were removed (Full list of removed document types: Addresses, Bibliography, Biography, Book, Clinical Conference, Comment, Congresses, Consensus Development Conference, Consensus Development Conference, NIH, Dataset, Directory, Editorial, Guideline, Interview, Lectures, Letter, News, Published Erratum). The document type was determined with the PublicationTypeList field in the Entrez API output. (4) We observed that not all journals in the corpus primarily covered biomedical research, so these had to be removed manually. All journals with three or more documents in the corpus were inspected by one of the authors (AA), as we assumed that journals with less documents did not have a big impact on the corpus, overall. The titles of the documents were scanned to estimate the research field of the journal, and where the field did not become clear the abstracts were analyzed as well (see Dataset S1 for the complete list of journals). (5) Lastly, any duplicates were removed based on title or DOI.
The search was performed on 13 May 2018 and yielded 5066 documents, and through cleaning 2554 were removed, resulting in a BD corpus of 2512 documents.

3.1.2. Non-Big Data Corpus

NBD documents were collected through the Entrez API similarly to the BD corpus. To make the NBD documents comparable with BD documents, the PubMed and PMC databases were queried for each journal in the BD corpus. Furthermore, the publication date range was set to the minimum and maximum publication year of the BD documents in each journal. For example, the following query would match BD publications between 2012 and 2016 in the journal Nature Communications: “Nature Communications”[Journal] AND (“2015”[PDAT]: “2018”[PDAT]).
An overview of the cleaning process is shown in Figure 1b. The process was similar to the BD corpus cleaning described above, with two differences: (1) no journals had to be removed; (2) some documents were pre-published and had a publication date in the future, so these were removed.
The match was performed on 13 May 2018 and yielded 841,667 documents. Through cleaning 315,423 were removed, resulting in an NBD corpus of 526,244 documents.

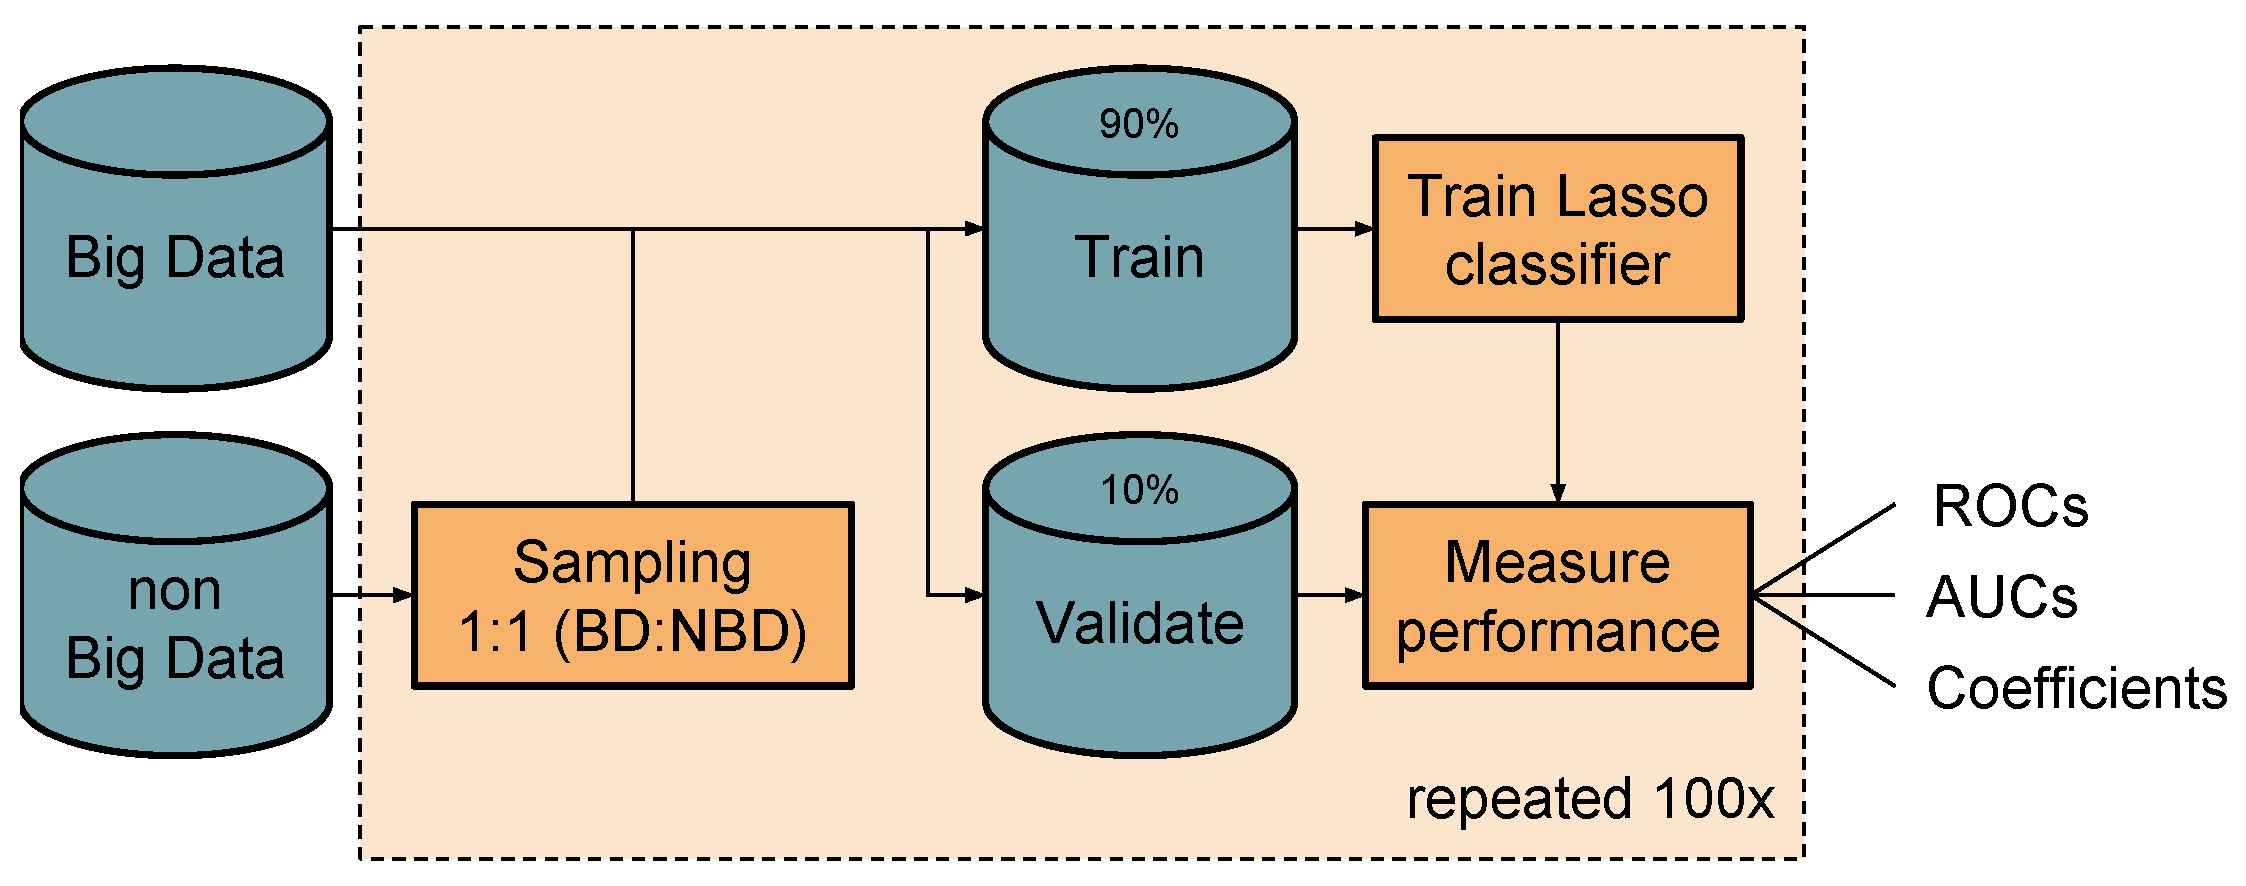
3.2. Dataset Preparation
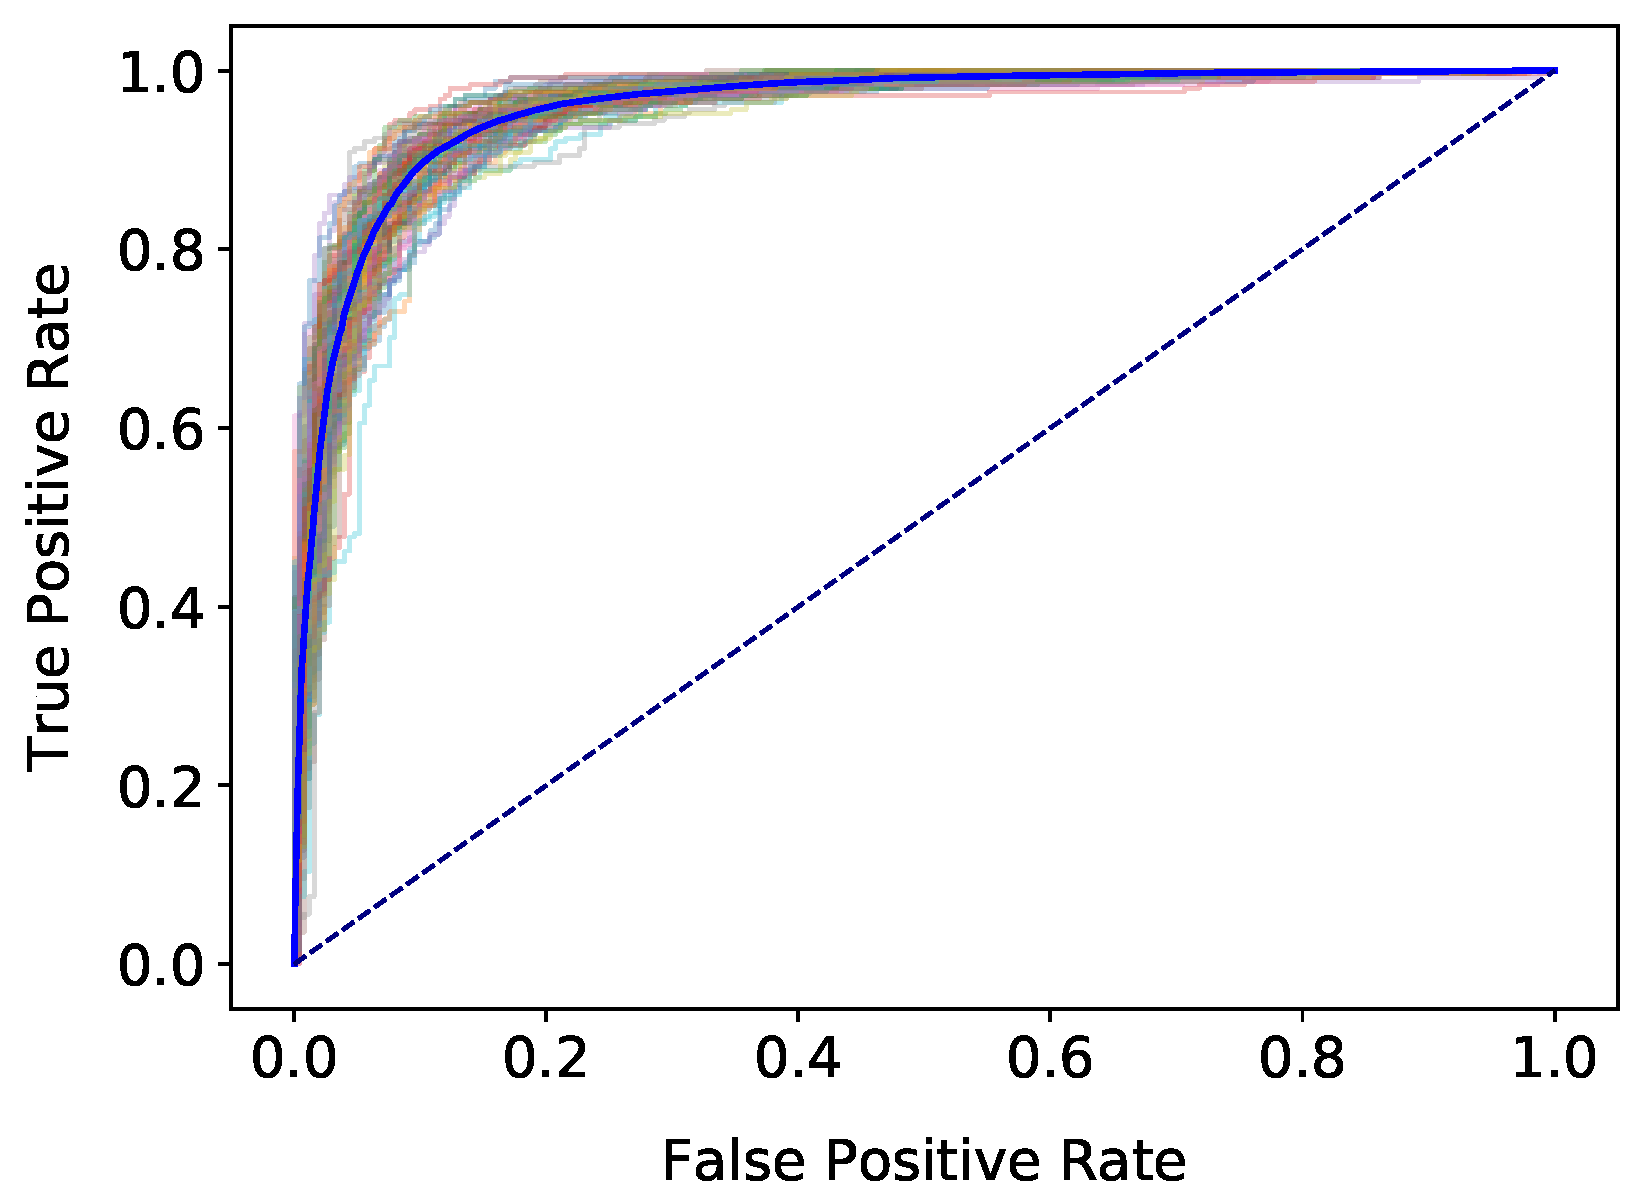
In this section, we describe the preprocessing of the individual documents from the BD and NBD corpora and their characteristics. Furthermore, we describe the sampling of the datasets used as input to the classification method as described in Section 3.3. The implementation of the methods described in this section can be found on GitHub [24].
We cleaned all documents so that they contained only unaccented alphabetical letters. The following items were removed: HTML tags (PubMed data may contain the following tags: <i>, <u>, <b>, <sup>, and <sub>), special characters (e.g., &, %), and numbers. Stopwords were removed using the english list from the NLTK python library [27] in addition to ‘big data’ and ‘big’. Lastly, the documents were tokenized and any too short (<2 characters) or too long (>34 characters) tokens were removed, as they were unlikely to be real words.
The characteristics of the corpora after document cleaning are shown in Table 1. Word clouds of the top-100 most frequent terms in both the BD and NBD corpora are shown in respectively Figure 2a,b. When normalized, the corpora showed a similar trend in documents per year and tokens per document (shown respectively in Table S2 and Figure S3). Please note that the minimum number of tokens in the NBD corpus was zero for both the title and abstract, indicating empty fields. Later inspection showed that this was due to three malformed documents in PubMed (PubMed IDs: 27529366, 27529367, and 27529368).
We sampled datasets so that they consisted of an equal number of BD and NBD documents. The sampling process is shown in Figure 3. For each dataset the whole BD corpus was included and paired with a random sample of the NBD corpus, resulting in sets of 5024 documents. Datasets were split into 90% training and 10% validation data. To cover a larger part of the NBD corpus and test the stability of the classifier, 100 datasets were created. We did not apply a cross validation, as each dataset was randomly sampled from the NBD corpus. While this approach does not guarantee coverage of all NBD documents we assume that the random sampling ensures a fair spread of the variety in the NBD documents.

3.3. Classification

In this section, we describe how the classifiers were trained and how performance measures were calculated. The input to the classifiers were the 100 datasets constructed as described in Section 3.2. Furthermore, we describe how the influence of time (i.e., publication date) was evaluated. The implementation of the methods described in this subsection can be found on GitHub [28].
The process of classification is shown in Figure 3. We implemented a logistic regression with LASSO penalty using the glmnet R package [29,30]. This method was used because of its ability to discard features and limit the size of the final model, thereby identifying the most relevant features.
For each dataset, the training data was used to fit a model with cv.glmnet. A range of lambda values was tested using 10 folds. Predictions and coefficients were extracted using lambda.1se on the validation data. Lambda.1se was chosen instead of lambda.min because it gives the simplest model within one standard error of the minimal misclassification rate, limiting the number of selected features. We extracted the Receiver Operating Characteristic (ROC) curve and Area Under the Curve (AUC) to assess the performance of the classification models. Furthermore, the coefficient values of the selected features were retrieved.

Trend Analysis

To answer research question 3 a stratified analysis by year of publication was performed. We used the BD and NBD corpora, but split them into the following bins: 2011–2014, 2015, 2016, 2017, 2018. Please note that documents from 2011 to 2014 were combined because each year included a relatively small number of documents, which could result in unreliable results. For each bin we sampled 20 datasets with the same approach as described in Section 3.2.
Each dataset was classified using the same process as described in Section 3.3, and additionally a confusion matrix was retrieved. The matrix was used to calculate the False Omission Rate (FOR). This metric was chosen because it reflects the chance of a negatively classified document to be false negative. We hypothesized that over time this metric would increase caused by a dilution of the value of the term Big Data. When the value of ‘Big Data’ becomes diluted, documents without Big Data characteristics might carry the BD label, and be included in our BD corpus. If no BD characteristics are present, the classifier should label them as NBD, resulting in a false negative. This situation is captured by the FOR.

4. Results

The mean AUC over all 100 datasets was 0.96 with a standard deviation of 0.009. ROC curves are shown in Figure 4 and were relatively stable over the 100 datasets. Lastly, we retrieved the frequency of each unique feature. Logistic regression with LASSO penalty creates a model with a subset of the input features, therefore the features may differ between each model. As described above a model was trained for every dataset, we counted the frequency of each unique feature. Then, all features that occurred at least 50 times were used to create a word cloud, which is shown in Figure 5. The results were used to answer research questions 1 and 2.
The outcomes of the analysis are shown in Figure 6 and Figure 7. Please note that the ROC curves and FOR curve do not show trends over time.

5. Discussion

In this study, we set out to answer the question whether and how a corpus of BD documents can be separated from NBD documents published in the biomedical literature. Furthermore, we investigated the distinguishing features and whether the date of publication of a document influences its distinguishability. Below we analyze and discuss the results and limitations concerning the creation of the datasets and classifiers, distinguishing features, and trends over time.

5.1. Corpus, Datasets, and Classification

We created two corpora—BD and NBD—and randomly sampled 100 datasets from them, each with a one-to-one ratio of BD and NBD documents. For each dataset, a classifier was trained, and the classification performance was tested. The generated models have a high performance with an average AUC of 0.96. Analysis of the ROC curves showed that the model performance remains stable over the 100 datasets. These results answer research question 1: a classifier based on bag-of-words approach can reliably and with a high-performance separate BD and NBD documents.

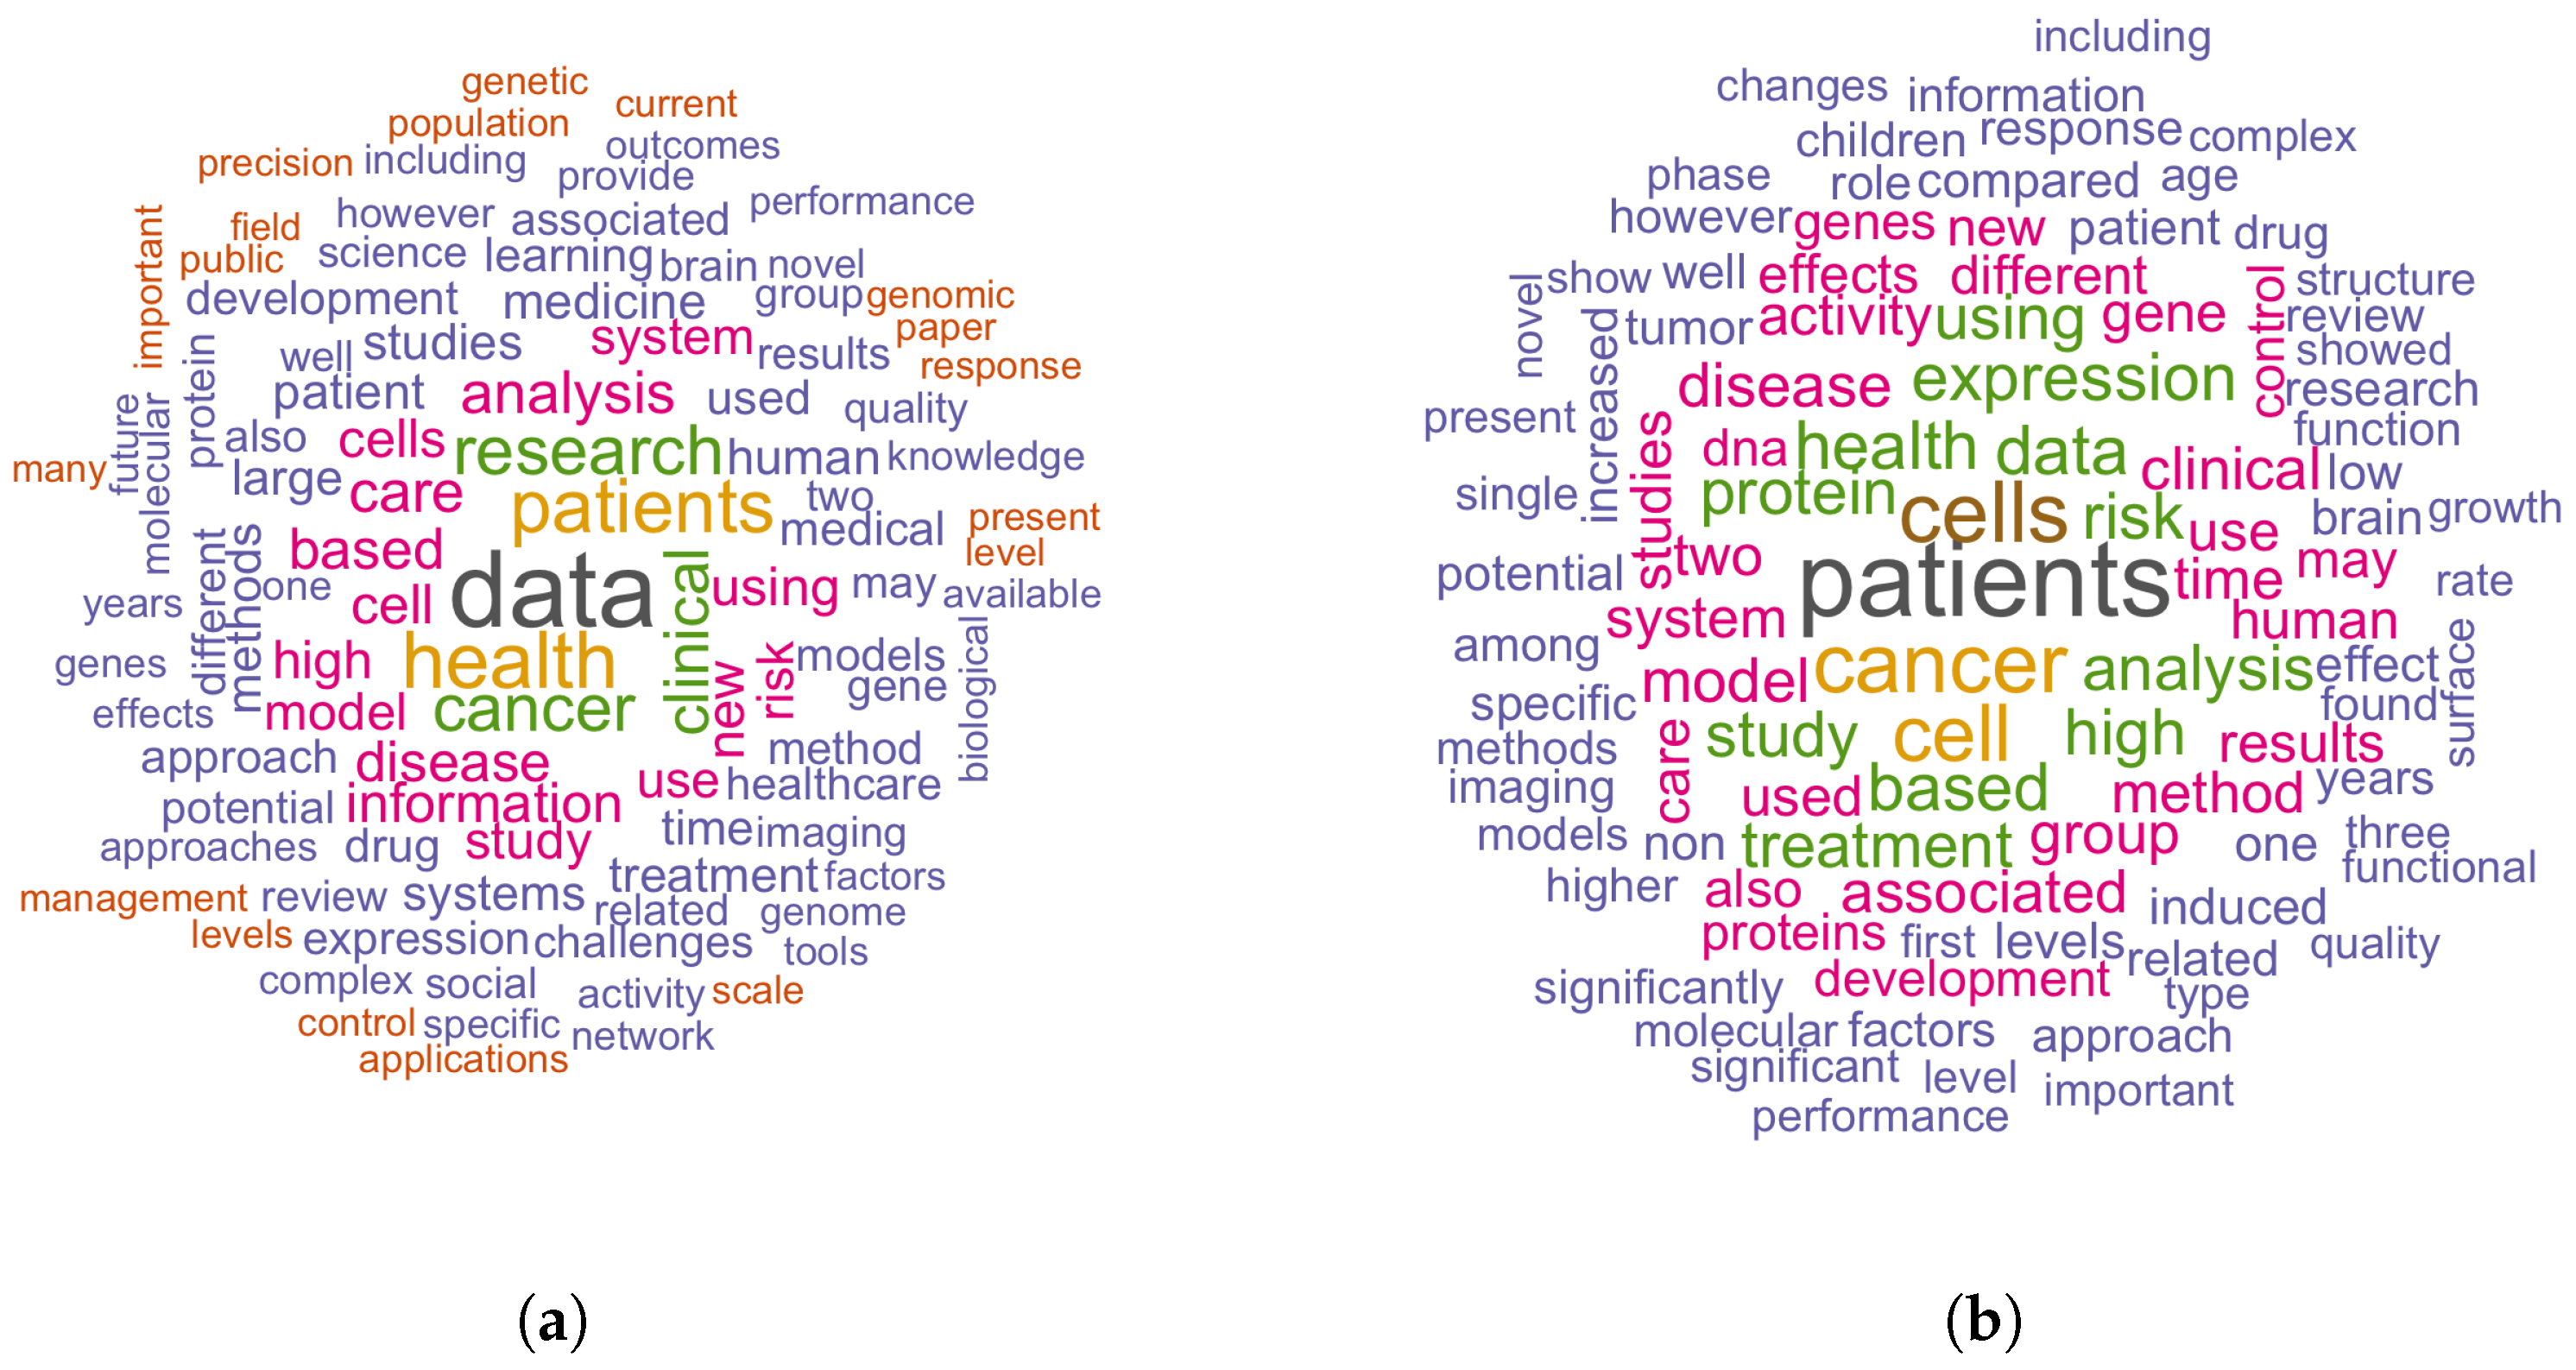
5.2. Distinguishing Features

To give an impression of the BD and NBD corpora two word clouds were created, respectively Figure 2a,b. While the most frequent word (respectively data and patients) differs between the corpora, there is much overlap between the word clouds. Most of the differences may be found in the research fields that are covered. For example, the BD word cloud contains genetic and genome, most likely stemming from the genomics field, which has a high interest in Big Data applications. These insights, however, do not give a complete story about the differences between the BD and NBD corpora. Therefore, research question 2 was answered by extracting the words that were selected as most distinguishing features between the two sets of BD and NBD documents—see Figure 5. We apply below the BD definition proposed by de Mauro et al. [14] to interpret these words.
Under the Information aspect, words such as massive and large are the most noticeable. More interestingly, many words can be associated with Technology and Methods, for example: computational, mining, and machine (possibly from “machine learning”). Value aspects can be identified in words such as future, era, and challenges. Please note that a word such as era, as in “the era of Big Data”, can also be associated with hype. Lastly, there are words that do not fit in the definition as proposed by de Mauro et al., but instead identify a specific research fields such as omics and genomics. These words are related to the areas that tend to handle large datasets.
Please note that other BD word clouds have been published, for example at the Gartner blog [13] and the United Kingdom parliament website [12]. Please note that these word clouds include more words that are associated with the size of data—petabytes, volume, size—as compared to our word cloud in Figure 5. However, many words are similar, therefore supporting our findings.

5.3. Trends Over Time

There is a clear increase in the usage of the term Big Data in biomedical literature over time. Here however our focus is in changes over time regarding distinguishability between papers that use the term and that do not.
In our previous work [6] we found a trend over time in the False Discovery Rate (FDR). This indicated that more papers were incorrectly classified as BD in more recent years. From this we concluded that while BD concepts are still being discussed, researchers used the term Big Data less often in later years, although their content includes BD aspects. In the current study we found no trend for the FDR (data not shown) neither for the FOR. While the current work does not differ in methodology from the previous one, it uses better data. In the study presented here we improved the document searching and sampling approach by restricting the types of included BD documents while increasing the number of matched NBD documents. We believe that the current datasets better represent the published works in biomedical literature that are relevant for this study.
The ROC curves for various time intervals (Figure 7) show no trends in distinguishability. The same conclusion can be drawn for the False Omission Rate (FOR, Figure 6). These results answer research question 3, rejecting our hypothesis that the term Big Data became diluted over time.

5.4. Value of the term Big Data

In Section 2 we showed that there is a wide spectrum of opinions on the value and the definition of the term Big Data. Concerning the definition, our findings show that the term is consistently used to identify a distinct field of research within a biomedical scope. Moreover, the characteristics of this field align with existing formal and informal definitions of the term.
With respect to the value of the term, our findings do not support the opinions that BD is a fad or the ‘new normal’. A fad would die out over time, and a ‘new normal’ would permeate the literature. In both cases one would expect to see less distinguishability as time progresses. However, we did not find such a trend over time, which suggests that these opinions are not valid in the context of biomedical scientific literature.

5.5. Limitations

There were several limitations to our approach. Firstly, we restricted the corpus to biomedical documents, therefore the BD and NBD corpora were collected from two biomedical online libraries, PubMed and PMC. There are other libraries available such as Scopus and Ovid; however, they do not provide a public API, which would make this study impractical.
Another limitation is the use of only titles and abstracts in the analysis, because the full text is not directly available in the used libraries. We assume that the main message of each document is represented in their title and abstract, but it is possible that more complex concepts are only expressed in the full text. PMC contains open-access articles and therefore often, but not always, includes full text in the API results. These would represent only a small portion of the BD corpus and were therefore not used in this study.
To ensure a certain quality in our corpora we had to remove documents, for example because they lacked an abstract. Please note that while some documents had to be discarded due to quality criteria, all eligible BD documents were included in our analysis. The corpus was also restricted on represented journals because we noticed that some journals included in the PubMed or PMC are not specific to biomedical research. We manually curated a list of journals to be removed from the corpus; however, this was non-exhaustive and partly subjective. Therefore, some of the documents included in the corpus might be from other research fields.
Finally, we used all BD documents in each set and matched them with an equal amount of NBD documents. Because there were 2512 BD documents, a theoretical maximum of 251,200 unique NBD could be included. While this is about half of the total amount of NBD documents, we assume that (even considering repeats) the random sampling ensures a fair spread of the variety in the NBD documents. The ROC curves show little variation between the models, supporting this assumption.

6. Conclusions

In this research we investigated the question whether BD literature in the biomedical field can be distinguished from literature that does not use the term. To our best knowledge, this is the first study to analyze this question using quantitative methods in this research field. From our results, we conclude that there is indeed a detectable and stable distinction between BD and NBD documents in the biomedical field. Furthermore, we found no trends over time that indicate a change in the distinguishability between BD and NBD documents. This suggests that the value of the term remains the same, despite its increased usage in the biomedical literature.
The differences between the BD and NBD documents are mostly captured in terms that are associated with Big Data themes previously described by others. Furthermore, the distinguishing features seem to be sensitive to words that indicate data types belonging to certain research fields, such as ‘omics’. These words suggest that certain research fields tend to use the term Big Data in their publications more often. This is probably due to the affinity of some areas of biomedical research with large datasets and computational methods, such as bioinformatics. Therefore, even when taking possible hype into account, the use of the term Big Data within a publication seems to indicate a distinct type of scientific publication in the biomedical field. Recognizing this may help biomedical researchers to identify themselves with this new field, increasing participation in this growing community and taking more benefit from it.

Supplementary Materials

The following are available online at https://www.mdpi.com/2504-2289/3/1/13/s1, Dataset S1: Journal exclusion verdicts, Table S2: Normalized documents per year, Figure S3: Number of tokens distribution over the documents.

Author Contributions

Conceptualization, A.A. and S.D.O.; methodology, A.A., P.D.M., A.H.Z. and S.D.O.; software, A.A.; validation, A.A., P.D.M., A.H.Z. and S.D.O.; formal analysis, A.A. and S.D.O.; investigation, A.A.; resources, A.A.; data curation, A.A.; writing–original draft preparation, A.A. and S.D.O.; writing–review and editing, A.A. and S.D.O.; visualization, A.A.; supervision, A.H.Z. and S.D.O.; project administration, S.D.O.; funding acquisition, S.D.O.

Funding

This research received no external funding

Acknowledgments

This work was carried out on the High-Performance Computing Cloud resources of the Dutch national e-infrastructure with the support of the SURF Foundation.

Conflicts of Interest

The authors declare no conflict of interest.

Abbreviations

The following abbreviations are used in this manuscript:
BDBig Data
NBDnon-Big Data
PMCPubMed Central
ROCReceiver Operating Characteristic
AUCArea Under the Curve
FORFalse Omission Rate
FDRFalse Discovery Rate

References

  1. Tian, X. Big data and knowledge management: A case of déjà vu or back to the future? J. Knowl. Manag. 2017, 21, 113–131. [Google Scholar] [CrossRef]
  2. Mayer-Schönberger, V.; Cukier, K. Big Data: A Revolution that Will Transform how We Live, Work, and Think; Mariner Books: Wilmington, DE, USA, 2013; p. 257. [Google Scholar]
  3. Hahn, A.; Mohanty, S.D.; Manda, P. What’s Hot and What’s Not? - Exploring Trends in Bioinformatics Literature Using Topic Modeling and Keyword Analysis. In Bioinformatics Research and Applications, Proceedings of the 13th International Symposium, ISBRA 2017, Honolulu, HI, USA, 29 May–2 June 2017, Proceedings; Cai, Z., Daescu, O., Li, M., Eds.; Springer International Publishing: Cham, Switzerland, 2017; pp. 279–290. [Google Scholar] [CrossRef]
  4. Weiss, S.; Indurkhya, N.; Zhang, T.; J. Damerau, F. Text Mining: Predictive Methods for Analyzing Unstructured Information; Springer Science & Business Media: Berlin, Germany, 2004. [Google Scholar]
  5. Zhou, H.k.; Yu, H.m.; Hu, R. Topic discovery and evolution in scientific literature based on content and citations. Front. Inf. Technol. Electron. Eng. 2017, 18, 1511–1524. [Google Scholar] [CrossRef]
  6. van Altena, A.J.; Moerland, P.D.; Zwinderman, A.H.; Olabarriaga, S.D. Analysis of the term ‘big data’: Usage in biomedical publications. In Proceedings of the 2017 IEEE International Conference on Big Data (Big Data), Boston, MA, USA, 11–14 December 2017; pp. 1253–1258. [Google Scholar] [CrossRef]
  7. Laney, D. 3D data management: Controlling data volume, velocity and variety. META Group Res. Note 2001, 6, 70. [Google Scholar]
  8. Andreu-Perez, J.; Poon, C.C.; Merrifield, R.D.; Wong, S.T.; Yang, G.Z. Big Data for Health. IEEE J. Biomed. Health Inform. 2015, 19, 1193–1208. [Google Scholar] [CrossRef] [PubMed]
  9. Levi, M. Kleren van de Keizer [The Emperor’s Clothes]. Column, Medisch Contact. 2015. Available online: https://www.medischcontact.nl/opinie/blogs-columns/column/kleren-van-de-keizer-marcel-levi.htm (accessed on 12 March 2018).
  10. Heudecker, N. Big Data Isn’t Obsolete. It’s Normal. 2015. Available online: http://blogs.gartner.com/nick-heudecker/big-data-is-now-normal/ (accessed on 12 March 2018).
  11. Foo, A. Face It, Big Data Is the New Normal. 2013. Available online: http://www.ibmbigdatahub.com/blog/face-it-big-data-new-normal (accessed on 12 March 2018).
  12. Anon. Big Data Series. 2014. Available online: https://www.parliament.uk/mps-lords-and-offices/offices/bicameral/post/work-programme/big-data/ (accessed on 12 March 2018).
  13. Laney, D. Big Data’s 10 Biggest Vision and Strategy Questions. 2015. Available online: http://blogs.gartner.com/doug-laney/big-datas-10-biggest-vision-and-strategy-questions/ (accessed on 12 March 2018).
  14. De Mauro, A.; Greco, M.; Grimaldi, M. A formal definition of Big Data based on its essential features. Libr. Rev. 2016, 65, 122–135. [Google Scholar] [CrossRef]
  15. Ward, J.S.; Barker, A. Undefined By Data: A Survey of Big Data Definitions. arXiv, 2013; arXiv:1309.5821. [Google Scholar]
  16. Gandomi, A.; Haider, M. Beyond the hype: Big data concepts, methods, and analytics. Int. J. Inf. Manag. 2015, 35, 137–144. [Google Scholar] [CrossRef]
  17. Kudva, S.; Ye, X. Smart Cities, Big Data, and Sustainability Union. Big Data Cognit. Comput. 2017, 1. [Google Scholar] [CrossRef]
  18. Wolfert, S.; Ge, L.; Verdouw, C.; Bogaardt, M.J. Big Data in Smart Farming—A review. Agric. Syst. 2017, 153, 69–80. [Google Scholar] [CrossRef]
  19. Hashem, I.A.T.; Yaqoob, I.; Anuar, N.B.; Mokhtar, S.; Gani, A.; Khan, S.U. The rise of “big data” on cloud computing: Review and open research issues. Inf. Syst. 2015, 47, 98–115. [Google Scholar] [CrossRef]
  20. Hansmann, T.; Niemeyer, P. Big Data—Characterizing an Emerging Research Field Using Topic Models. In Proceedings of the 2014 IEEE/WIC/ACM International Joint Conferences on Web Intelligence (WI) and Intelligent Agent Technologies (IAT), Warsaw, Poland, 11–14 August 2014; IEEE Computer Society: Washington, DC, USA, 2014; Volume 1, pp. 43–51. [Google Scholar]
  21. van Altena, A.J.; Moerland, P.D.; Zwinderman, A.H.; Olabarriaga, S.D. Understanding big data themes from scientific biomedical literature through topic modeling. J. Big Data 2016, 3, 23. [Google Scholar] [CrossRef]
  22. Kitchin, R. Big data and human geography: Opportunities, challenges and risks. Dialogues Hum. Geogr. 2013, 3, 262–267. [Google Scholar] [CrossRef]
  23. Kitchin, R.; McArdle, G. What makes Big Data, Big Data? Exploring the ontological characteristics of 26 datasets. Big Data Soc. 2016, 3, 2053951716631130. [Google Scholar] [CrossRef]
  24. van Altena, A.J. AMCeScience/python-miner-pub. 2019. Available online: https://github.com/AMCeScience/python-miner-pub/ (accessed on 4 February 2019).
  25. Bethesda (MD): National Center for Biotechnology Information (US). Entrez Programming Utilities Help. 2010. Available online: https://www.ncbi.nlm.nih.gov/books/NBK25501/ (accessed on 18 May 2018).
  26. Moher, D.; Liberati, A.; Tetzlaff, J.; Altman, D.G. Preferred Reporting Items for Systematic Reviews and Meta-Analyses: The PRISMA Statement. J. Clin. Epidemiol. 2009, 62, 1006–1012. [Google Scholar] [CrossRef] [PubMed]
  27. Loper, E.; Bird, S. NLTK: The Natural Language Toolkit. In Proceedings of the ACL Workshop on Effective Tools and Methodologies for Teaching Natural Language Processing and Computational Linguistics, Philadelphia, PA, USA, 7 July 2002; Association for Computational Linguistics: Philadelphia, PA, USA, 2002. [Google Scholar]
  28. Van Altena, A.J. AMCeScience/R-contrast-pub. 2019. Available online: https://github.com/AMCeScience/R-contrast-pub/ (accessed on 4 February 2019).
  29. Friedman, J.; Hastie, T.; Tibshirani, R. Regularization Paths for Generalized Linear Models via Coordinate Descent. J. Stat. Softw. 2010, 33, 1–22. [Google Scholar] [CrossRef] [PubMed]
  30. R Core Team. R: A Language and Environment for Statistical Computing; R Foundation for Statistical Computing: Vienna, Austria, 2015. [Google Scholar]
Figure 1. Respectively the results of the search, fetch, and cleaning of: (a) the BD corpus; and (b) the non-Big Data corpus. Diagram has been adapted from the PRISMA guideline [26] to fit our use case.
Bdcc 03 00013 g001
Figure 2. Word cloud of the: (a) BD corpus and (b) non-Big Data corpus. The top-100 words are shown, their size is proportional to their frequency in the respective corpus.
Bdcc 03 00013 g002
Figure 3. Pipeline from sampling the data to training the models and retrieving performance metrics.
Bdcc 03 00013 g003
Figure 4. ROC curves for all 100 datasets with average curve highlighted (blue).
Bdcc 03 00013 g004
Figure 5. Word cloud of the selected features for all 100 datasets. Their size is proportional to the number of times they were selected.
Bdcc 03 00013 g005
Figure 6. False Omission Rate over time, each year consists of 20 datasets, the mean and standard deviation are plotted.
Bdcc 03 00013 g006
Figure 7. ROC curve for each period of time. Each period of time consists of 20 datasets, the mean curve is plotted.
Bdcc 03 00013 g007
Table 1. Characteristics of the corpora after cleaning. *: mean [minimum–maximum]. Docs: Documents. Please note that 2018 only covers 1 January 2018 to 13 May 2018.
BDnon-Big Data
# docs2512526,244
# journals11891144
# docs per journal *2 [1–73]460 [1–10,298]
# docs per year
20115839
2012185668
201310023,825
201427153,307
201541187,220
2016631134,876
2017728175,590
201834844,919
# tokens
all *133 [13–516]139 [0–1210]
title *9 [1–28]10 [0–57]
abstract *125 [10–511]129 [0–1205]
# unique tokens
all *94 [12–287]91 [0–425]
title *9 [1–24]10 [0–48]
abstract *92 [10–287]89 [0–424]

