3.1. Flow Characteristics
Consistent with the literature, the operating point of the valve is defined by the
opening ratio (
), representing the absolute valve lift
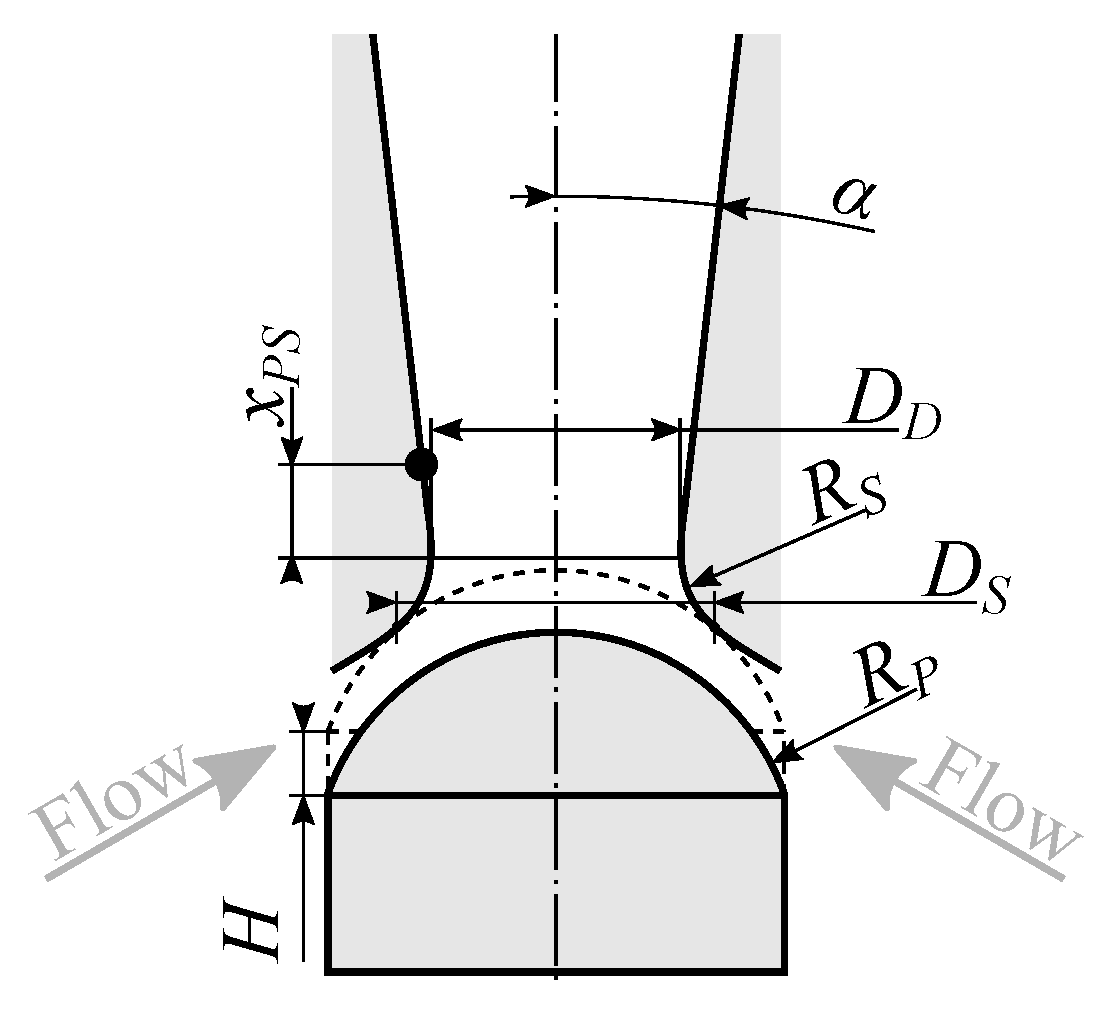
H normalized by the reference diameter
, and the
pressure ratio (
), defined by the ratio of the outlet static pressure, here specifically the ambient pressure
in the test facility, to the inlet total pressure
. At the test rig, arbitrary combinations of
and
can be investigated, and for all geometries flow characteristics were derived, provided in
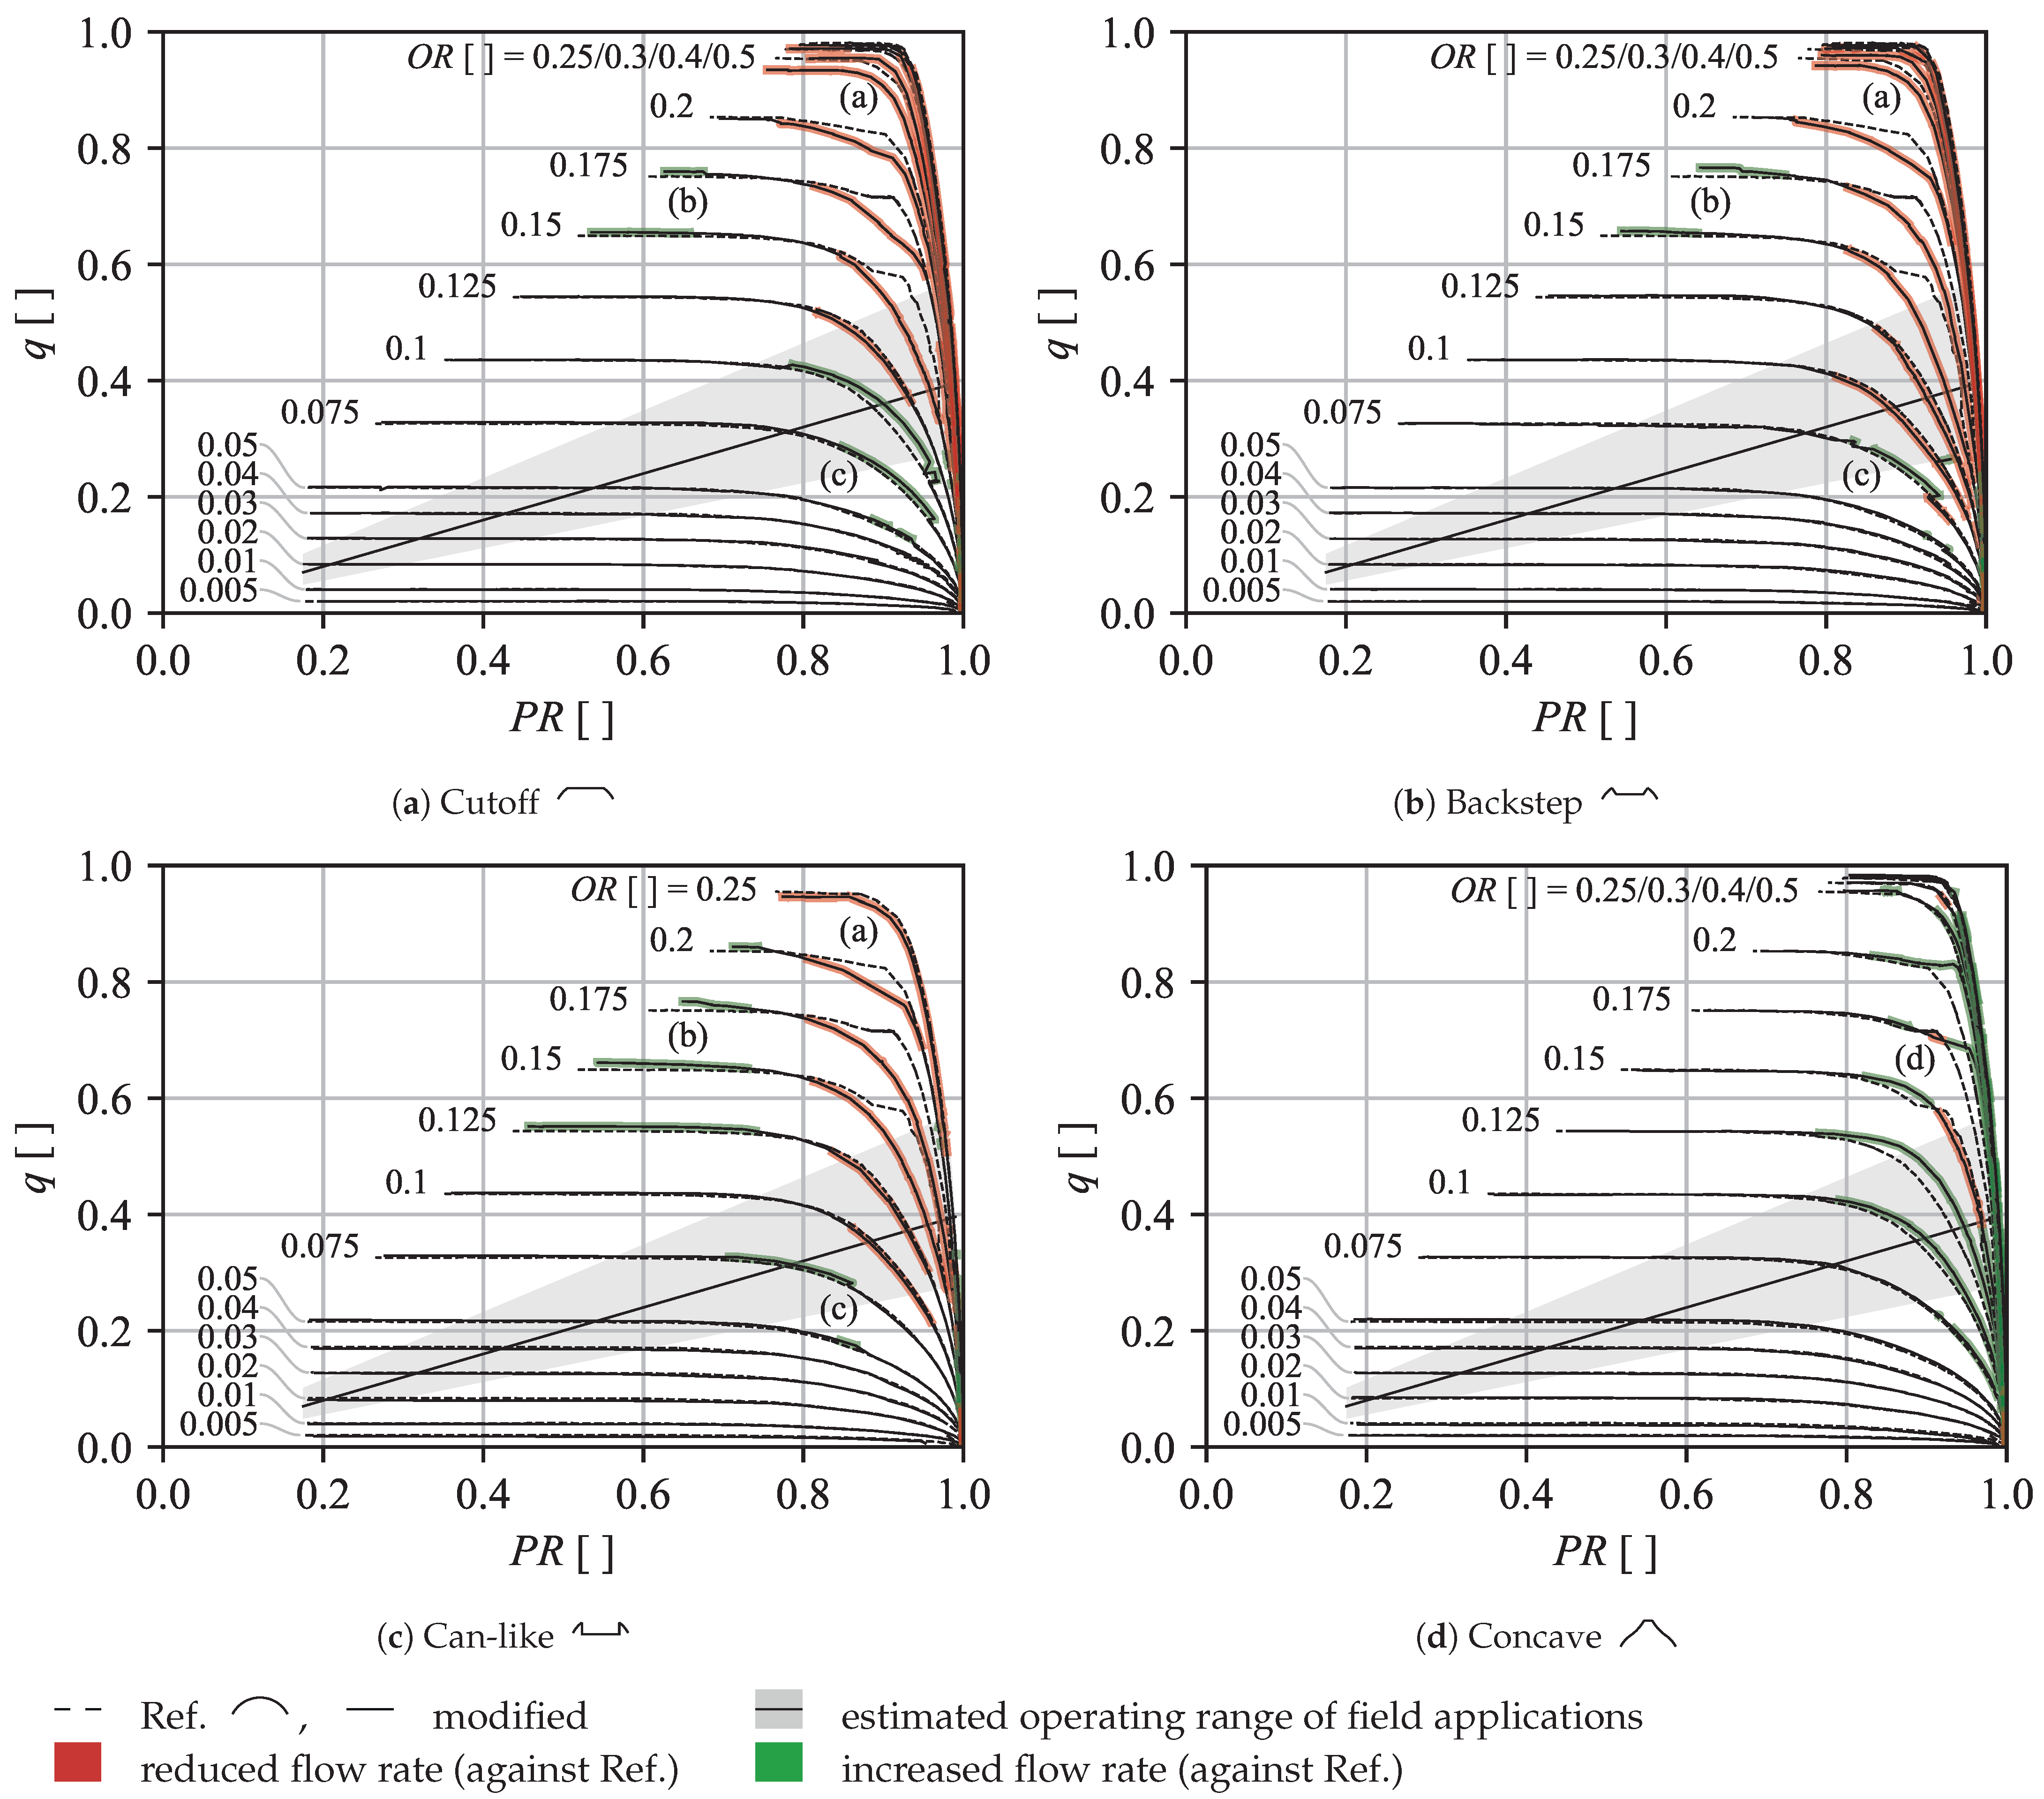
Figure 3.
The presented flow characteristics were recorded at constant opening ratios and variable (increasing) inlet pressures against the constant (ambient) back pressure and are provided as reduced flow rates
, defined as
Normalized by
, the theoretical maximum for
(assuming constant specific heat and ideal gas behavior) calculated as
values of
q can range from 0 to 1. For the presented trends, a correction for pressure driven deformations proportional to the inlet gauge pressure in the form of
was applied, as the pressure load causes a deformation of the valve chest in the magnitude of tenth of
.
In all sub-figures, solid lines compare the flow rate of the modified geometries against the spherical shape (dashed lines). For better visibility, regions of significant deviations against the reference case are highlighted in red (reduction) or green (increase).
Unlike experimental conditions, field operation is typically constrained to an operating line by the downstream turbine. The diagonal solid line represents such an operating line, along with the grey area indicating the expected range of possible operating lines, both assuming choked inlet conditions at the fictive downstream turbine. Operating lines with a steeper slope result in higher pressure losses at full load but allow smaller valves for the same (absolute) flow rate. The acceptable pressure loss of (geometrically) open valves at the design point is estimated to be in the order of 1% (solid line), and the bounds of the shaded area represent full load pressure losses of 2% to 0.5% (values also apply to other figures).
For increasing opening ratios, the maximum normalized flow rates in
Figure 3 approach the ideal value of 1. Even though, for openings above
, the valve is geometrically fully opened, the effective flow path is slightly reduced by boundary layers and detachments, resulting in a further increase as the valve is opened beyond the point at which
.
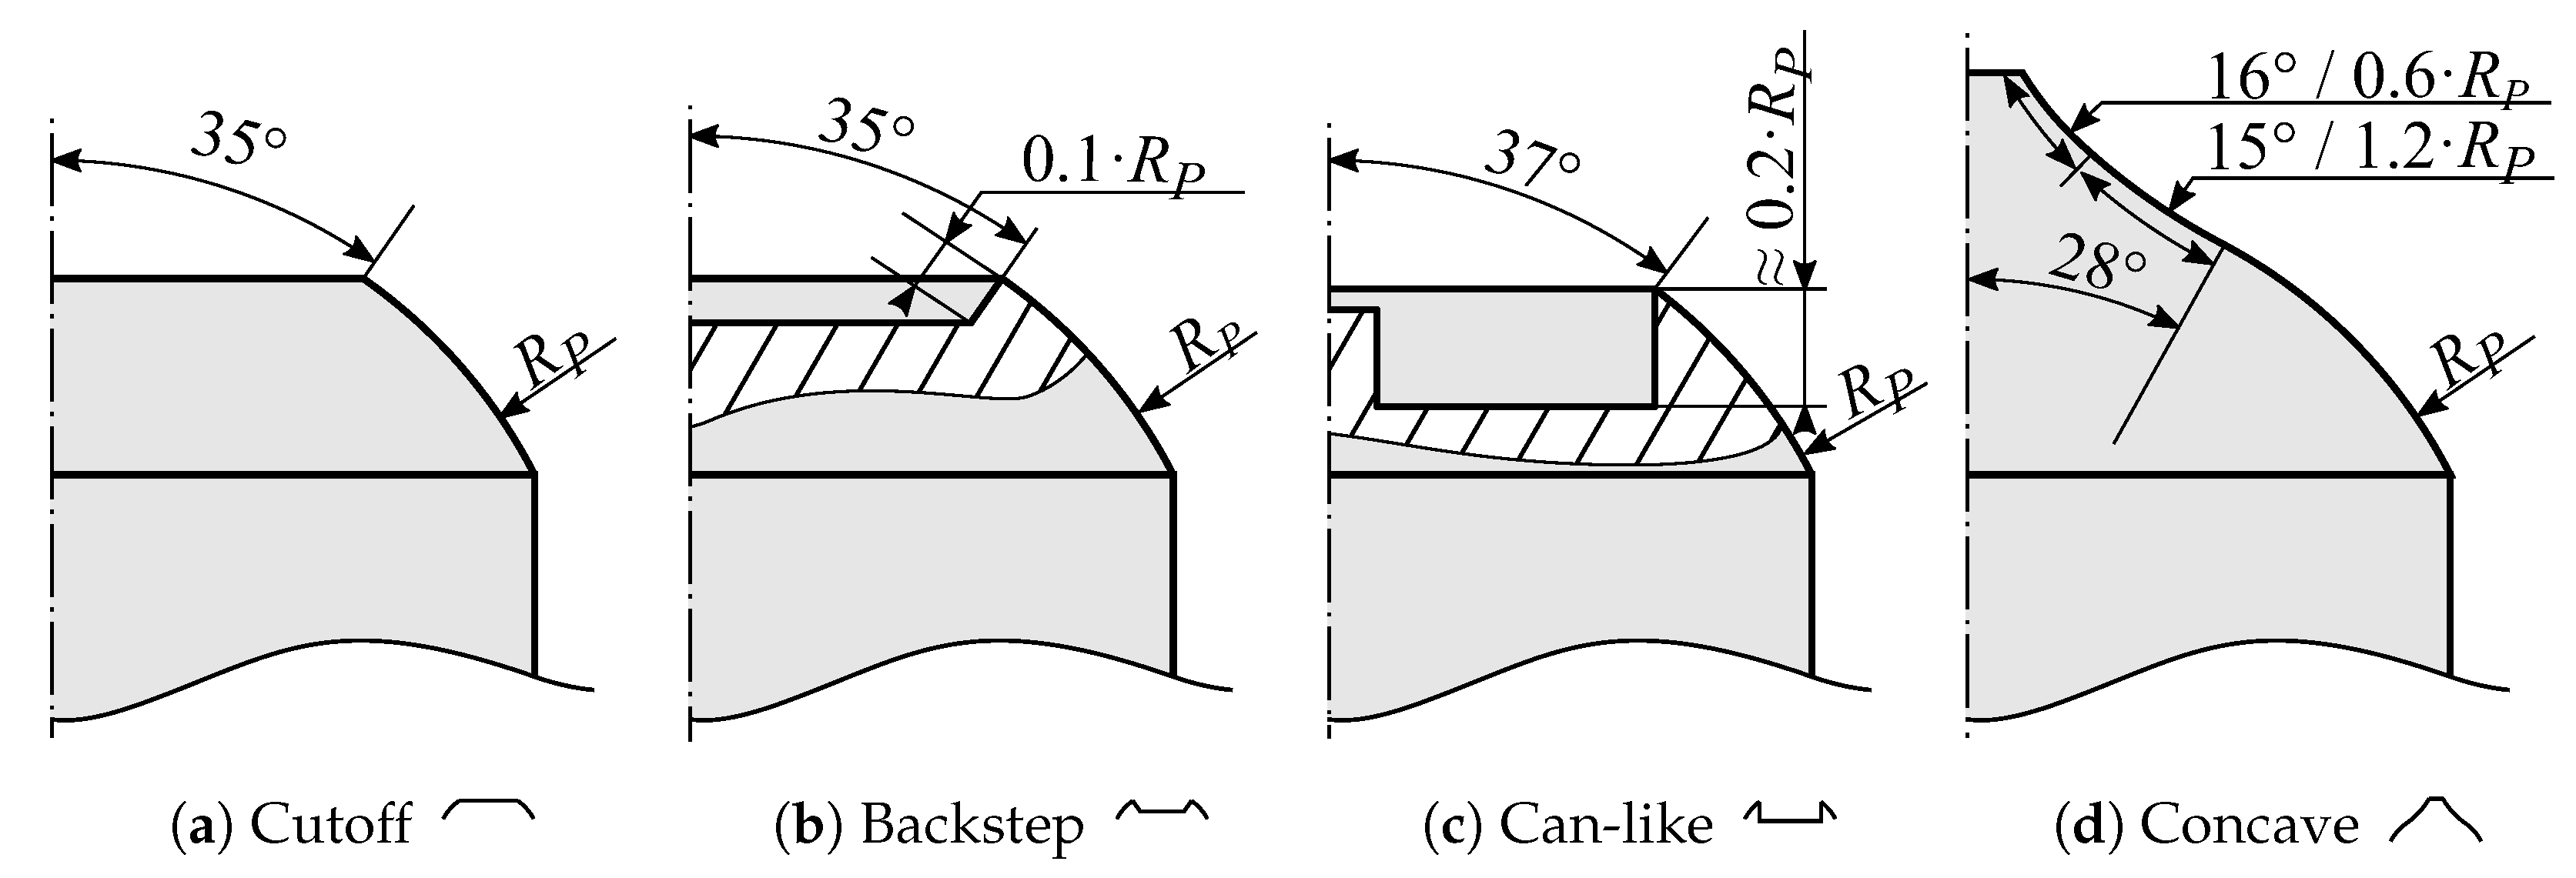
Comparing the effect of the modifications with separation edges in
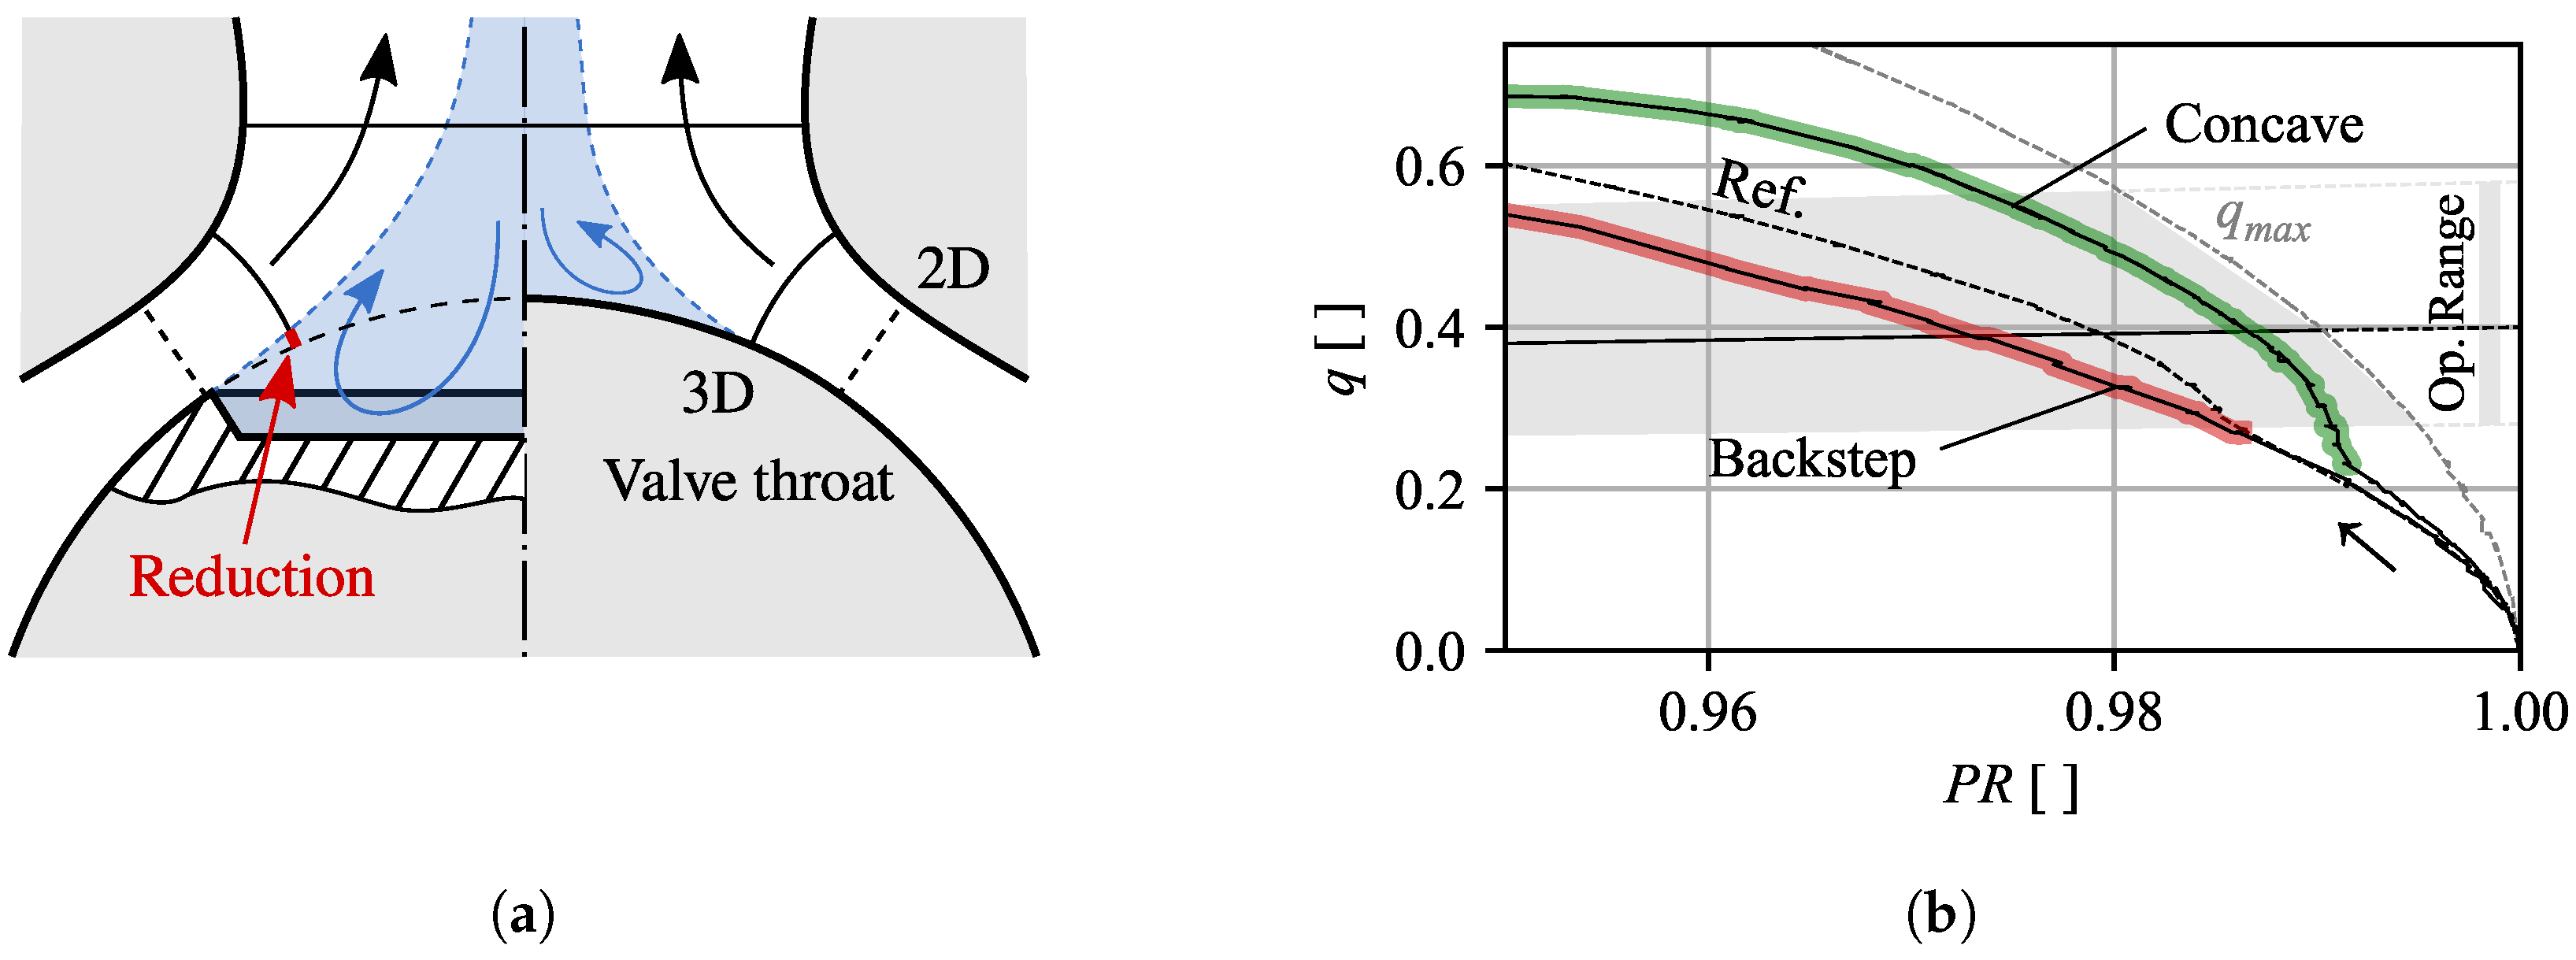
Figure 3a–c, a significant reduction in the flow rate is observed in region (a) at large opening and pressure ratios. At large pressure ratios, this region partly extends into the estimated operating range. It is expected that this reduction is a direct result of the desired flow separation, further discussed in
Figure 4.
As visualized for the spherical and
Backstep geometry in
Figure 4a, the position of the smallest flow section of the three-dimensional (3D) geometry does not align with the tightest gap between valve head and seat (2D). As the flow passes the gap, the downstream flow section is further reduced as the radial distance to the valves center line decreases, even though the cross section suggests a diverging flow path. For larger valve openings, this effect is enhanced; as a result, the actual throttle area for the reference design moves past the location of the separation edge, as sketched for the
Backstep geometry (left side of
Figure 4a). Assuming that the flow direction remains unchanged during separation, the introduction of the separation edge therefore reduces the effective valve throat in comparison to the spherical shape and results in significantly reduced flow rates previously observed in region (a) in
Figure 3a–c. Based on this finding, the
Concave geometry was designed to maintain or improve the initial flow rate by reshaping the valve head to follow the boundary of the assumed recirculation area of the spherical valve (dashed blue line in
Figure 4a). The result is clearly visible in region (d) in
Figure 3d and shows that subsonic flow rates are in part significantly increased compared to the reference (and other) geometries, while maximum (choked) flow rates are maintained.
Figure 4b demonstrates the increase more clearly by a detailed view of
for the
Backstep and
Concave geometries. In the range of
to
, the flow rate is increased by roughly 50% compared to the
Backstep and even 20–30% compared to the spherical shape, indicating a delayed detachment from the valve head.
To a smaller extent, the improved flow rate can also be observed for smaller and larger opening ratios, even for geometric openings at above 100% (
Figure 3d). While a reduced flow rate at throttled conditions can be compensated by a larger valve opening (constrained by the operating line), the reduced flow rate by the separation edge at maximum opening can possibly not be compensated. Based on the measurements, the
Concave geometry is expected to provide reduced full load pressure losses compared to the spherical shape, while a slight increase is expected for the other modifications.
Also linked to the separation edge, an inverse behavior is observed in region (b) in
Figure 3a–c. At supersonic flow conditions below
, an under-expanded flow condition is expected at the separation edge, resulting in an expansion of the flow into the former recirculation zone. In contrast to the reduced flow section discussed in
Figure 4a, the expansion is expected to increase the effective throat and thus slightly increasing the flow rate. Because this region is far outside the expected range of field applications, it is not further discussed within this paper.
3.2. The Occurrence of Annular Flow Regimes at Throttled Valve Operation
In
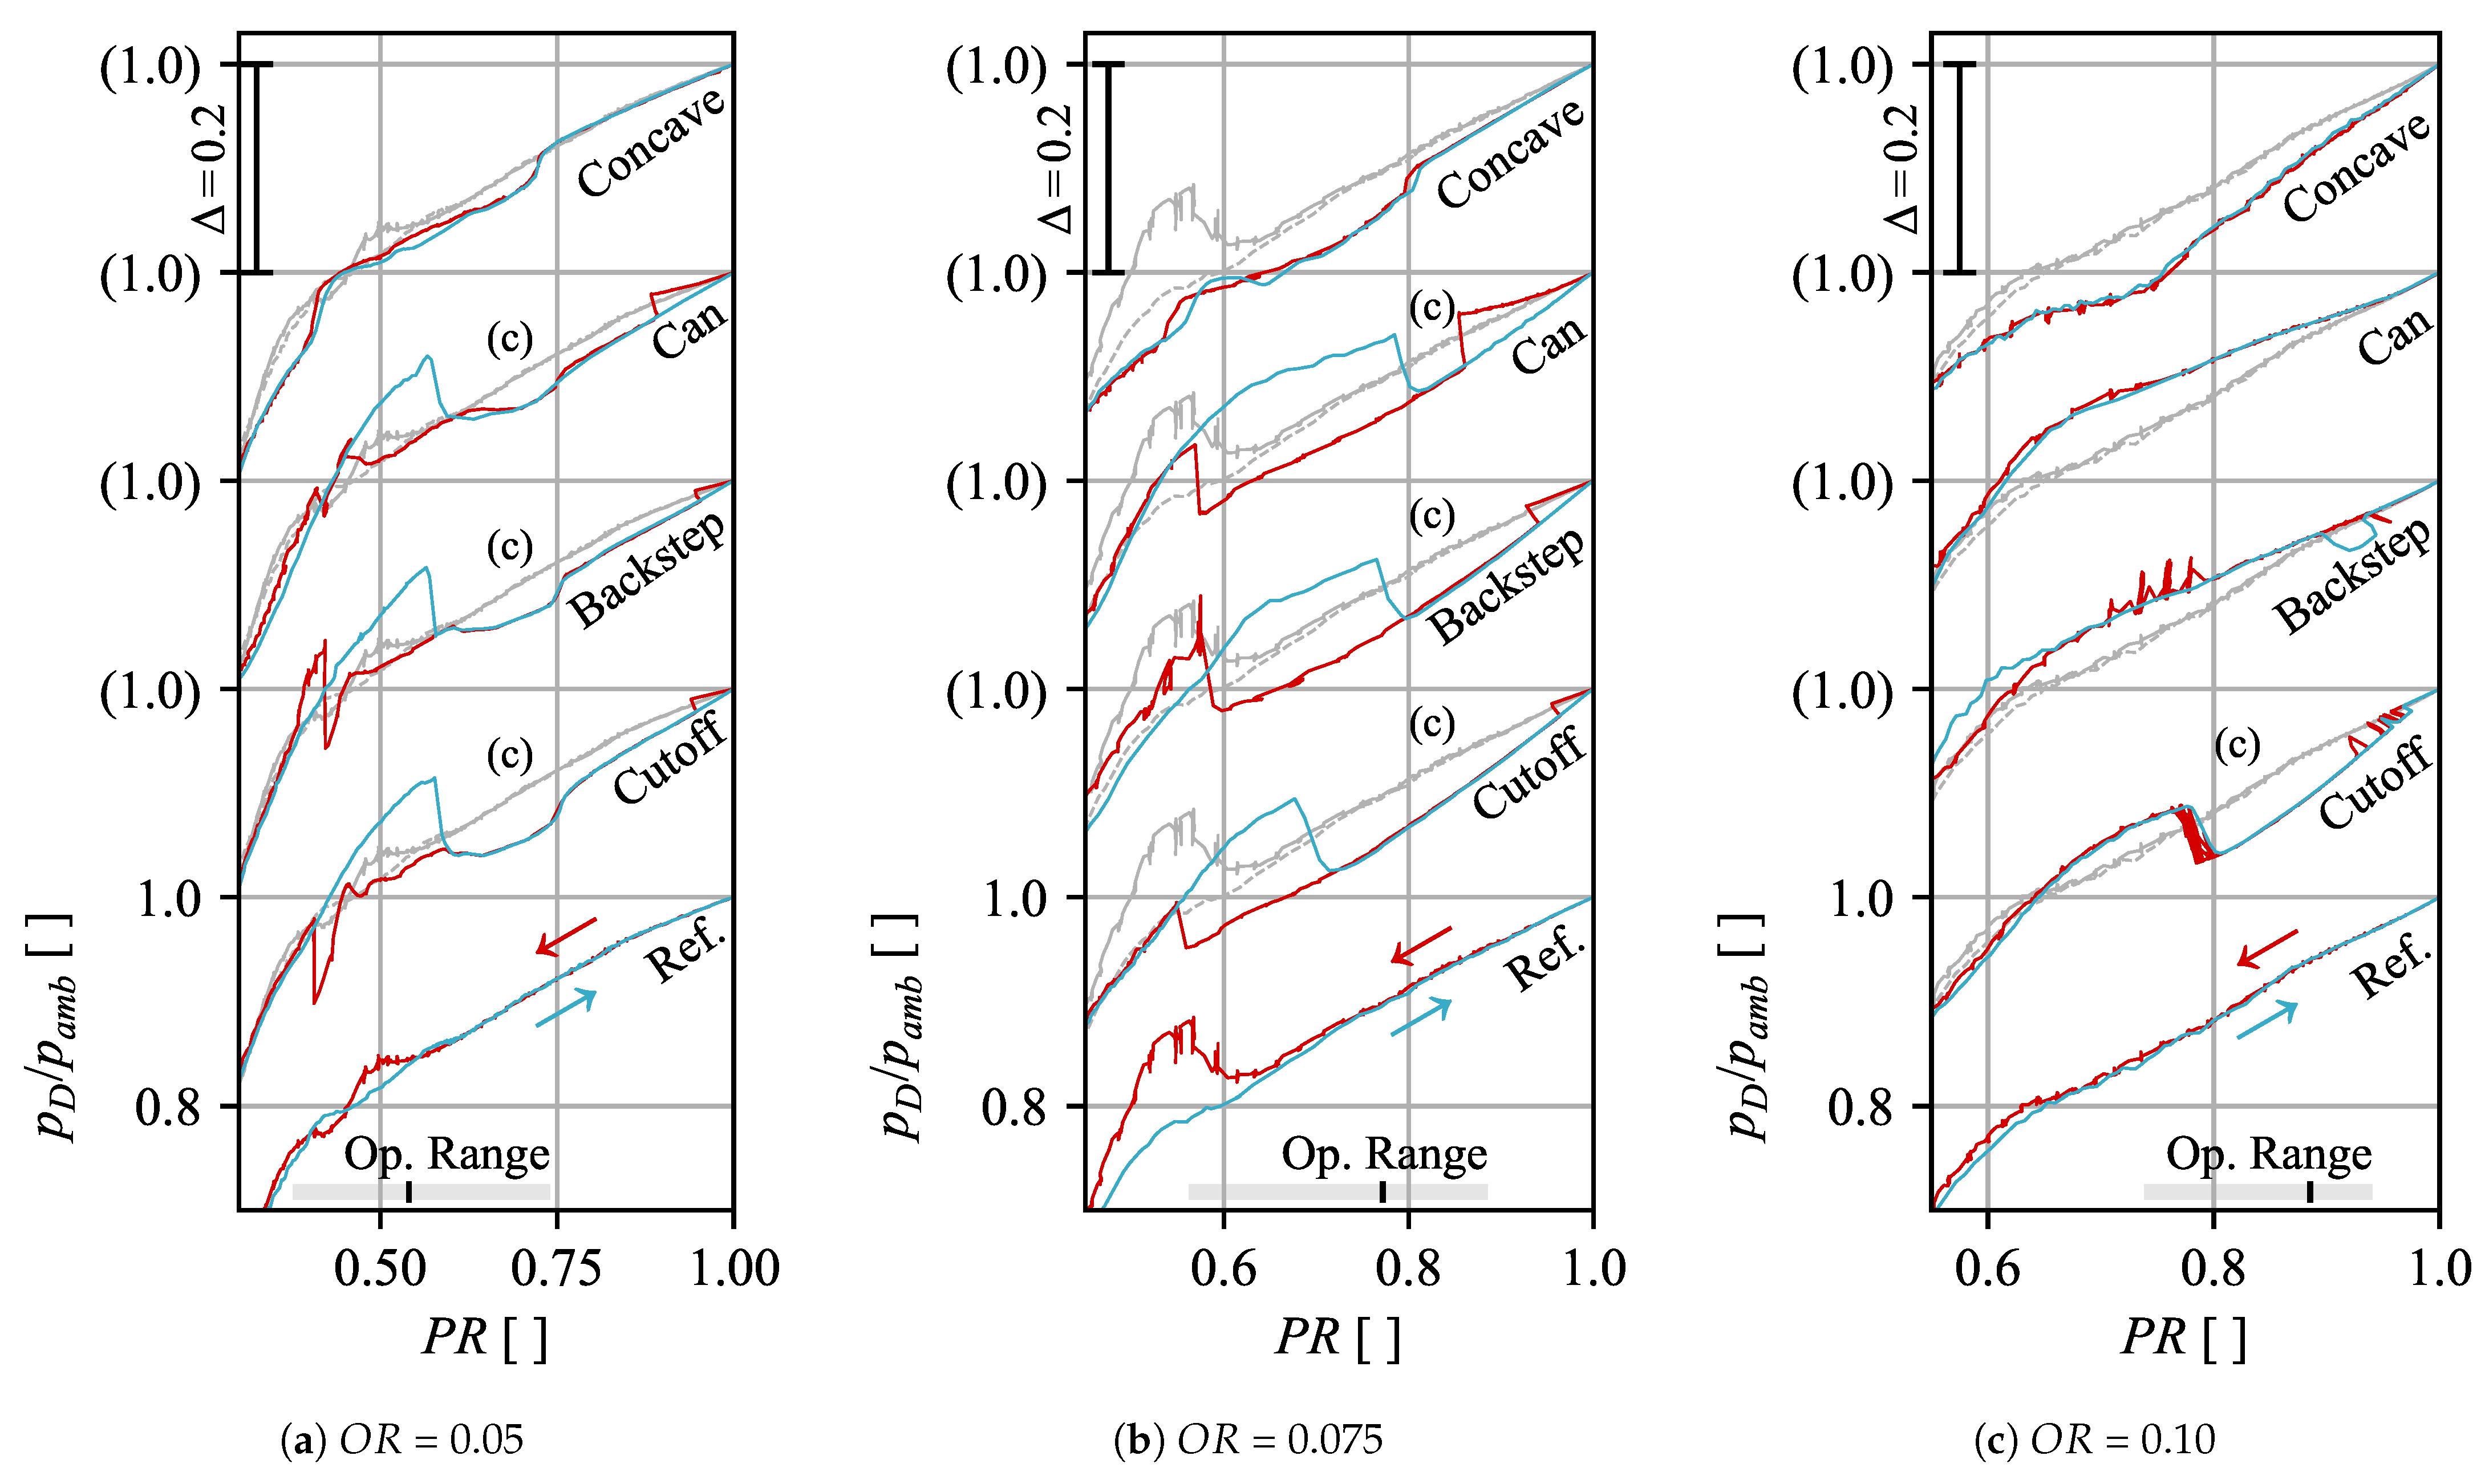
Figure 3a–c, a third region (c) is characterized by a spontaneous increase of the flow rate for opening ratios of 0.05 to 0.1 in the range of the expected part load operation. For better visibility, a detailed view of the flow rate at
is provided in
Figure 5 for the
Cutoff geometry along with pneumatic wall pressure trends (sensor position in
Figure 5c,d).
As the pressure ratio in
Figure 5a is reduced and approaches
, a sudden jump onto a separate (higher) flow characteristic is observed. Simultaneously, the corresponding pneumatic pressure measurement (the red curve in
Figure 5b) shows a significant drop in the wall pressure.
In
Figure 5b (and later
Figure 6), the red curves were recorded at decreasing
and correspond to the flow characteristics. Due to the settling time of the flow and temperature measurements, and to prevent transients within time-resolving pressure measurements, these measurements include hold times (as partly visible in the red unfiltered pressure trends in
Figure 6). The blue curves in turn were derived after the actual measurements during the de-pressurization of the test rig (increasing
) at continuous and faster pressure gradients. While flow measurements during the de-pressurization become invalid due to a lag, pressure measurements respond quicker and allow an additional comparison in the reverse direction. Because the de-pressurization was limited by maximum pressure gradients of instrumentation, a quasi-steady state with respect to the valve’s operating point is still assumed due to the high velocities, despite the faster rate.
Consistent with the flow rate, the actual measurement (red, decreasing
) and the de-pressurization of the test rig (blue, increasing
) clearly follow two distinct pressure branches, suggesting two different and temporal stable flow regimes. Based on measurements and supported by CFD, the lower branch can be linked to the desired annular flow (
Figure 5d). At this time, the investigated wall pressure sensor is exposed to a high velocity flow adjacent to the diffuser wall, which results in low pressure readings. The upper branch on the other hand corresponds to detached flow conditions (
Figure 5c), where the sensor is exposed to the higher pressure inside the recirculation zone.
The same behavior was also found for the
Backstep and
Can-like geometries as shown in
Figure 6 for opening ratios of
,
, and
. In all three cases with separation edges (curves are vertically shifted by an offset of
), the two distinct flow regimes are observed for
and
with different extents. At
, only the
Cutoff and
Backstep shape were able to trigger the annular flow, which only for the first geometry is stable over a wider range.
For all three modifications with a separation edge, a region of the annular flow regime, which is independent of the direction of pressure change, can be identified. Where applicable, it is marked with (c) in
Figure 6 and corresponds to the range marked with a black solid line and labeled
fully stable in
Figure 5b (
Cutoff,
). In case of the obtuse edge (
Cutoff), this range is significantly stretched compared to the sharp-edged
Can-like geometry. In most cases, the range of the stable annular flow pattern is bounded by two hysteresis regions at both ends (labeled
half stable and marked by the dashed black line in
Figure 5b). The right hysteresis loop extends up to
and suggests that, once the annular flow is triggered, it is retained as long as fluid is passing the valve. The left loop on the other hand is bounded by a pressure jump towards the core flow regime (visible in
Figure 6) and is expected to be triggered once the pressure gradient, which ties the flow to the wall, is not able to keep up with the increasing momentum of the inflow. Due to the hysteresis, the previous flow state is maintained for both core and annular flows across the
half stable region. Except for the hysteresis bounds, both flow regimes are stable in itself (no switching, exception at
in
Figure 6c). As shown in
Figure 6, the range in which both stable and half stable annular flows are observed, aligns with the estimated operating range (bottom). Similar flow conditions are therefore expected for field applications at part load conditions.
In contrast to the two distinct pressure branches, both the spherical and
Concave geometry generally follow the same trends in both directions. The spherical valve shape (copy provided in grey) lies mostly between the core and annular flow branches. It is expected that the spherical valve is accompanied by a reduced symmetry of the flow and a possible oscillation between a locally attached and detached flow around the circumference along with locally reduced or increased flow rates. Because the time-averaging measurements (flow meter and pneumatic pressure sensors) cannot capture these time-variant conditions, results in
Figure 3 and
Figure 6 are expected to represent a blend of the two states. Because both flow patterns are expected to exist and propagate along the circumference, the smoother transitions and the lack of a hysteresis can be explained as the fraction of either of the two flow state’s increases or decreases. Slightly lower pressure levels have been recorded for the
Concave shape, possibly caused as the flow is guided towards an axial flow direction resulting in increased flow velocity near the wall with respect to reduced pressure levels.
Concluding from the observations, it is expected that pure annular and axisymmetric flow regimes in the discussed operating range only exist for the geometries with distinct separation edges on the valve head.
3.3. Flow-Induced Pressure Forces
The time-averaged static pressure trends discussed above indicated that introducing a separation edge successfully triggered desired annular flows within the expected part load operating range, suggesting increased operational stability. In the conducted experiments, time-resolving pressure and strain measurements were used to draw a respective conclusion on flow stability and unsteady dynamic load, which will be exemplary discussed by comparing the
Backstep geometry to the spherical reference case at
in
Figure 7. Through a side-by-side comparison of wall pressure trends (top), its corresponding power spectral density (middle), and the RMS level of lateral forces (bottom), the impact of the modification with regions of a pure annular flow is presented. The presented data were recorded during pressurization of the valve chest (decreasing
), corresponding to the red curves in
Figure 6.
For both geometries, the wall pressure trends at the diffuser inlet are provided in the first row of
Figure 7 (the same axial position as previously discussed pneumatic sensor), including average (black), minimum (blue), and maximum (red) readings from time-resolving measurements. The shaded patches represent quantiles from 2.5–97.5% at 2.5% steps, providing additional information on the scattering of pressure readings.
For the presented
Backstep modification in
Figure 7b, the previously discussed pressure drop indicating the annular flow regime is also visible in time-resolving measurements from
to
(green bar, labeled
Annular Flow). Within this range, both average pressure fluctuations as well as pressure spikes are significantly reduced, visualized by the quantiles, minimum, and maximum readings. Below this region from
to
, the influence of the geometric modification fades, and amplitudes are of similar magnitude or even increased in comparison against the spherical shape as visible by the quantile patches and maximum values.
For high flow rates (low pressure ratios), a rapid drop of the pressure level and pressure amplitudes can be observed independently of the valve shape (at
for
). At this point, a normal shock evolves and an attached axisymmetric supersonic flow is observed at the sensor’s position. Simultaneously, wall pressures drop and become almost steady, eliminating most of the unsteady pressure forces acting on the valve support. Because the occurrence is far outside the expected operating range, this range is not further discussed, as it is expected to be irrelevant with respect to field applications (refer to Windemuth et al. [
13] for further details).
The power spectral density (PSD) of the same pressure signals is shown in the second row in
Figure 7 for
th-octave bands, indicating a continuous increase of low frequency broad band amplitudes as the pressure ratio is decreased for the reference design. In this low frequency region, large vortex structures as discussed in Windemuth et al. [
13] are observed in CFD results, showing slow and random propagations. The modified
Backstep geometry shows a similar distribution of amplitudes outside the range of the annular flow. Within the range of the annular flow, a drastic reduction in amplitudes is captured across all frequency bands, spontaneously increasing back towards the reference level once the flow detaches again.
While most amplitudes in the power spectral density are concentrated in the form of random noise at lower frequencies, few distinct frequencies can be identified for both geometries. At around 0.3–0.5, the first lateral acoustic mode near 3000 Hz is clearly excited. In comparison to the spherical shape, the acoustic mode can be identified much sharper for the Backstep shape, which is also observed for the other modifications. It is expected that, in case of the spherical shape, the increased asymmetry of the flow dampens periodic excitations, while the increased symmetry of the flow for modified geometries favors these structures.
In the bottom part of
Figure 7, the dynamic load of the valve support is presented as the RMS level of the combined lateral force, normalized by a reference force
derived from the area
and the inlet total pressure.
Consistent with the pressure trends, the magnitude of lateral forces mirrors the occurrence of pressure fluctuations, peaking at
for the reference case. By introducing the separation edge and favoring the annular flow, the loading of the valve support is reduced by more than 50%, shrinking RMS levels towards the noise floor of the strain measurements (dashed line). Even outside of the annular region and despite a small range at
, resulting forces are either maintained or reduced by the modification. For further information and extending Windemuth et al. [
14], results from all geometries at opening ratios
,
, and
are provided in
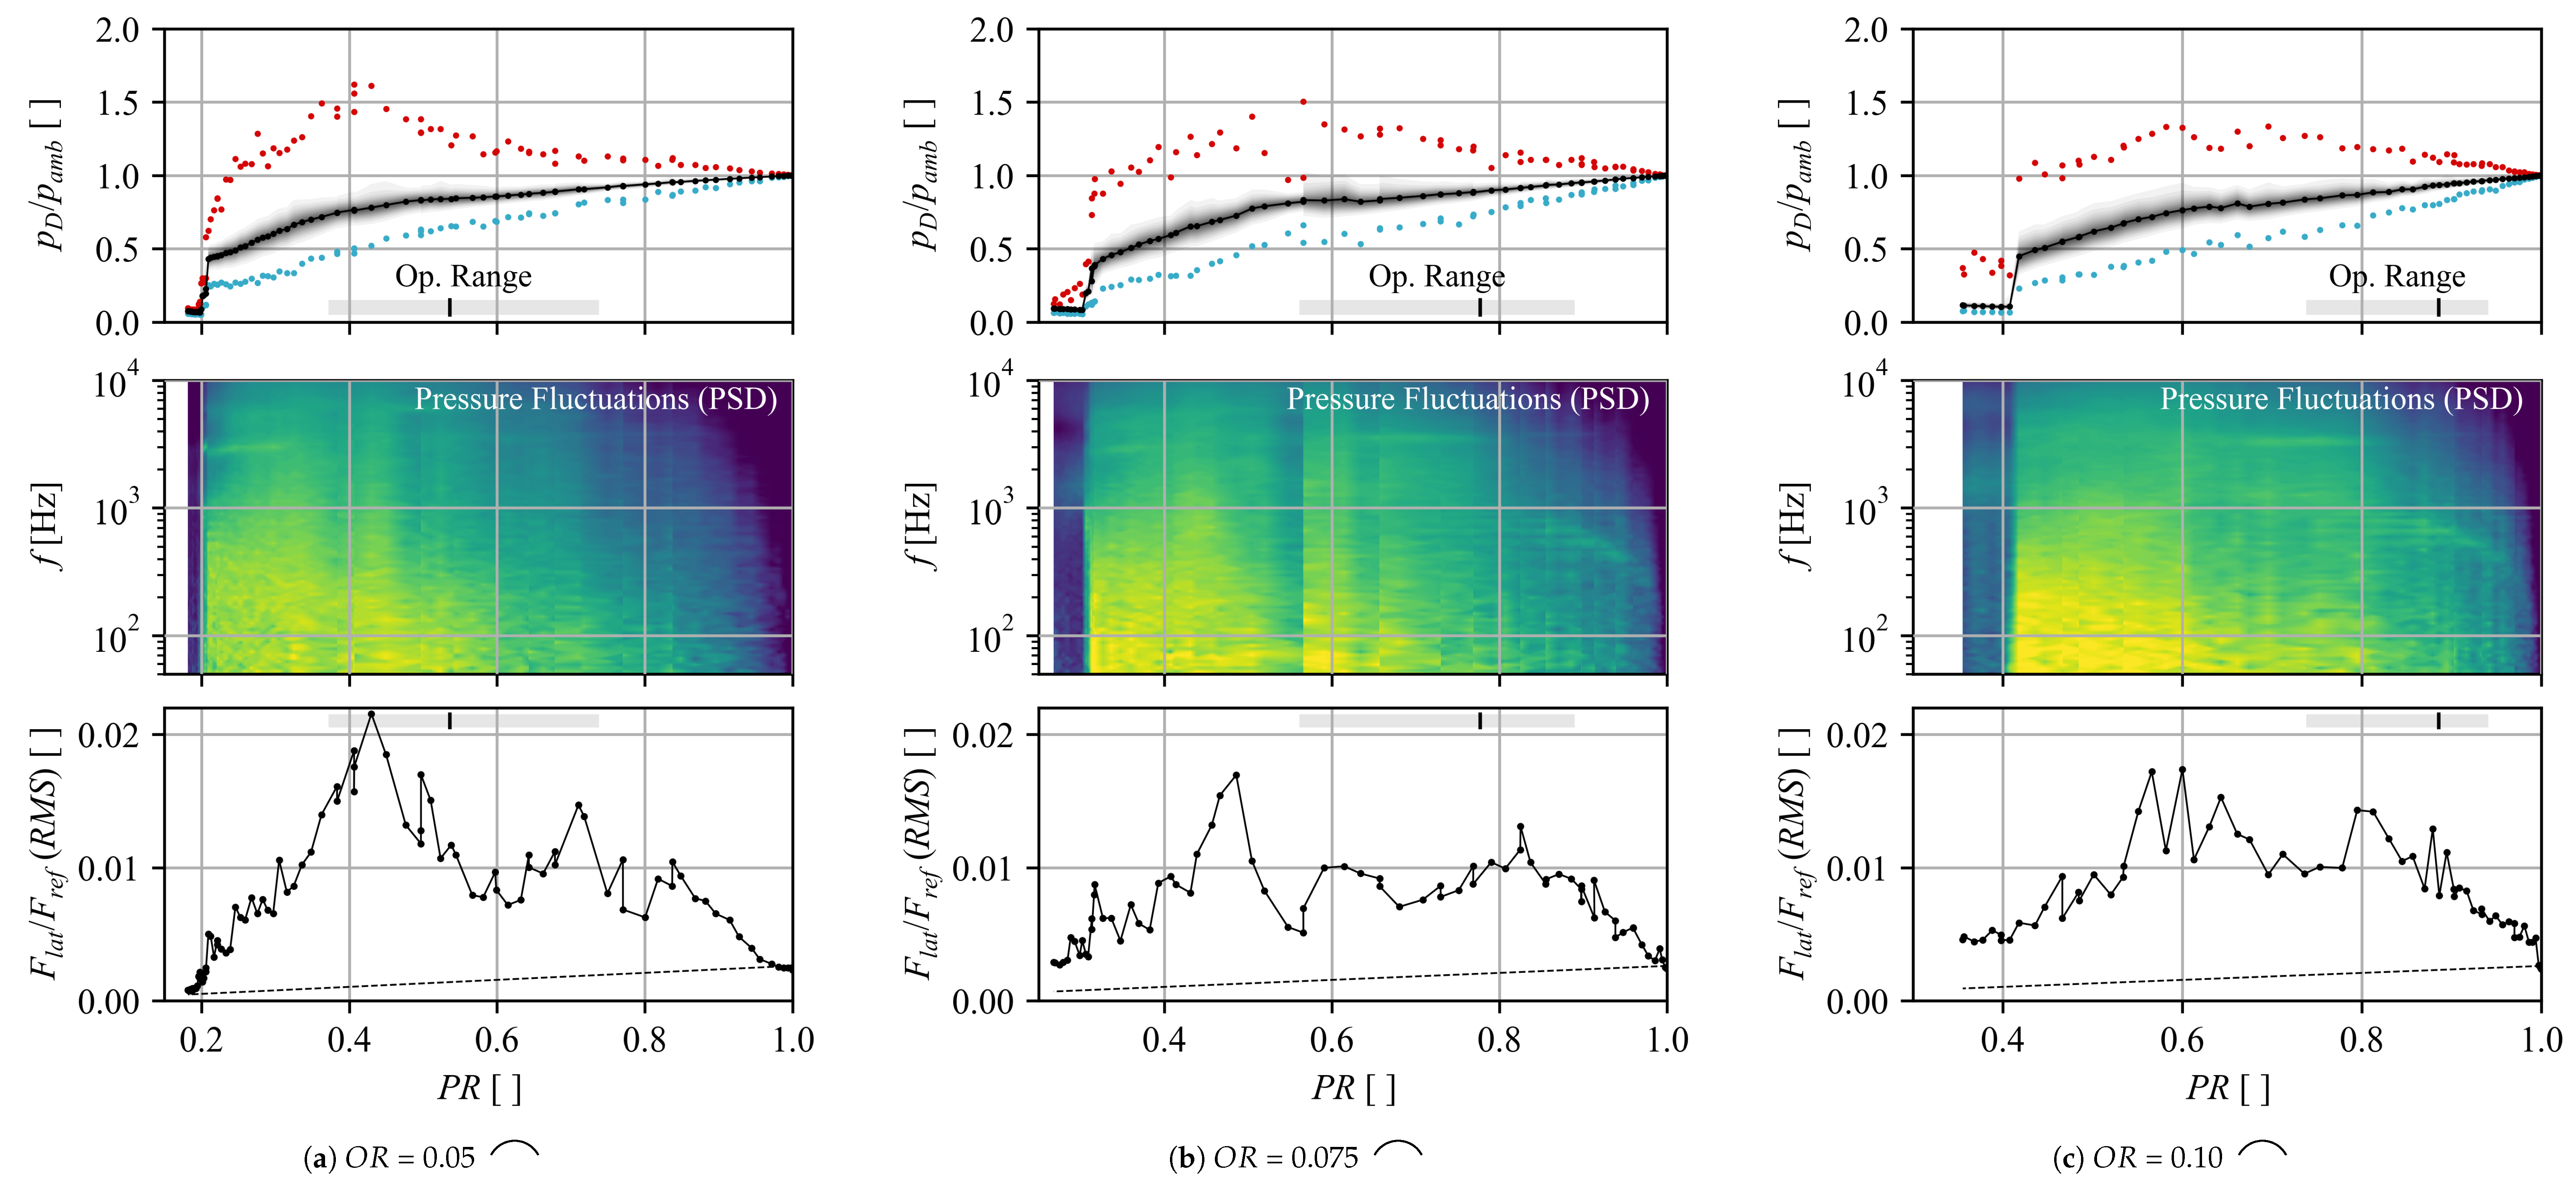
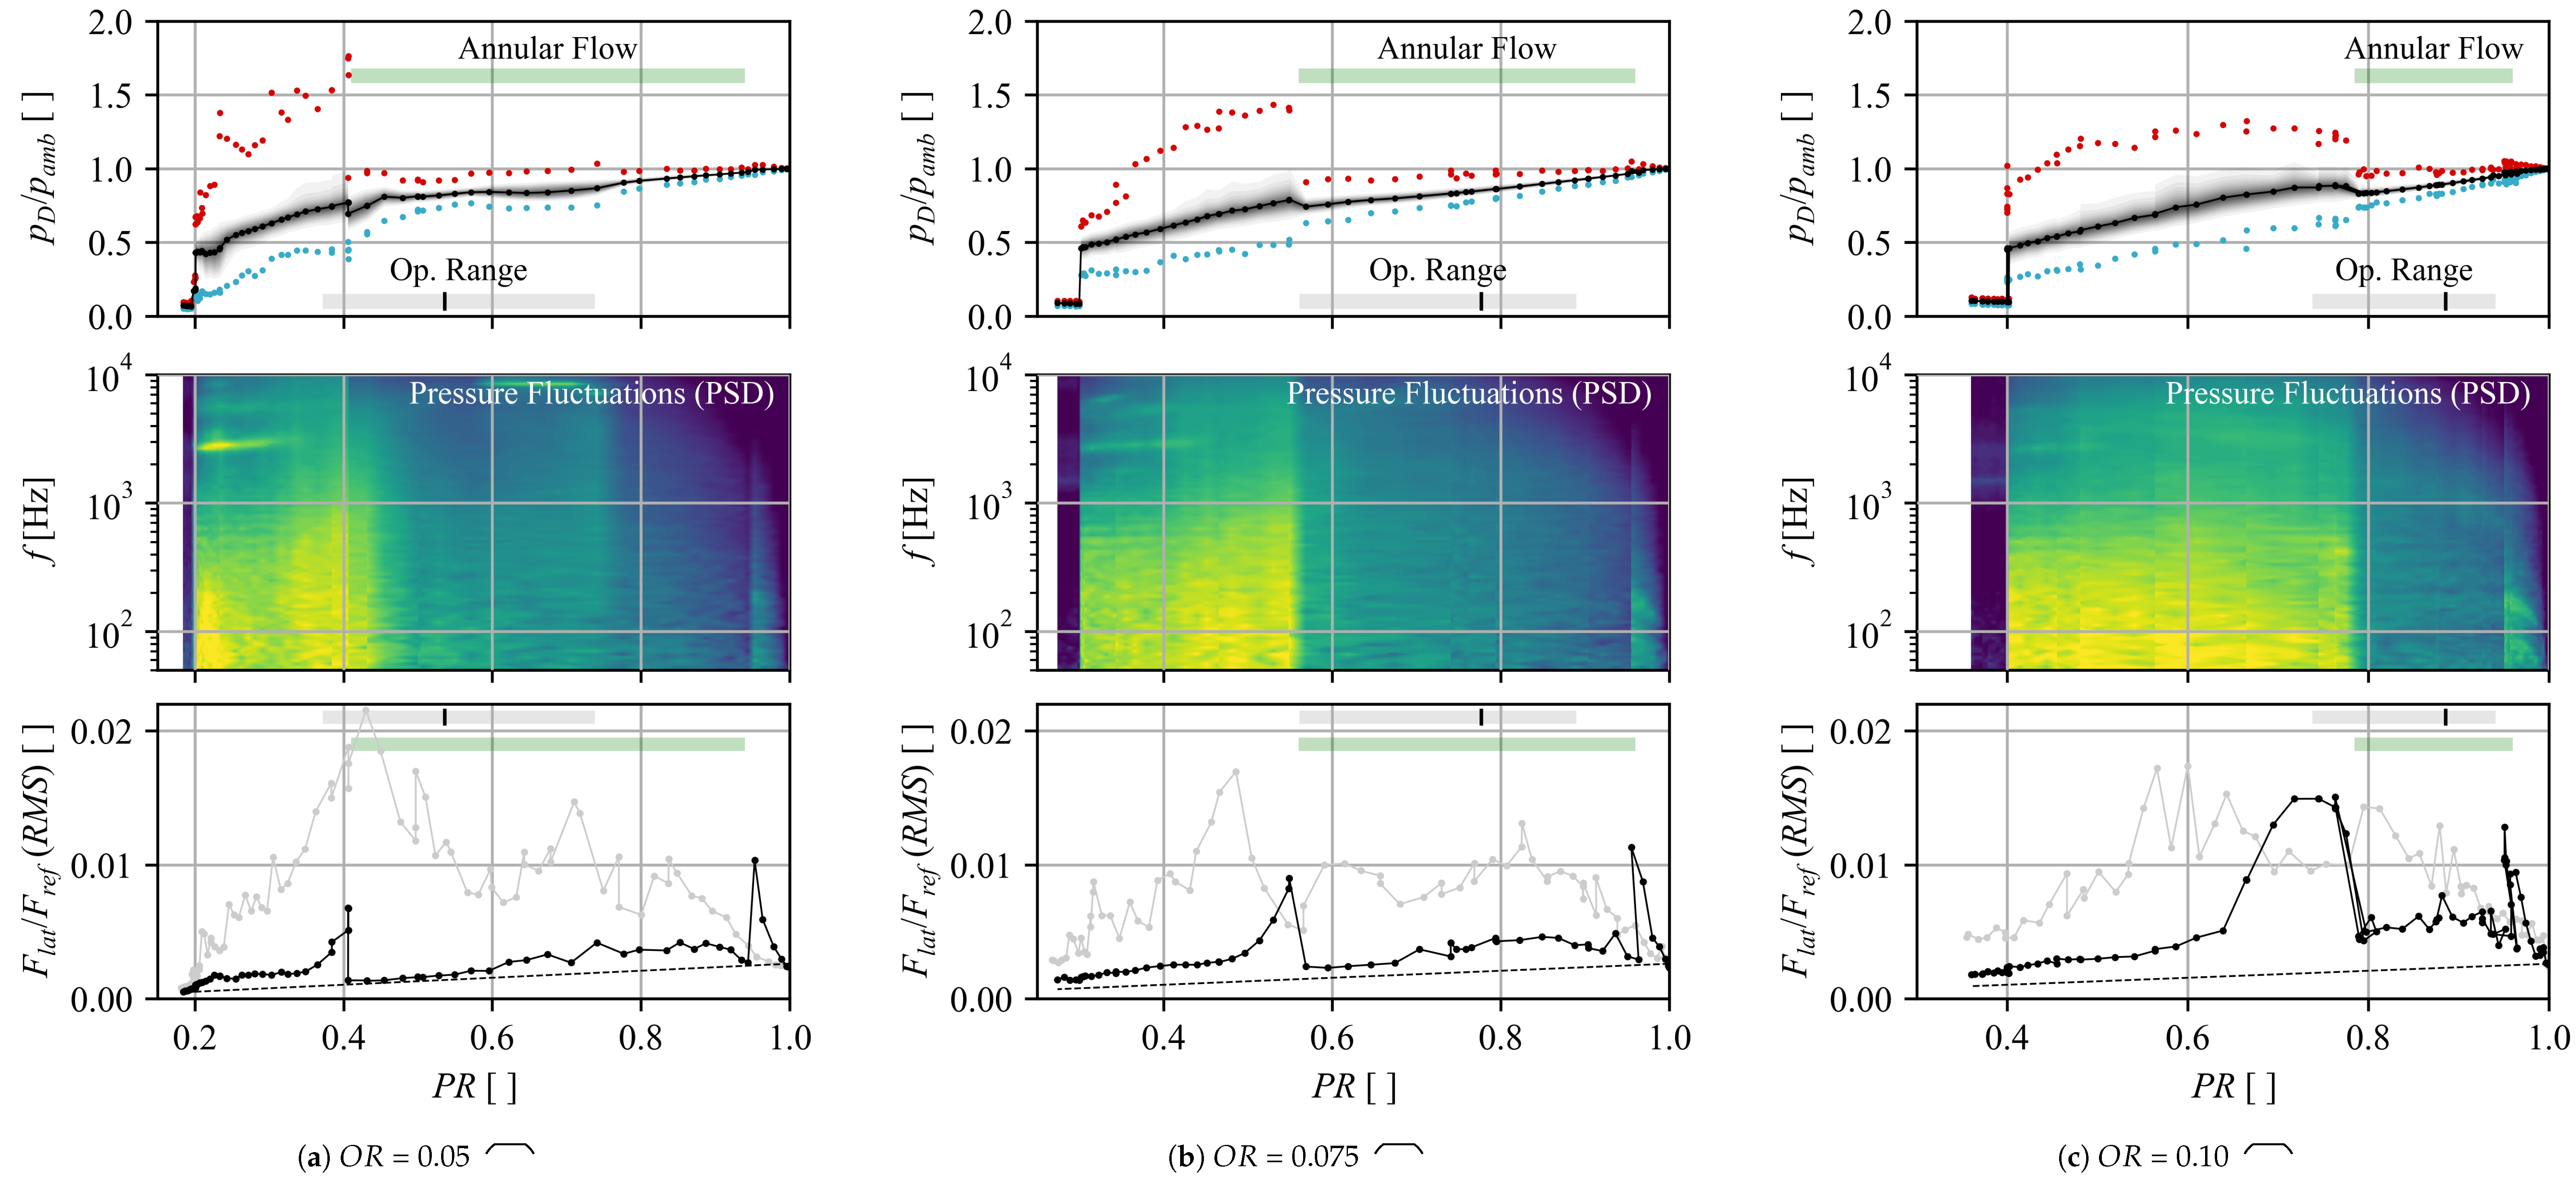
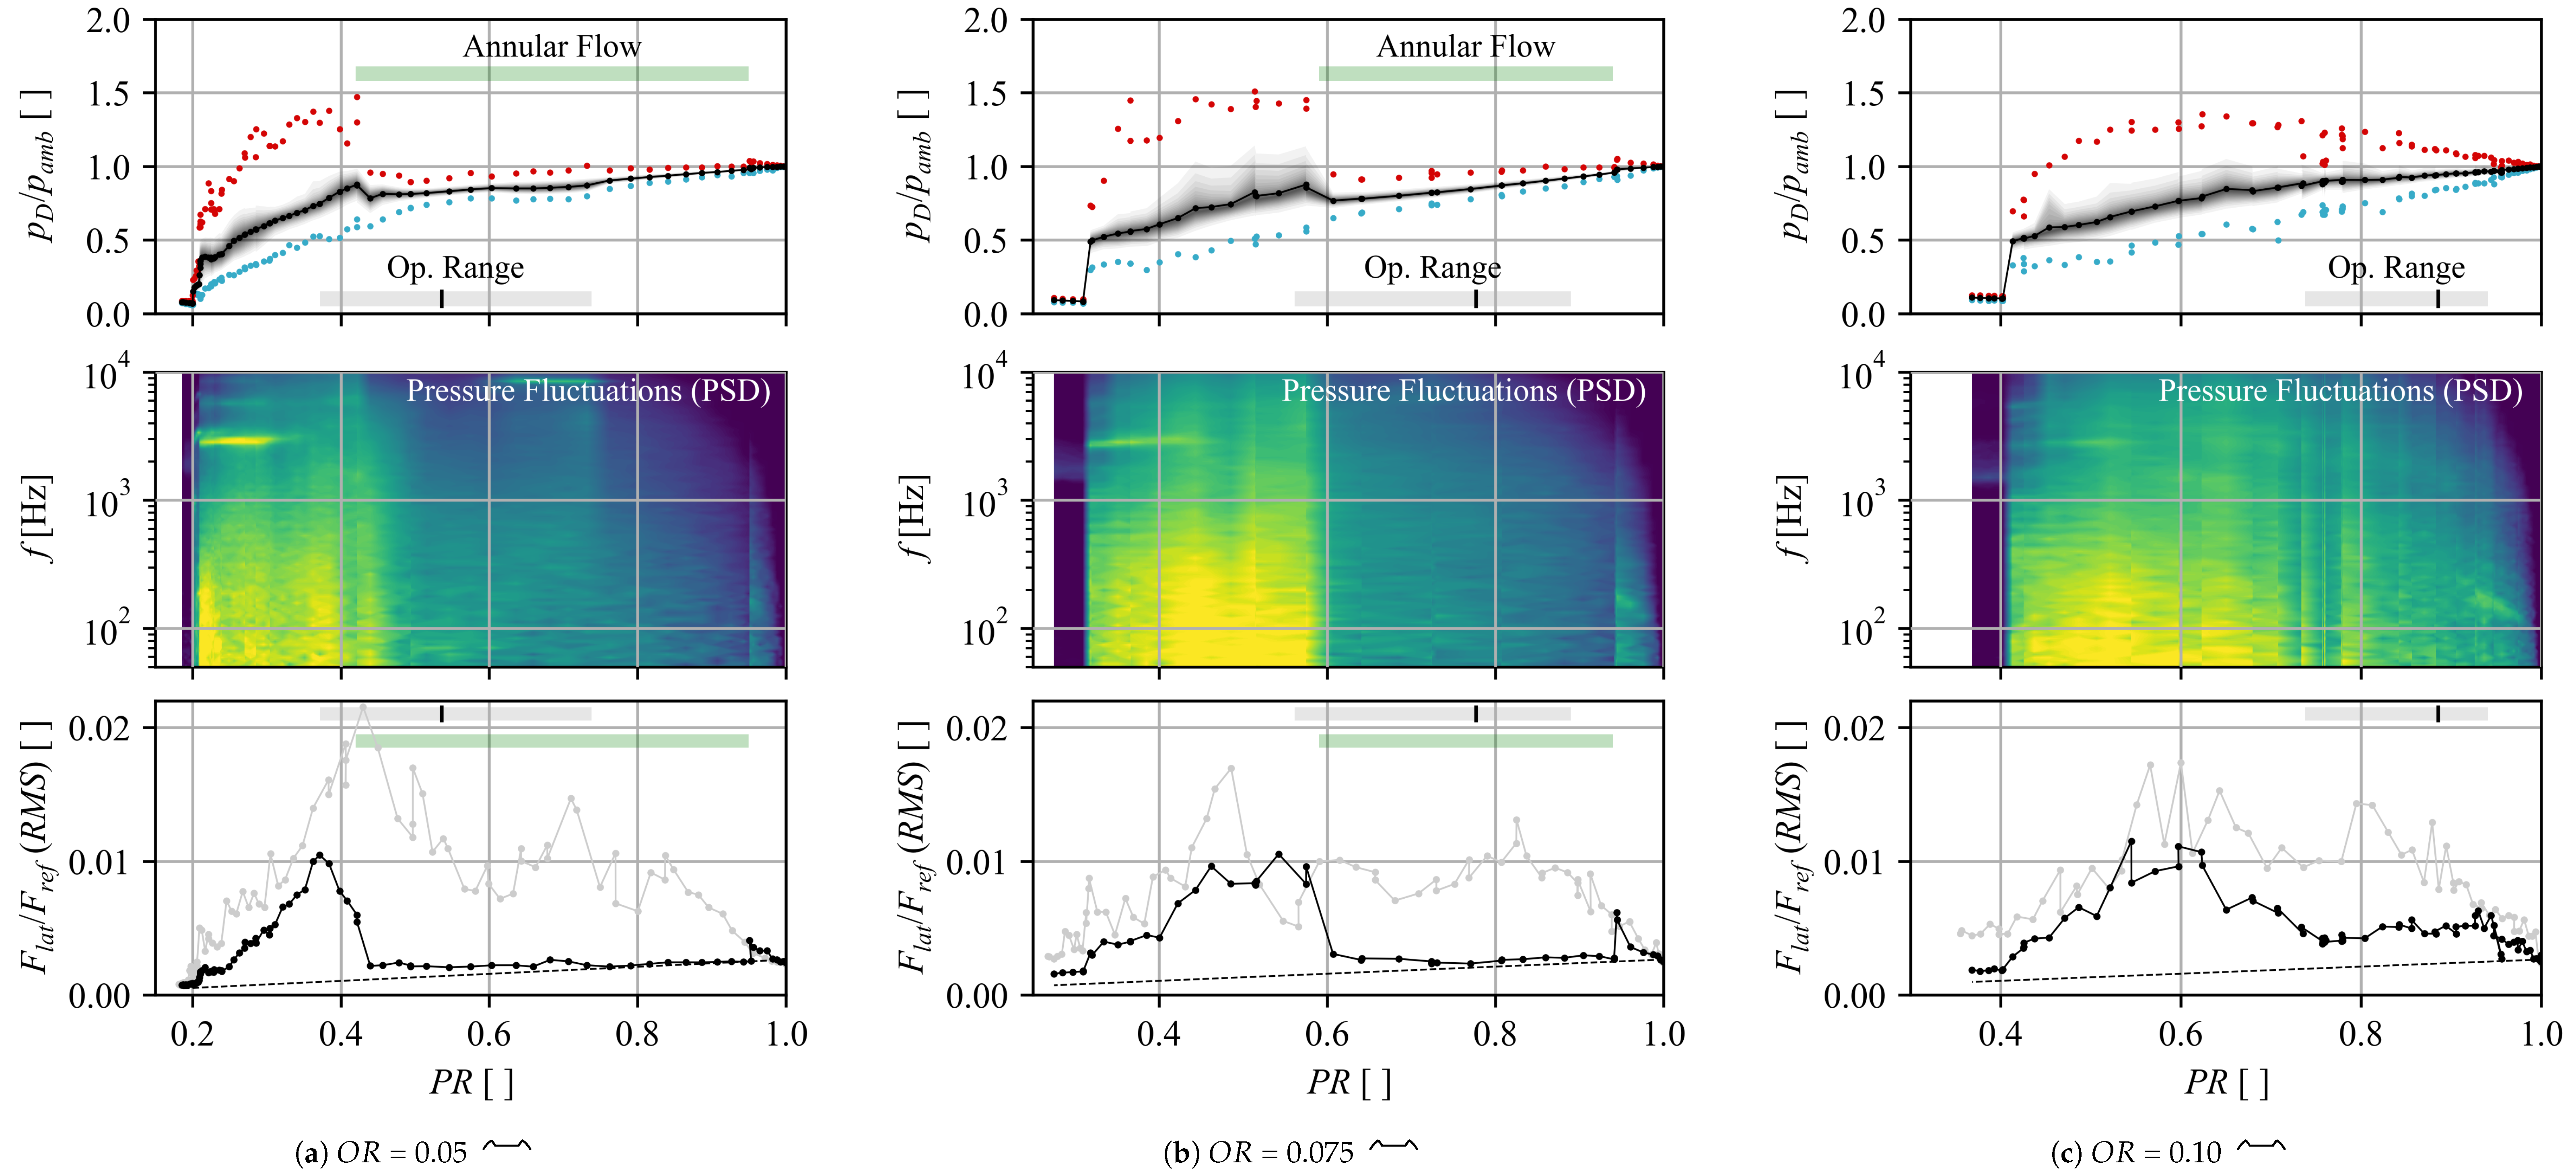
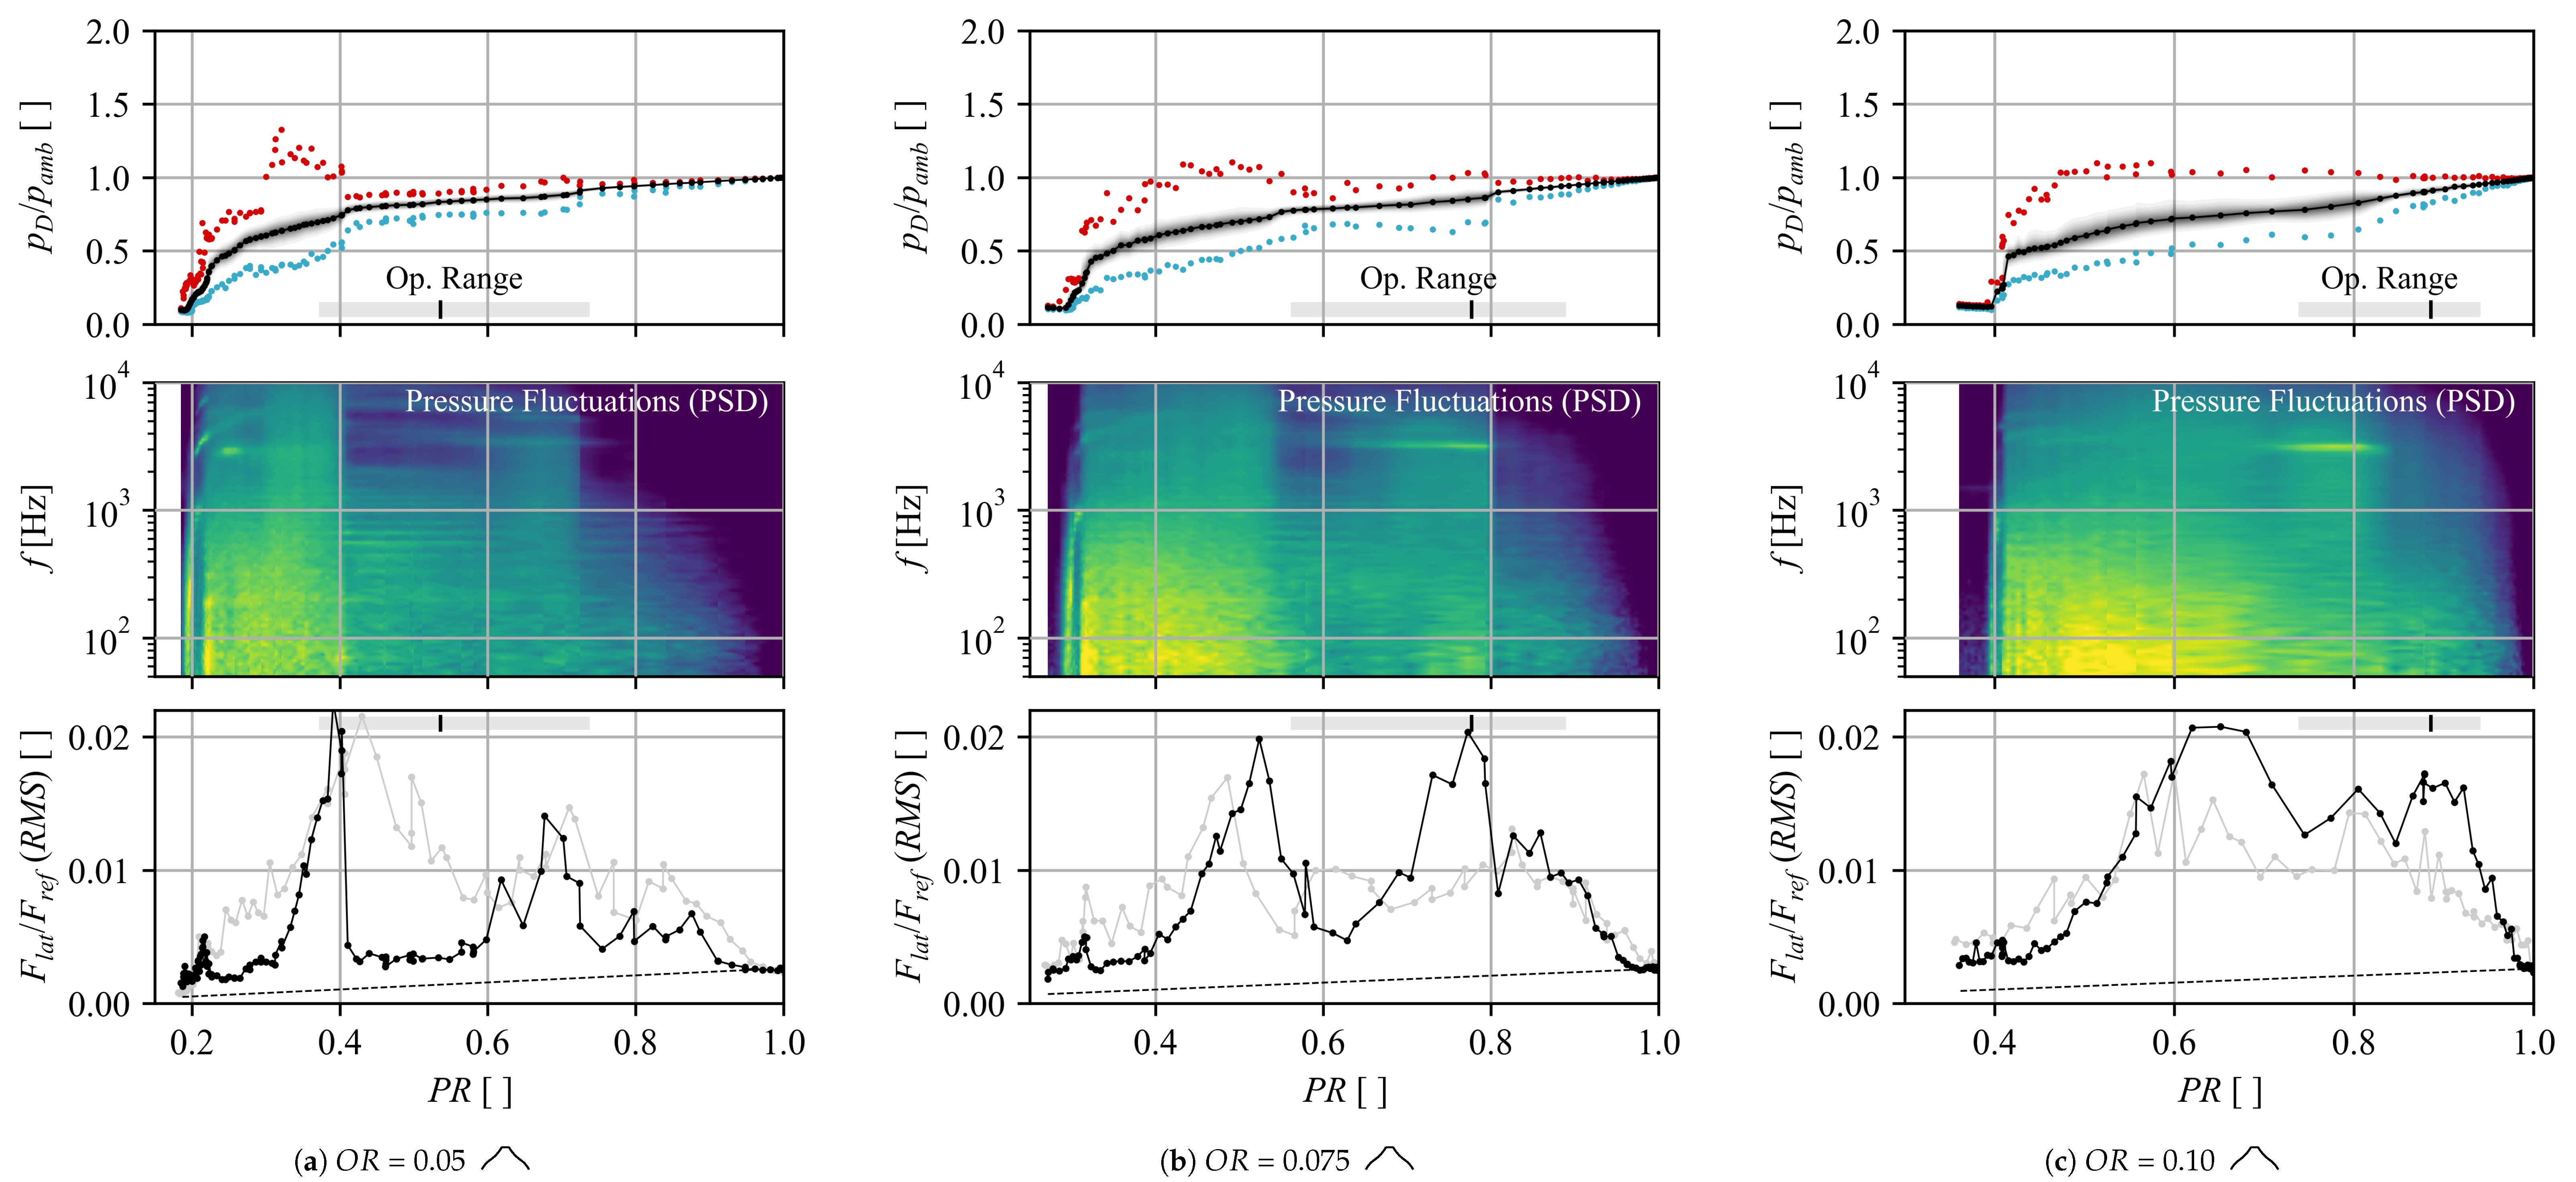
Appendix A in
Figure A1,
Figure A2,
Figure A3,
Figure A4 and
Figure A5. While a similar behavior is observed for the other geometries comprising a separation edge, the
Concave geometry shows less clear trends in terms of operation stability, even though the flow is guided towards an axial core flow. Nevertheless, pressure trends indicate increased flow stability and reduced forces at lower opening ratios.
