Article

Characterization of Unsteady Leakage Flow in an Axial Fan †

by
Matteo Dellacasagrande
*,
Edward Canepa
,
Andrea Cattanei
and
Mehrdad Moradi
Department of Mechanical, Energy, Management and Transportation Engineering (DIME), University of Genova, 16145 Genova, Italy
*
Author to whom correspondence should be addressed.
This paper is an extended version of our meeting paper ETC15-187 published in the 15th European Turbomachinery Conference, Budapest, Hungary, 24–28 April 2023.
These authors contributed equally to this work.
Int. J. Turbomach. Propuls. Power 2023, 8(3), 34; https://doi.org/10.3390/ijtpp8030034
Submission received: 10 July 2023 / Revised: 4 September 2023 / Accepted: 7 September 2023 / Published: 13 September 2023

Abstract

:
The present work reports an experimental study of the leakage flow in a low-speed fan ring. Existing 2D Particle Image Velocimetry (PIV) measurements taken in a meridional plane in front of the rotor gap have been further processed and analyzed by means of the Proper Orthogonal Decomposition (POD). Three values of the dimensionless pressure rise across the rotor have been investigated. Namely, attention has been focused on the intermediate case—the one for which a strong radial oscillation in the leakage flow has been observed: POD results have shown that, in this condition, the leakage flow exhibits periodic radial oscillations that are not correlated to the periodic blade passing. Moreover, such coherent motions have been found to promote turbulence transport at different radial positions, whereas rotor-related oscillations have a negligible effect in this sense. The present POD procedure can be generally applied to turbomachinery flows to characterize their unsteady behavior beside the classical phase-averaging methods based on rotor-related quantities. The present approach is novel for the study of leakage flow dynamics in axial fans.

Graphical Abstract

1. Introduction

Axial fans employed in automotive cooling systems are commonly provided with a rotating shroud—a ring connecting the blade tips that improves the volumetric efficiency and also strengthens the whole assembly. Unfortunately, it causes a strong increase in the radiated noise due to the presence of coherent flow structures (Longhouse [1]) that are contained in the leakage flow released from the gap between the ring and the stationary enclosure and are eventually re-ingested by the rotor. Such a noise is often predominant in the low- to medium-frequency range and may also constitute the major contribution to the radiated power, e.g., see Canepa et al. [2,3]. The qualitative features of the leakage flow are known, e.g., see Fukano et al. [4], Fukano and Jang [5], Piellard et al. [6], Magne et al. [7], Moreau and Sanjose [8], Zenger et al. [9], Na et al. [10], Canepa et al. [11,12,13], and Zhu et al. [14]. However, coherent flow structures generally constitute a rather complicated fluid dynamic problem and, in the present case, their properties are not completely known: the fact that noise humps at sub-harmonics of the blade passing frequency appear indicates that they are co-rotating, but the relation with gap geometry and operating point is not completely clear. In order to find effective solutions for noise reduction and also to provide reliable test cases for numerical simulations, a deeper insight into these aspects is necessary.
The present paper continues the aerodynamic investigation reported in Canepa et al. [13], which was based on 2D PIV measurements taken in the meridional plane. In that study, a detailed analysis of the effect of the operating point on the leakage flow pattern was reported. Namely, it was showed that, about the design operating point, a sudden modification in the flow pattern takes place that strongly affects the radiated noise. This modification consists of a switch between a recirculating flow attached to the ring lip and directly re-ingested by the rotor and a radial flow that mixes with the main rotor inflow after having left the measuring domain radially. By means of conditional averages, it was also shown that, when the modification takes place, both flow patterns are present together with all of the intermediate ones. However, it was not possible to deepen the features of the transition and also to determine whether such patterns follow a regular time sequence or they alternate randomly. In the present work, which is an extended version of the authors’ conference paper Dellacasagrande et al. [15], the coherent flow structures embedded in the flow are studied by means of a POD-based procedure that employs the phase averaging technique previously presented in Lengani et al. [16]. This approach has allowed the identification of the periodic dynamics of the leakage flow that are not necessarily correlated to the rotor position.

2. Experimental Setup and Measuring Techniques

Data presented here are a part of the experimental database collected in the previous authors’ work Canepa et al. [13]. The measurement campaign has been carried out in the DIME Aeroacoustics laboratory with the fan mounted on a test rig designed based on ISO 5801 norms; see Figure 1a. The tested rotor is a nine-blade aluminum prototype obtained by means of a numerically controlled milling machine (Figure 1b). The rotor stiffness prevents the geometry from being altered by aerodynamic load and centrifugal force, avoiding cross-effects on the modification of the leakage flow, e.g., see Canepa et al. [11]. The rotor has a tip radius r t i p of 222 mm, a hub-to-tip radius ratio r h u b / r t i p of 0.374, and a chord that varies between 43 mm and 50 mm from hub to tip. At the design point, the flow coefficient is Φ d e s = Q d e s / ( u t i p π r t i p 2 ) = 0.0869 , and the pressure rise coefficient is Ψ d e s = Δ p d e s / ( 0.5 ρ 0 u t i p 2 ) = 0.0993 , with Q the volume flow rate and Δ p the fan pressure rise (outlet static pressure minus inlet total one). The measurements have been carried out at a constant rotational speed Ω of 2400 rev/min; depending on the operating point, the chord-based Reynolds number approximately ranges between 31,000 and 41,000 at the hub and between 186,000 and 188,000 at the tip. During the tests, Δ p and Ω have been continuously measured. The rotational speed has been controlled by means of an optical tachometer and a stripe of reflecting tape stuck on one rotor blade, thus generating a one-per-revolution TTL signal. The gap between the rotating ring and the stationary casing is constituted by 5-mm-width axial and radial parts; see Figure 1c. In order to investigate the effect of pressure rise on the leakage flow dynamics, three Ψ values have been considered out of the 12 previously investigated in Canepa et al. [13], i.e., ψ = 0.0788, 0.0899, 0.103. At these operating points, the most interesting behavior of the leakage flow has been observed.
The flow field has been investigated in the meridional plane close to the tip gap by means of a 2D-PIV system, namely in a rectangular area located at x = 3 mm from the ring with an extension of L x = 123 mm and L r = 171 mm, i.e., r / r t i p = 0.698 1.468 and x / r t i p = 0.014 0.581 ; see Figure 1c. Measurements have been carried out using two cameras with a maximum frame rate of 6 Hz. The axial (u) and radial (v) velocity components have been obtained using a spatial cross-correlation function yielding instantaneous vector fields constituted by 83 × 116 points on a square grid of steps Δ x = Δ r = 1.5 mm. In the present measurement campaign, 2000 instantaneous vector fields have been collected, and the TTL signal generated by the optical tachometer has been employed as reference signal for the rotor-based ensemble average technique. Since the adopted PIV system does not allow the TTL signal to be used to trigger the PIV acquisition, the PIV snapshots have been ordered a posteriori for the computation of the rotor-based phase averaged field. The instantaneous vector fields have been sorted into 90 phase bins per revolution. In order to increase the statistical reliability, the data have been ensemble averaged over a blade pitch, yielding 10 meridional distributions based on about 198 samples. Other details on the experimental setup and measuring technique may be found in Canepa et al. [13].

3. Time Averaged Flow Field

Figure 2 provides the time-mean velocity fields with the contour plot of the overall turbulent kinetic energy (TKE) superimposed. For the case Ψ = 0.0788 , the leakage flow is directly re-ingested by the rotor. This, together with the region of elevated TKE observed at about 1 < r / r t i p < 1.15 , makes this operating condition the most critical one in terms of noise production (see Canepa et al. [3]). A completely different scenario characterizes the flow case at Ψ = 0.103 : the flow leaving the gap moves radially outwards and exits the measuring plane before entering the rotor. Therefore, the leakage flow does not directly interact with the rotor blades since it first mixes with the incoming flow at larger radii. Additionally, lower values of TKE are observed, with the maximum ones occurring for r / r t i p > 1.1 .
The most interesting condition is the case Ψ = 0.0899 . Here, the time-mean radial velocity ( v ¯ ) is positive for r / r t i p > 1 , thus leading to a larger recirculating region compared to the case Ψ = 0.0788 . However, the leakage flow enters the rotor before leaving the measuring plane, in contrast to the case Ψ = 0.103 . As shown in the following, a marked radial oscillation of the leakage flow is responsible for the enlarged region of high TKE values for Ψ = 0.0899 (see also Canepa et al. [13]). Otherwise, the conditions Ψ = 0.0788 and 0.103 have been found to be significantly more stable in terms of the leakage flow dynamics. Based on the above-reported observations, the present work focuses on the analysis of the case Ψ = 0.0899 and the associated unsteady behavior of the leakage flow. The aim is to inspect all the possible sources of periodic unsteadiness affecting the leakage flow dynamics, and that could not be necessarily linked to the rotor angular position. To this end, a POD-based phase averaging technique is employed for the detailed investigation of the coherent motions affecting the leakage flow for this specific flow case.

4. Proper Orthogonal Decomposition of Unsteady Leakage Flow

4.1. POD Mathematical Framework

The proper orthogonal decomposition was proposed first by Lumley [17] for the analysis of turbulent flows. Given a certain velocity field (i.e., u ( x , t ) ), the POD procedure provides spatial modes ζ ( x ) (resembling the flow structures) and temporal coefficients χ ( t ) (retaining the mode dynamics). According to the original formulation of Lumley [17], POD modes are computed as the eigenvectors of the spatial cross-correlation tensor of flow samples. In the present work, the successive formulation of Sirovich [18] has been adopted, in which the POD coefficients are directly obtained as the eigenvectors of the temporal cross-correlation matrix C:
C X = Λ X
where C = U T U , U is the snapshot matrix containing the instantaneous realizations of the field, X is the matrix containing the eigenvectors of C, and Λ is a diagonal matrix with the sorted eigenvalues. Once the POD temporal coefficients are computed from Equation (1), the corresponding spatial modes are obtained by projection as
Z = U X Λ 1 2
where Z is the matrix containing the POD modes ζ ( x ) normalized with their corresponding eigenvalues. POD can be also used to construct reduced order models providing a filtered snapshot matrix U K that retains the contribution of the first K modes only. This is done by inverting Equation (2):
U K = Z Λ 1 2 X T
where the last N t K columns of Z are set to zero.
Once the POD modes have been computed, a POD-based phase averaging technique has been applied, where the reference signal is directly extracted from the leading modes (see Lengani et al. [16]). Particularly, if periodic convective structures occur within the flow, coupled modes are typically observed, i.e., modes with similar energy content and spatial distribution (see Legrand et al. [19]). Therefore, the corresponding low-order models can be used to sort the instantaneous snapshots based on the main period highlighted by the modes. According to Equation (3), the contribution of the kth POD mode to the ith PIV snapshot can be written as
u ( k ) ( x , r , t i ) = ζ ( k ) ( x , r ) λ ( k ) 1 2 χ ( k ) ( i )
where χ ( k ) ( i ) is the ith element of the kth POD coefficient. Then, if the kth and the ( k + 1 ) th modes are coupled and representative of the same convective structures, the phase angle θ i of the ith record is defined as
θ i = ζ ( k ) ( x 1 , r 1 ) λ ( k ) 1 2 χ ( k ) ( i ) ζ ( k + 1 ) ( x 2 , r 2 ) λ ( k + 1 ) 1 2 χ ( k + 1 ) ( i )
where ( x 1 , r 1 ) and ( x 2 , r 2 ) are control points used for the computation of each snapshot phase. According to the above-mentioned method, all snapshots may be sorted based on their corresponding phase angle, and a POD-based phase averaged velocity field can be computed. Since this work aims at the characterization of the radial motions involving the leakage flow, the POD modes of the radial velocity component are taken as reference for the present POD analysis. This latter has been carried out considering the quota of the fluctuating velocity field, which is not affected by the rotor position. Namely, the periodic components obtained from the rotor-based phase averaging procedure have been removed from the original snapshots before applying the POD procedure. This has been done because the rotor-based phase-averaged field, not shown here for brevity, did not show any radial oscillations of the flow leaving the gap; see Canepa et al. [13].

4.2. POD Analysis of Rotor-Unrelated Fluctuations

The dominant coherent motions that are not related to the rotor position are studied in this section by means of the Proper Orthogonal Decomposition. Figure 3 depicts the percentage energy of the first 20 POD modes obtained from the POD total kernel (i.e., filling the matrix U with both u and v, u v -modes) and from the radial velocity only ( v -modes). For the cases Ψ = 0.0788 and 0.0899, the first mode of the total kernel captures more than 16% of the overall energy of fluctuations, while for Ψ = 0.103 , the leading mode energy is significantly smaller. This indicates that for the cases Ψ = 0.0788 and 0.0899, the rotor-unrelated fluctuations are dominated by few large coherent patterns, which capture a higher quota of the turbulent kinetic energy compared to the case Ψ = 0.103 . Similar considerations still hold for the POD modes of the radial velocity component. Interestingly, modes 3 and 4 of v show a similar energy content for the case Ψ = 0.0899 (Figure 3b), contrary to the other cases. As discussed in the following, these modes are representative of the same coherent structures, and they are referred to for the analysis of the unsteady behavior characterizing the leakage flow for this operating condition.
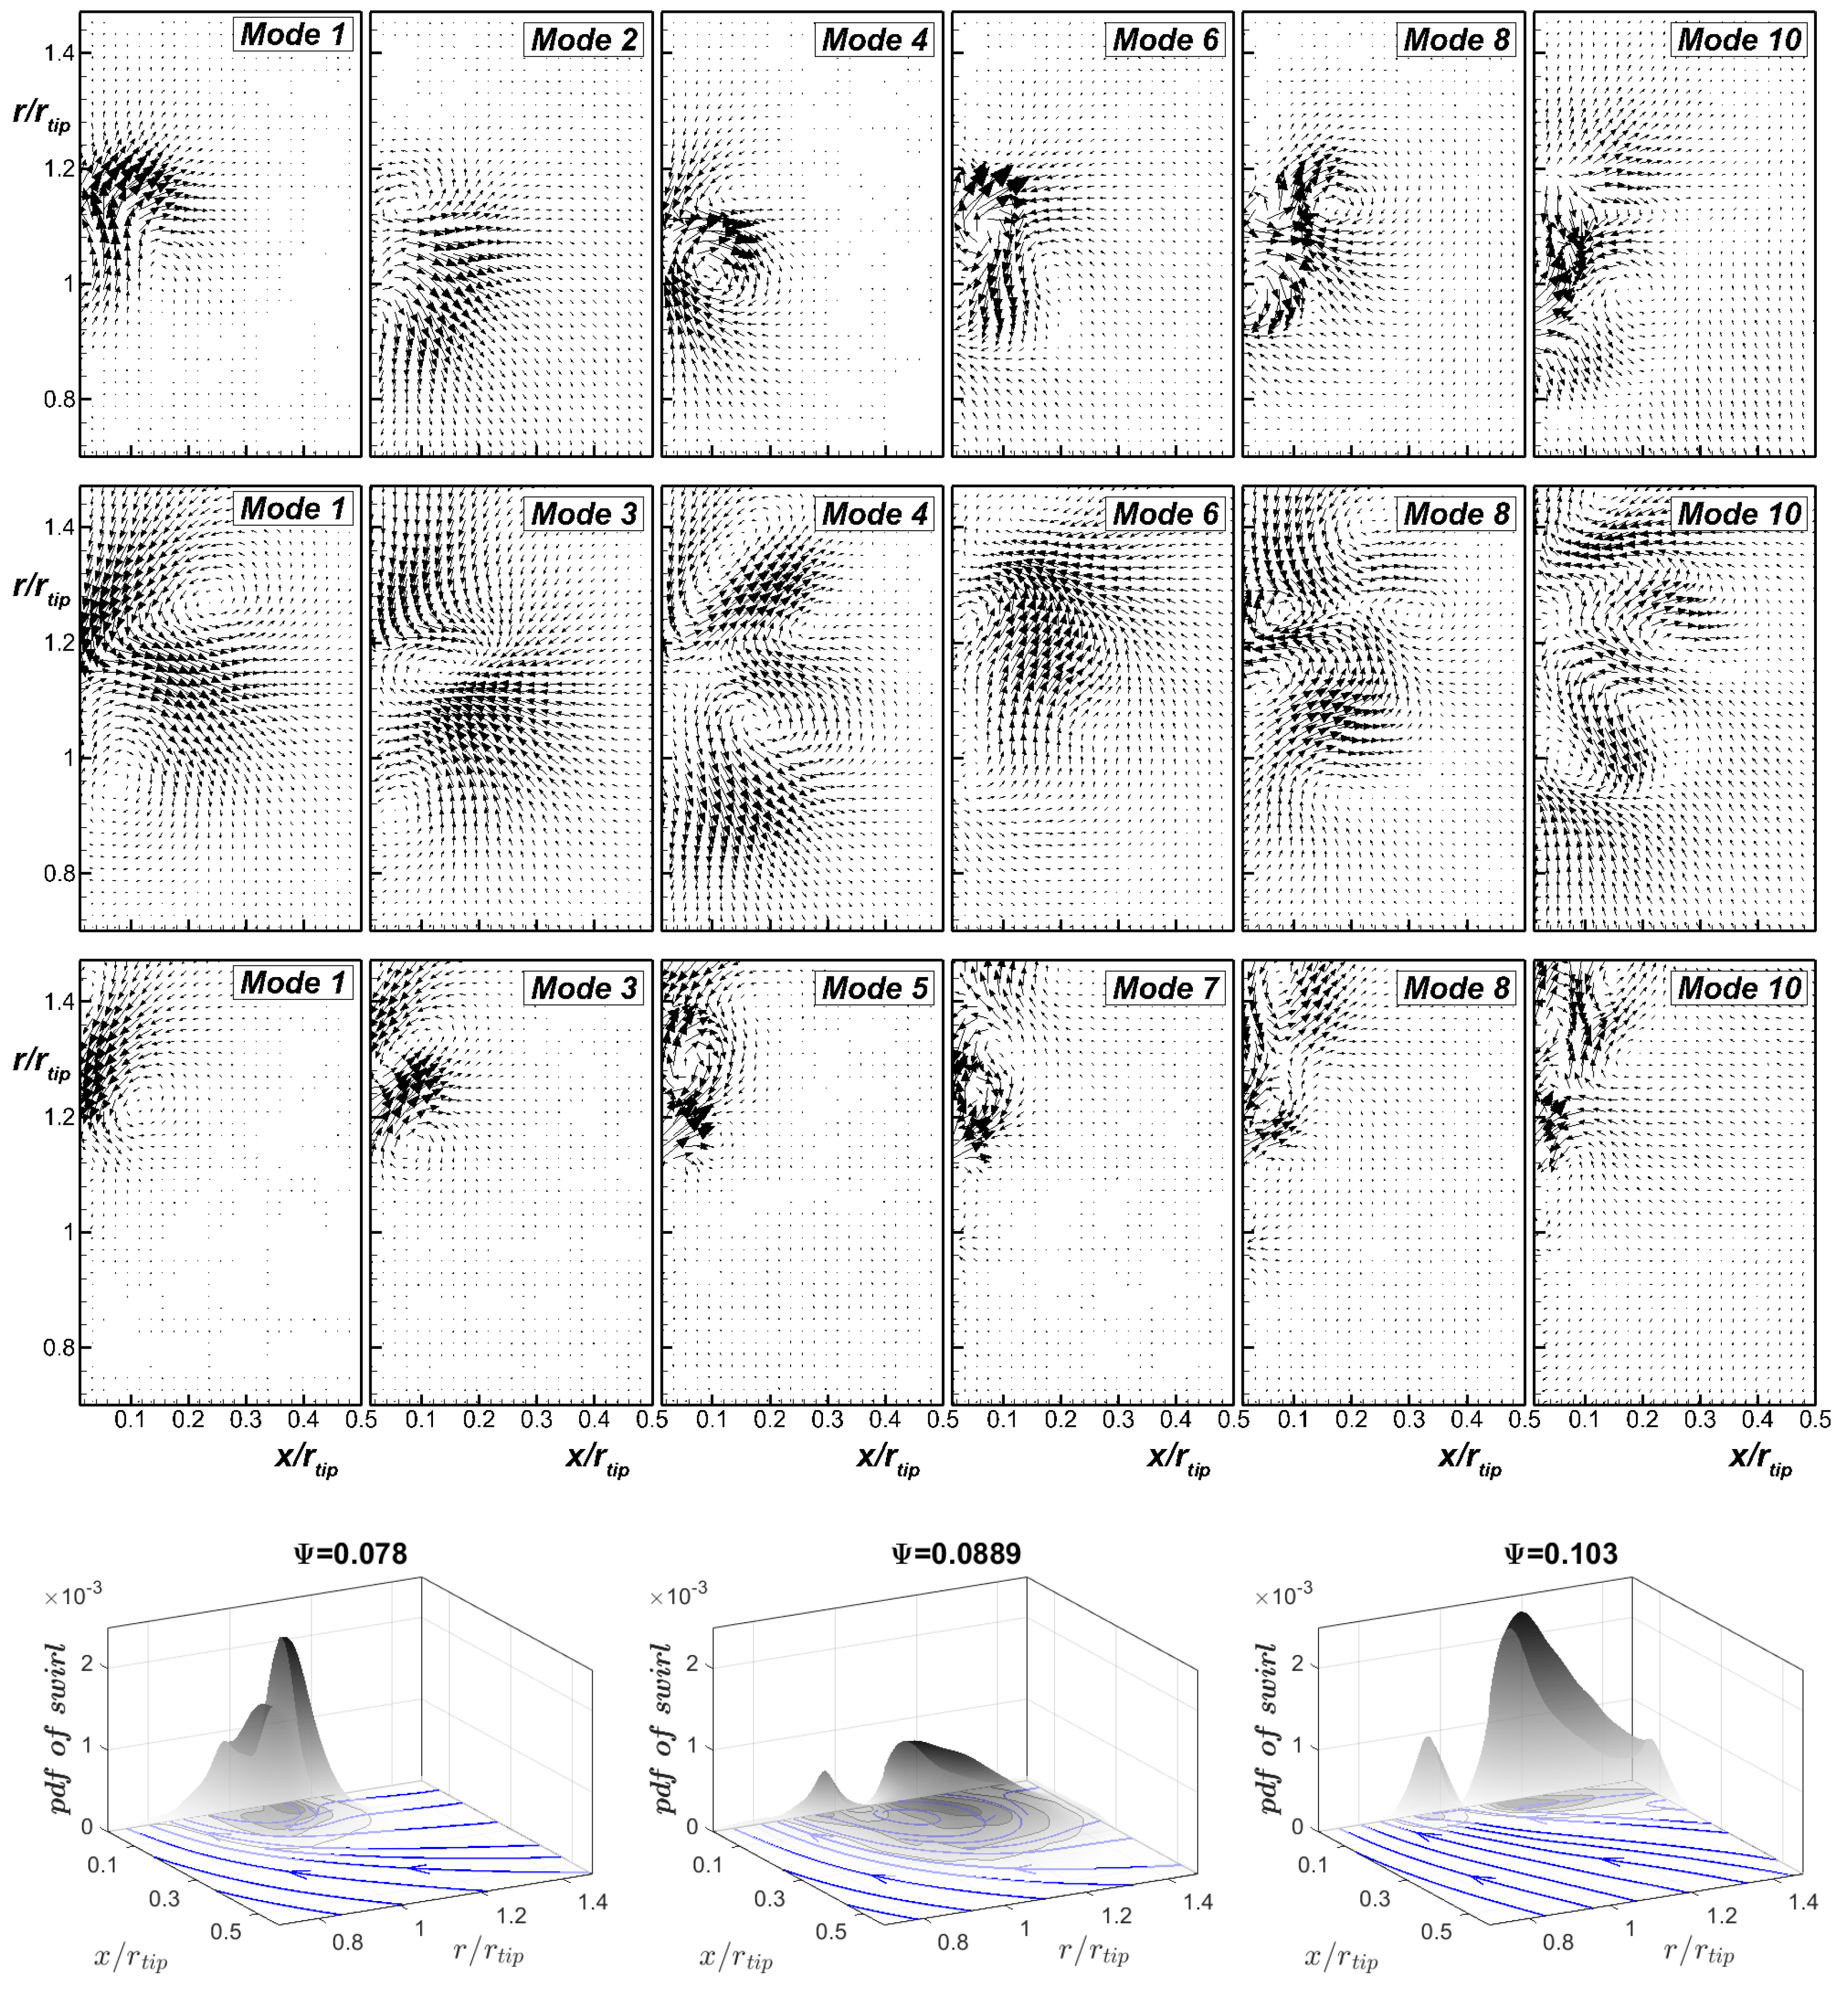
Figure 4 shows exemplary modes of the total kernel for the three values of Ψ here considered. These modes have been chosen among the first 10 to highlight the main coherent patterns within the rotor-unrelated fluctuating velocity field. Modes among the first 10 showing similar patterns to those depicted in Figure 4 are not reported here for the sake of brevity. Additionally, the mode index strictly depends on the analysed flow case.
Beside the dominant POD modes, the probability density function ( p d f ) of the occurrence of vortical structures is shown for each case in the form of gray surfaces (bottom plots). Such p d f distributions have been obtained by means of a wavelet-based vortex identification technique (see Simoni et al. [20]) applied to the overall fluctuating velocity field, i.e., retaining also the rotor-related unsteadiness, in contrast to what has been done for the computation of the modes. Therefore, the comparison between the p d f and the POD mode distributions provides information about the spatial location of vortical structures that are or are not related to the rotor position. Particularly, one may clearly see that a dominant p d f peak occurs for all cases at the spatial positions where large-scale coherent structures are highlighted by the modes. Most of the vortical events observed in the present measuring plane are therefore not necessarily linked to the rotor position.
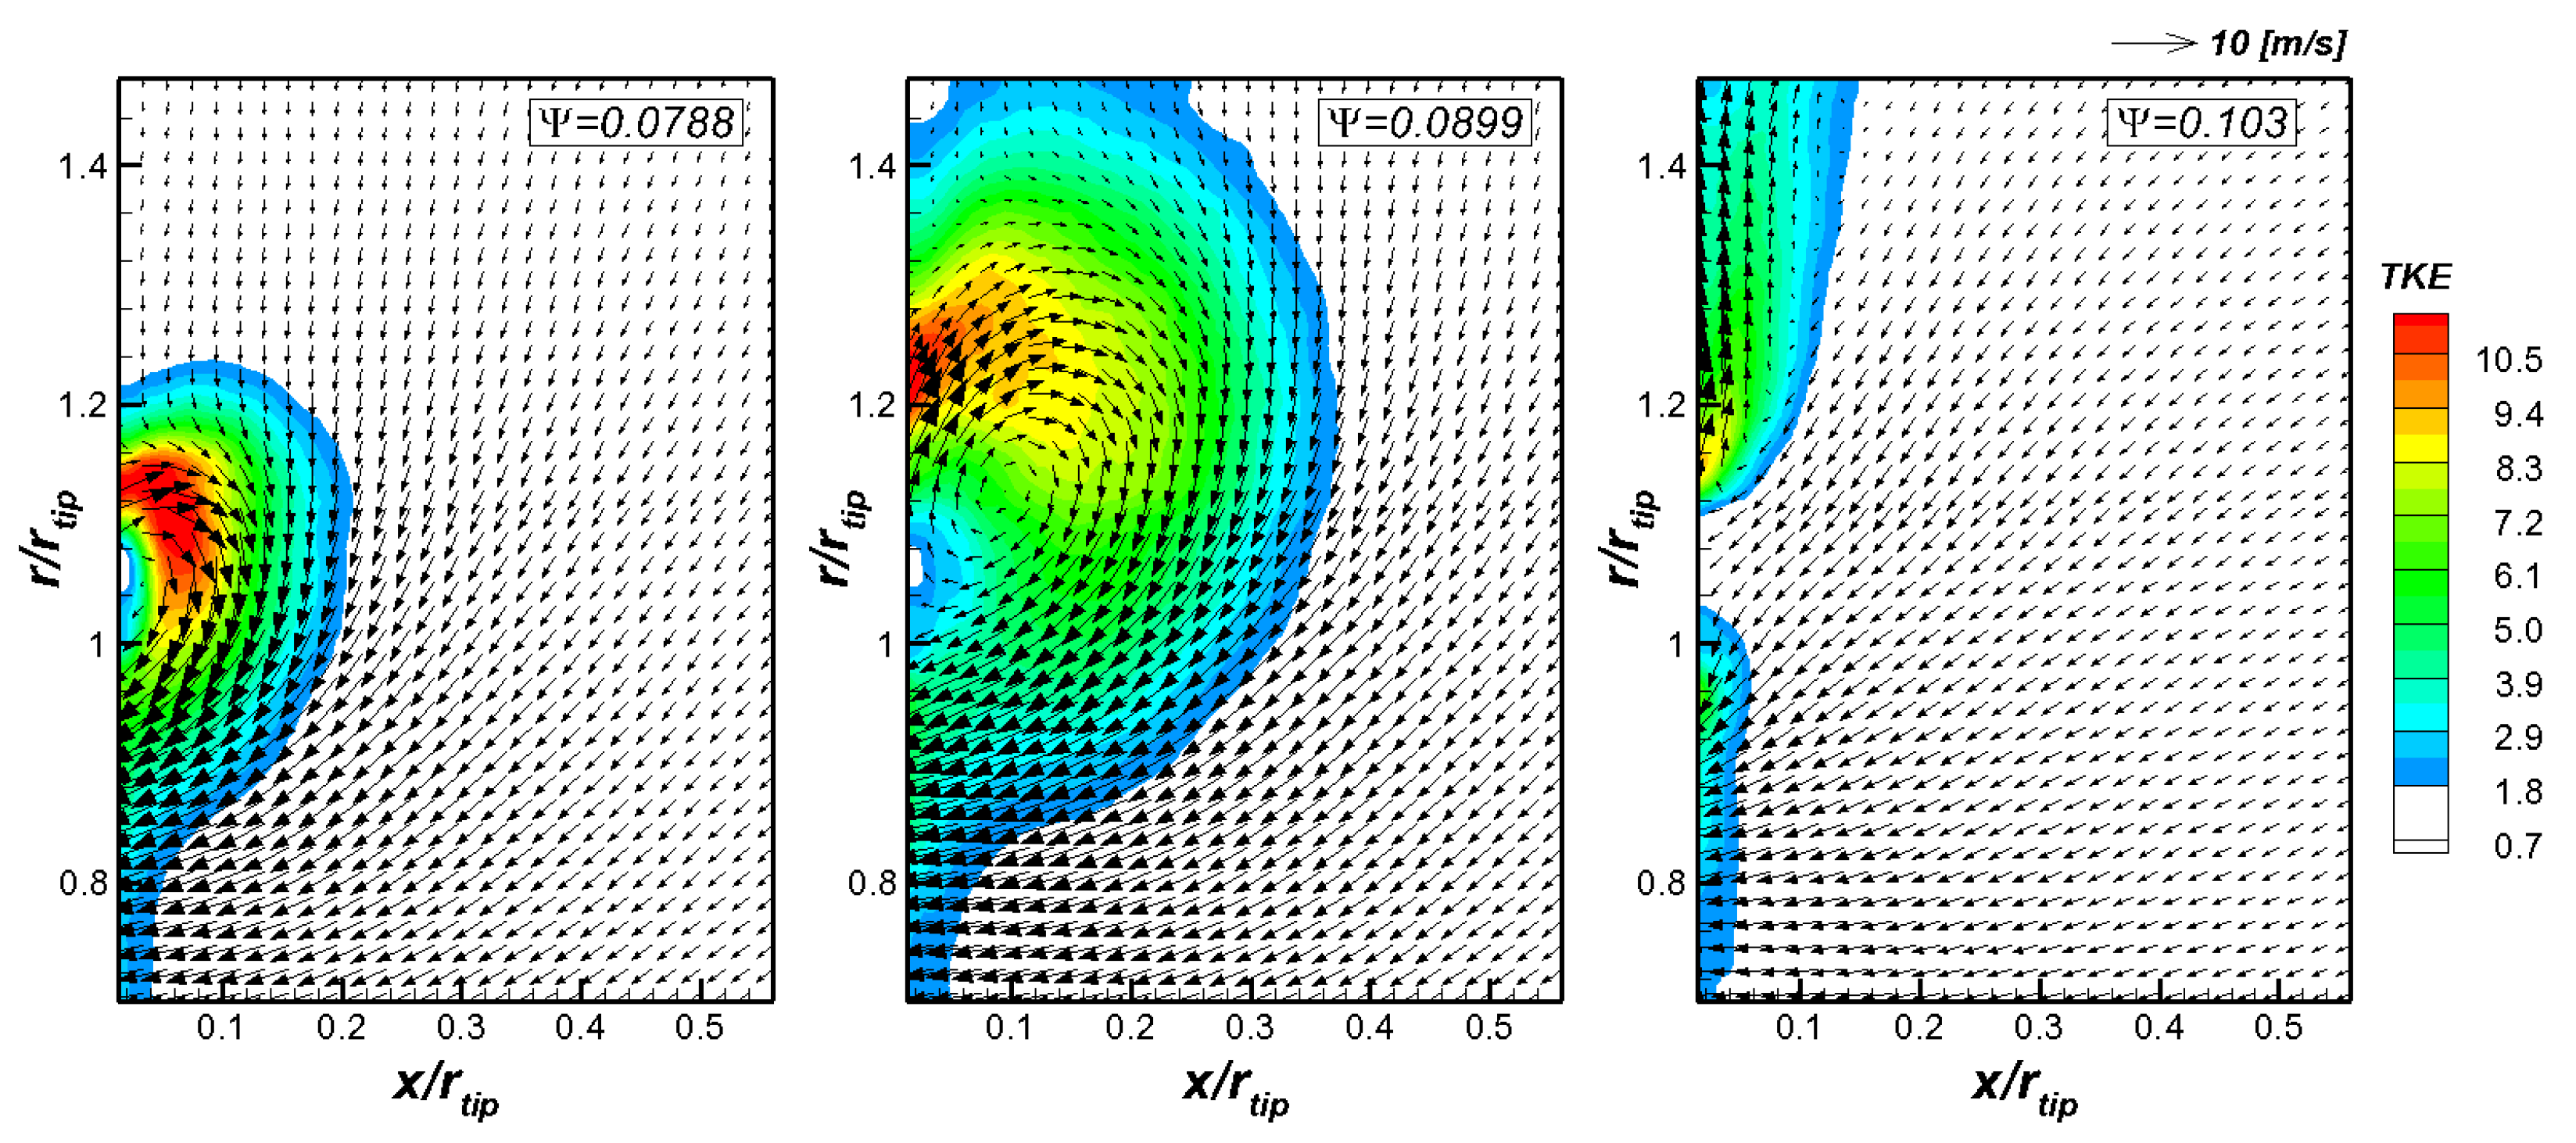
For the case Ψ = 0.0788 , the dominant POD modes resemble vortical structures near the rotor gap and the blade tip. They are representative of the coherent fluctuations of the leakage flow that, for the present case, stay attached to the rotor ring. In contrast, the POD modes for the case ψ = 0.103 show regions of high vorticity for r / r t i p > 1 , while the energy of the modes is almost null in front of the rotor blades. This clearly indicates that for Ψ = 0.103 , the minor p d f peak observed in the blade region (i.e., r / r t i p < 1 ) is substantially linked to rotor related unsteadiness.
The modes computed for the case ψ = 0.0899 depict coherent fluctuations covering a wider spatial region than for the other cases; vorticity cores are indeed observed in the blade region as well as above the rotor gap, thus showing similarities with the cases at the lowest and the highest Ψ values. This is consistent with the increment of the p d f variance (i.e., the base area). Note that since the POD modes depicted in Figure 4 are obtained from the rotor-unrelated unsteadiness, the captured flow patterns are not linked to the rotor position. The flow features highlighted by the modes in front of the rotor blade are therefore expected to be linked to a different source of unsteadiness causing the radial motion of the flow leaving the gap. As a consequence, the p d f peak observed in the blade region for ψ = 0.0899 is due to the superposition of both rotor-related and -unrelated coherent vortical structures. It is mentioned here that based on the inherent three-dimensionality of the instigated flow field, the cores of vorticity observed in the present measuring plane may be the trace of vorticity tubes extending in the circumferential direction, as described in the previous authors’ work Canepa et al. [3]. Nevertheless, the radial motions involving the leakage flow for the intermediate value of the pressure rise coefficient are shown to be well captured by the present set of measurements. Further measurements are being carried out to investigate the evolution of leakage flow fluctuations in the tangential direction.
The POD modes presented in Figure 4 highlighted existing similarities between the tested conditions. More precisely, the modes computed for the mid-pressure coefficient have been shown to partially resemble the coherent patterns highlighted by the leading modes obtained for the lowest and the highest pressure rises. This suggests that, for the intermediate pressure coefficient, the leakage flow oscillates between an attached-like (as for Ψ = 0.0788 ) and a radial-like (similar to the case Ψ = 0.103 ) configuration. In order to provide a quantitative view of the existing similarities between the dominant flow features occurring for the case ψ 
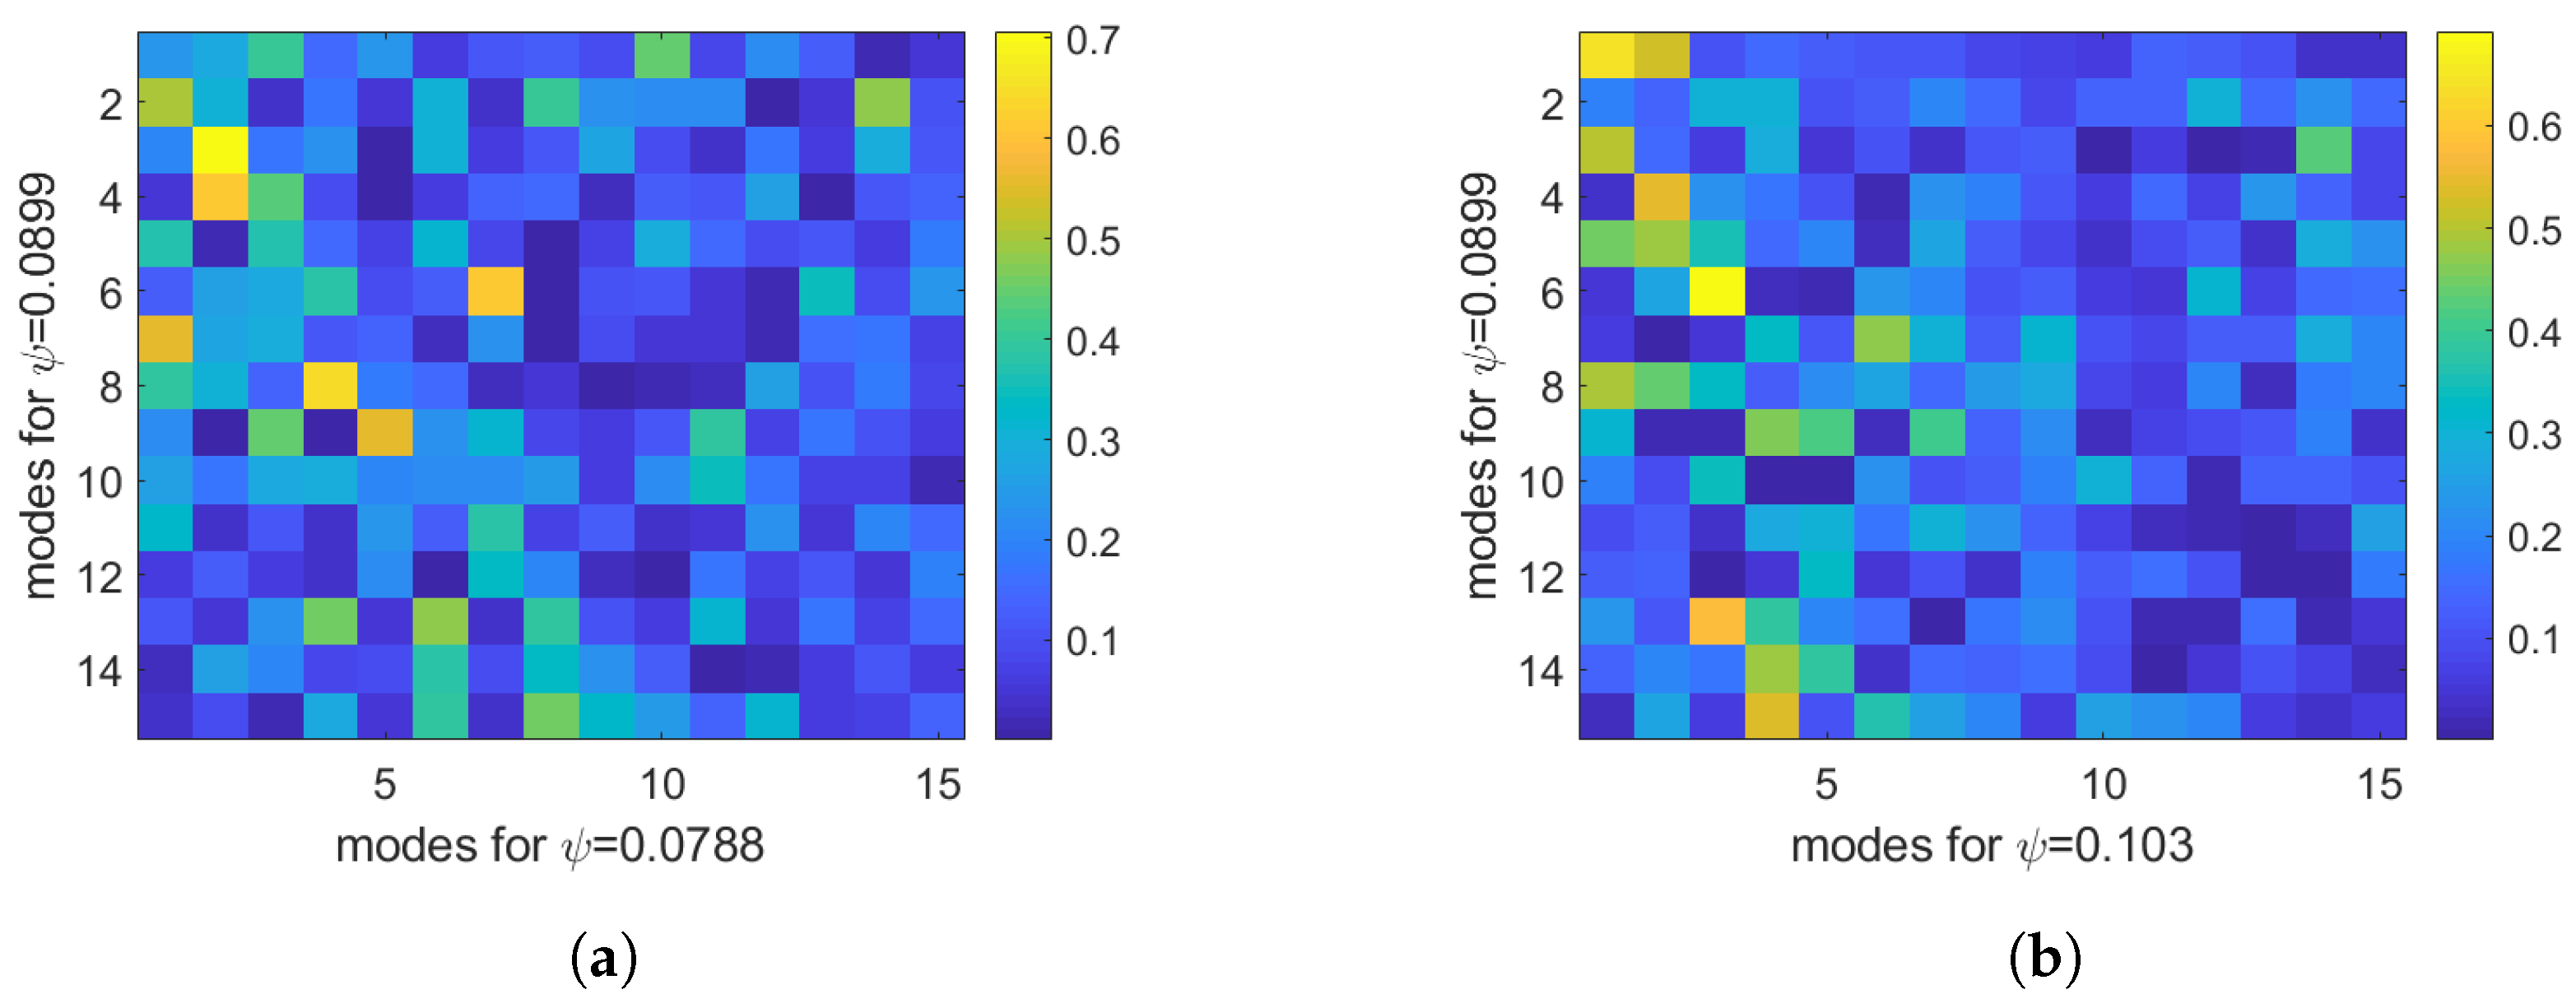
= 0.0899 and for the other two operating conditions, we computed the cross-correlation matrix of the spatial POD modes obtained independently for each value of the pressure coefficient. To this end, the POD modes have been normalized so that their scalar product provides a direct measurement of mode similarity. Figure 5a depicts the absolute value of the correlation matrix between the first 15 modes obtained for the cases ψ = 0.0899 and 0.0788, where modes 3 and 2, respectively, show the highest degree of correlation. On the other hand, modes 6 and 3 show the highest similarity when computing the POD correlation matrix for the cases ψ = 0.0899 and 0.103 (Figure 5b). The inspection of the spatial distributions of the correlating modes highlighted here (see Figure 4) provides evidence of the similarities between the flow cases. Mode 3 for the case ψ = 0.0899 depicts coherent fluctuations near the rotor gap, as in mode 2 for the case ψ = 0.0788. Otherwise, mode 6 is representative of vorticity nuclei that occur for r / r t i p > 1 , similarly to mode 3 for the case ψ = 0.103. The fourth mode computed for the intermediate pressure coefficient shows instead coherent motions affecting the entire measuring plane, thus being representative of the leakage flow oscillation.
According to Equation (4), the POD temporal coefficients retain the contribution of the corresponding modes to each of the PIV snapshots. The inspection of the coefficients 3 and 6 for the case ψ = 0.0899 therefore provides the statistical distribution of the acquired velocity fields between the two flow states highlighted by the corresponding modes, which were shown to resemble the most a t t a c h e d and the most r a d i a l -like conditions. In this sense, all the PIV snapshots collected for the intermediate pressure rise can be reported in a 2D plane defined by the POD coefficients χ ( 6 ) χ ( 3 ) , where the ith flow record is expressed in terms of the set of coordinates χ ( 6 ) ( i ) , χ ( 3 ) ( i ) . This is shown in Figure 6a, where each symbol represents a different PIV snapshot in the coordinate system defined by the chosen temporal coefficients. These latter are computed by the projection of the snapshot matrix on the normalized modes; thus, their norms retain the energy of fluctuations. It is worth noticing that the snapshots acquired for the case ψ = 0.0899 exhibit a quasi-Gaussian distribution on both coefficients (see Figure 6b,c). Therefore, the projection of the acquired snapshots onto the POD subspace defined by the coefficients 3 and 6 does not highlight any bi-modal distributions that may indicate the occurrence of well-defined clusters within the data associated to an intermittent flow pattern. The leakage flow is therefore expected to oscillate continuously between different states that rarely reach a pure radial and attached-like configuration. In the following section, the POD procedure presented in Section 4.1 is used to shed light on the coherent motions driving the radial fluctuations of the flow leaving the gap.

4.3. Characterization of the Leakage Flow Dynamics for the Case Ψ = 0.0899

In order to investigate the oscillating behavior of the leakage flow for the case Ψ = 0.0899 , the modes of v are further processed in this section. Particularly, modes 3 and 4 have been shown to be coupled in terms of their energy content (see the right plot of 
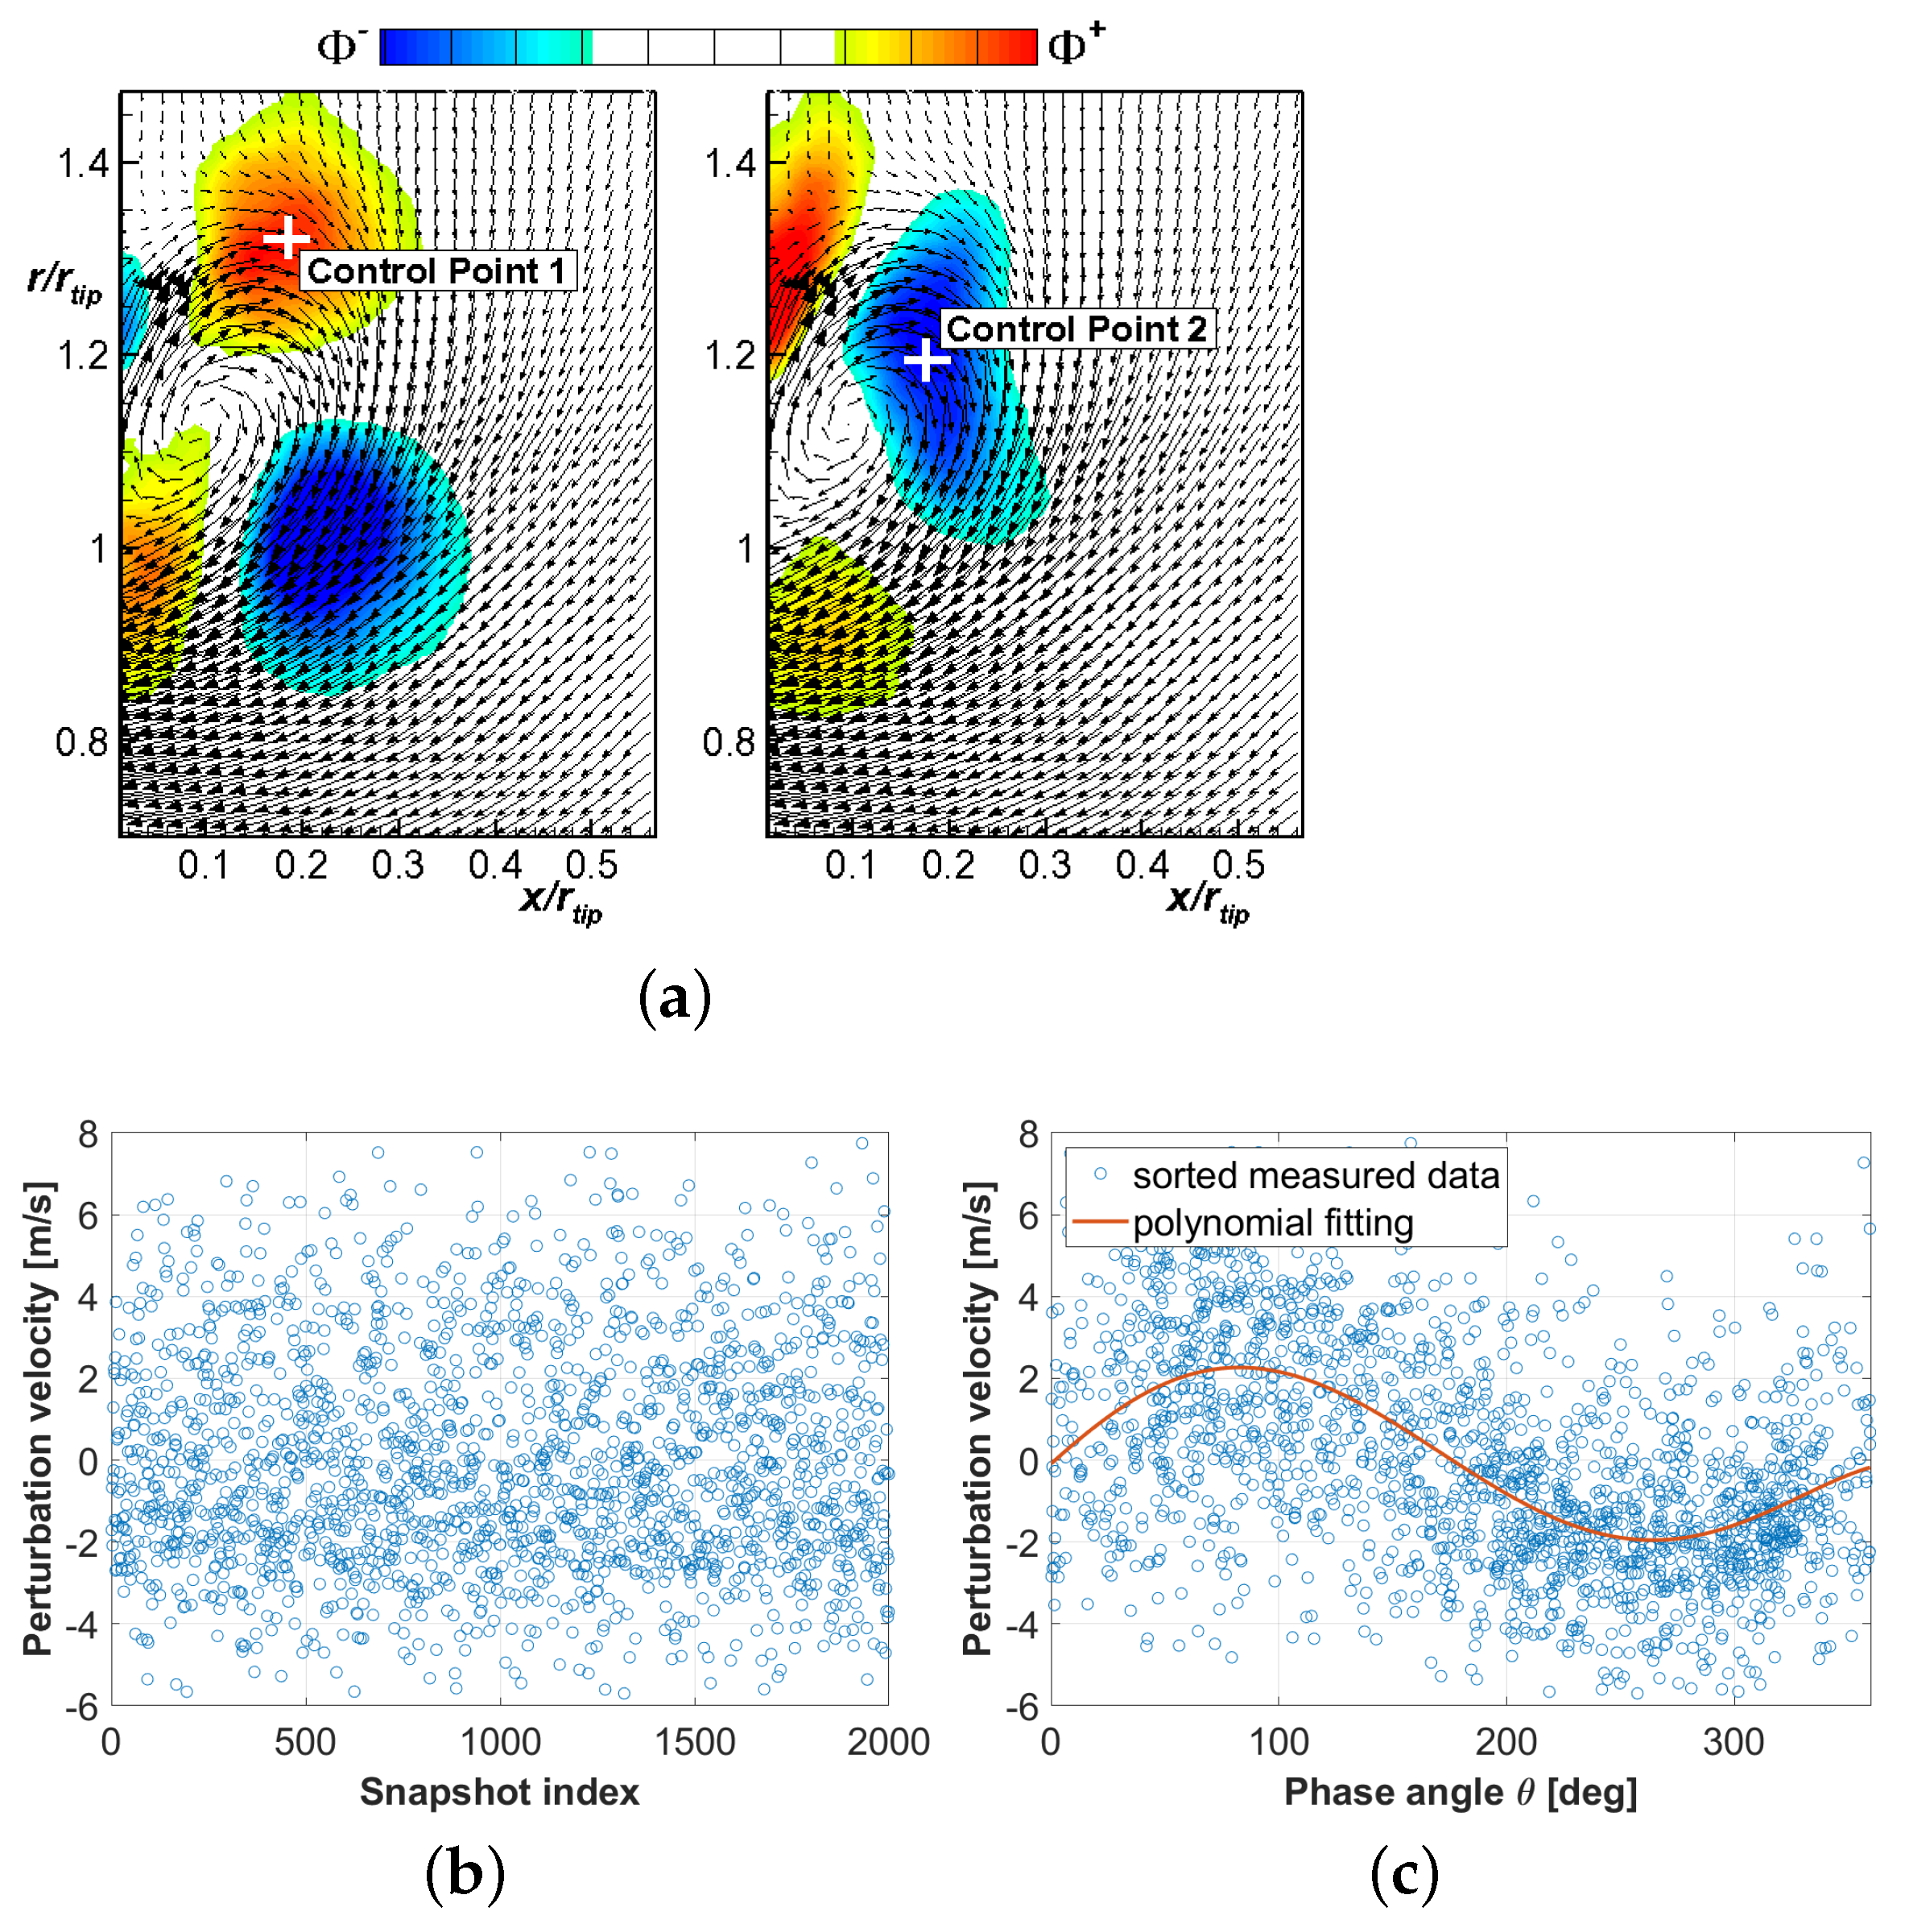
Figure 3, squared symbols) and their spatial distributions, which are reported in Figure 7a, are similar but shifted in the mean flow direction. According to Legrand et al. [19], these modes are therefore representative of the same periodic convective structures and can be used for the computation of a POD-based phase averaged velocity field. This may highlight the existing link between the periodic patterns captured by the modes and the oscillating behavior characterizing the leakage flow for Ψ = 0.0899 . According to Equation (5), the phase related to each snapshot has been computed based on modes 3 and 4. To do that, two control points have been chosen in regions with the opposite sign of the modes (see the white crosses in Figure 7a). Once the correct phase angle is assigned to each flow record, the PIV snapshots can be re-ordered, and then the corresponding phase averaged field can be computed. 
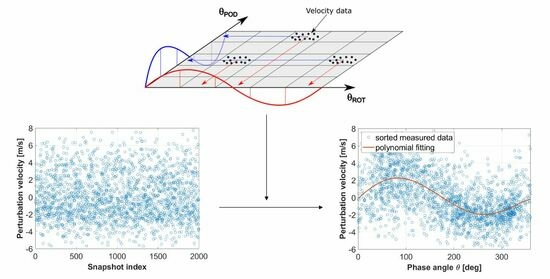
Figure 7b reports the rotor-unrelated fluctuations in the radial direction probed at the control point 1. Notice that the PIV snapshots have been acquired with a sampling rate that is significantly smaller than the characteristic frequencies of the flow field; thus, the flow records are randomly positioned within the main period highlighted by the modes. Instead, Figure 7c reports the sorted velocity values plotted versus the phase angle assigned to the corresponding snapshots. Additionally, the phase-averaged values obtained by means of a fifth-order polynomial fit to the phase-sorted velocity data are reported with a solid red line, showing a well defined periodic pattern. The present method has been applied to all measuring points to compute a POD-based phase averaged field retaining the periodic coherent motions that are not related to the rotor angular position.
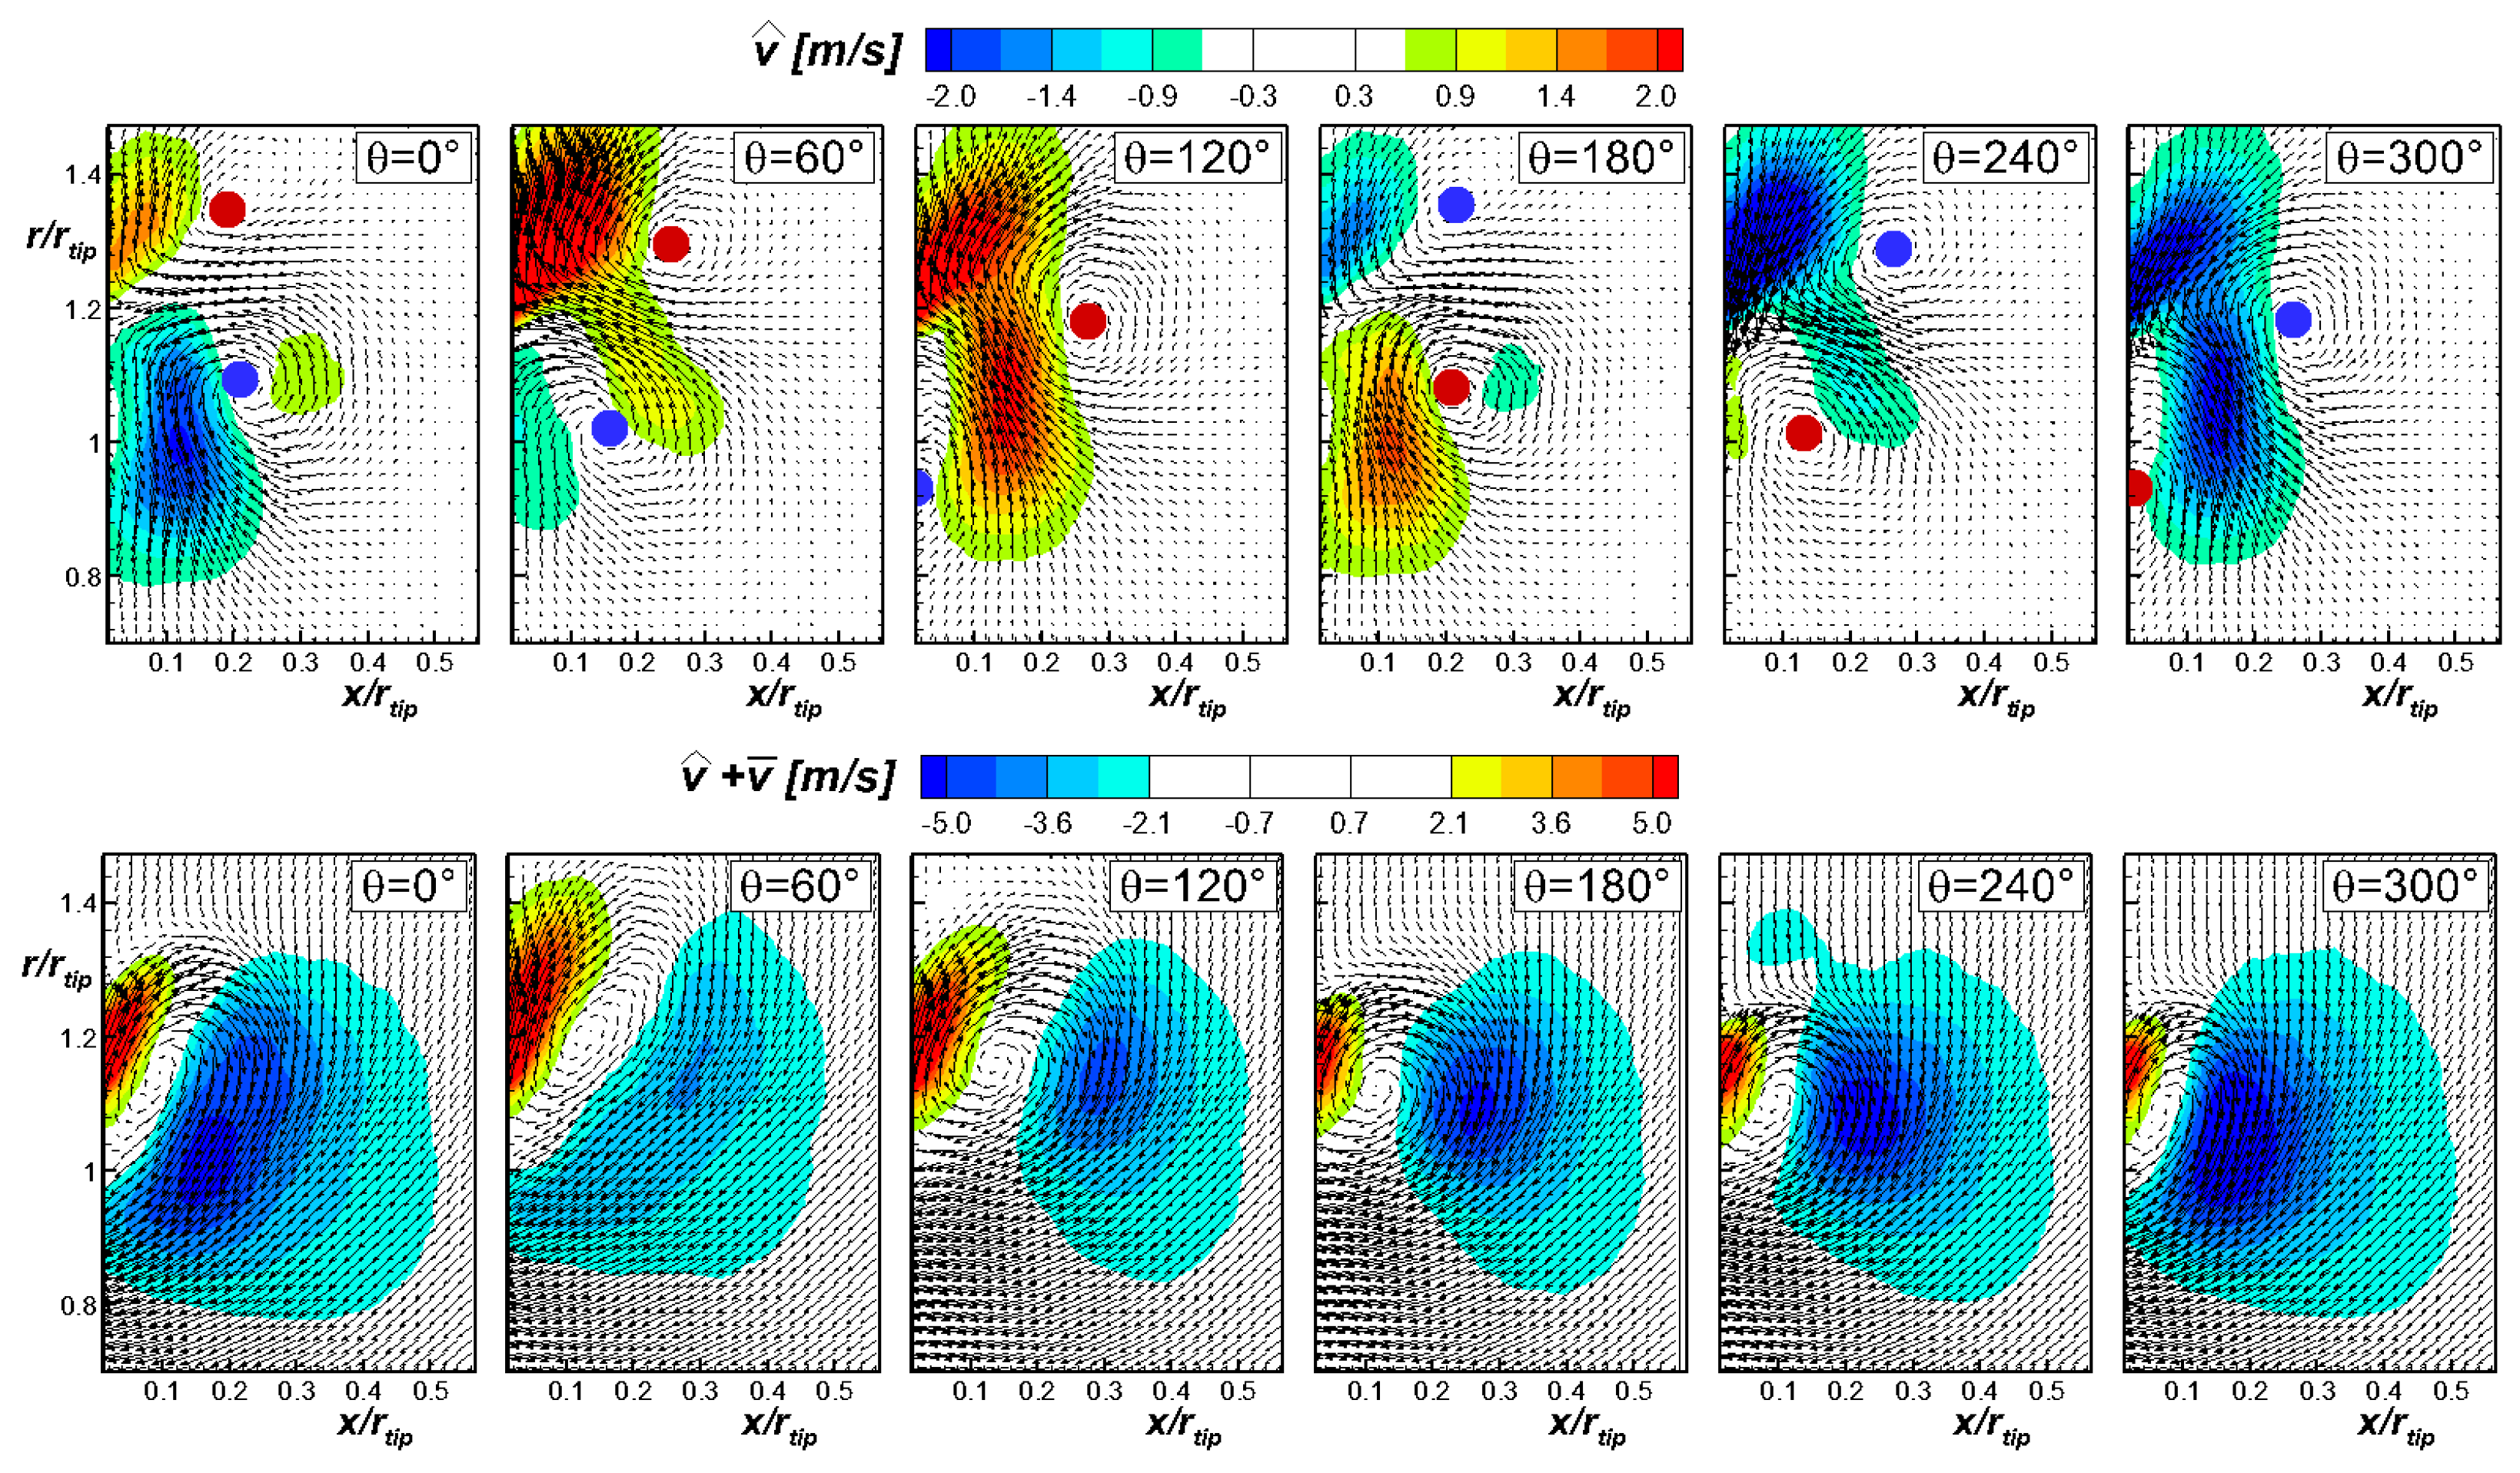
The top plot of Figure 8 reports the POD-based phase averaged fluctuating velocity field ( u ^ , v ^ ) at different phase angles, while in the bottom plot, the contribution of the time-mean velocity is also included, i.e., ( u ^ + u ¯ , v ^ + v ¯ ) . The contour plot of v ^ is also superimposed to the corresponding vector fields. It is mentioned here that even if the phase angle of each snapshot is computed with reference to modes 3 and 4 of the radial velocity only, the phase averaged field is computed considering all the dominant modes. The snapshots reported in the top plots of Figure 8 depict counter rotating vortices that form near the blade tip (see the red and blue circles in the plots). These are the signatures of vorticity tubes that evolve in the tangential direction as described by Canepa et al. [3]. Once formed, they rotate and then move towards the rotor inlet section (see the plots at θ = 120 and 300 ). For 300 < θ < 360 , a new vortex-like structure is expected to occur outside of the measuring plane ( r / r t i p > 1.3 ). Such a structure moves at lower radii leading to the flow pattern observed in the first plot ( θ = 0 ). It is worth noting that the periodic fluctuations highlighted by the present procedure are characterized by the inversion of the radial velocity component from the largest positive values observed for θ = 60 to the most negative ones occurring for θ = 240 . This is further highlighted in Figure 9, showing the velocity data probed above the blade tip at x / r t i p = 0.05 and r / r t i p = 1.3 . The same trend was not observed instead in the rotor-based phase-averaged field (see Canepa et al. [3]). Interestingly, when the periodic fluctuations depicted in the top plots of Figure 8 are added to the time-mean velocity field (bottom plots), this latter exhibits a marked vertical motion in the surrounding area of the rotor gap. The large scale vortical structure centered at about r / r t i p = 1.1 for θ = 0 stretches in the vertical direction, and v again switches from negative to positive values for r / r t i p > 1.22. The present results clearly indicate that the oscillating behavior and the mean flow deformation observed for ψ = 0.0889 are linked to the periodic motion of the coherent structures related to modes 3 and 4 of v, which is independent of the rotor position. The computation of its own frequency would therefore be of great relevance. Nevertheless, it may not be directly provided from the present set of measurements due to the low sampling rate adopted. Further investigations will be carried out in a dedicated work for the detailed inspection of the frequency content of the flow patterns depicted in Figure 8.
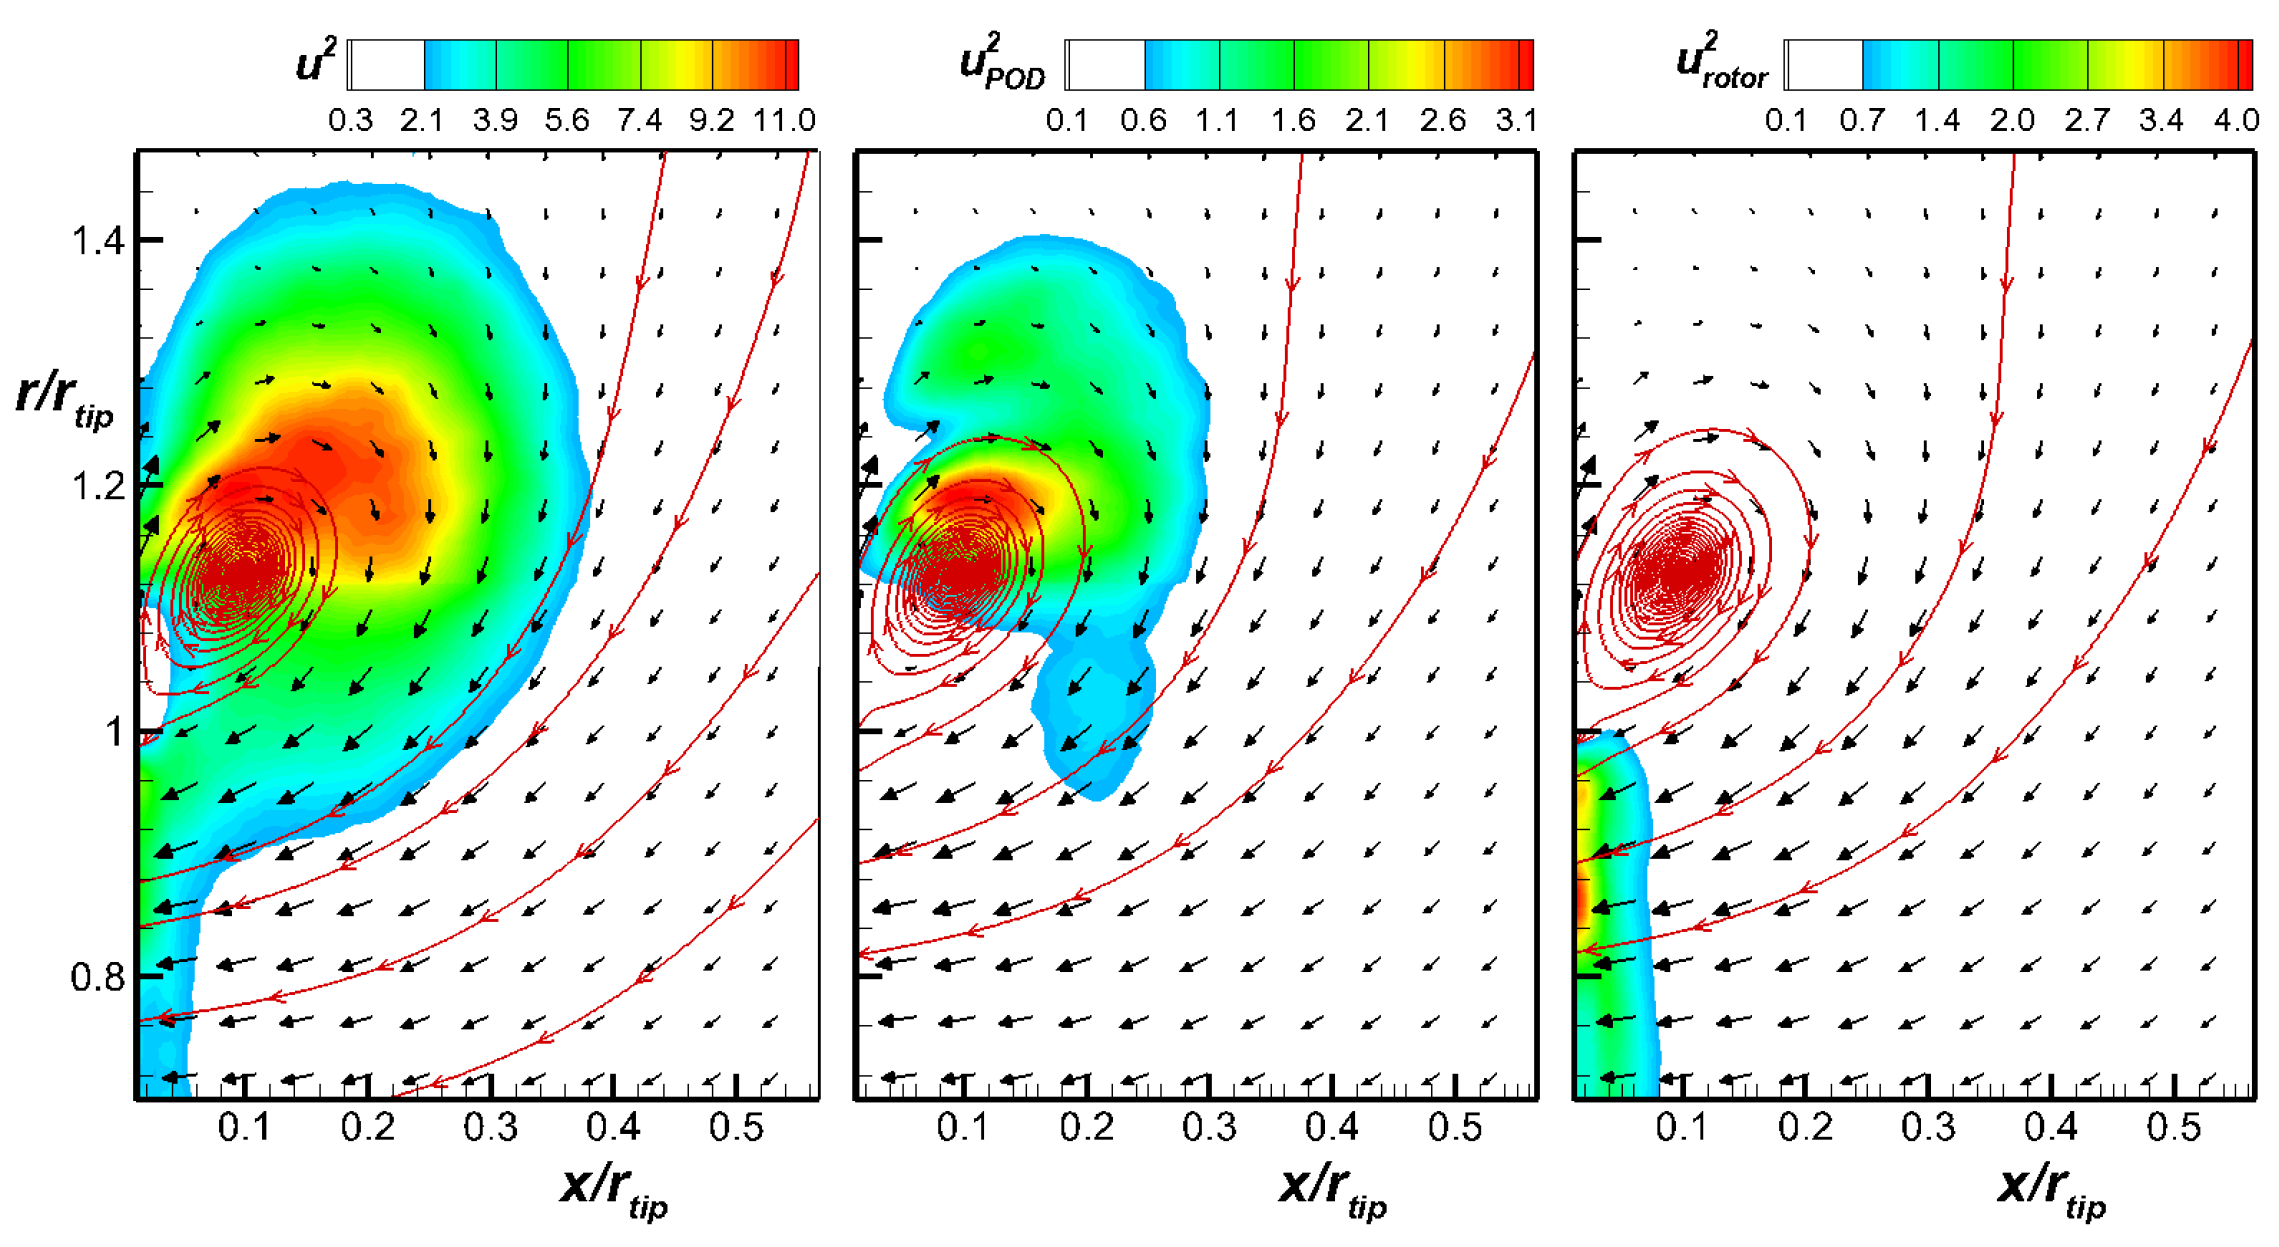
With the aim of inspecting the regions of the measuring plane that are mostly affected by the coherent motions embedded in the flow, the energy of the periodic fluctuations provided by the rotor-based and POD-based phase averaging procedures has been computed. The so-derived energy distributions are compared in Figure 10 snd Figure 11 with the energy of the overall axial and radial fluctuating velocities. The highest energy of the rotor phased field (subscript r o t o r ) are found in the blade and the gap regions for both the velocity components. In contrast, the energy of the periodic motions highlighted in Figure 8 is maximum above the rotor gap. This further highlights the role of the rotor-unrelated fluctuations in promoting the vertical motion of the leakage flow above the gap region. Moreover, the energy of the POD phased radial fluctuations are significantly larger than those phased with the rotor period. When comparing the contributions due to the periodic sources of unsteadiness with the overall energy of fluctuations, one can see that this latter is much larger compared to the others. This indicates that the unresolved unsteadiness plays a key role in the definition of the overall energy of fluctuations, especially for what concerns the radial velocity component. In the next section, the POD- and the rotor-based phase averaged fields are referred to for the computation of the phase averaged distributions of the quasi turbulent kinetic energy and its production, thus showing the effects of the different periodic source of unsteadiness on turbulence generation and transport.

4.4. Phase Averaged Distributions of Quasi Turbulent Kinetic Energy and Its Production

This section reports the phase-averaged TKE distributions based on the blade period and the periodic motion extracted by the modes. Additionally, the TKE production has been computed based on phase averaged quantities (see e.g., Michelassi and Wissink [21]):
P T K E = u 2 ¯ u ^ x + v 2 ¯ v ^ r + u v ¯ u ^ r + v ^ x
where · denotes phase dependent quantities, ( u , v ) is the turbulent velocity field, and ( u ^ , v ^ ) is the phase averaged one. The stress terms appearing in Equation (6) have been computed from the non-periodic unsteadiness, which has been obtained by subtracting the rotor- and POD-based phase averaged fields from the overall fluctuating velocity. Then, the measured data have been sorted based on the corresponding phase index of the two periodic patterns and then combined with the strain tensor accounting for the deformation of the mean and phase dependent fields.
Figure 12 shows the contour plots of the rotor-based phase-averaged turbulent kinetic energy ( T K E R O T ) and its related production ( P T K E R O T ). Plots are shown at the phase angles θ = 0 , 72 , 144 , 216 and 288 . Additionally, the gradient vectors of u ^ and v ^ are depicted with black and red color, respectively, to highlight the regions of high strain. Interestingly, both T K E R O T and P T K E R O T show negligible variations with the phase angle; thus, the turbulent kinetic energy and its production do not depend on the rotor phase. Moreover, the maximum of both quantities is observed in the gap region where the largest gradients of the phase-averaged field occur. Turbulence production is therefore given by the combination of high levels of phase dependent strain with turbulent stresses. It is worth noting that both positive and negative values of P T K E R O T are observed for all phase angles. The occurrence of negative P T K E R O T indicates energy back transfer from the unresolved unsteady field to the corresponding phase-averaged one. However, the integral value of P T K E R O T is positive, thus leading to the increment of the overall turbulence level within the flow field.
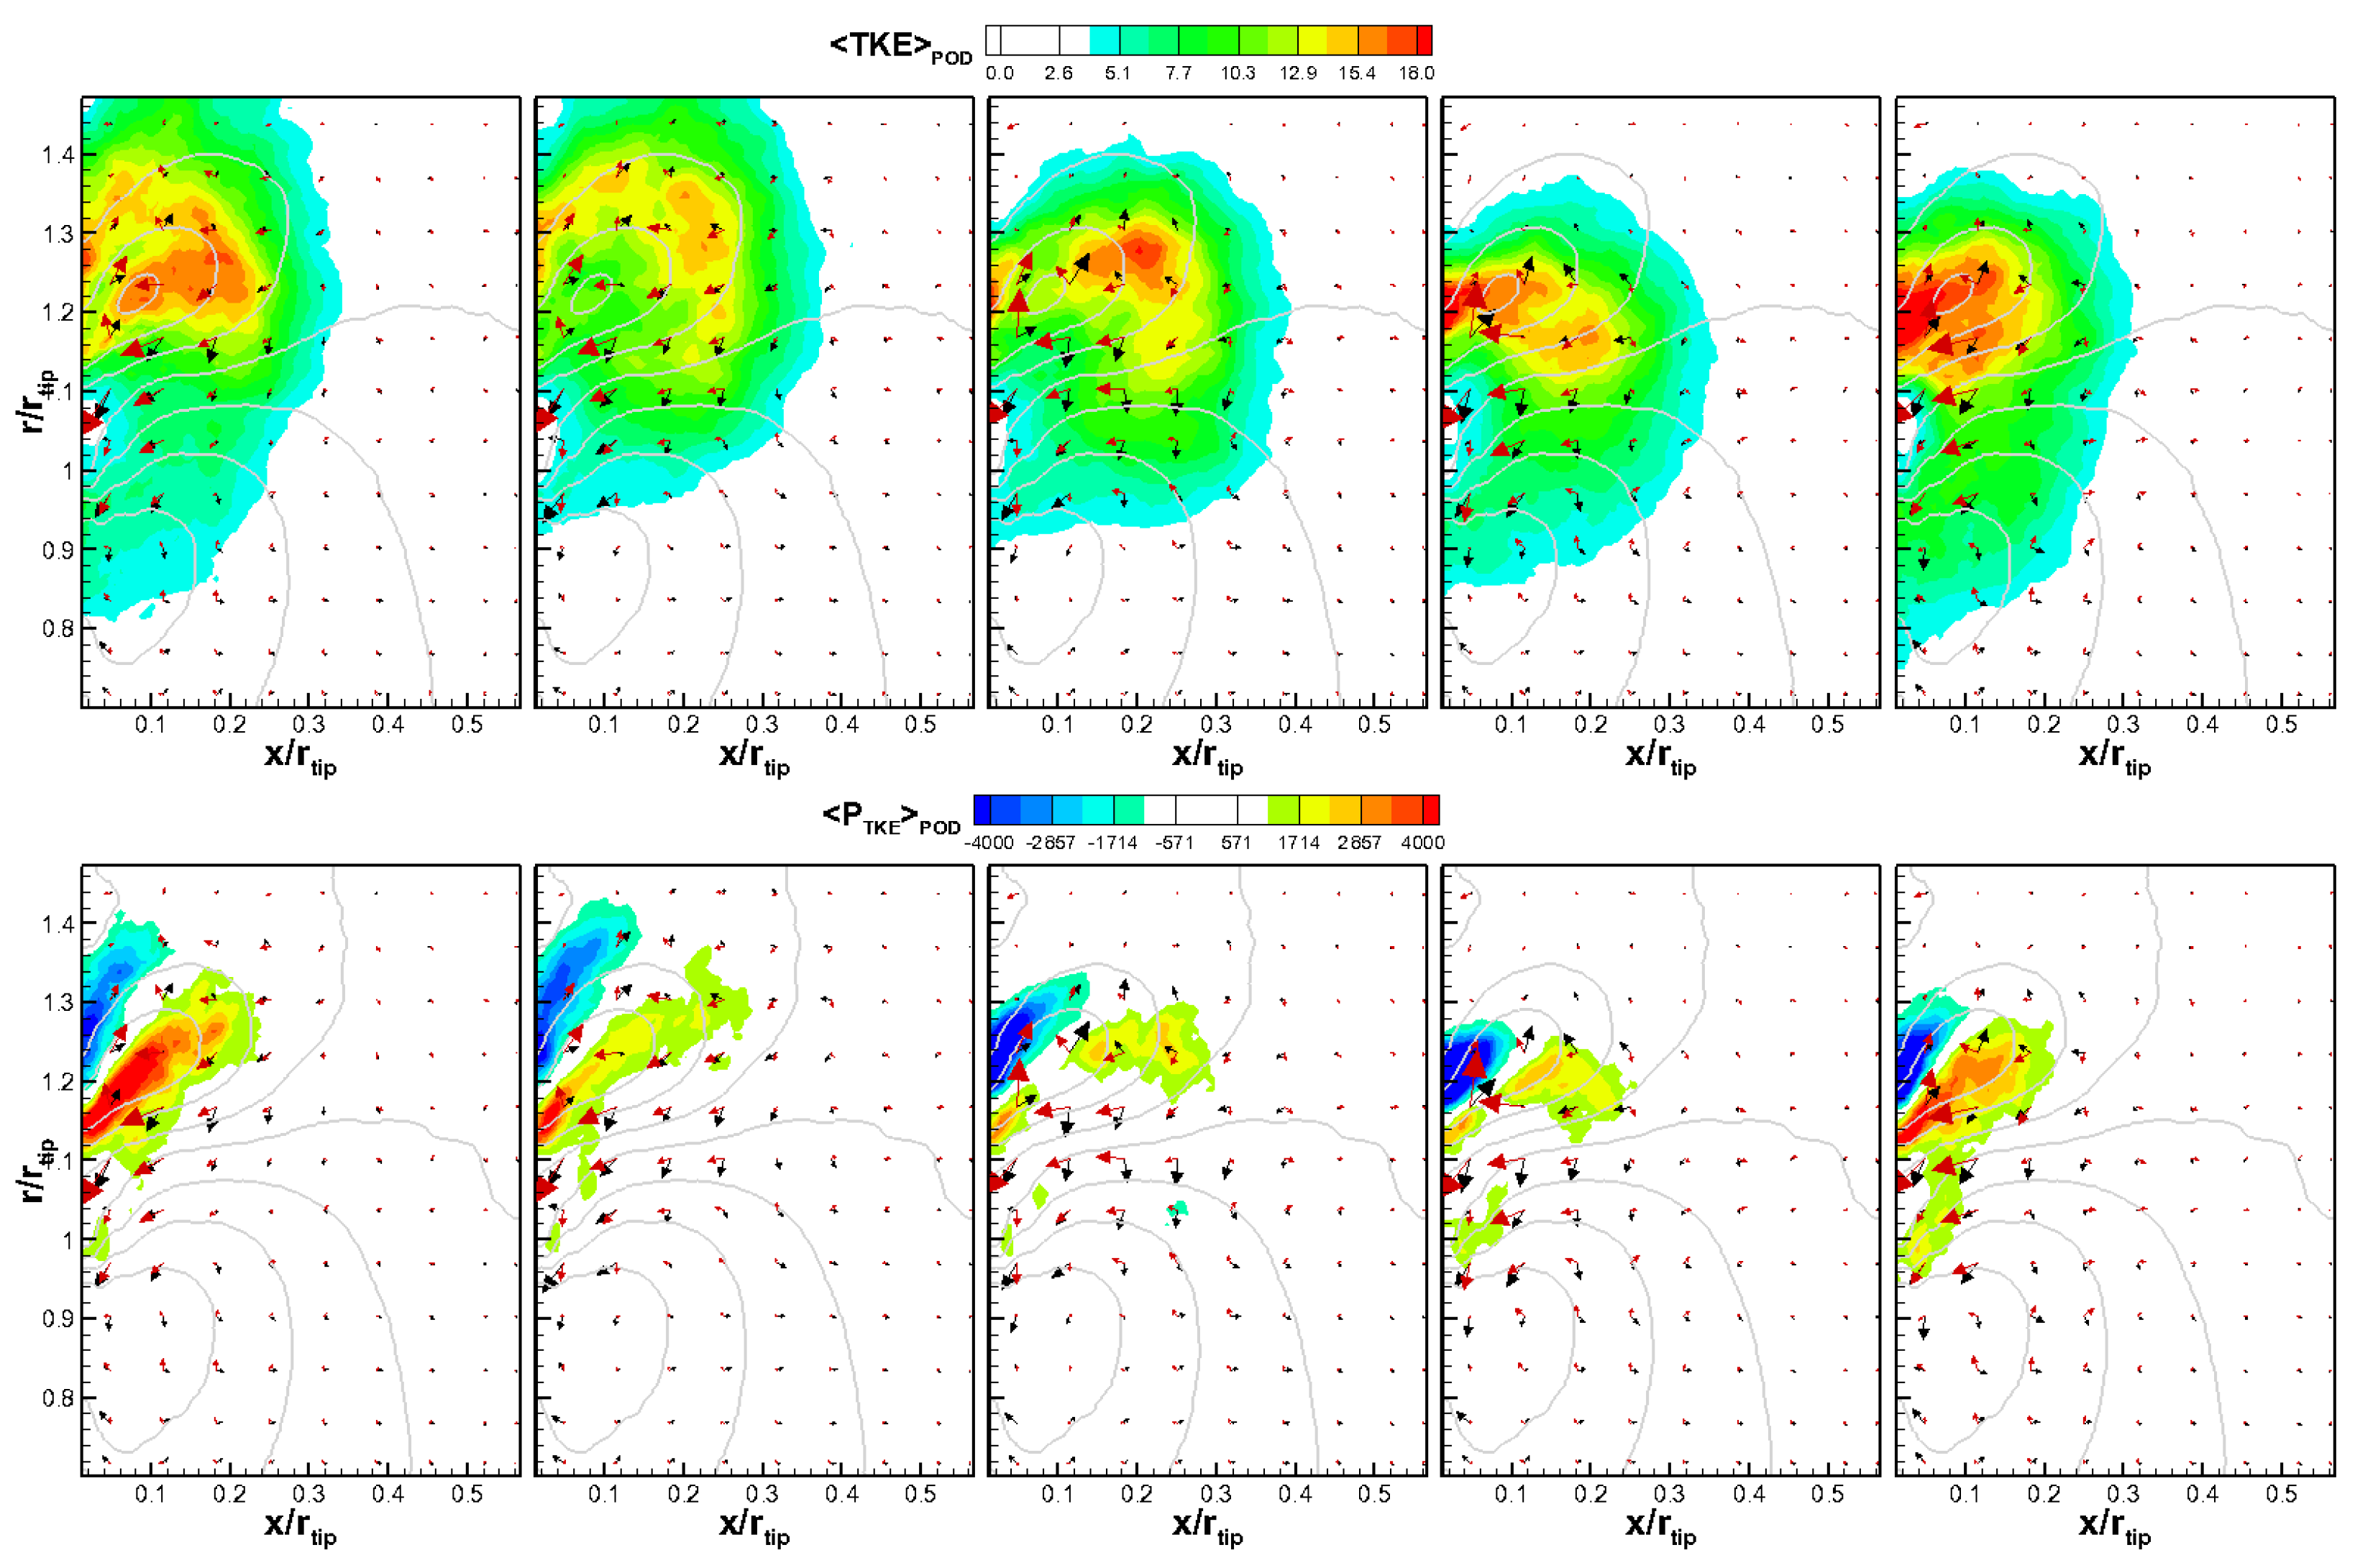
A completely different scenario characterizes the POD-based phase averaged TKE ( T K E P O D ) and related production ( P T K E P O D ), see Figure 13. The T K E P O D distribution shows high dependence on the phase angle in terms of its maximum values and their spatial positions. The highest values of T K E P O D always occur for r / r t i p > 1 , while lower ones are observed in front of the blade. Additionally, the region of maximum TKE moves at different radii within the reference period. This behavior well resembles the one observed in the phase-averaged field reported in Figure 8. This indicates that the periodic pattern highlighted by the POD analysis may cause turbulence transport at different radial locations. Since the interaction between the flow unsteadiness generated by the leakage flow and the rotor may produce different noise levels depending on the region where interaction occurs, the capability of the currently adopted procedure in highlighting turbulence transport due to coherent motions within the flow might be useful for the acoustic optimization of the aerodynamic component tested here. Interestingly, negative values of P T K E P O D dominate; thus, the periodic motion captured by the POD modes is mostly responsible for energy back transfer from the unresolved to the POD-based phased-averaged velocity field. This behavior is different from what has been found based on the rotor-based phase averaging procedure.

5. Conclusions

The present work presented a POD-based analysis of the unsteady leakage flow of an axial fan equipped with rotating shroud. Three values of the loading coefficients have been examined, among which the intermediate loading one has showed a strongly unsteady behavior of the flow leaving the gap. For this operating condition, the leakage flow has been found to move at different radial positions, while it is significantly more stable for the other cases. The POD-based technique adopted here has clearly shown that this behavior is governed by the occurrence of coherent vortical structures characterized by a marked periodicity that is different from the blade passing period. Indeed, the rotor-based phased-averaged field did not show any coherent motions affecting the leakage. Herein, POD-based phase-averaged TKE and P T K E distributions have been computed and then compared to those obtained based on the rotor reference. Rotor-unrelated fluctuations have been shown to provoke high turbulence transport at different radial positions, thus possibly affecting the noise generation of the rotor. The phase averaging procedure here adopted is therefore thought to be functional to the acoustic optimization of a wide range of aerodynamic components, other than that tested here.

Author Contributions

Conceptualization, E.C. and A.C.; methodology, E.C. and M.M.; software, M.D.; validation, M.D. and E.C.; writing—original draft preparation, M.D. and A.C.; writing—review and editing, M.D. All authors have read and agreed to the published version of the manuscript.

Funding

This research received no external funding.

Institutional Review Board Statement

Not applicable.

Informed Consent Statement

Not applicable.

Data Availability Statement

Data are available upon reasonable request to the authors.

Conflicts of Interest

The authors declare no conflict of interest.

Abbreviations

The following abbreviations are used in this manuscript:
PIVParticle Image Velocimetry
PODProper Orthogonal Decomposition
LDVLaser Doppler Velocimetry
TKETurbulent Kinetic Energy
P T K E Production of Turbulent Kinetic Energy
ROTRotor

References

  1. Longhouse, R. Control of tip-vortex noise of axial flow fans by rotating shrouds. J. Sound Vib. 1978, 58, 201–214. [Google Scholar] [CrossRef]
  2. Canepa, E.; Cattanei, A.; Zecchin, F.M.; Milanese, G.; Parodi, D. An experimental investigation on the tip leakage noise in axial-flow fans with rotating shroud. J. Sound Vib. 2016, 375, 115–131. [Google Scholar] [CrossRef]
  3. Canepa, E.; Cattanei, A.; Mazzocut Zecchin, F. Leakage noise and related flow pattern in a low-speed axial fan with rotating shroud. Int. J. Turbomach. Propuls. Power 2019, 4, 17. [Google Scholar] [CrossRef]
  4. Fukano, T.; Takamatsu, Y.; Kodama, Y. The effects of tip clearance on the noise of low pressure axial and mixed flow fans. J. Sound Vib. 1986, 105, 291–308. [Google Scholar] [CrossRef]
  5. Fukano, T.; Jang, C.M. Tip clearance noise of axial flow fans operating at design and off-design condition. J. Sound Vib. 2004, 275, 1027–1050. [Google Scholar] [CrossRef]
  6. Piellard, M.; Coutty, B.B.; Le Goff, V.; Vidal, V.; Perot, F. Direct aeroacoustics simulation of automotive engine cooling fan system: Effect of upstream geometry on broadband noise. In Proceedings of the 20th AIAA/CEAS Aeroacoustics Conference, Atlanta, GA, USA, 16–20 June 2014; p. 2455. [Google Scholar]
  7. Magne, S.; Moreau, S.; Berry, A. Subharmonic tonal noise from backflow vortices radiated by a low-speed ring fan in uniform inlet flow. J. Acoust. Soc. Am. 2015, 137, 228–237. [Google Scholar] [CrossRef]
  8. Moreau, S.; Sanjose, M. Sub-harmonic broadband humps and tip noise in low-speed ring fans. J. Acoust. Soc. Am. 2016, 139, 118–127. [Google Scholar] [CrossRef]
  9. Zenger, F.J.; Renz, A.; Becher, M.; Becker, S. Experimental investigation of the noise emission of axial fans under distorted inflow conditions. J. Sound Vib. 2016, 383, 124–145. [Google Scholar] [CrossRef]
  10. Na, G.D.; Kameier, F.; Springer, N.; Mauß, M.; Paschereit, C. URANS simulations and experimental investigations on unsteady aerodynamic effects in the blade tip region of a shrouded fan configuration. Turbo Expo Power Land Sea Air. Am. Soc. Mech. Eng. 2017, 50770, V001T09A003. [Google Scholar]
  11. Canepa, E.; Cattanei, A.; Jafelice, F.; Zecchin, F.M.; Parodi, D. Effect of rotor deformation and blade loading on the leakage noise in low-speed axial fans. J. Sound Vib. 2018, 433, 99–123. [Google Scholar] [CrossRef]
  12. Canepa, E.; Cattanei, A.; Zecchin, F.M.; Parodi, D. Large-scale unsteady flow structures in the leakage flow of a low-speed axial fan with rotating shroud. Exp. Therm. Fluid Sci. 2019, 102, 1–19. [Google Scholar] [CrossRef]
  13. Canepa, E.; Cattanei, A.; Moradi, M.; Nilberto, A. Experimental Study of the Leakage Flow in an Axial-Flow Fan at Variable Loading. Int. J. Turbomach. Propuls. Power 2021, 6, 40. [Google Scholar] [CrossRef]
  14. Zhu, T.; Lallier-Daniels, D.; Sanjosé, M.; Moreau, S.; Carolus, T. Rotating coherent flow structures as a source for narrowband tip clearance noise from axial fans. J. Sound Vib. 2018, 417, 198–215. [Google Scholar] [CrossRef]
  15. Dellacasagrande, M.; Canepa, E.; Cattanei, A.; Moradi, M. Characterization of the unsteady leackage flow in an axial fan. In Proceedings of the 15th European Turbomachinery Confeerence, Paper n. ETC2023-187. Budapest, Hungary, 24–28 April 2023; Available online: https://www.euroturbo.eu/publications/conference-proceedings-repository/ (accessed on 3 September 2023).
  16. Lengani, D.; Simoni, D.; Ubaldi, M.; Zunino, P. POD analysis of the unsteady behavior of a laminar separation bubble. Exp. Therm. Fluid Sci. 2014, 58, 70–79. [Google Scholar] [CrossRef]
  17. Lumley, J.L. Stochastic Tools in Turbulence. Appl. Math. Mech. 1970, 12, 1–194. [Google Scholar]
  18. Sirovich, L. Turbulence and the dynamics of coherent structures. Part I–III. Q. Appl. Math. 1987, 45, 561–590. [Google Scholar] [CrossRef]
  19. Legrand, M.; Nogueira, J.; Lecuona, A. Flow temporal reconstruction from non-time-resolved data part I: Mathematic fundamentals. Exp. Fluids 2011, 51, 1047–1055. [Google Scholar] [CrossRef]
  20. Simoni, D.; Lengani, D.; Guida, R. A wavelet-based intermittency detection technique from PIV investigations in transitional boundary layers. Exp. Fluids 2016, 57, 145. [Google Scholar] [CrossRef]
  21. Michelassi, V.; Wissink, J.G. Turbulent kinetic energy production in the vane of a low-pressure linear turbine cascade with incoming wakes. Int. J. Rotat. Mach. 2015, 2015, 650783. [Google Scholar] [CrossRef]
Figure 1. (a) Experimental facility; (b) tested aluminum fan prototype; (c) geometry of the rotor gap region and measuring field of view.
Ijtpp 08 00034 g001
Figure 2. Vectorial representation of time-mean flow field with the contour plot of the overall TKE [ m 2 / s 2 ] superimposed. The cases Ψ = 0.0788 , 0.0899, and 0.103 are presented.
Ijtpp 08 00034 g002
Figure 3. Energy of (a) u v -modes and (b) v-modes for ψ = 0.0788 , 0.0889, and 0.103. POD results are obtained considering the quota of velocity fluctuations that are unrelated to the rotor position.
Ijtpp 08 00034 g003
Figure 4. (Top plots): vectorial POD modes of rotor-unrelated fluctuations (from top to bottom Ψ = 0.0788 , 0.0899, and 0.103). (Bottom plots): p d f of vortical events superimposed to the time-mean flow streamlines; probability density functions are computed considering the overall fluctuating velocity field.
Ijtpp 08 00034 g004
Figure 5. Cross-correlation matrix of POD modes for the cases (a) ψ = 0.0788–0.0899 and (b) ψ = 0.103–0.0899.
Ijtpp 08 00034 g005
Figure 6. (a) Scatter plot of the POD coefficients 6 and 3 for the case ψ = 0.0899; each symbol refers to a different PIV snapshot, which in the present coordinate system is defined by the the corresponding coefficient values. (b) Probability density function of coefficient 6 for all snapshots; (c) probability density function of coefficient 3 for all snapshots.
Ijtpp 08 00034 g006
Figure 7. (a) Contour plots of normalized modes 3 and 4 of the radial velocity component superimposed to the vectorial representation of the time-mean velocity field; (b) non-sorted perturbation velocity values probed at control point 1; (c) sorted perturbation velocity values probed at control point 1 plotted as a function of the phase angle θ .
Ijtpp 08 00034 g007
Figure 8. (Top): POD-based phase-averaged field of the rotor-unrelated unsteadiness at fixed phase angles. (Bottom): POD-based phase-averaged field of the rotor-unrelated unsteadiness summed up to the time-mean velocity field.
Ijtpp 08 00034 g008
Figure 9. Radial component of POD averaged unresolved velocity v ^ with (red) and without (blue) the contribution of the time averaged field. Data are probed at x / r t i p = 0.05 and r / r t i p = 1.3 .
Ijtpp 08 00034 g009
Figure 10. Contour plots of the energy of axial velocity fluctuations computed from the overall velocity field (left, u 2 ), from the POD phase averaged field (center, u P O D 2 ), and from the rotor-related fluctuations (right, u r o t o r 2 ). The time-mean vector field is reported. Time-mean streamlines are depicted with red color.
Ijtpp 08 00034 g010
Figure 11. Contour plots of the energy of radial velocity fluctuations computed from the overall velocity field (left, v 2 ), from the POD phase averaged field (center, v P O D 2 ), and from the rotor related fluctuations (right, v r o t o r 2 ). The time-mean vector field is reported. Time-mean streamlines are depicted with red color.
Ijtpp 08 00034 g011
Figure 12. (Top): Contour plot of rotor-based phase-averaged turbulent kinetic energy based on blade period T K E R O T [ m 2 / s 2 ] . (Bottom): Contour plot of phase-averaged turbulent kinetic energy production based on blade period P T K E R O T [ m 2 / s 3 ] . Plots are shown at the phase angles θ = 0 , 72 , 144 , 216 and 288 . Black and red vectors represent the axial and radial velocity gradients, respectively, of the phase averaged field. Contour lines of time-mean axial velocity are shown with grey color.
Ijtpp 08 00034 g012
Figure 13. (Top): Contour plot of POD-based phase-averaged turbulent kinetic energy T K E P O D [ m 2 / s 2 ] . (Bottom): Contour plot of POD-based phase-averaged turbulent kinetic energy production P T K E P O D [ m 2 / s 3 ] . Plots are shown at the phase angles θ = 0 , 72 , 144 , 216 and 288 . Black and red vectors represent the axial and radial velocity gradients, respectively, of the phase averaged field. Contour lines of time-mean axial velocity are shown with grey color.
Ijtpp 08 00034 g013
Disclaimer/Publisher’s Note: The statements, opinions and data contained in all publications are solely those of the individual author(s) and contributor(s) and not of MDPI and/or the editor(s). MDPI and/or the editor(s) disclaim responsibility for any injury to people or property resulting from any ideas, methods, instructions or products referred to in the content.

