Article

Inlet Gap Effect on Tonal Noise Generated from a Voluteless Centrifugal Fan

1
Swegon Operations, SE-40125 Gothenburg, Sweden
2
Department of Mechanics and Maritime Science, Chalmers University of Technology, SE-41296 Gothenburg, Sweden
*
Author to whom correspondence should be addressed.
Int. J. Turbomach. Propuls. Power 2022, 7(4), 33; https://doi.org/10.3390/ijtpp7040033
Submission received: 19 August 2022 / Revised: 22 September 2022 / Accepted: 14 November 2022 / Published: 18 November 2022
(This article belongs to the Special Issue Fan Noise, Aerodynamics, Applications and Systems)

Abstract

:
In this study, three voluteless centrifugal fans are compared for their aeroacoustic performances. The tonal noise is predicted by coupling the IDDES with Formulation 1A of Farassat. The sources of the tonal noise at the blade passing frequency ( B P F ) are identified. It is found that the sources are related to the fan inlet gap, which introduces higher velocity intensities and turbulent fluctuations interacting with the blade leading edge. By redesigning the gap, the tonal noise at the B P F is reduced effectively.

1. Introduction

Today, most people spend the majority of their time indoors. The indoor environmental quality (IEQ) has become more and more important. When considering IEQ, we usually think about temperature, CO2 level, and humidity. However, it has been noticed that sound quality is an important factor for good comfort in the indoor environment [1,2].
Nowadays, a ventilation system is usually driven by a voluteless centrifugal fan, which has a gap between the rotating fan front shroud and the stationary inlet duct. The pressure difference between the inner and outer sides of the fan drives air to pass through the gap. As clarified by Hariharan and Govardhan [3], increasing the gap width worsens the blade aerodynamic performance.
There are some previous studies on voluteless centrifugal fans. It was found in both simulations and experiments for a voluteless fan [4] that the tonal noise at B P F is generated from a helical unsteady inlet vortex that interacts with the rotating blades near the fan backplate. Another cause is inflow distortion, which leads to flow separation at the blade root near the backplate [5]. To solve the inflow distortion, flow obstructions were suggested to be placed upstream of the fan inlet [6]. The shape and location of obstructions were found as the key parameters for noise reduction. Schaefer and Boehle [7] found, using the Lattice–Boltzmann solver, that the accuracy of the noise prediction, especially at B P F , is improved when the mesh is refined at the gap and the fan outlet. However, they provided no discussions on the physical mechanisms that are associated with the improved accuracy. In a recent study, the present authors found that for a voluteless centrifugal fan, the tonal frequencies associated with the B P F are related to wall pressure fluctuations at the blade leading edge (BLE) [8]. This is produced when turbulent structures, which are generated by the flow through the gap, interact with the BLE near the shroud. To resolve these turbulent structures, the mesh had to be refined at the gap region.
The numerical simulations in the current study are carried out using a hybrid method coupling the improved delayed detached eddy simulation (IDDES) [9] for the flow simulation with the Ffowcs Williams and Hawkings (FW-H) equation [10] for the noise prediction. The IDDES is used in the flow simulation, and the FW-H is used for the noise prediction.
This study aims to investigate how the tonal noise at the B P F is affected when the gap is modified. Two different gap designs are compared with a reference fan (Case 1), which is the same fan in the previous study [8].

2. Configuration

The baseline fan (Case 1) and the two different designs (Case 2 and Case 3) are illustrated in Figure 1. Case 1 is the same fan as the one examined in [8]. The fan geometry is the same for all three cases, meaning that the blades, shroud, and backplate are the same. There are seven blades in the fan. A clearance (i.e., the gap) is located between the stationary (brown) and rotating parts (gray). Case 2 has larger gap width (wcase2), and Case 3 has smaller gap width (wcase3) than Case 1. The gap width is varied by changing the wall thickness of the inlet duct. The rounded edge of the inlet duct is shorted for Case 2 and extended for Case 3. The inlet duct is moved in the axial direction for the different cases so that the axial overlap between the fan shroud and the inlet duct is the same for all cases. As shown in Figure 1d, the fan and inlet duct are placed in a downstream duct, and the inlet duct is connected to an upstream duct. This simple geometry layout is designed for the numerical simulations. This simplification reduces the geometry complexity but retains the principal flow and acoustic characteristics. The fan and case parameters are listed in Table 1. Here, d1 is the fan intake diameter at the BLE, and d2 is the fan diameter at the blade trailing edge. For the downstream duct, h2 denotes the duct length and d4 the outlet diameter. For the upstream duct, h1 is the duct length and d3 the inlet diameter. In addition, h3 is the distance between the inlet duct and the microphone M1.
The fan rotation speed is 2800 rpm. Given that the fan has seven blades, the B P F is 326.7 Hz. The operation condition is the same as in [7], where the mass flow rate was set to 0.467 kg/s, and this gave a pressure rise of 270 Pa for Case 1.

3. Numerical Methodology

3.1. CFD Method

The air is considered as an ideal gas. The flow is compressible. A finite volume method is utilized to discretize the continuity, momentum, and energy equations. The method employs a segregated flow solver accomplished with the Semi-Implicit Method for Pressure-Linked Equations (SIMPLE) algorithm. The under-relaxation factors for the velocity and pressure in the segregated flow solver are set to 0.7 and 0.4, respectively. The under-relaxation factor for the turbulence equations is 0.7. All simulations are performed using the commercial software STAR-CCM+ [11]. The turbulence is simulated using the IDDES [12] combined with the k-ω SST turbulence model. This setup has been tested in several studies on rotating machinery [13,14]. The normal wall sizes of the first layer cells near all walls fulfill Δ y + < 1 .

3.2. Numerical Settings

The entire computational domain is divided into stationary and rotating parts. The meshes of the stationary and rotating meshes are not conformable at the interfaces between them.
The mass-flow boundary condition is set at the inlet with a uniform velocity distribution. The modeled turbulence intensity is set to I = 4 % according to I = 0.16 R e 1 / 8 , where the Reynolds number is calculated based on the inlet diameter, d 3 [11]. The modeled turbulence length scale is set to l = 0.5   m based on l = 0.7 d 3 , where d 3 is the upstream duct diameter. The pressure-outlet boundary condition is set at the outlet with the static pressure of 101,325 Pa, which is the reference pressure ( p r e f ) in the ambient air. The no-slip boundary condition is specified on all walls.
To ensure the fan performance, the incoming flow at the fan inlet should not be distorted. Furthermore, there should be no flow separation near the fan inlet, especially on the wall in front of the fan gap. These conditions are satisfied in the present study by aligning a straight duct upstream with the fan axis and inserting a small section of the duct into the fan inlet to form the clearance between the duct and the fan.
The time step is set to Δ t = 2.0 × 10 5   s . This gives a maximum convective Courant number of around 10, which is observed at the blade trailing edges. This value fulfills the numerical stability required for the implicit time-marching method. The convective Courant number at the gap region is below 1. The maximum number of inner iterations per time step is set to 12.
The sampling period of the noise is 0.3 s for all cases, corresponding to 14 fan revolutions. The sound pressure level (SPL) is calculated using the von Hann window for 3000 samples per signal section, which leads to a frequency resolution of around 3 Hz. The signal sections do not overlap each other.

3.3. FW-H Equation

A hybrid approach is adopted to predict the noise generated from the flow. In this approach, the IDDES is coupled with Formulation 1A of Farassat [15]. The ambient air density is set to ρ 0 = 1.225   kg / m 3 and the speed of sound c 0 = 340   m / s .
According to Neise [16], the fan noise generation at low Mach numbers is dominated by dipole noise sources that are derived based on the FW-H equation. Hence, the noise prediction in this study considers only an impermeable integral surface for Formulation 1A. The selected integral surface are the fan blades, shroud, and backplate (see Figure 1), while the upstream and downstream ducts as well as the fan inlet duct are neglected. Indeed, there is a limited acoustic reflection from these walls [17].

4. Mesh

We adopt the same mesh generation strategy that was developed and evaluated in [8], where the fan is the same as Case 1. A polyhedral mesh generation method was used to produce prism layers near the walls and polyhedral cells in the rest of the computational domain. The use of polyhedral cells for turbomachines was demonstrated in [17,18]. The growth rate is set to 1.05, as suggested in [19]. The most important finding in the mesh study performed in [8] was that a local mesh refinement has to be made at the regions extending from the gap to the BLE and along the shroud to the blade trailing edge (colored in dark grey), as illustrated in Figure 2. The same mesh distribution and refinement are used for the three cases. The mesh parameters are listed in Table 2.

5. Results and Discussion

5.1. Identifying Sources for Tonal Noise for Case 1

The contours of vorticity magnitudes ω at the blade leading edge for Case 1 is shown in Figure 3a. There are regions with high vorticity magnitude upstream of the BLE. Here, the BLE is marked out with a dashed line. They are generated when the gap flow is mixed with the main flow. This phenomenon was also observed in previous studies [8,20]. The black dashed line is a monitoring line positioned at the BLE of one blade, and it extends from the backplate to the shroud. The monitoring line follows the blade as the fan rotates, and the wall pressure is monitored for 12 fan revolutions. The root mean square (RMS) of the wall pressure fluctuations is shown in Figure 3b. At the position nearest the shroud, the RMS has its highest value. As the distance to the shroud increases, the pressure RMS value decays. At the backplate, the pressure RMS value is 5 Pa, which is approximately 4% of the value at the shroud (129 Pa).
The time history of the wall pressure at the monitoring line is shown in Figure 4. At the position on the shroud, the pressure fluctuates with large amplitudes and high frequencies. As the distance from the shroud increases, the amplitudes of pressure fluctuations decrease. Small fluctuations are observed at the middle position. At the backplate, fluctuations are almost negligible.
Moreover, a periodic low-frequency fluctuation in relation to the fan revolution is observed, which was also found in [21]. By comparing the three monitoring points, high-frequency fluctuations decay rapidly with increased distance to the shroud. The periodic low frequency is predominant at the middle position and at the backplate.
Based on the band-filtered power spectral density(PSD) of the wall pressure fluctuations, the location and magnitudes of dominant tonal noise sources are evaluated. The results at the tonal frequency B P F (326.7 Hz) are illustrated in Figure 5. The PSD is calculated using the von Hann window for 3000 samples per signal section, which leads to a frequency resolution of around 3 Hz. The signal sections do not overlap each other. The location of the highest wall pressure fluctuations is at the same position (the BLE close to the shroud) as the region with high vorticity magnitudes, high-pressure RMS value, and largest pressure fluctuation. Hence, the interaction between inlet-gap turbulence and the BLE is responsible for the tonal noise generation. This was also found for Case 1 in a previous study [8]. This approach is therefore selected when the three cases are compared in the following analysis.

5.2. Fan Performance Comparison

The static pressure excluding the reference pressure p r e f = 101,325   Pa is displayed along the axial symmetric line for the three cases in Figure 6. All cases show similar pressure amplitudes in the upstream duct of the fan, while differences are seen downstream. Case 3 has the highest pressure, and Case 2 has the lowest. The difference in the pressure rise downstream of the fan is only due to the gap design. Hariharan and Govardhan clarified [3] that when the gap width is increased, the blade aerodynamics performance is worsened. In addition, when the gap width is decreased, the performance is improved, which is seen in Figure 6. According to Lee [20], a smaller gap improves the flow when it turns from axial to radial, and it also improves the flow separation conditions at the blade trailing edge.

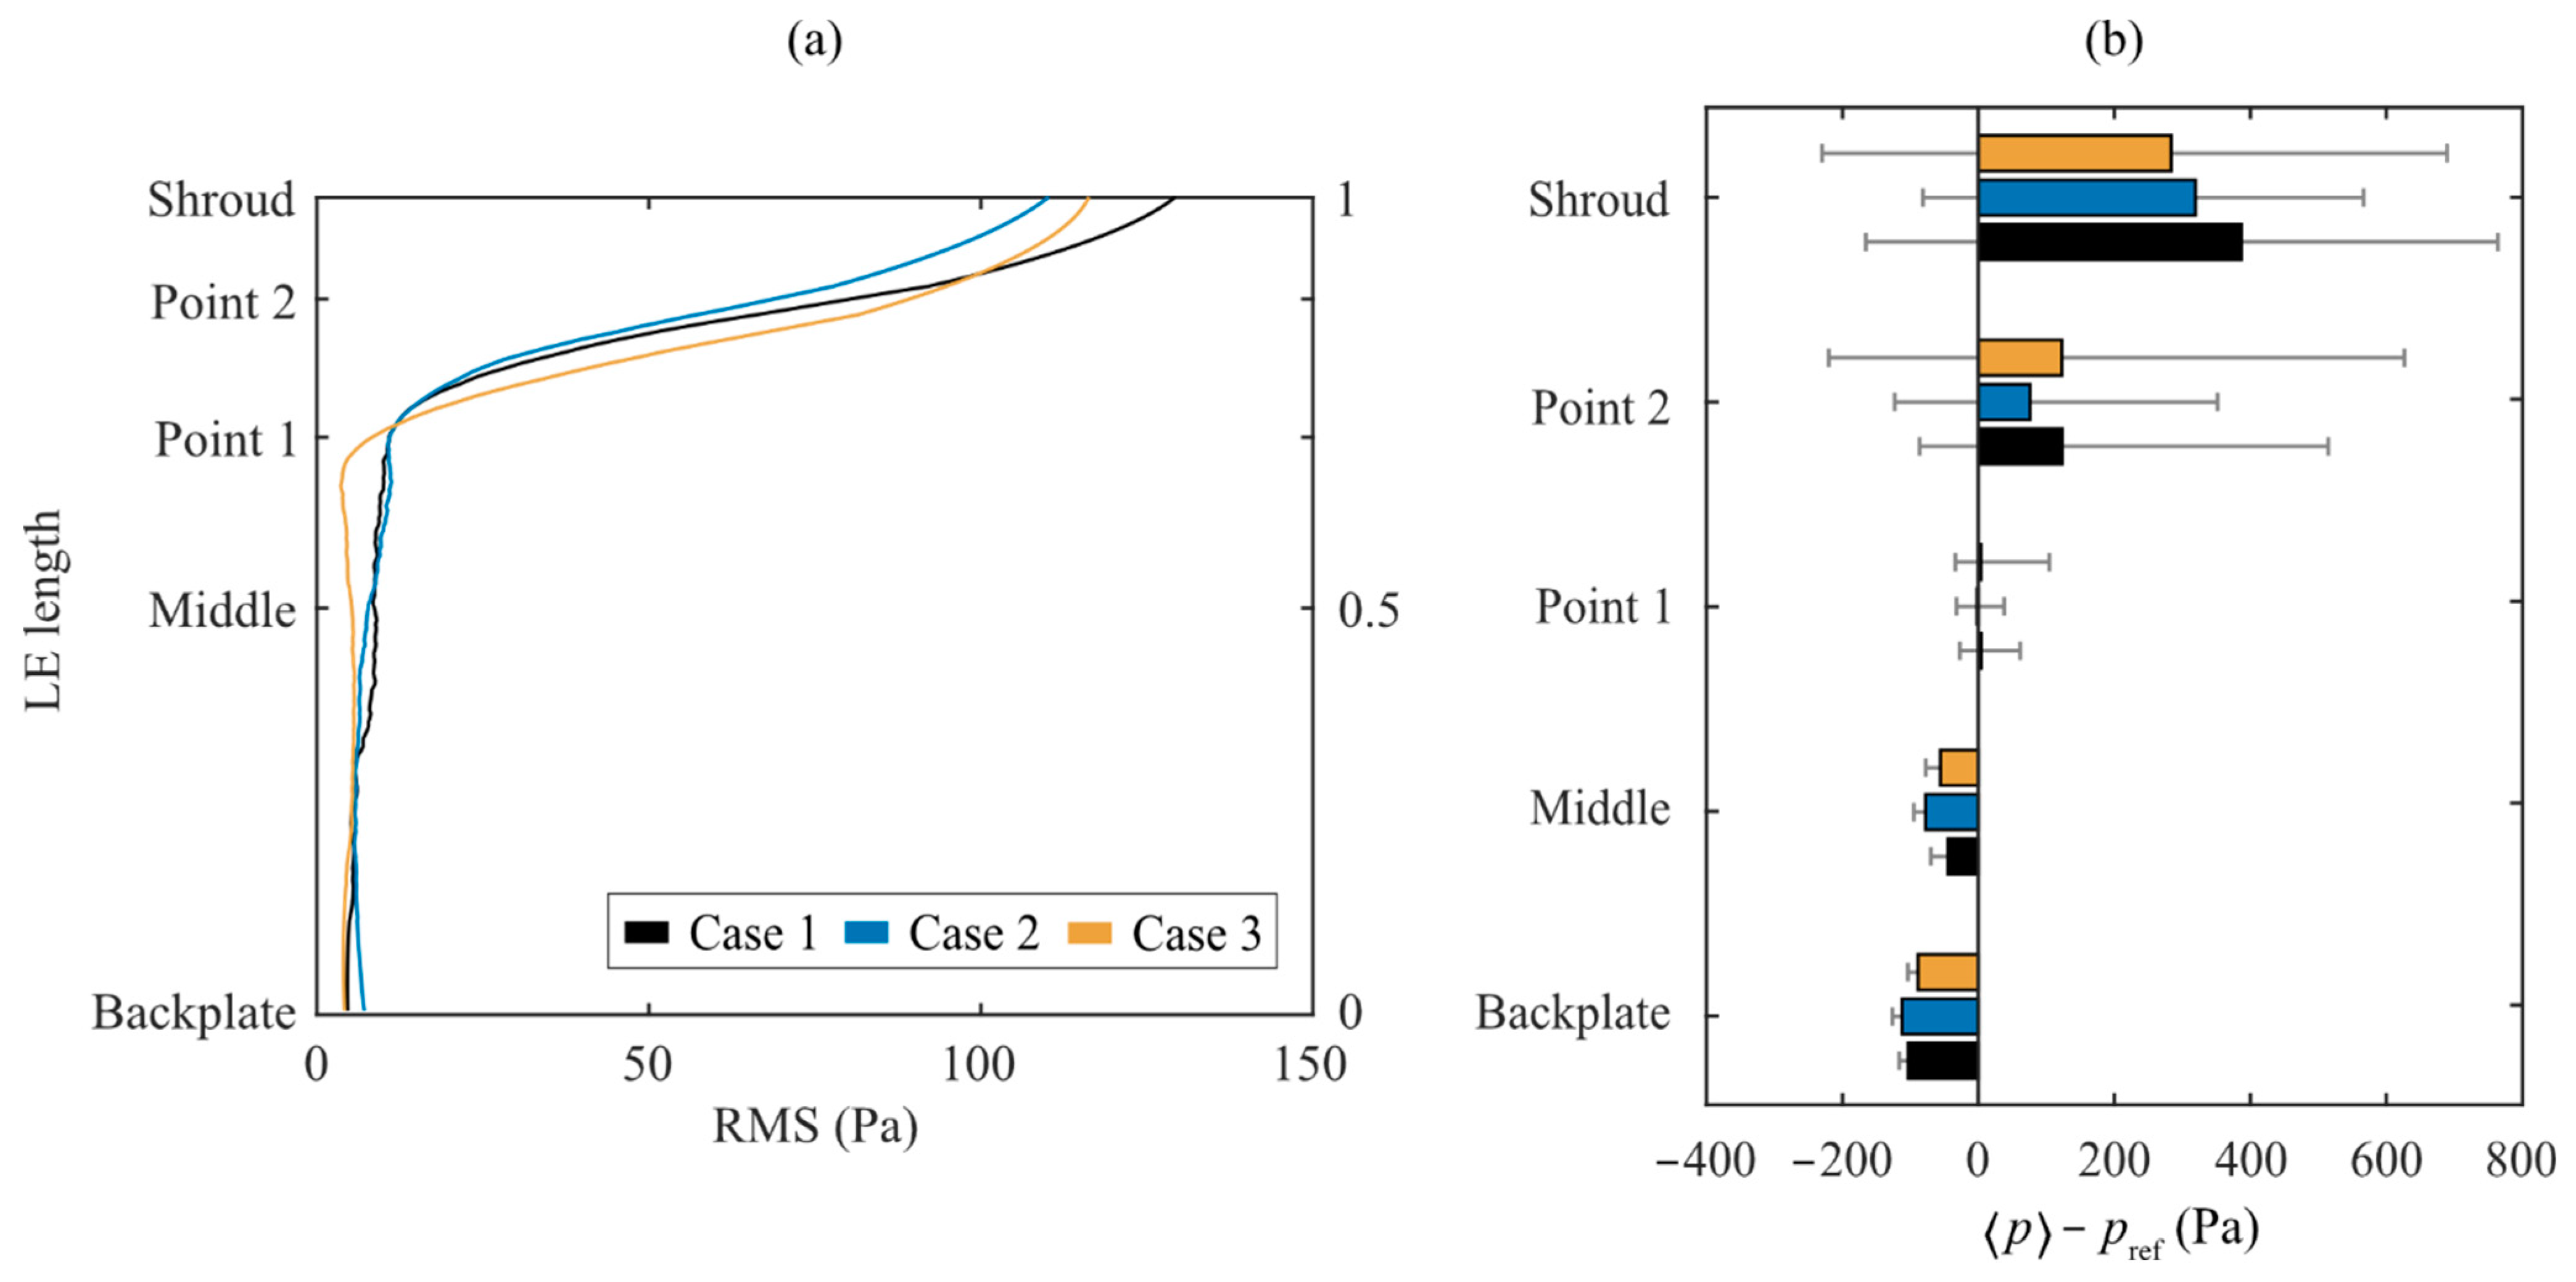
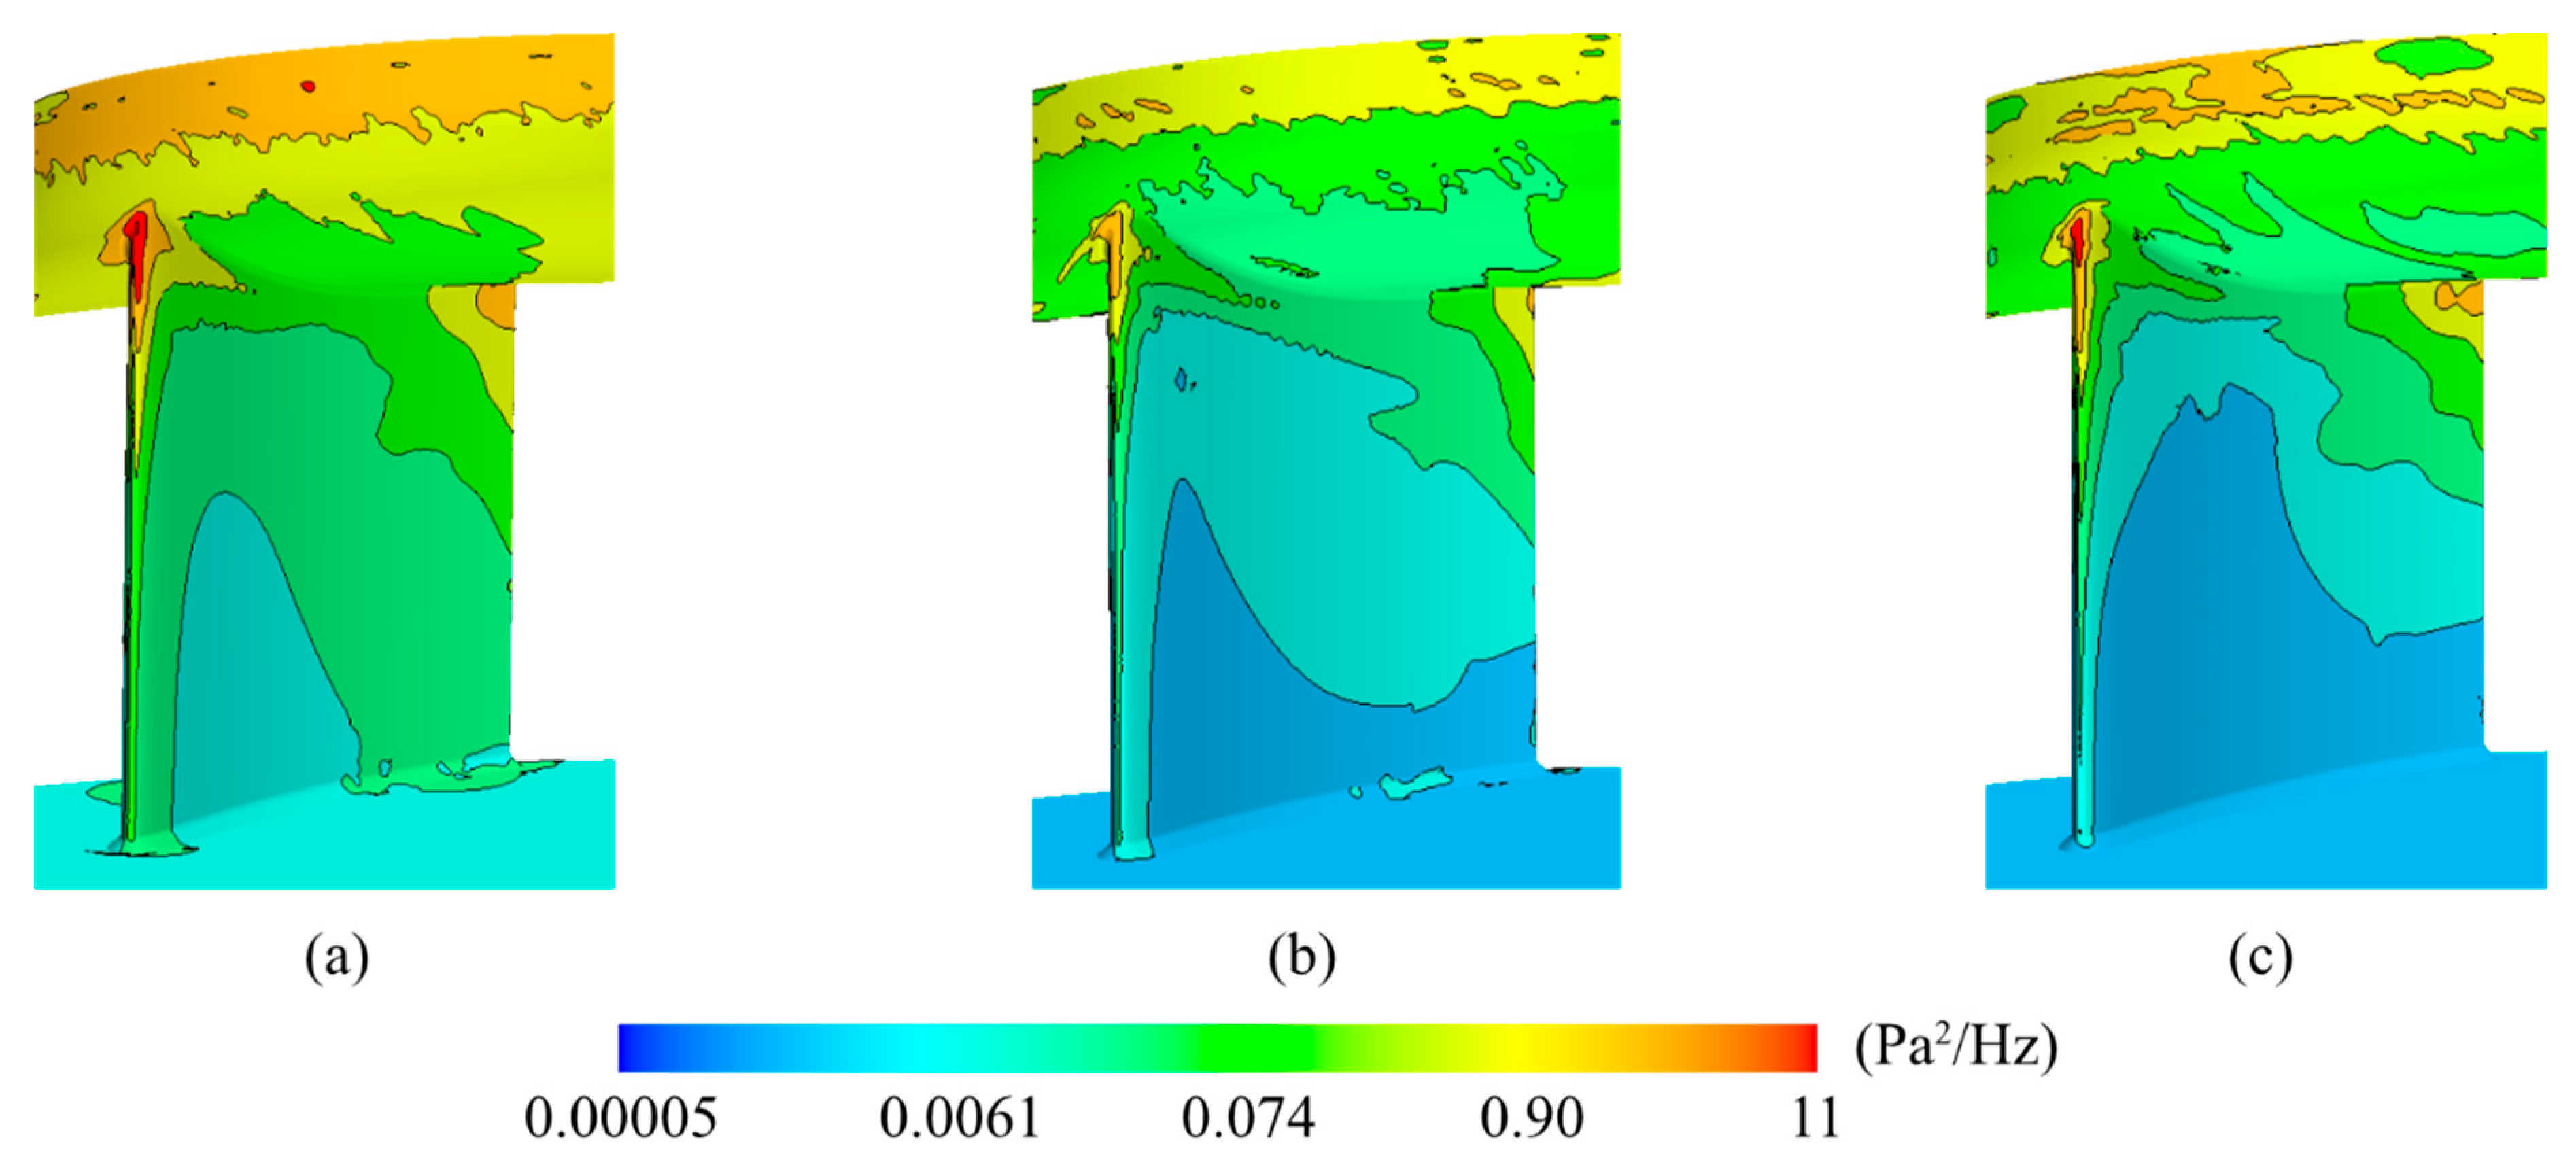
5.3. Wall Pressure Fluctuations Comparison

The RMS of pressure fluctuations at the monitoring line at the BLE (described in Figure 2a) are illustrated for all cases in Figure 7a. At the position nearest the shroud, the highest pressure RMS value is observed for all cases. The pressures’ RMS values have the same physical behavior for all three cases, and when the distance to the shroud increases, the pressure fluctuations decay. From the shroud to the backplate, Case 2 has the lowest pressure RMS value, and Cases 1 and 3 have the highest. At the backplate, the cases have almost the same pressure RMS value, approximately 4% of the maximum value.
The time-average of the wall pressures at the BLE are shown at different positions for all cases in Figure 7b. The maximum values for all cases occur at the shroud, whereas at the backplate, the values are negative. The amplitudes of the maximum and minimum pressure (error bar) are the largest at the shroud, and it becomes smaller when the distance from the shroud increases for all cases. At the shroud, Case 1 has the highest amplitude. Case 2 has the lowest amplitudes at all positions. At point 2, the maximum positive fluctuations are larger than the magnitude of the negative ones, and it is the same for all cases.
Figure 8 shows the time history of the wall pressure for all cases at point 2 during 12 fan periods. The dashed lines indicate the average value for each case, and as illustrated in Figure 7b, it is lowest for Case 2. For Cases 1 and 3, pressure fluctuations with large amplitudes and high frequencies are observed. Fluctuations are also obvious for Case 2, but the amplitudes are smaller. Moreover, a periodic low-frequency fluctuation in relation to the fan rotation is seen for Case 2, which was also found in [21]. For Cases 1 and 3, there is no clear periodic low-frequency fluctuation. For all the cases, the maximum absolute values of the positive fluctuations are larger than those of the negative fluctuations. The reason is due to the upstream turbulent vortex impingement.
The contours of the velocity magnitudes, v R , defined in Equation (1), in the y-z plane (see Figure 1) and the streamlines (colored in gray) of the relative velocity vectors in Plane 1 (location see Figure 1a) are shown for all cases in Figure 9. Note that the axial velocity component along the fan rotation axis is excluded from the vectors. For Case 1 and 3, there are regions with large velocity magnitudes near the shroud. These regions appear periodically in relation to the blade positions. These regions cannot be observed for Case 2. This suggests that the flow near the shroud is highly fluctuating due to the gap turbulence and that Case 2 has less turbulence above the blades (near the fan inlet).
v R = v y 2 + v z 2  
In the previous studies of Case 1 where the numerical prediction was compared with experimental data [17,21], it was shown that SPL at B P F was best-predicted upstream of the fan. The SPL predicted upstream of the fan (microphone M1) for the tonal frequency B P F is compared between the cases in Figure 10. Case 1 and 3 have almost the same B P F amplitude. The lowest B P F amplitude has Case 2, where the level decreased by 5.7 dB compared with Case 1. These results agree with the results from Figure 7, Figure 8 and Figure 9, where Case 2 had the lowest wall pressure on the BLE.
The cases are compared for their aerodynamic and acoustic performance in Table 3. Increasing the gap size reduces the tonal noise at the BPF, and the static pressure rise also decreases.
The results of the wall pressure fluctuations at the B P F are illustrated for the three cases in Figure 11. Here, only magnitudes above 1.5 Pa2/Hz are visualized with colorful contours. The location of the highest wall pressure fluctuations is at the same position (the BLE close to the shroud) for all cases. The differences are the magnitude and the size of the area with high magnitude. Case 1 and Case 3 have the largest sound pressure (see Figure 10), and they have also the largest area and magnitude for the tonal frequency. The high-energy locations are consistent with the wall pressure fluctuations indicated in Figure 7. The high energy is caused by the interaction between inlet-gap vortices associated with the gap turbulence and the BLE [8]. According to Lee [20], the gap gives rise to a local jet, and the velocity magnitude of the air flowing through the gap increases with decreased gap size. Higher velocity leads to more inlet-gap vortices that interact with the BLE, which is also seen in Figure 11, where Cases 1 and 3 have higher PSD value for the B P F compared with Case 2.

6. Conclusions

The tonal noise at the BPF is compared for three different gap sizes for a voluteless centrifugal fan. The present study is motivated by a previous study [8], where the gap flow was found to play an important role in the tonal noise generation. The flow is simulated using a hybrid method coupling the IDDES with Formulation 1A of Farassat [15].
Regions with high vorticity magnitudes are found between the BLE and the gap and ascribed to the turbulence initializing from the inlet gap. The turbulence develops along the shroud and interacts with the BLE. The interaction renders a high-pressure RMS value at the BLE close to the shroud. In addition, the pressure at the shroud fluctuates with high frequency. As the distance to the inlet gap and the shroud increases, the RMS value of the pressure decreases. At the middle position, only small fluctuations are observed.
Spectral analysis is performed for the wall pressure. There are regions with high energy identical to the locations where the gap turbulence evolves and accounts for the impingement on the BLE. It indicates that the gap turbulence dominates the tonal noise generation at the B P F . The spectral analysis is then used to compare the tonal noise at the B P F for three different gap designs.
The three designs show the similar trend of the pressure RMS value. The pressure RMS value is the largest at the shroud and decays when the distance to the gap increases. Moreover, at the position of 20% blade width to the shroud (point 1 shown in Figure 7), the pressure RMS value reaches the smallest value. Case 2 overall has lower RMS amplitudes at all positions compared to the other cases.
Case 2 has the lowest tonal noise at the B P F . This agrees with the observations on the pressure fluctuations. The spectral analysis also indicates that Case 2 has the lowest magnitude at the BLE close to the shroud compared to the other cases. According to the present study, the largest gap size gives the lowest tonal noise at the B P F , and the static pressure rise is also the lowest. The smallest gap size has the highest tonal noise at the B P F , and the static pressure rise is the highest.

Author Contributions

M.O., conceptualization, methodology, software, analysis, investigation, writing—original draft, writing—review and editing, and visualization; H.-D.Y., review and editing and supervision; L.D., review and supervision. All authors have read and agreed to the published version of the manuscript.

Funding

The study was funded by Swegon Operations AB through a industrial Ph.D. student. Grant Number: None.

Data Availability Statement

The data that support the findings of this study are available from the corresponding author upon reasonable request.

Acknowledgments

The simulations were performed on resources provided by the Swedish National Infrastructure for Computing (SNIC) at C3SE.

Conflicts of Interest

Swegon Operation finances the present work.

References

  1. Berglund, B.; Lindvall, T.; Schwela, D. New Guidelines for Community Noise. Noise Vib. Worldw. 2000, 31, 24–29. [Google Scholar] [CrossRef]
  2. Azimi, M. Noise Reduction in Buildings Using Sound Absorbing Materials. J. Archit. Eng. Technol. 2017, 6, 198. [Google Scholar]
  3. Hariharan, C.; Govardhan, M. Effect of inlet clearance on the aerodynamic performance of a centrifugal blower. Int. J. Turbo Jet Engines 2016, 33, 215–228. [Google Scholar] [CrossRef]
  4. Wolfram, D.; Carolus, T.H. Experimental and numerical investigation of the unsteady flow field and tone generation in an isolated centrifugal fan impeller. J. Sound Vib. 2010, 329, 4380–4397. [Google Scholar] [CrossRef]
  5. Sanjose, M.; Moreau, S. Direct noise prediction and control of an installed large low-speed radial fan. Eur. J. Mech. 2017, 61, 235–243. [Google Scholar] [CrossRef] [Green Version]
  6. Pérot, F.; Kim, M.S.; Goff, V.L.; Carniel, X.; Goth, Y.; Chassaignon, C. Numerical optimization of the tonal noise of a backward centrifugal fan using a flow obstruction. Noise Control. Eng. J. 2013, 61, 307–319. [Google Scholar] [CrossRef] [Green Version]
  7. Schaefer, R.; Boehle, M. Influence of the mesh size on the Aerodynamic and Aeroacoustics of a Centrifugal Fan using Lattice-Boltzmann Method. In Proceedings of the 23rd Internatinoal Congress on Acoustics, Aachen, Germany, 9–13 September 2019; pp. 1882–1889. [Google Scholar]
  8. Ottersten, M.; Yao, H.-D.; Davidson, L. Tonal noise of voluteless centrifugal fan generated by turbulence stemming from upstream inlet gap. Phys. Fluids 2021, 33, 75110. [Google Scholar] [CrossRef]
  9. Shur, M.L.; Spalart, P.R.; Strelets, M.K.; Travin, A.K. A Hybrid RANS-LES Approach with Delayed-DES and Wall-Modelled LES Capabilities. Int. J. Heat Fluid Flow 2008, 29, 1638–1649. [Google Scholar] [CrossRef]
  10. Ffowcs Williams, J.E.; Hawkings, D.L. Theory relating to the noise of rotating machinery. J. Sound Vib. 1969, 10, 10–21. [Google Scholar] [CrossRef]
  11. Siemens PLM Software. STAR-CCM+ User Guide (Version 12.04); Siemens PLM: Plano, TX, USA, 2017. [Google Scholar]
  12. Salunkhe, S.; Fajri, O.E.; Bhushane, S.; Thompson, D.; O’Dohety, D.; O´Dohety, T.; Mason-Jones, A. Validation of tidal stream turbine wake predictions and analysis of wake recovery mechanism. J. Mar. Sci. Eng. 2019, 7, 362. [Google Scholar] [CrossRef] [Green Version]
  13. Rynell, A.; Efraimsson, G.; Chevalier, M.; Åbom, M. Inclusion of Upstream Turbulent Inflow Statistics to Numerically Acquire Proper Fan Noise Characteristics; SAE Technical Paper 2016-01-1811; SAE International: Warrendale, PA, USA, 2016. [Google Scholar]
  14. Rynell, A.; Chevalier, M.; Åbom, M.; Efraimsson, G. A numerical study of noise characteristics originating from a shrouded subsonic automotive fan. Appl. Acoust. 2018, 140, 110–121. [Google Scholar] [CrossRef]
  15. Brentner, K.S.; Farassat, F. Analytical comparison of the acoustic analogy and Kirchhoff formulation for moving surfaces. AIAAA J. 1998, 36, 1379–1386. [Google Scholar] [CrossRef] [Green Version]
  16. Neise, W. Review of fan noise generation mechanisms and control methods. In Proceedings of the Fan Noise 1992 International Symposium, Senlis, France, 1–3 September 1992; pp. 45–56. [Google Scholar]
  17. Ottersten, M.; Yao, H.-D.; Davidson, L. Unsteady Simulation of tonal noise from isolated centrifugal fan. In Proceedings of the Fan Noise 2018 Symposium, Darmstadt, Germany, 18–20 April 2018. [Google Scholar]
  18. Baris, O.; Mendonça, F. Automotive turbocharger compressor CFD and extension towards incorporating installation effects. In Proceedings of the ASME Turbo Expo 2011: Power for Land, Sea and Air, Vancouver, BC, Canada, 6–10 June 2011. [Google Scholar]
  19. Yao, H.-D.; Davidson, L.; Eriksson, L.E. Surface integral analogy approaches for predicting noise from 3D high-lift low-noise wings. Acta Mech. Sin. 2014, 30, 326–338. [Google Scholar] [CrossRef]
  20. Lee, Y. Impact of fan gap flow on the centrifugal impeller aerodynamics. J. Fluids Eng. 2010, 132, 091103. [Google Scholar] [CrossRef]
  21. Ottersten, M.; Yao, H.-D.; Davidson, L. Numerical and experimental study of tonal noise sources at the outlet of an isolated centrifugal fan. arXiv 2020, arXiv:2011.13645. [Google Scholar]
Figure 1. The fan configurations. Gray indicates the rotating fan and brown the stationary inlet duct. (a) Case 1 (baseline), (b) Case 2 (with a larger gap width = w), and (c) Case 3 (with a smaller gap width = w). (d) The simple geometry layout for the numerical simulations. M1 is the microphone position. The rotation axis of the fans is the x-axis.
Ijtpp 07 00033 g001
Figure 2. Important mesh regions: (a) Mesh refinement regions (dark grey) at the inlet gap and blades top region. Mesh cells near (b) the blade trailing edge and (c) the inlet gap.
Ijtpp 07 00033 g002
Figure 3. Turbulence at the BLE: (a) Vorticity magnitude ω at one blade. The black dashed line marks the monitoring line at the BLE; (b) the RMS of the pressure fluctuations with respect to the normalized length along the monitoring line.
Ijtpp 07 00033 g003
Figure 4. The time history of wall pressure fluctuations at three locations along the BLE.
Ijtpp 07 00033 g004
Figure 5. PSD of the wall the wall pressure fluctuations at BPF (326.7 Hz).
Ijtpp 07 00033 g005
Figure 6. The pressure along the axial axis of the fan across the computational domain. Here, x = −2 corresponds to the location near the outlet and x = 4 near the inlet. The fan location is marked out with the red zone.
Ijtpp 07 00033 g006
Figure 7. Pressure at BLE. (a) The RMS of the pressure fluctuations for 12 fan revolutions, on one blade at the monitoring line; (b) the time-average pressure and error bars showing the minimum and maximum pressure.
Ijtpp 07 00033 g007
Figure 8. The time history of wall pressures along the BLE at point 2: (a) Case 1, (b) Case 2, and (c) Case 3. The dashed lines indicate the average value for each case.
Ijtpp 07 00033 g008
Figure 9. Instantaneous velocity magnitudes v R visualized in Plane 1: (a) Case 1, (b) Case 2, and (c) Case 3.
Ijtpp 07 00033 g009
Figure 10. SPL of the sound upstream of the fan. The tonal frequency B P F = 326.7   Hz .
Ijtpp 07 00033 g010
Figure 11. The PSD at B P F (326.7 Hz) for wall pressure fluctuations: (a) Case 1, (b) Case 2, and (c) Case 3.
Ijtpp 07 00033 g011
Table 1. The fan parameters.
d1d2d3d4bh1h2h3wcase1wcase2wcase3
0.165 m0.268 m0.6 m1.1 m0.0534.0 m2.3 m3.2 m1.5 mm2.0 mm1.0 mm
Table 2. The mesh parameters.
Cases 1–3
Total number of cells 52 × 10 6
Number of cells in the rotating zone 41.9 × 10 6
Maximum first cell height Δ y + near blade walls0.73
Cell growth ratio1.05
Table 3. Aerodynamic and acoustic performance.
Comparative FeaturesCase 1Case 2Case 3
Gap width (mm)1.52.01.0
Static pressure rise (Pa)268261281
SPL at BPF (dB)67.561.868.0
Publisher’s Note: MDPI stays neutral with regard to jurisdictional claims in published maps and institutional affiliations.

