Article

Experimental Validation of an Analytical Condensation Model for Application in Steam Turbine Design †

Chair of Turbomachinery, University of Duisburg-Essen, 47057 Duisburg, Germany
*
Author to whom correspondence should be addressed.
This manuscript is an extended version of our meeting paper published in the Proceedings of the 14th European Turbomachinery Conference, Gdansk, Poland, 12–16 April 2021.
Int. J. Turbomach. Propuls. Power 2022, 7(1), 9; https://doi.org/10.3390/ijtpp7010009
Submission received: 16 November 2021 / Revised: 25 February 2022 / Accepted: 27 February 2022 / Published: 3 March 2022

Abstract

:
This paper presents experimental data on shear-stress-driven liquid water films on a horizontal plate formed by the condensation of superheated steam. The experimental results were obtained in the Experimental Multi-phase Measurement Application (EMMA) at the University of Duisburg-Essen. The liquid film thickness was spatially and temporally investigated with an optical measurement system. Furthermore, the resulting local heat transfer coefficient in the case of film condensation was determined for a variety of steam velocities and temperatures. Subsequently, the presented data are compared to the results of an analytical condensation model for shear-stress-driven liquid films developed by Cess and Koh. Thus, the model is qualitatively validated, with explicable remaining disparities between the model and experiment that are further discussed. The presented results are an important contribution to the contemporary research into steady-state, single-component multiphase flow considering phase-change phenomena including heat transfer.

1. Introduction

The previous decades brought massive changes to the field of power generation and energy distribution. Conventional power plants are facing load variations more frequently, as well as an increase in start-up- and shut-down-cycles, to provide reliable electricity supply and avoid major power outages. This service was realized at the expense of the installed energy conversion facilities, foremost gas and steam turbines. The growing machinery lifetime consumption intensifies the urge to address flexibility requirements in modern turbine design. Gaining a deeper insight into all physical processes that affect the machine conditions is essential for steam turbine design. Spatial and temporal temperature gradients are major factors in the assessment of mechanical integrity and component failure. The thermal stresses, in combination with phase-change phenomena, induced by the previously mentioned operational events of start-up and shut-down, are not negligible. Moreover, the consideration of condensation associated with increasing heat transfer coefficients (HTC) is impeding the design process. Particular attention regarding condensation needs to be given to the turbine housing and the steam-containing cavities. The thermal housing condition can only be sufficiently predicted for all possible shifts in operation points using reliable condensation models, including HTCs.
This paper qualitatively validates an existing analytical 2D-model by Cess [1] and Koh [2] for shear-stress-driven liquid condensation films on a fully wetted horizontal surface, which is compared to experimental data gained in the Experimental Multi-phase Measurement Application (EMMA) at the University Duisburg-Essen. According to Kulkarni [3], and to date, a comparable experimental validation of this model has never been performed due to difficulties in implementing a suitable experiment that meets the requirements of the theory, as well as the significant differences that exist between shear-stress-driven and gravity-driven film flows. The validation is accomplished by variations in the steam velocity and is focused on enhancing the prediction accuracy of the model regarding liquid water film thickness in combination with the local HTCs.

2. Analytical Model

The first pioneering approach in the field of condensation modelling was achieved by Nusselt [4], describing the process of gravitational-driven falling film condensation on a vertical subcooled wall regarding parallel steam flow and resting steam atmosphere. The first description of solely shear-stress driven condensation films with the absence of an actuating body force on top of a horizontal surface was provided by Cess [1] and Koh [2]. This approach is based on the numerical solution of the ordinary differential equations for the particular case of a semi-infinite plate with parallel flow, resulting from a constant pressure and boundary layer approximation, as well as a “similarity” solution formulation of the resulting model equations. The central achievement of this model is the predictability of the thickness of a condensing shear-stress-driven liquid film in combination with the local wall HTC-distribution. The mathematic derivation of the model was presented by Cess [1] and Koh [2], as well as additional approaches by Narain et al. [5], Phan et al. [6] and Kulkarni et al. [3].
The most important coefficient within the model is the similarity variable η + according to Sparrow and Gregg [7]. This represents the central parameter for the determination of further values, which is calculated as
η + = c p , l · ( T s T w ) · r P r · Δ h e v a p · 0 . 083 3  
with the Koh coefficient r
r = ρ l · μ l ρ g · μ g .
The liquid film thickness   δ x is one of the pivotal parameters derived from η + as
δ x = η + ν l · x U .  
The second essential parameter is the local wall-HTC α x , w , given as
α x , w = N u x , w · λ l x  
with the local wall Nusselt number N u x , w , defined as
N u x , w = 1 η + R e x , w  
and the local wall Reynolds number R e x , w was finally defined as
R e x , w = U · x ν l .  
Additional values, such as the wall shear stress τ x , w , the liquid film mass flow rate l and the film velocity profile U z , l , are provided by the model. These values are not experimentally determinable; hence, they are neglected in the validation approach used in this paper.

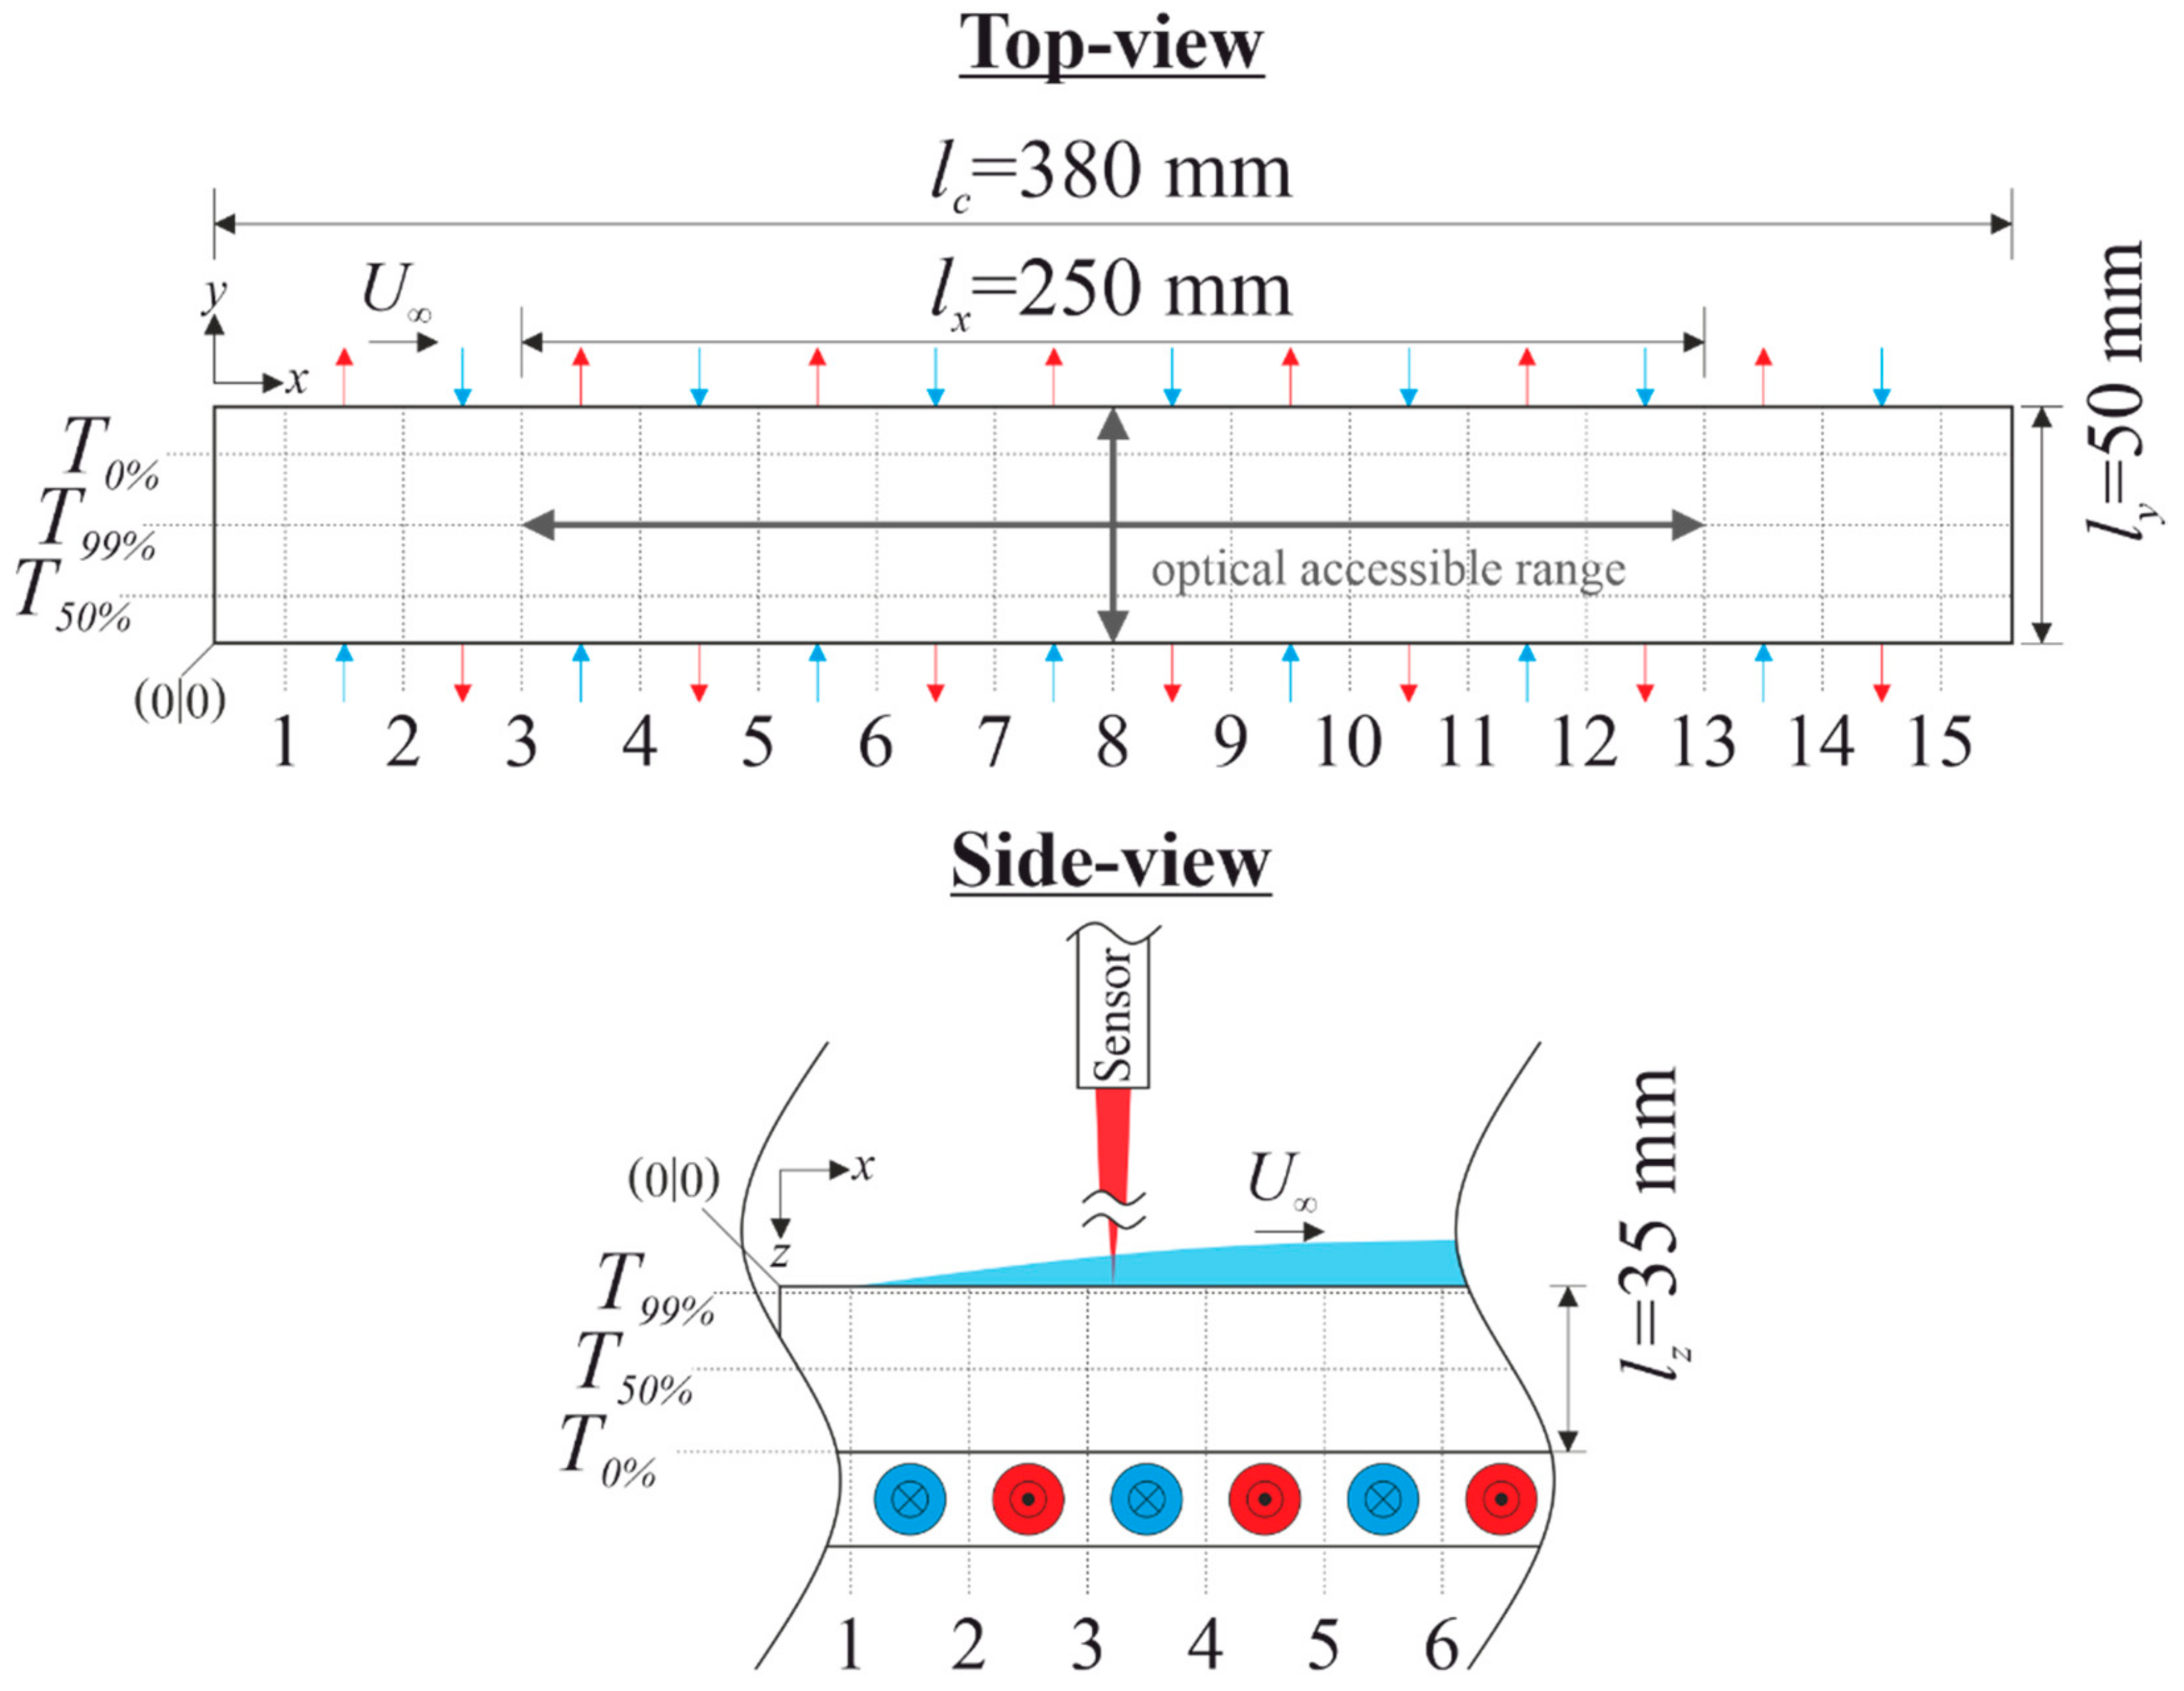
3. Experimental Investigation

The measurements were conducted with the Experimental Multi-phase Measurement Application (EMMA) at the University Duisburg-Essen. Lapp et al. [8] presented the design and the available steam conditions of the test facility, including the measurement systems applied for the determination of the liquid water film thickness, as well as the local HTC-distribution. The square-shaped cross-sectional measurement section of A = 2500   mm 2 , displayed in Figure 1, was equipped with an optical access that allowed for an observation length of l x = 250   mm and l y = 50   mm . Via this access, the infrared-interferometric sensor from Precitec [9] provided a resolvable liquid film thickness in the range of 16   μ m 2600   μ m with a linearity error of ± 0.429   μ m .
The horizontally aligned measurement plate of l c = 380   mm and l z = 35   mm , manufactured from stainless-steel, was instrumented with thermocouples (TC) type T at 15 axial positions, consisting of 3 TC each, recording T 0 % at the bottom of the measurement plate, T 50 % at 50   % thickness of the measurement plate height, and T 99 %   0.5   mm below the measurement surface at top side. T 0 % and T 50 % were used to calculate the local heat flux density, q ˙ x . To induce film condensation on top of the measurement plate, the necessary heat flux was accomplished by a countercurrent heat-exchanging plate made of aluminum 3.1645 (DIN EN 17007-4 [10]) from Batz+Burgel [11], with 16 water–glycol filled cooling channels connected to an external water-cooled refrigeration unit.
The main goal of this measurement campaign was validation of the analytical model presented earlier. Since the film condensation influenced by shear-stress is a thermodynamic process influenced by multiple steam parameters, such as temperature T , pressure p and velocity U , as well as solid interface conditions such as cooling capacity Q ˙ c , surface material, average roughness R a and fouling, the significant effects need to be identified. For the initial validation of the model, this paper focusses on the fluid–mechanical and thermodynamic boundary conditions.
Thus, the surface material and R a were fixed, and the corresponding influence was identical within the whole investigation. Stainless-steel 1.4571 (DIN EN 10027 [12]) from DEW [13] was the applied wall material, with a thermal conductivity of λ w = 15   Wm 1 K 1 .
The surface was ground and exhibited an average roughness value of R a = 1.862   μ m . Since the effect of surface fouling has a fundamental impact on the liquid film behavior, the surface was regularly cleaned with isopropyl alcohol before each measurement sequence, to guarantee equal conditions throughout the whole investigation.
T , p and U , as well as Q ˙ c , are the thermodynamic variables that need to be varied for a sufficient validation of the analytical condensation model. Due to the absence of an actuating body force, the liquid film is solely shear-stress-driven by the steam mass flow at the liquidgaseous interface. Hence, U is the major factor determining the local film thickness δ x alongside the flow direction and is, therefore, investigated in this paper. U is altered from U , m i n = 2.5   m / s up to U , m a x = 12.5   m / s in steps of 2.5   m / s . All measurements within that sequence were conducted at T = 473.15   K , p = 1.1 · 10 5   Pa and Q ˙ c = 1.2   kW .
In preparation for every test sequence, the whole measurement section was preheated 20   K above saturated steam temperature to ensure dry test conditions and isothermal wall temperature distribution. After that, the measurement plate was subcooled for 30   min until a stationary liquid film was established. The fully wetted surface was observed across the whole optical accessible length, l x = 250   mm , in the middle of the test section at y = 25   mm . Each configured U was investigated multiple times, capturing lines by moving the sensor up- and downstream with a velocity of 0.75   mm / s and a sampling rate of 30   Hz . Additional tests concerning possible wavelet effects at the liquidgaseous interface were conducted at 5 positions at a distance of 50   mm along the previously mentioned line. Each position was recorded for 1   min using a frequency of 1   kHz to prevent subsampling.

4. Experimental Results and Inaccuracy Consideration

To form the basis for a precise and trustable analysis, the measurement data-processing, as well as the sensor inaccuracies, need to be sufficiently discussed. Since δ x , e x p and α x , e x p are the central measurements investigated in this paper, the method of analysis is subsequently presented.

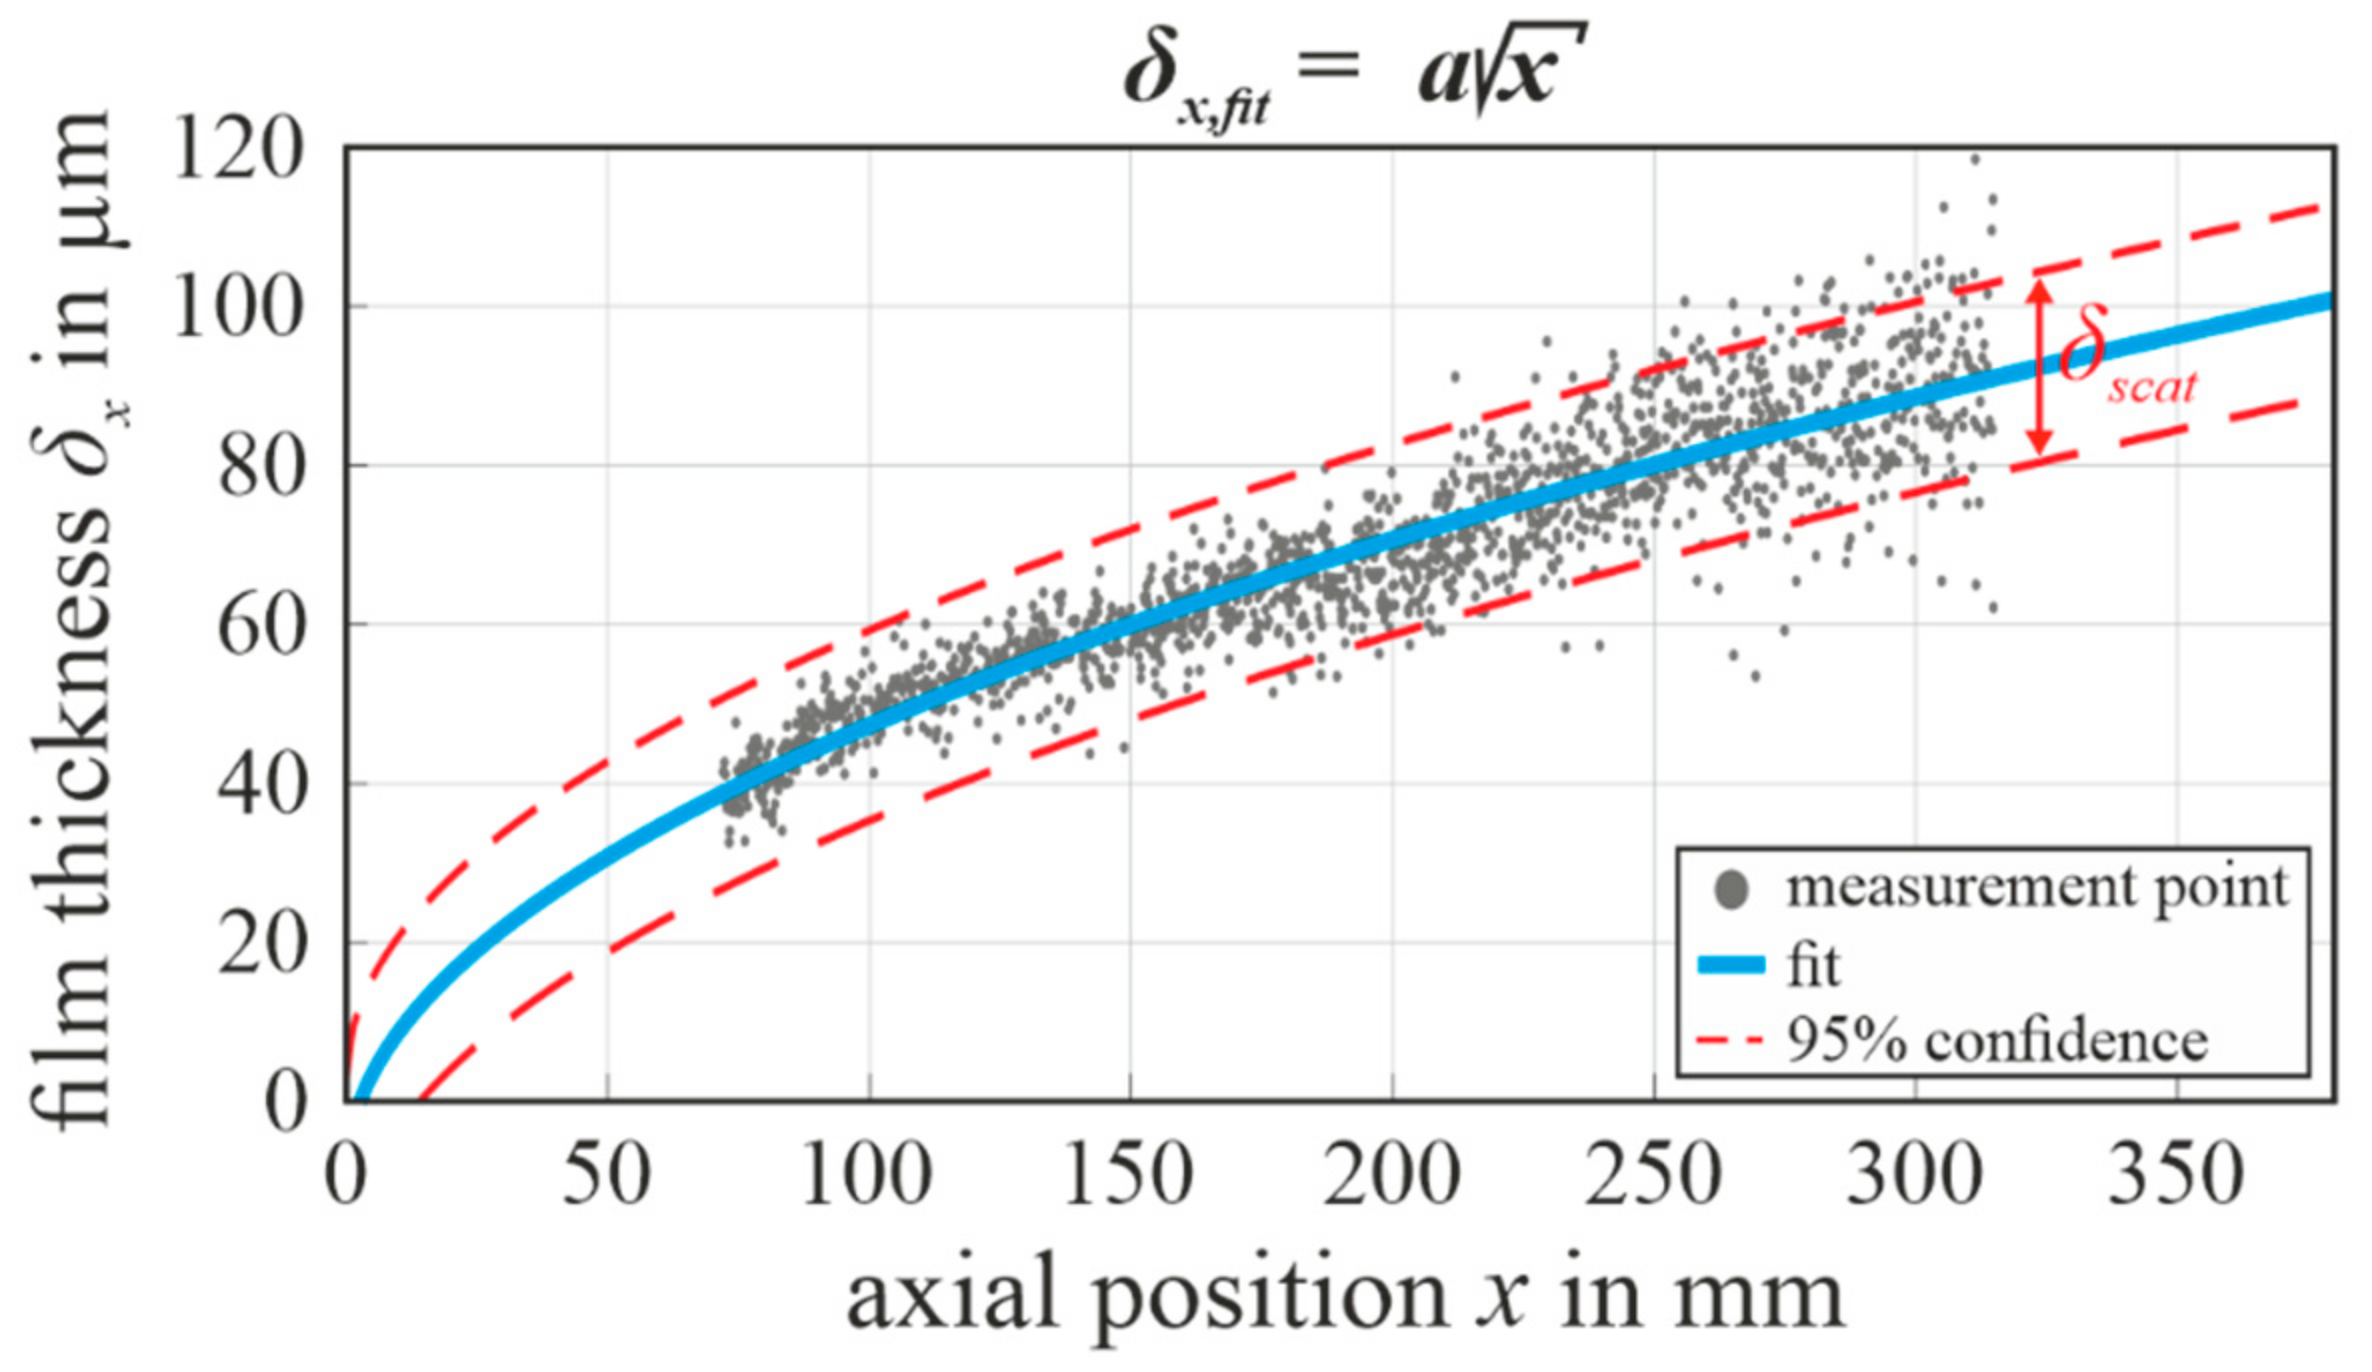
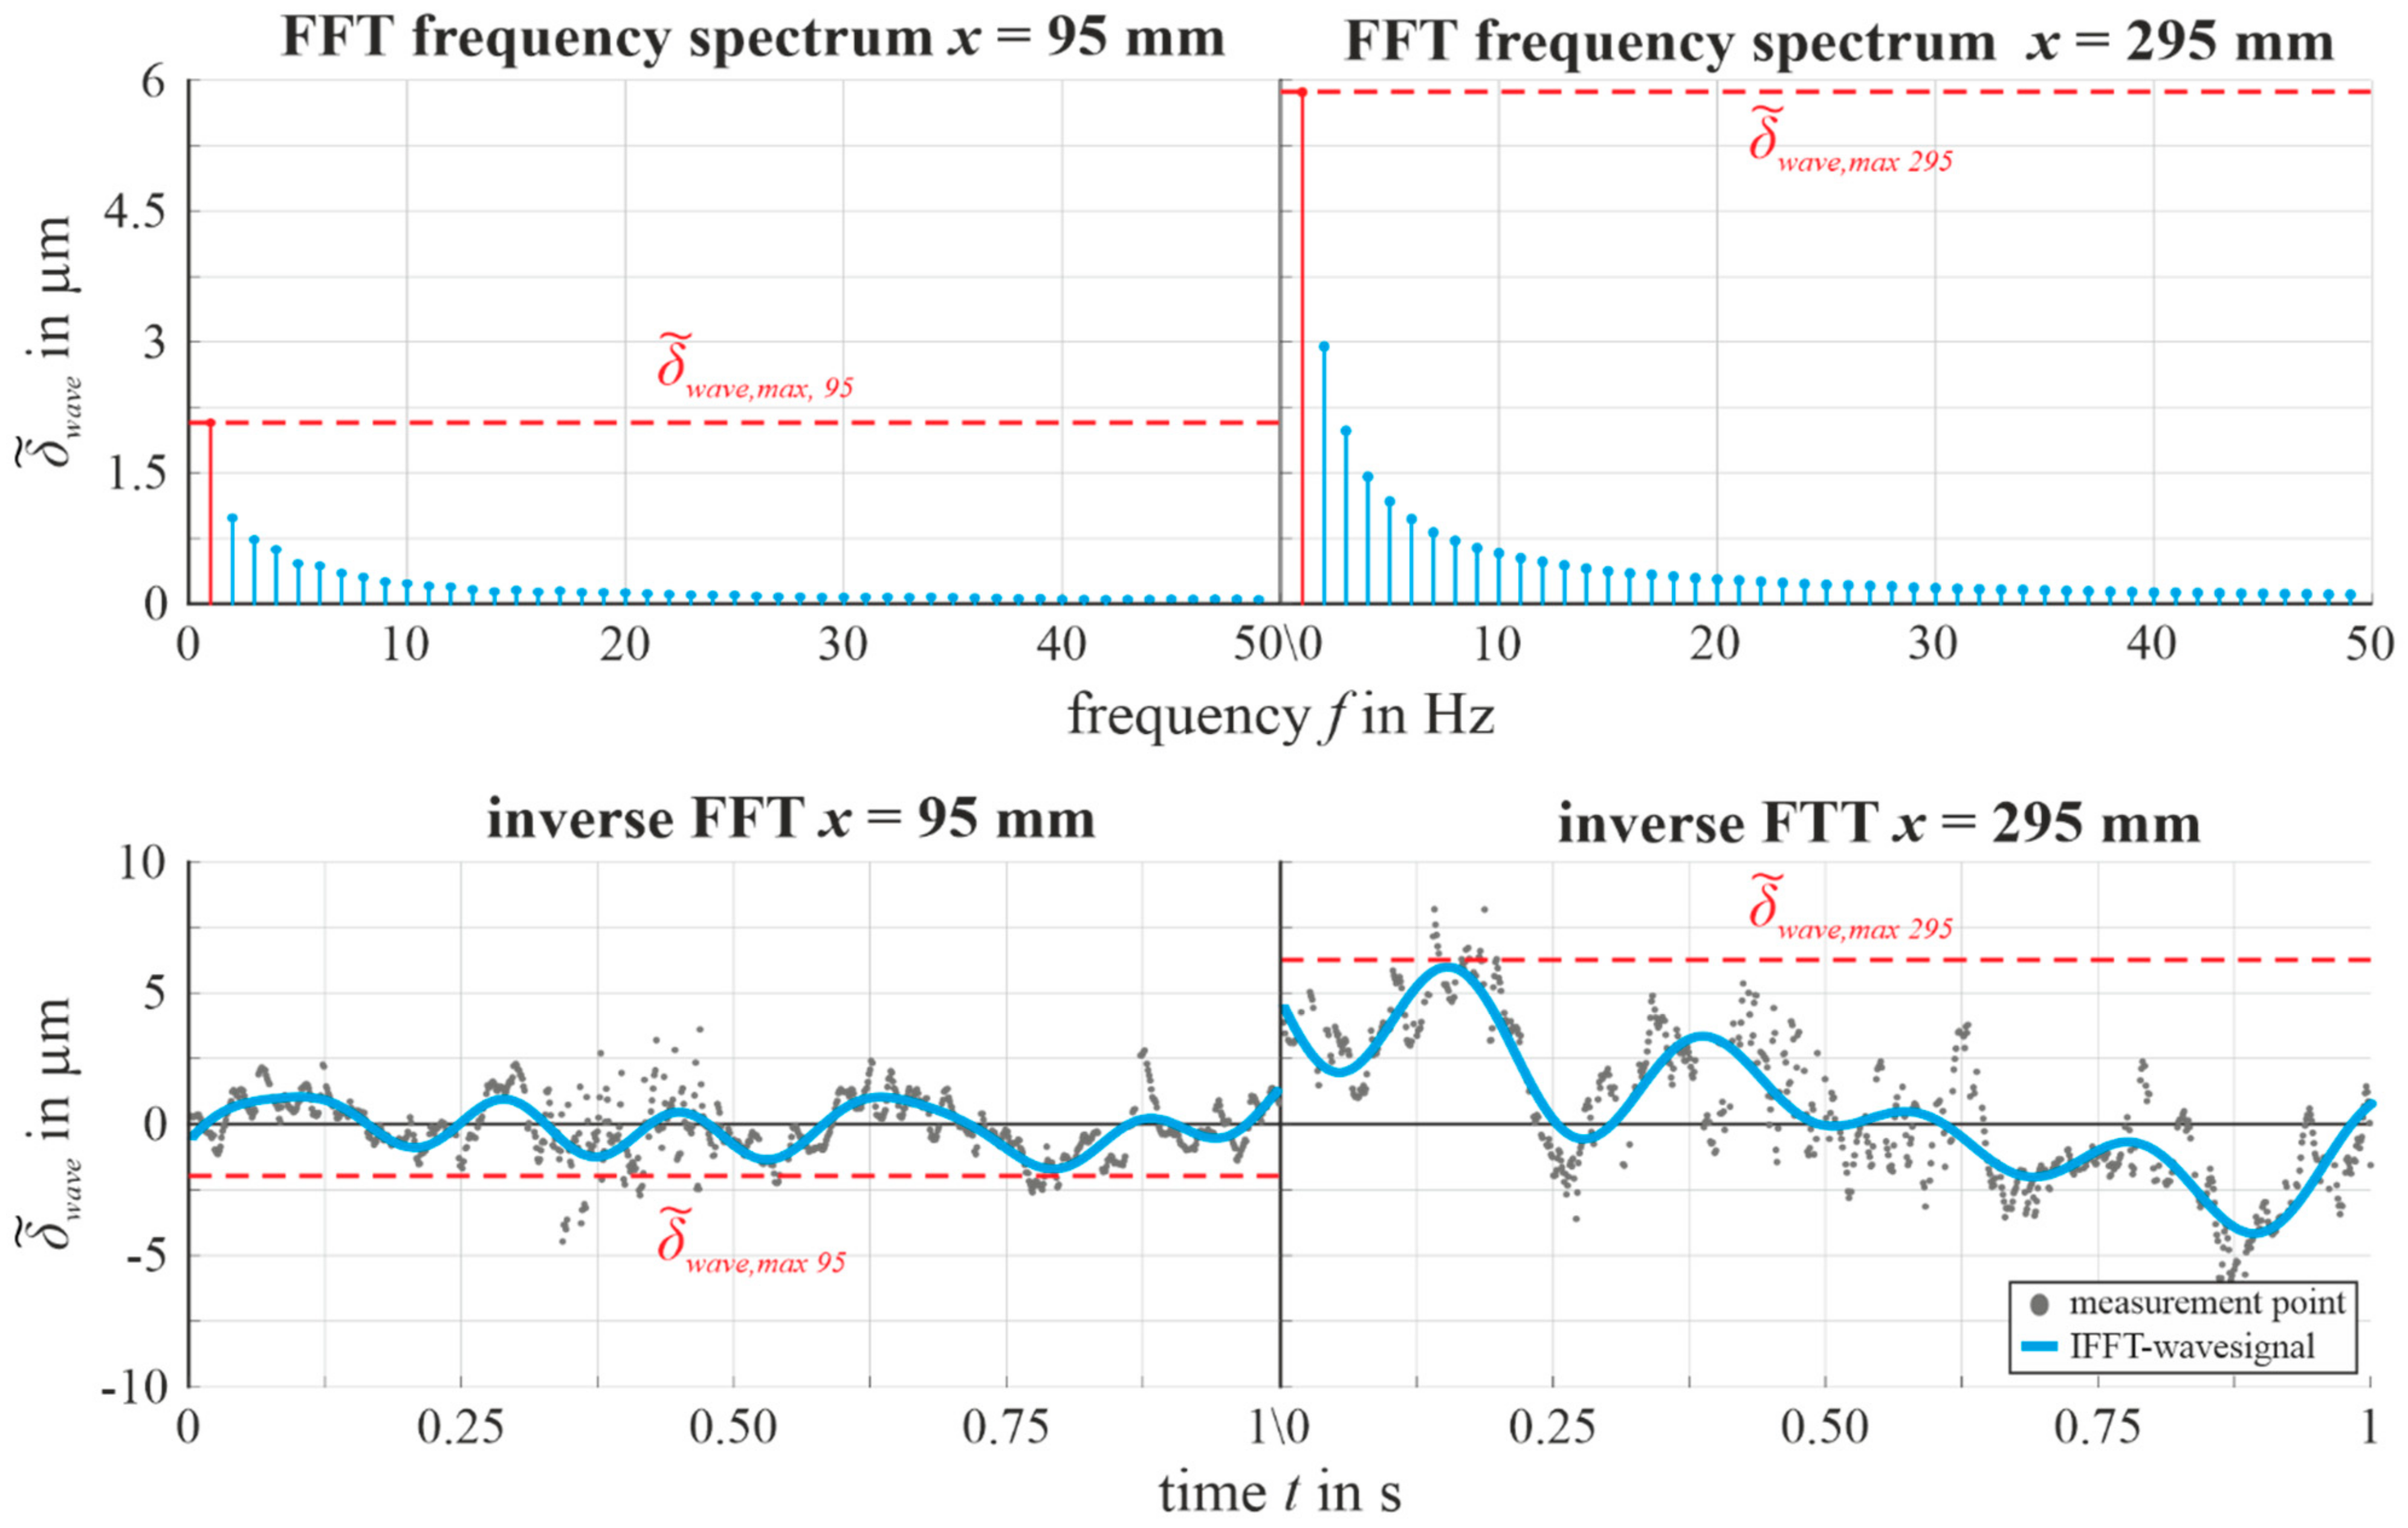
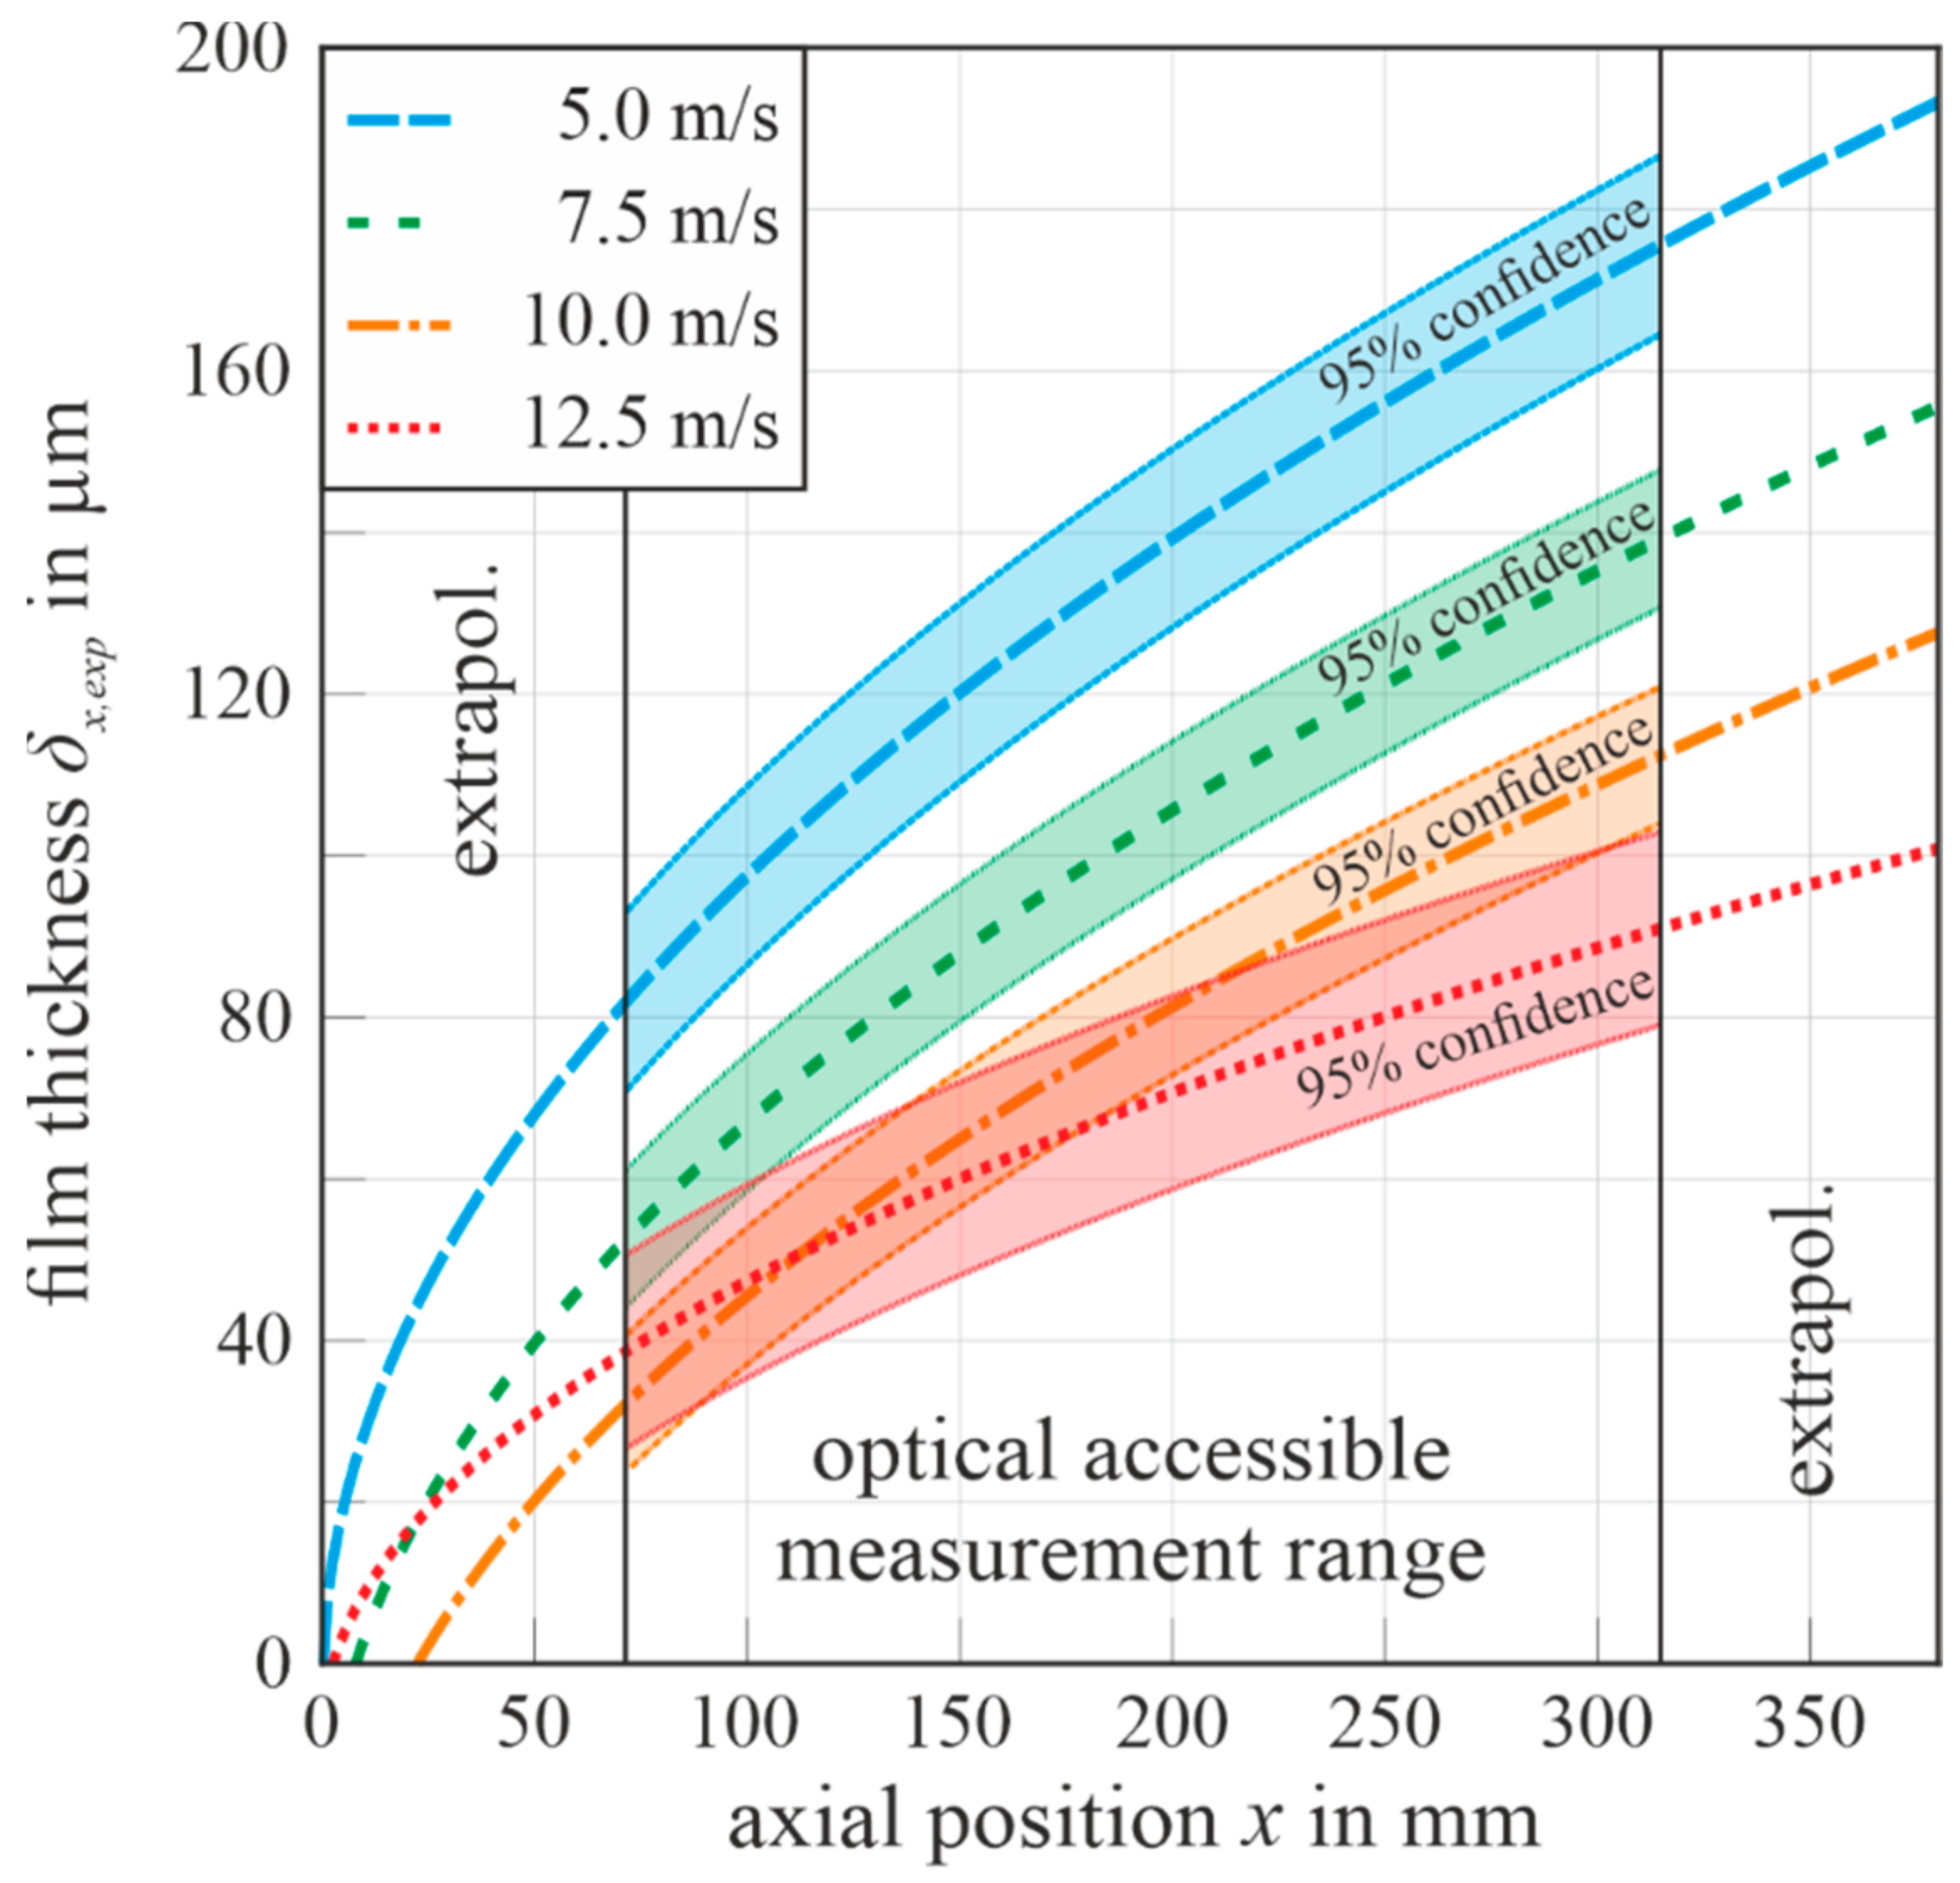
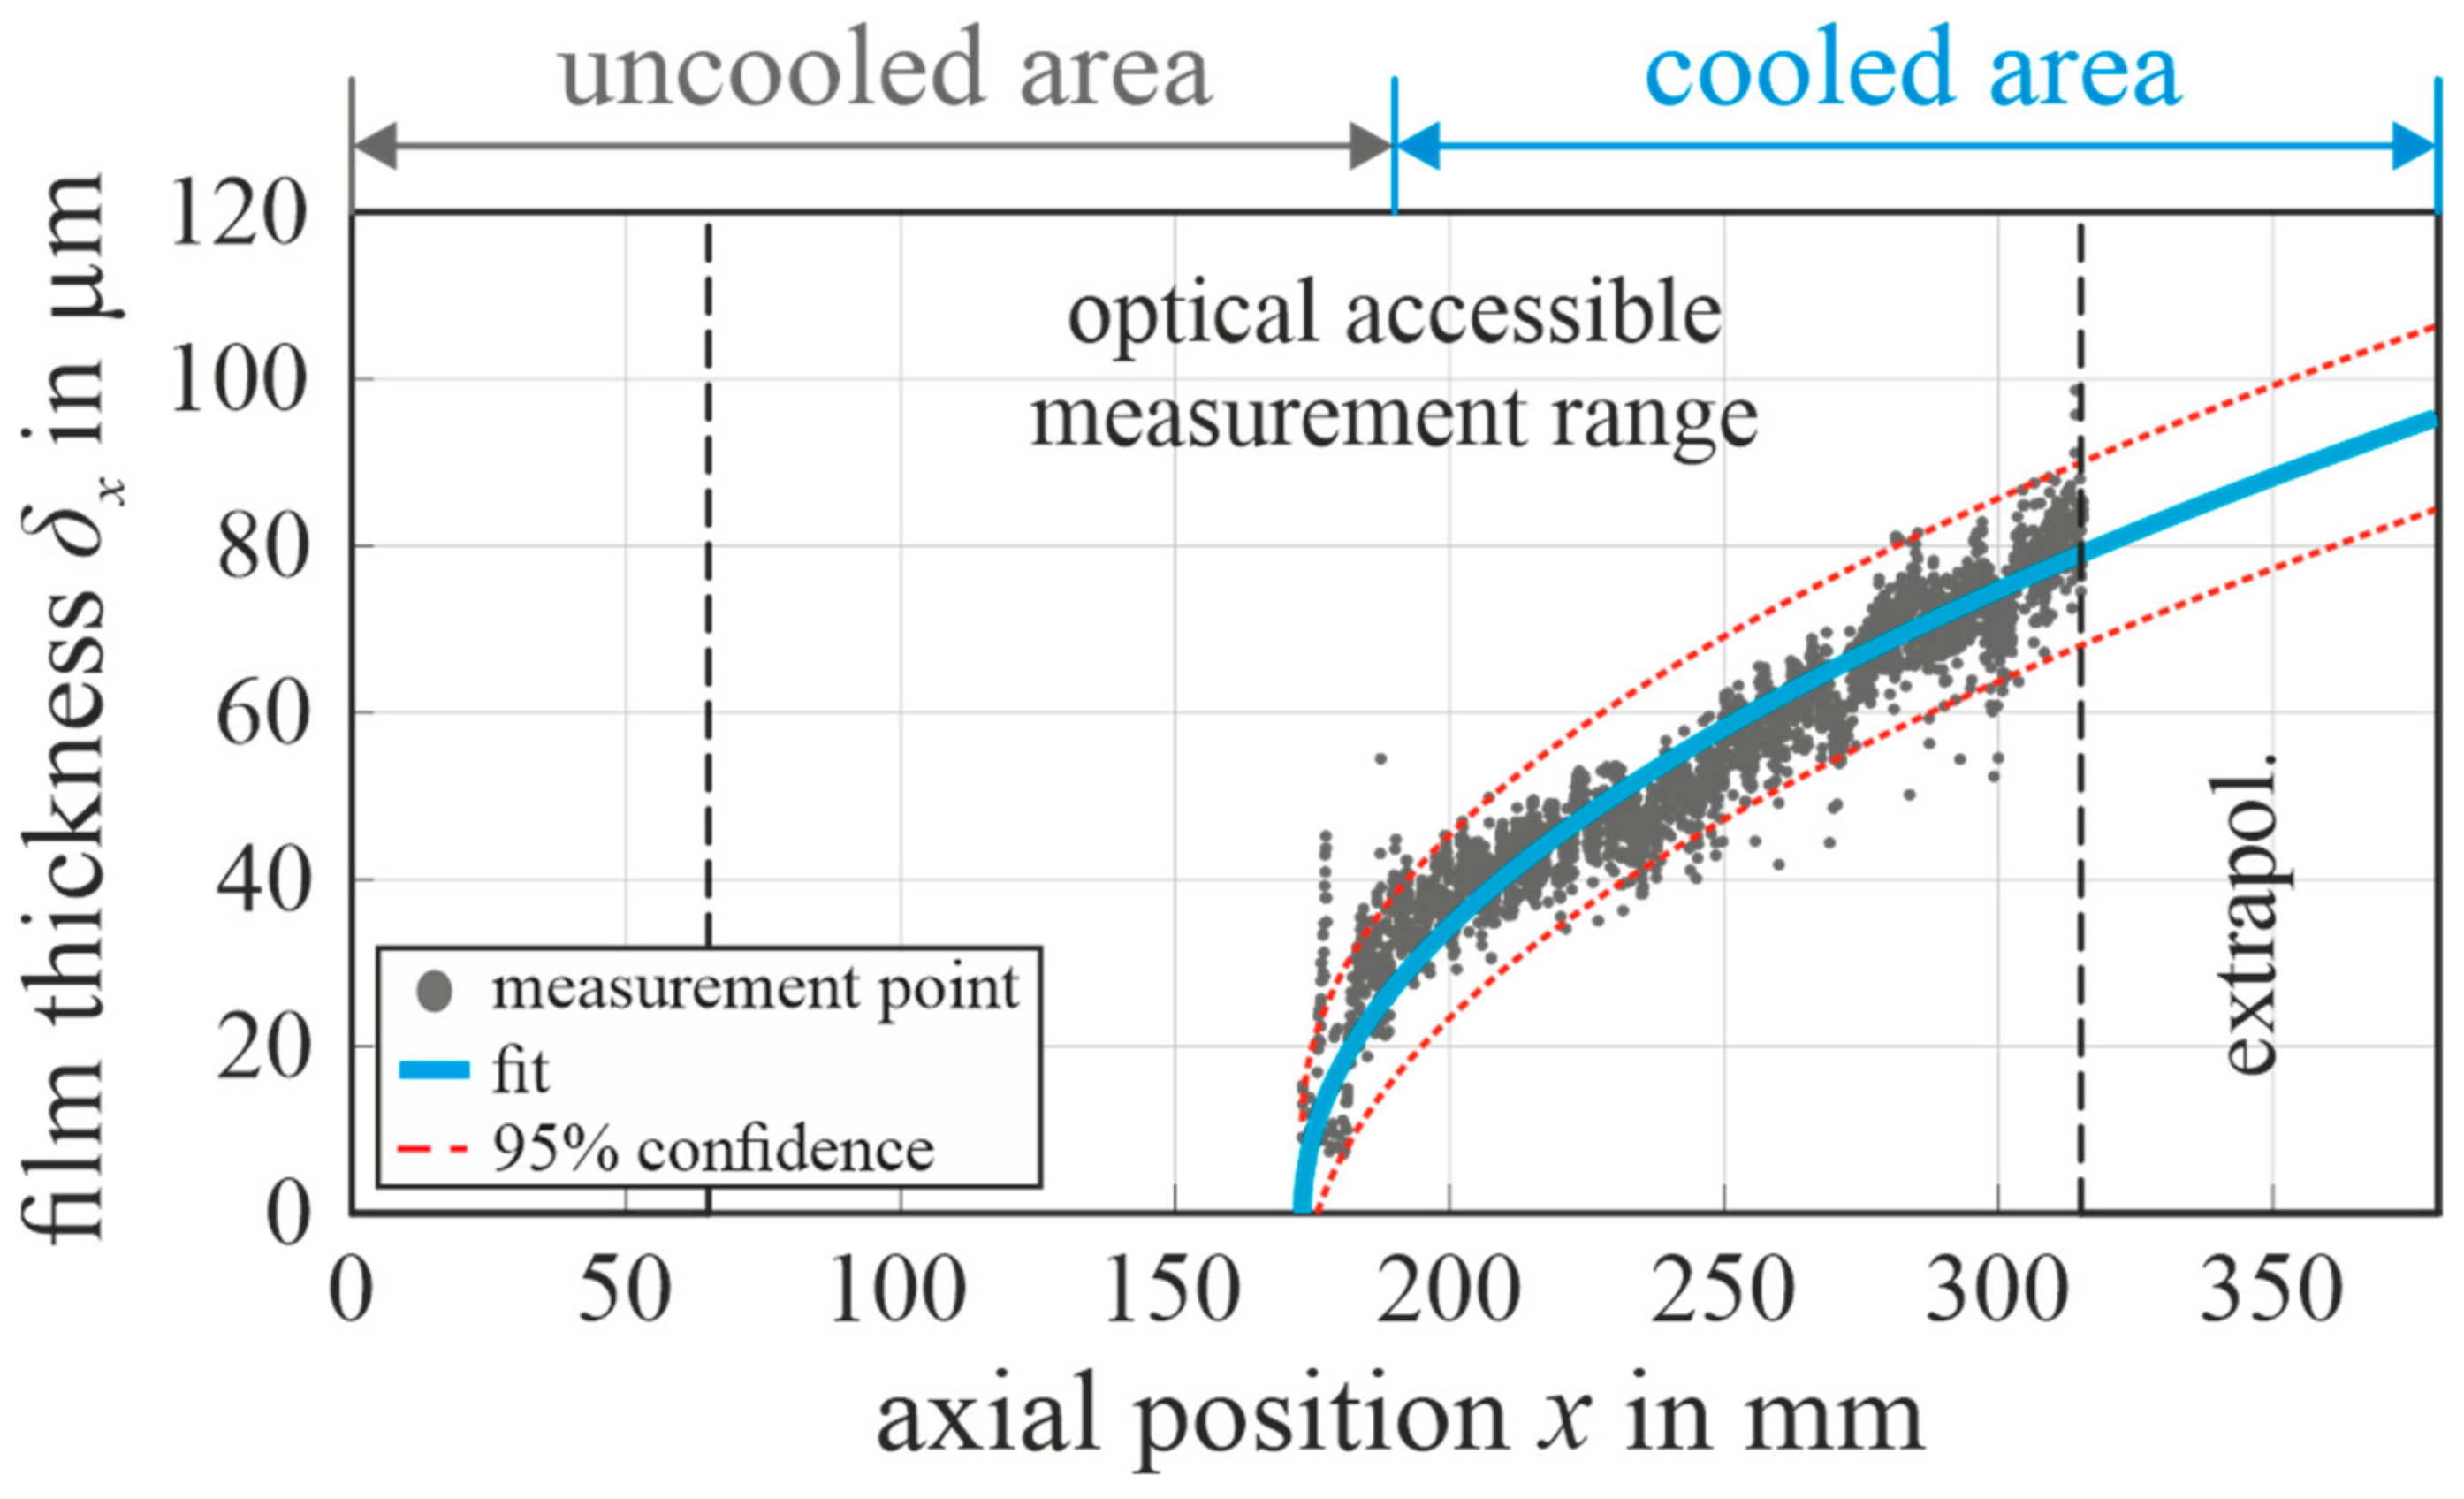
4.1. Liquid Film Thickness

δ x , e x p is continuously recorded along a linear track of l x = 250   mm , leading to a distribution of thickness values, which need to be converted to a mathematical correlation for an optimal model comparison. Based on the model assumptions, Equation (3) analytically describes the local film thickness δ x as a square-root-function of the axial position x . Hence, the consideration of a root function approach will presumably lead to the most suitable curve-fitting results if the model corresponds to the experimental results. Figure 2 shows the square-root curve-fitting approach at a steam velocity of U = 12.5   m / s . The correlation quality advantage of the square root function, presented at U = 12.5   m / s , is representative for all varied velocities, confirming the application of the square root function. An exponential and a logarithmic function were also considered, leading to worse correlation results than the square root approach. The correlation coefficient R was used to determine the fitting quality and was about R = 0.923 for all the remaining velocities. U = 2.5   m / s exhibits the only exception to the decent correlation quality, with R = 0.165 . One reason for this was presented by Kulkarni et al. [3], describing a minimal velocity threshold for the model prediction validity in the ballpark of 2   m / s . The reason for this can be traced back to the inertial forces within the liquid phase, which cannot be overcome by shear-stress at the liquidgaseous interface, due to steam velocities below the minimal threshold value. Hence, U = 2.5   m / s will not be further investigated, since it is beyond the model’s range of validity.
To determine measurement inaccuracy, the 95% confidence interval was used by calculating the absolute confidence interval width. This is also referred to as the absolute thickness scattering δ x , s c a t , more specifically the mean thickness scattering δ ¯ x , s c a t , averaged along the whole plate length. Considering all investigated steam velocities, δ ¯ x , s c a t is about ± 2.622   μ m and, hence, 5.7 times the sensors’ linearity error of ± 0.429   μ m given by Precitec [9]. One reason for the high scattering of δ x , e x p is a visible wavelet fluctuation at the liquidgaseous interface depending on δ x , e x p and U . This effect is particularly distinct at high steam velocities. The mentioned dependencies of δ x , s c a t substantiate the theory that δ x , s c a t is mainly dominated by a physical measurable wavelet effect, which would describe the relatively high measurement scattering. As described earlier, additional wavelet measurements were conducted to quantify the share of wavelet fluctuation within δ x , s c a t . At five different positions, the liquid film is locally observed, determining a continuous thickness signal. This signal should consist of a variety of Sines\Cosines shares if the optical observable fluctuations correspond to a harmonic wavelet occurrence. Thus, the filtered local signals were transformed from a time- to a frequency-domain using a Fast Fourier Transformation (FFT), as presented in Figure 3, at two axial positions. It can be stated that the signal consists of multiple harmonics of the base frequency of 1   Hz with a decreasing amplitude. At the position x = 295   mm , the maximum amplitude δ ˜ w a v e , m a x is three times the amplitude at x = 95   mm , showing a clear dependence on the increasing film thickness. The mean maximum amplitude for all positions and each velocity was δ ˜ ¯ w a v e , m a x = ± 3.864   μ m . The FFT result proves that the mean measurement scattering of δ ¯ x , s c a t = ± 2.622   μ m can be traced back to the presence of wavelet effects on the liquidgaseous interface. After that, the first 10 Hz were retransformed by an inverse FFT to verify that the identified amplitude spectrum represents the original signal. Figure 3 presents the transformed amplitude spectrum. The δ ˜ w a v e , m a x that was identified by the FFT can be found within the signal in the time domain. Since the inverse signal fit the original data very well, the FFT approach, determining the maximum wavelet amplitude within the film thickness signal, can sufficiently be presumed. Subsequently, it can be stated that δ ¯ x , s c a t corresponds very well to δ ˜ ¯ w a v e , m a x , verifying that the scattering is caused by a physical measurable wavelet effect on the liquidgaseous interface. Thus, it can be concluded that δ ¯ x , s c a t must not be considered a measurement error, since δ x , e x p can be derived by providing a sufficiently high measurement frequency. This wavelet consideration is exemplarily presented for the case of U = 12.5   m / s . Regarding the lower steam velocities, it can be observed that the maximum wavelet amplitudes reduce with declining velocities, although the overall film thickness is rising. This can be traced to the fact that the wavelet formation within the liquid water film is solely shear-stress-driven.
Figure 4 shows the experimental results of δ x , e x p , including square-root-based fits and 95% confidence intervals. δ x , e x p exhibits further progression for every velocity that corresponds very well to a square-root-based function. The condensation starts at the beginning of the cooled measurement plate or slightly after, which is physically plausible.
Due to the fact that the axial starting position of the condensation is extrapolated from the data, recorded within the measurement range, the position serves solely as a plausibility criterion at this point and will be further investigated. The increase in δ x , e x p as a function of the progressing overflow position x can clearly be observed for all velocities. Furthermore, the decrease in U leads to an increase in the δ x , e x p . The fact that the main film-actuating mechanism, provided by the interfacial shear stress, declined, gives the liquid film more dwell time on the cooled plate, accompanied by an enhanced condensation intensity. One distinctive feature can be found in the trend of U = 12.5   m / s , consisting of a higher film thickness for x < 120   mm compared to U = 10   m / s . The film thickness development gradients deliver plausible results, since the increasing shear-stress leads to lower thickness development gradients.
Figure 5 presents the result of an additional condensation measurement to address the difficulties of the optical limitation at the condensation initialization point. Since every cooling duct within the cooling plate can be individually controlled, the first half of the measurement plate remains uncooled during this test. Hence, the starting point of the condensation film is shifted to the optical accessible measurement range and can be further investigated. As expected, Figure 5 illustrates that no condensation film can be observed in the uncooled area. The condensation starting point is located at x = 180   mm , and is thereby located 10   mm further upstream than the beginning of the cooled area at x = 190   mm . This is due to the fact that the tempered measurement plate consists of continuous material, and axial heat conductance is not avoidable. Nevertheless, the starting point of the condensation, as well as the beginning of the cooled area, are relatively close to each other, despite the blurring effect of the plates’ axial heat conductance. Subsequently, the results of this experiment prove that the condensation starting point in the main experiment is located at the beginning of the measurement plate, since the plate and the rest of the measurement section exhibit a friction-type connection, leading to a significantly lower heat conductance in the axial direction.
Since the condensation starting area was not optically observable, the application of the square-root-based fitting approach needs to be verified. The measurement data in Figure 5 were fitted with the same square root approach as presented earlier. It is obvious that the square root fit matches the measurement points within the entire investigated area. Hence, it is proven that the square root approach is valid to approximate the raw measurement data alongside the whole measurement section.

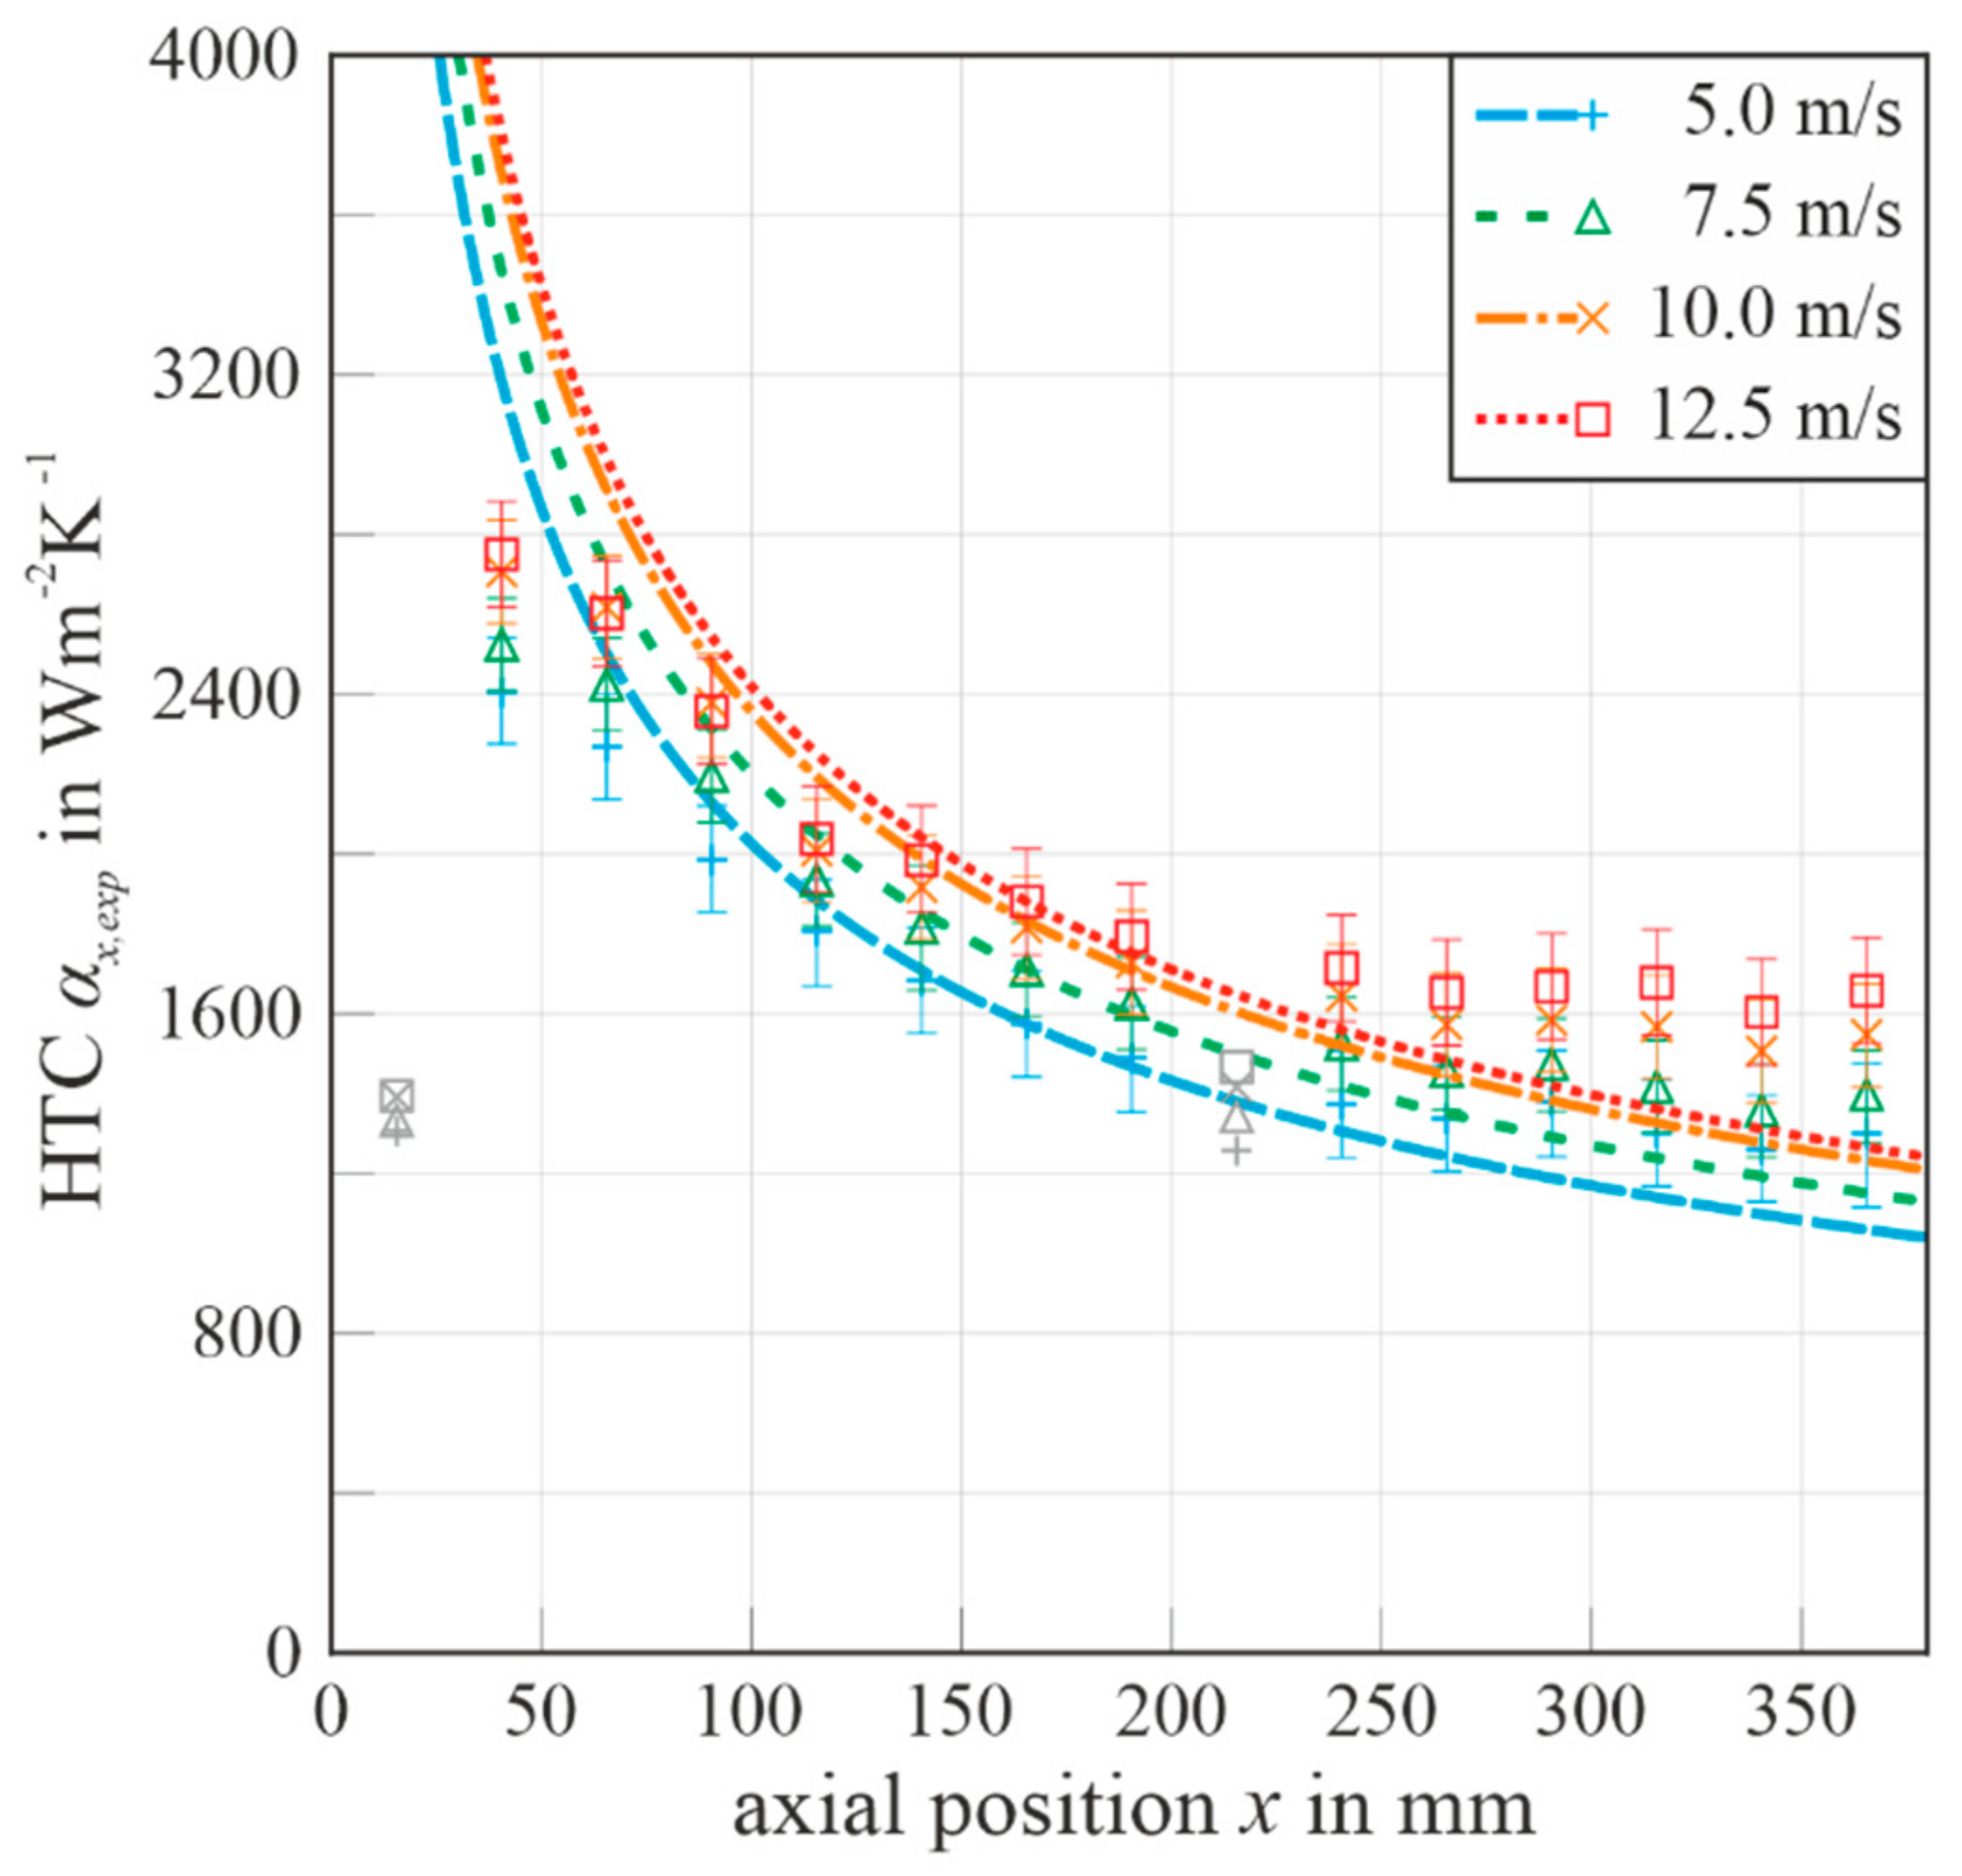
4.2. Heat Transfer Coefficient

The determination of α x , e x p is mainly based on the measurement of q ˙ x , the wall temperature T w and the saturated steam temperature T s . Hence, the temperature difference method, compared to Diller [14,15], was applied to determine q ˙ x , by measuring the temperature difference between T 50 % and T 0 % . By measuring T 99 % ,   0.5   mm below the surface, T w is linearly extrapolated with the temperature gradient between T 99 % and T 50 % . Subsequently, T s is determined by measuring the static steam pressure p . Overall, α x , e x p is calculated by
α x , e x p = λ w T 50 % T 0 % l z , 50 % , 0 % T s T w ,  
including the measurement inaccuracy, calculated by the classic error propagation approach as
Δ α x , e r r = α x λ w Δ λ w + 2 α x T X X % Δ T X X % + α x l z Δ l z + α x T s Δ T s + α x T w Δ T w .  
α x , e x p is measured at 15 equidistantly distributed positions along the measurement plate. Every measurement position consists of three TC Type T that are mounted within spark-eroded holes, measuring T 99 % ,   T 50 % and T 0 % . The manufacturing process assures a precise positioning of the TC within the holes, leading to a positioning error of Δ l z = ± 100   μ m . Prior to mounting, a calibration of all 45 temperature probes was performed in the range of 20   ° C 120   ° C , ensuring a TC inaccuracy of Δ T x x % = ± 0.1   K . The pressure probe exhibits an error of Δ p = ± 1   Pa , leading to Δ T s = ± 0.5   mK . Moreover, the thermal conductivity error was estimated by the accuracy of the alloy composition, leading to Δ λ w = ± 0.15   Wm 1 K 1 . Overall, the average HTC-error results in Δ α ¯ x , e r r = ± 112 , 526   Wm 2 K 1 .
Figure 6 shows the experimental results of α x , e x p , including power-function-based fits and measurement inaccuracies. The sensors at T 99 % lost connection to the wall, due to a mounting malfunction at the first measurement position, x 1 = 15.5   mm , as well as the ninth measurement position, x 9 = 215.5   mm . Both results have not been considered in the correlation approach, based on the function α x , f i t = a x b . All α x , e x p distributions show a regressive decline due to an increasing axial position x . An evident inverse relation between α x , e x p and δ x , e x p can be spatially observed. Additionally, both quantities are a function of U .

5. Model Validation

The central objective of this paper is the experimental validation of the theoretically calculated values of δ x and α x regarding the variation in the steam velocity. Figure 7 presents a comparison of the theoretical as well as the experimental data regarding (a) δ x and (b) α x .
In case of the liquid film thickness, it can be observed that the inverse-velocity-dependent declining progress of δ x , e x p was analogically predicted by the theoretical model. Furthermore, the spatial rise in δ x with rising x was also sufficiently predicted. The thickness predicted by the model was, overall, 2.3 times higher than the experimental investigated films, constituting a major difference between the model and experiment. A possible reason for this could be the influence of the experimental steam superheating of 100   K above the saturated steam temperature, which needs to be applied to prevent secondary condensation on the side walls. The additional superheated enthalpy share that needs to be transferred, besides the latent heat, contributed a heating effect to the liquid phase, inhibiting the condensation process and leading to a spatial reduction in the condensate amount. Subsequently, it can be stated that the theoretical model predictions are plausible and were qualitatively validated considering the fundamental influence of the local position x and U .
Regarding the HTC α x , the prediction quality of the model is very similar to the case of δ x . The theoretically predicted local decrease in α x in the flow direction is qualitatively confirmed by the experimental results. In addition, the impact, due to the velocity variation, further affirms the model’s qualitative validity. A major difference between the model and experiment is apparent in the spatial gradient. The model assumes a semi-infinite plate with a singularity at the front edge. In the theoretical calculation of α x , m o d , x appears in the denominator, leading to a singularity with infinite HTC. Since the front edge of the real measurement plate is in contact with the inlet section, the high HTCs at the axial starting position of the condensation will lead to axial heat conduction in the upstream direction. Hence, α x , e x p exhibits a reduced HTC gradient at the beginning of the plate. Another mismatch between the model and experiment is observable in the differing gradients at axial positions further downstream. The model predicts a steeper decline in the HTCs for all velocities, compared the experiment, which shows an ostensible saturation behavior.
This can be traced back to the physical thickness of the measurement plate, which is necessary to measure a temperature gradient to determine α x , e x p . The material consistency of the plate is inseparably connected with the occurrence of heat flux in the axial direction, causing a homogenization of the HTC distribution. Subsequently, the model can qualitatively be considered as validated, analogous to the case of δ x .

6. Conclusions and Outlook

In this paper, experimental data for shear-stress-driven liquid water films on a horizontal fully wetted surface are presented. Furthermore, these data were used for the qualitative validation of the analytical condensation model by Cess (1960) and Koh (1962). This model has never been validated before and the experimental results confirmed the qualitative prediction of the liquid film thickness δ x , as well as the local HTC distribution α x . Regarding the liquid film thickness, the following conclusions can be drawn:
  • δ x 
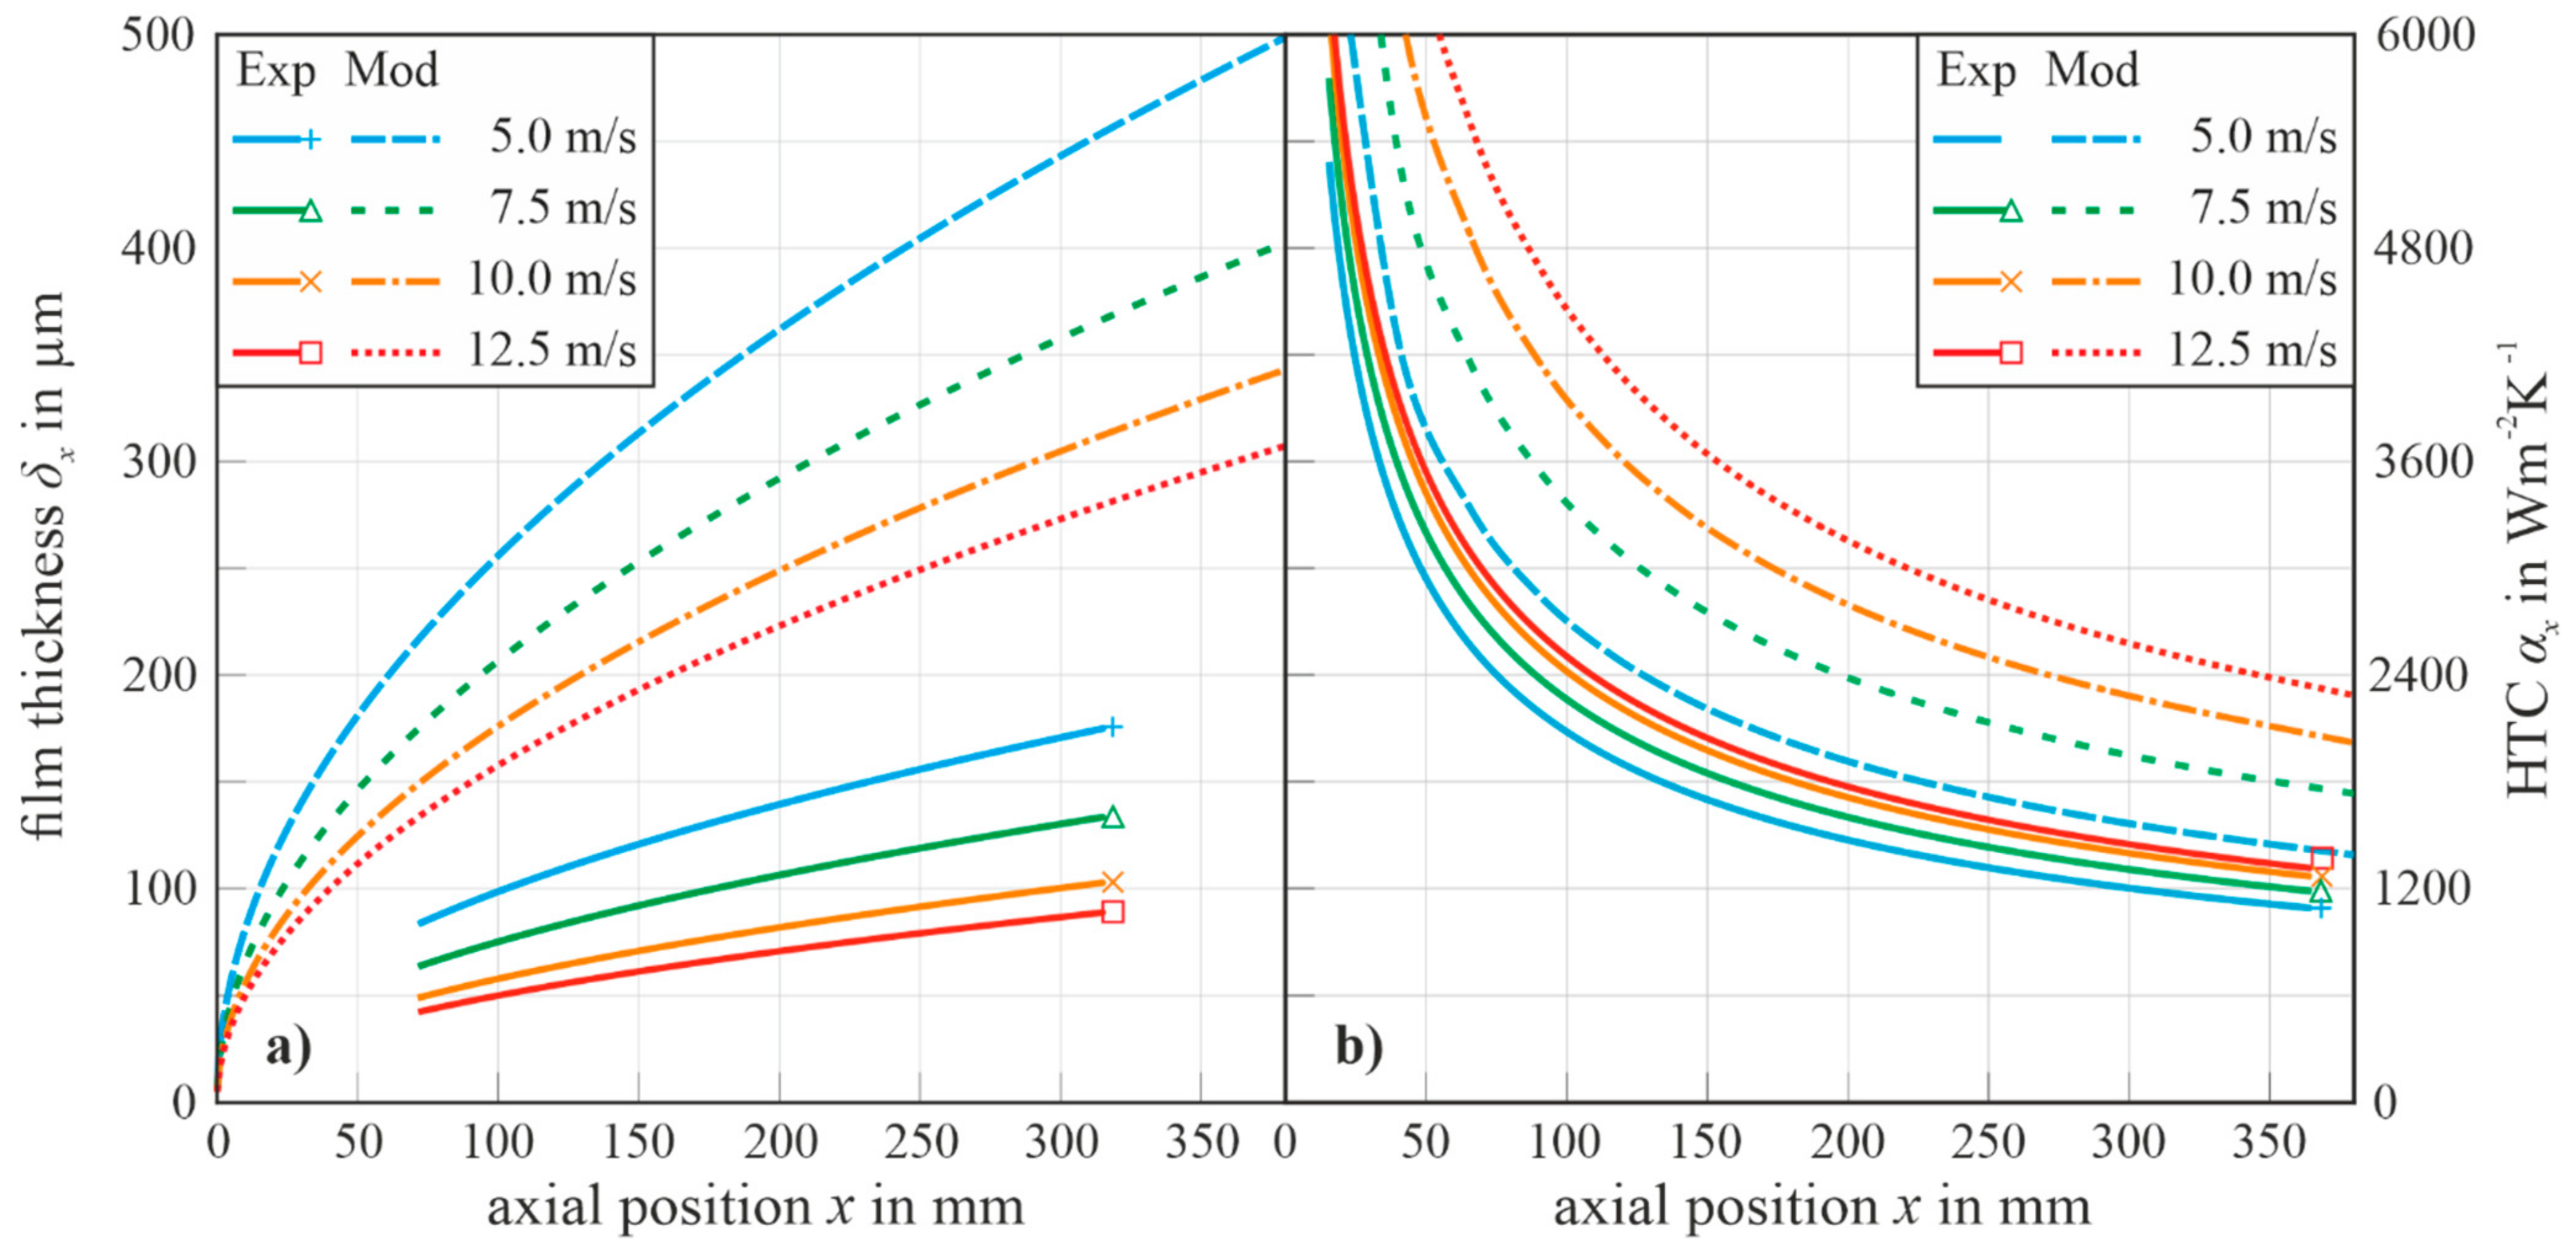
increases as a square root-function of the progressing overflow position x for all velocities.
  • The decrease in U leads to an increase in the δ x .
  • Regarding δ x , the model overestimates the thickness values regarding factor 2.3 compared to the experimental results due to the deferred steam temperature condition between the model and experiment.
Finally, regarding the heat transfer coefficient, the following conclusions can be drawn:
  • α x shows a regressive decline depending on an increasing axial position, x .
  • An evident inverse relation between α x and δ x can be spatially observed. Additionally, both quantities are a function of U .
  • The axial gradient of α x is predicted to be higher than the experimental results.
The results of this paper make a valuable contribution to the trustworthiness of the well-applied and widely distributed condensation model of Cess and Koh. This model is an integral part of the description of condensation processes, besides the experimentally validated Nusselt film theory. By proving the qualitative validity of this shear-stress-driven condensation model, the prediction reliability was fundamentally increased, enabling a comprehensive description of condensation cases regarding liquid condensate amount, as well as the connected HTC-distribution within the steam turbine design processes.

Author Contributions

Conceptualization, F.F.L.; methodology, F.F.L.; software, F.F.L.; validation, F.F.L.; formal analysis, F.F.L.; investigation, F.F.L.; resources, F.F.L.; data curation, F.F.L.; writing—original draft preparation, F.F.L.; writing—review and editing, S.S., S.H. and D.B.; visualization, F.F.L.; supervision, S.S.; project administration, D.B.; funding acquisition, D.B. and S.H. All authors have read and agreed to the published version of the manuscript.

Funding

This project is part of the AG Turbo joint research program, contract number 03ET7092I. The investigations were supported by the Federal Ministry of Economics and Energy (BMWi) as well as the Siemens Energy AG, Muelheim a.d.R., Germany.

Institutional Review Board Statement

Not applicable.

Informed Consent Statement

Not applicable.

Data Availability Statement

Not applicable.

Conflicts of Interest

The authors declare no conflict of interest.

Nomenclature

A area m 2 R e Reynolds number
c p specific heat at const. pressure J kgK T steam temperature K
h enthalpy J kgK U steam velocity m s
m ˙ mass flow rate kg s x axial position m
N u Nusselt number α heat transfer coefficient W m 2 K
l length m δ film thickness m
p steam pressure Pa η similarity variable
P r Prandtl number λ thermal conductivity W mK
q ˙ heat flux density W m 2 μ dynamic viscosity Pa · s
Q ˙ heat flux/cooling capacity W ν kinematic viscosity m 2 s
r Koh coefficient ρ density kg m 3
R correlation coefficient τ shear stress Pa
R a average roughness value m

Indices

steam flow conditions s c a t scattering
c cooling plate w a v e wavelet
e r r error/inaccuracy w wall
e v a p evaporation x direction x—horizontal parallel to flow
e x p experimental y direction y—horizontal orthogonal to flow
g gaseous z direction z—vertical orthogonal to flow
l liquid 0 % Pos. at 0 % meas. plate height
m a x maximum 50 % Pos. at 50 % meas. plate height
m i d middle 99 % Pos. at 0.5   mm below meas. surface
m i n minimum + dimensionless
m o d model ~ amplitude
s saturation average

References

  1. Cess, R.D. Laminar-film condensation on a flat plate in the absence of a body force. Z. Angew. Math. Phys. 1960, 11, 423–433. [Google Scholar] [CrossRef]
  2. Koh, J. Film condensation in a forced-convection boundary-layer flow. Int. J. Heat Mass Transf. 1962, 5, 941–954. [Google Scholar] [CrossRef]
  3. Kulkarni, S.; Narain, A.; Mitra, S. Forced Flow of Vapor Condensing Over a Horizontal Plate (Problem of Cess and Koh): Steady and Unsteady Solutions of the Full 2D Problem. J. Heat Transf. 2010, 132, 101502. [Google Scholar] [CrossRef] [Green Version]
  4. Nusselt, W. Die Oberflächenkondensation des Wasserdampfes. VDI-Zs 1916, 60, 541–546. [Google Scholar]
  5. Narain, A.; Liang, Q.; Yu, G.; Wang, X. Direct Computational Simulations for Internal Condensing Flows and Results on Attainability/Stability of Steady Solutions, Their Intrinsic Waviness and Their Noise Sensitivity. J. Appl. Mech. 2004, 71, 69–88. [Google Scholar] [CrossRef] [Green Version]
  6. Phan, L.; Narain, A. Nonlinear Stability of the Classical Nusselt Problem of Film Condensation and Wave Effects. J. Appl. Mech. 2006, 74, 279–290. [Google Scholar] [CrossRef] [Green Version]
  7. Sparrow, E.M.; Gregg, J.L. A Boundary-Layer Treatment of Laminar-Film Condensation. J. Heat Transf. 1959, 81, 13–18. [Google Scholar] [CrossRef]
  8. Lapp, F.F.; Schuster, S.; Hecker, S.; Brillert, D. The Multi-Phase Flow Test Facility “EMMA” to Investigate Local Heat Transfer Coefficients and Liquid Water Films at Wet Steam Conditions [GT2020-16307]. In Proceedings of the ASME Turbo Expo 2020, London, UK, 22–26 June 2020. [Google Scholar]
  9. Precitec Optronik GmbH. Overview Interferometric Point Sensors—CHRocodile 2 LR; Gaggenau: Bad Rotenfels, Germany, 2019. [Google Scholar]
  10. DIN–German Institute for Standardization. Material Numbers–Part 4: System of the Principal Groups 2 and 3: Non-Ferrous Metals; DIN EN 17007-4; Beuth Verlag GmbH: Berlin, Germany, 2012. [Google Scholar]
  11. Batz + Burgel GmbH & Co. KG Material Data Sheet: EN AW–2007 (AlCu4PBMgMN- 3.1645); Batz + Burgel GmbH & Co.: Friedberg, Germany, 2019. [Google Scholar]
  12. DIN–German Institute for Standardization. Designation Systems for Steels–Part 2: Numerical System; DIN EN 10027; Beuth Verlag GmbH: Berlin, Germany, 2015. [Google Scholar]
  13. DEW–Deutsche Edelstahlwerke, Specialty Steel GmbH & Co. KG. Technical Data Sheet, X6CrNiMoTi17-12-2, 1.4571; DEW–Deutsche Edelstahlwerke, Specialty Steel GmbH & Co. KG: Witten, Germany, 2019. [Google Scholar]
  14. Diller, T.E. Advances in Heat Flux Measurements. Adv. Heat Transf. 1993, 23, 279–368. [Google Scholar]
  15. Lapp, F.F.; Schuster, S.; Hecker, S.; Brillert, D. Experimental validation of an analytical condensation model for the improvement of steam turbine design regarding flexibility requirements. In Proceedings of the 14th European Conference on Turbomachinery Fluid Dynamics & Thermodynamics, ETC2020-562, Gdansk, Poland, 12–16 April 2021. [Google Scholar]
Figure 1. Measurement section with instrumentation locations and optical accessible range.
Ijtpp 07 00009 g001
Figure 2. The chosen curve-fitting equation based on a square root function, exemplarily displayed at U = 12.5   m / s .
Ijtpp 07 00009 g002
Figure 3. The frequency spectrum of the FFT-processed signals that are subsequently retransformed for the first 10   Hz at two axial positions, exemplarily displayed at U = 12.5   m / s .
Ijtpp 07 00009 g003
Figure 4. Experimental results of δ x , e x p including square root fits and 95% confidence intervals.
Ijtpp 07 00009 g004
Figure 5. Experimental result of the film thickness on a plate, solely cooled in the second half at U = 10   m / s .
Ijtpp 07 00009 g005
Figure 6. Experimental results of α x , e x p including power-function-based fits.
Ijtpp 07 00009 g006
Figure 7. Comparison of the experimental and theoretical results regarding (a) δ x and (b) α x .
Ijtpp 07 00009 g007
Publisher’s Note: MDPI stays neutral with regard to jurisdictional claims in published maps and institutional affiliations.

