Article

Numerical Steady and Transient Evaluation of a Confined Swirl Stabilized Burner

by
Federica Farisco
*,†,
Luisa Castellanos
,
Jakob Woisetschläger
and
Wolfgang Sanz
Institute of Thermal Turbomachinery and Machine Dynamics— ITTM, Graz University of Technology, 8010 Graz, Austria
*
Author to whom correspondence should be addressed.
Current address: German Aerospace Center (DLR), Institute of Combustion Technology, 70569 Stuttgart, Germany.
Int. J. Turbomach. Propuls. Power 2021, 6(4), 46; https://doi.org/10.3390/ijtpp6040046
Submission received: 6 August 2021 / Revised: 1 October 2021 / Accepted: 24 November 2021 / Published: 30 November 2021

Abstract

:
Lean premixed combustion technology became state of the art in recent heavy-duty gas turbines and aeroengines. In combustion chambers operating under fuel-lean conditions, unsteady heat release can augment pressure amplitudes, resulting in component engine damages. In order to achieve deeper knowledge concerning combustion instabilities, it is necessary to analyze in detail combustion processes. The current study supports this by conducting a numerical investigation of combustion in a premixed swirl-stabilized methane burner with operating conditions taken from experimental data that were recently published. It is a follow-up of a previous paper from Farisco et al., 2019 where a different combustion configuration was studied. The commercial code ANSYS Fluent has been used with the aim to perform steady and transient calculations via Large Eddy Simulation (LES) of the current confined methane combustor. A validation of the numerical data has been performed against the available experiments. In this study, the numerical temperature profiles have been compared with the measurements. The heat release parameter has been experimentally and numerically estimated in order to point out the position of the main reaction zone. Several turbulence and combustion models have been investigated with the aim to come into accord with the experiments. The outcome showed that the combustion model Flamelet Generated Manifold (FGM) with the k- ω turbulence model was able to correctly simulate flame lift-off.

1. Introduction

The correct modelling of the flow field in lean premixed combustors requires a deep understanding of the phenomena directly resulting in instability. It is, therefore, necessary to know the thermo-chemical processes that are influencing the main reaction zone in order to obtain more insight into the prediction of lean combustion.
The flow field in swirl-stabilized combustors was investigated and explained in different papers (see [1,2]). The first cited work reviewed the knowledge gained on vortex breakdown over the past 45 years. The paper was divided in three subsections (experimental, numerical and theoretical) where a clear structure of the flow pattern was underlined.
The next cited study [2] described in detail the main parameters influencing industrial dry-low emission (DLE) swirl-stabilized combustors. The authors outlined also the progress concerning numerical investigations of swirl-stabilized combustion.
One of the most common method used for the measurement of heat release concerns the analysis of OH* radical chemiluminescence in the flame [3,4]. A large amount of research [5,6,7,8] has been carried out to provide an overview of different techniques applied to analyze the flame dynamics. Chemiluminescence has proved to be an efficient method for investigating global heat release fluctuations (see [9,10]). Balachandran et al. [9] performed measurements of heat release with OH* and CH* chemiluminescence pointing out that the global heat release estimated for both chemiluminescence parameters was in good agreement with respect to magnitude and phase. The work of Greiffenhagen et al. [10] investigated Laser Interferometric Vibrometry (LIV) as an addition to chemiluminescence in order to analyze heat release perturbations in the flame. Laser Interferometric Vibrometry (LIV) records directly the time derivative of density fluctuations along the laser beam path in unconfined and confined flames. Local measurements are obtained from integrals data by tomography or Abel inversion (Greiffenhagen et al. [11]). Numerical RANS (Reynolds Averaged Navier–Stokes) simulations have been presented in [12] for the same geometry analyzed in [10].
Detailed models and up to date experimental techniques are required to estimate combustor capabilities [13]. In the previous paper [13], the authors underlined the importance of an optimal three-step global reaction mechanism for methane-air mixtures that were used in their numerical analysis. Review papers by [13,14,15] present recent numerical progress related to the evaluation of swirl-stabilized flames. In [14] few swirl stabilized burner configurations have been investigated by comparing several turbulence models such as the standard k- ϵ model, the RNG k- ϵ model and the Realizable k- ϵ model. The authors observed that the calculations predicted correctly the experimental profile shapes; in particular, the application of RNG k- ϵ carried out a slight advantage compared to Realizable k- ϵ .
The work of [15] described the derivation of a Flamelet Generated Manifold model and its use for turbulent flames with Large Eddy Simulation (LES) and RANS. The flame front was modeled in these cases through the Probability Density Function (PDF) approach that takes into consideration non-equilibrium aspects [16]. The results pointed out that this chemical method is an accurate technique for modeling premixed combustion. In the work of [16], the authors proved also that the transient Scale Adaptive Simulation (SAS) model was capable for depicting the trademark of the unsteady flame in a more accurate manner compared to RANS.
However, accurate RANS flow simulations represent a standard tool applied within industrial design process suitable to reproduce the main flow characteristics using less computational time compared to LES or Detached Eddy Simulation (DES) methods.
This paper combines an analysis of several turbulence and combustion models of diverse complexity. The model’s capability to reproduce the characteristics of the investigated combustor is studied. The CFD code Ansys Fluent v2020 R1 is used in the current study and is applied as combustion models with respect to the Eddy Dissipation Model (EDM) developed by Magnussen and Hjeertager [17], Steady Laminar Flamelet model (SLF) [18] and Flamelet Generated Manifold (FGM).
The scope of this work is to identify the most accurate combustion and turbulence model able to predict the correct behavior of the investigated combustor by using the estimation of temperature contours and species concentration.
This study is a follow-up of the paper of Farisco et al. [12] where a steady numerical analysis was performed with a different combustor compared to the current confined one in order to see if the results can be improved.
The current RANS (Reynolds Averaged Navier Stokes) numerical procedure is the same compared to [12]. Whereas in [12], the unconfined burner could not be correctly reproduced by any turbulence or combustion models, in the current confined case, the simulations will show a better agreement with the experimental data available. Furthermore, in this study, the results obtained by an unsteady investigation via Large Eddy Simulation (LES) of the confined combustor are also included. The outcomes of this research could be used as baseline for further industrial applications. Nevertheless, more research needs to be performed with a focus on understanding the complex flow effects and limitations of combustion models.

2. Combustor Domain Investigated

The numerical domain represents the geometry used for the experiments. The data were obtained on a lean, swirl-stabilized methane combustor with a cylindrical confinement under atmospherically conditions. A quartzglass cylinder was used with a height of 210 mm, an outer diameter of 120 mm and a wall thickness of 3 mm. The thermal power of the combustor was 3.44 kW and the mean equivalence ratio had the value of 0.88. Figure 1 presents the configuration of the confined configuration investigated. The burner (outer diameter of D = 18 mm) consists of a premixed axial and tangential line and a cooling air supply (see Greiffenhagen et al., 2020 [19]).The tangential air is premixed with the fuel and is then transferred into the inner area of the methane burner by a swirler consisting of 32 feed lines with a tangential alignment. The fuel-oxidizer mixture streams swirl into the combustion chamber, and it is ignited. The axial and radial pressure gradients that are produced by this swirling flow into the combustion chamber, create a recirculation zone which reduces the turbulent flow speed of the injected mixture compared to the flame speed. This effect operates as a stabilizing mechanism where the flame can burn at a fixed location, and additionally it guarantees that sufficient heat is available to ignite the upcoming fuel-oxidizer mixture. A swirl number value of 0.53 is obtained, taking into account the formulation of Candel et al. (2014) [20].

Swirl Flow Structure

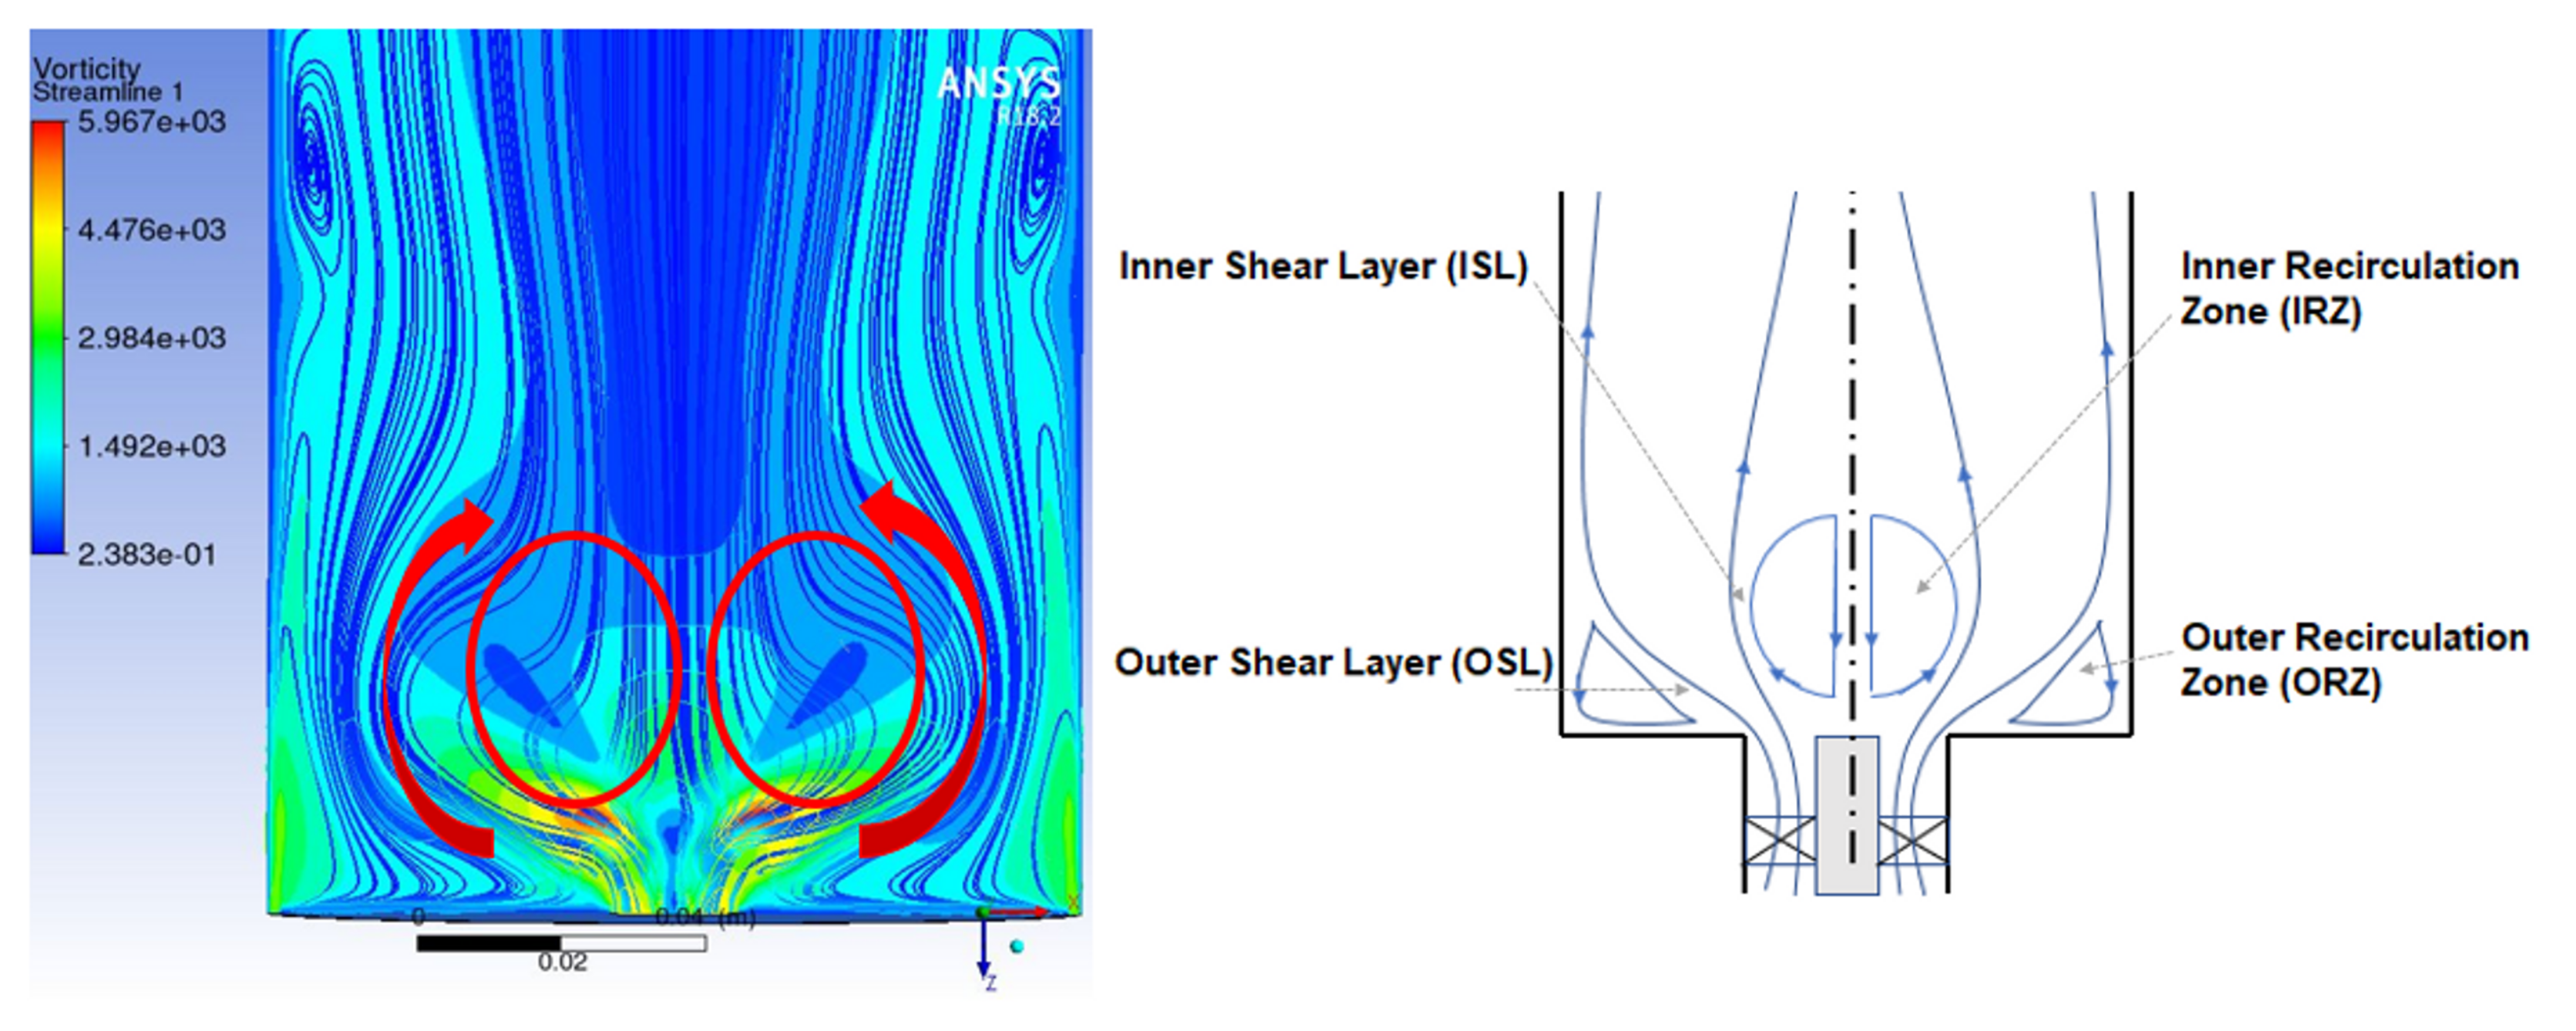
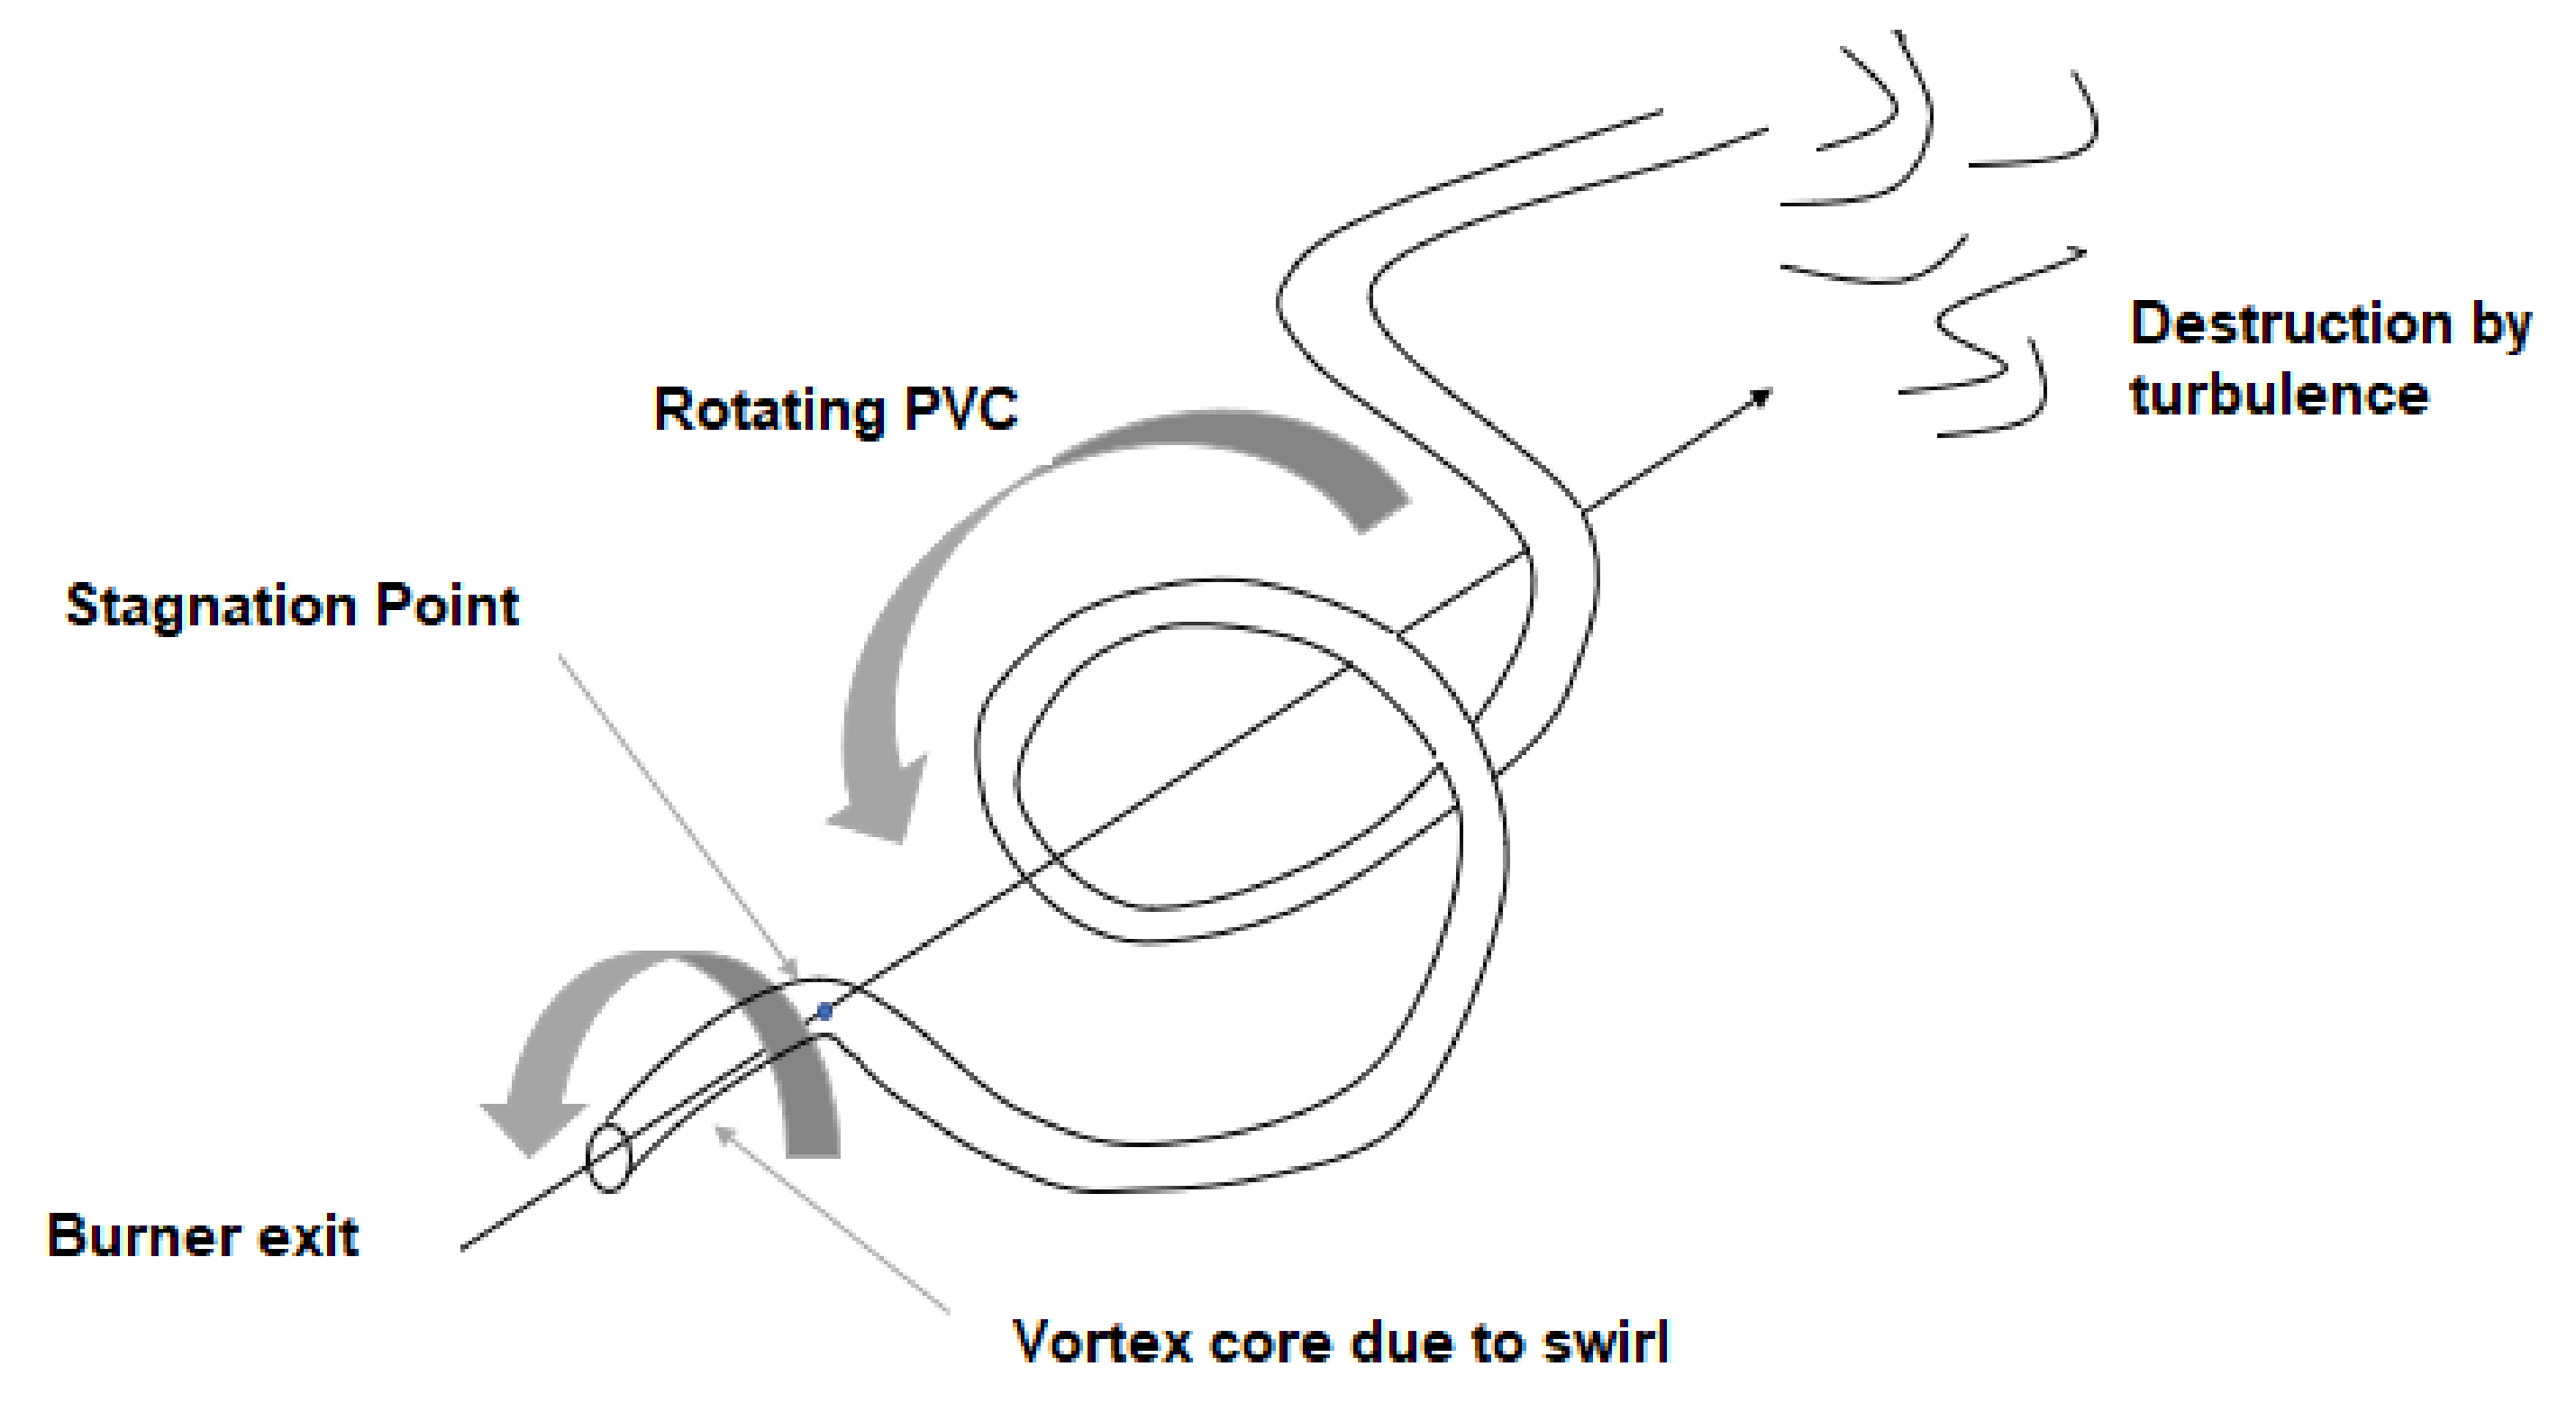
To clearly understand the outcomes of this work, a short description of the flow structures present in a swirl stabilized flame is provided. The flow field produces (see Figure 2) an outer recirculation zone (ORZ) that is a toroidal recirculating area due to the fast evolution of the nozzle into the combustor; an inner recirculation zone (IRZ or vortex breakdown) related to the vortex breakdown characterized by stagnation points and reversing flows that increases flame stabilization; and the high velocity annular fluid jet delimited by the inner and outer shear layers.Velocity perturbations modify the speed of this annular jet, resulting in oscillations of the flame. Another common type of a coherent vortex in swirl flames is the precessing vortex core (PVC) (see Figure 3). It develops when a central vortex core starts to precess around the axis of symmetry at a certain frequency [21].

3. Experimental Setup

Experimental data are taken from a published study (see [19]). For more details concerning the LIV measurement technique and equipment, refer to papers [11,19].

4. Mesh Generation

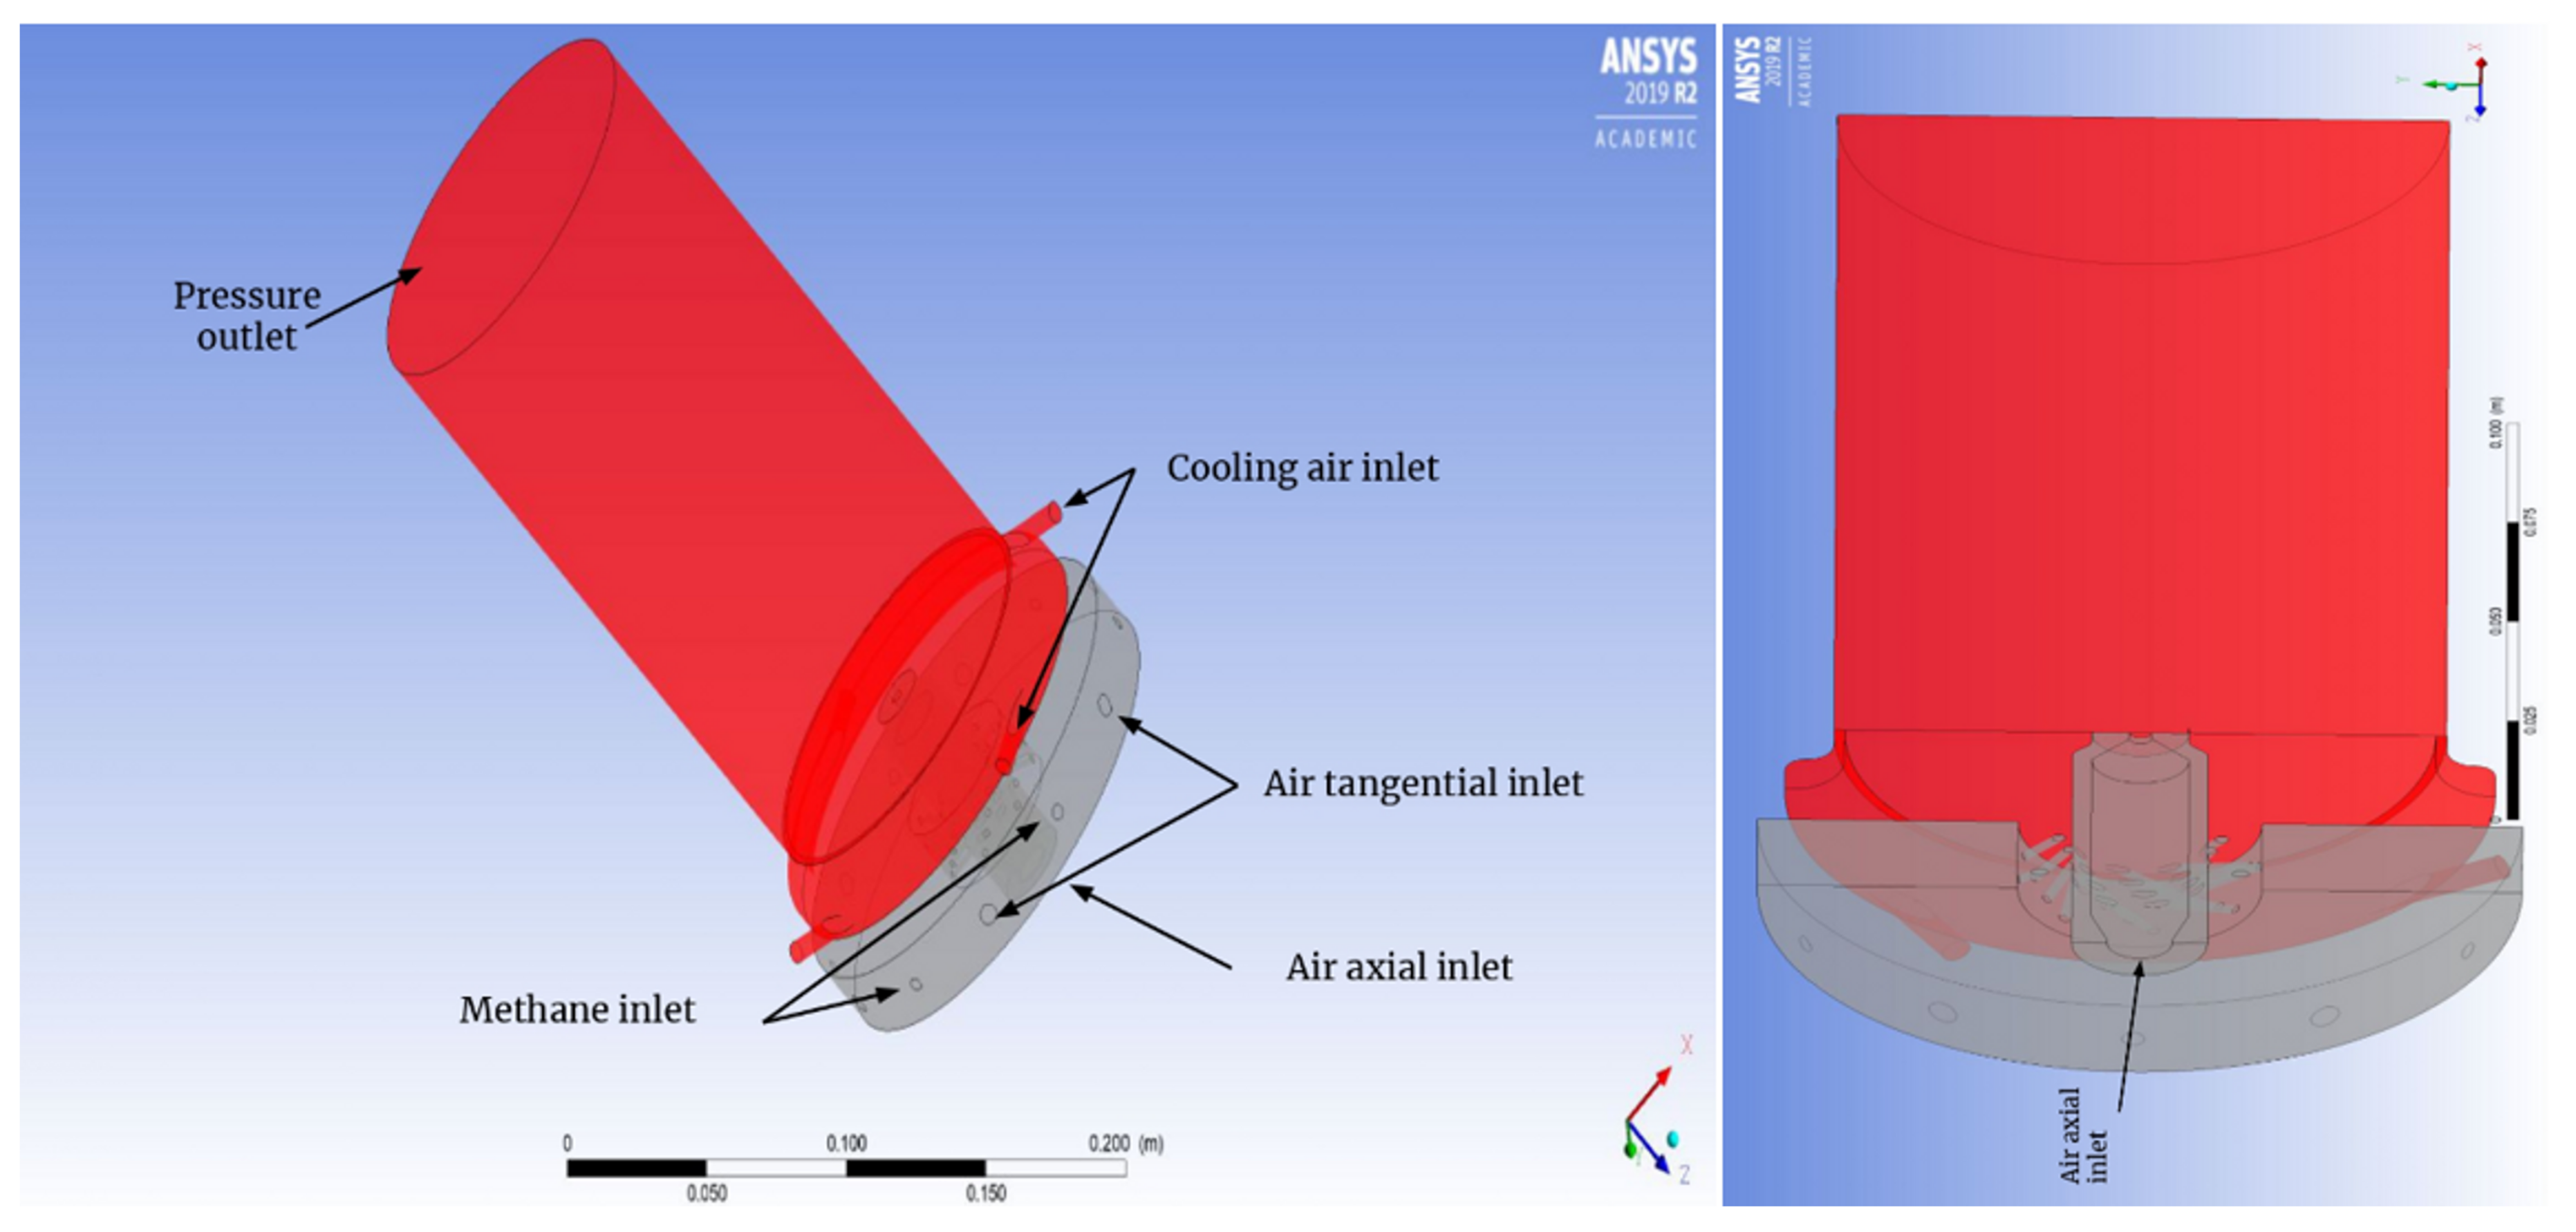
Several meshes are performed within this work, and a mesh independency study is carried out. The commercial tools ANSYS mesher and ICEM are used in order to generate meshes. Figure 4 underlines the numerical domain of the confined combustor analyzed in the simulations.
The coarsest mesh is obtained with a first cell-center positioned at a non-dimensional wall distance of y + = 3. It consists of 4,165,157 cells, and it is refined in order to investigate the sensitivity of the numerical results. In addition to the coarsest mesh, two other refined meshes are generated. The one with y + = 2 has 1.5 times the number of nodes in each segment, and the y + = 1 mesh has two times the number of nodes. However, mesh independency is obtained with the coarsest mesh used. Simulations with cold flow and the RNG k- ϵ and k- ω turbulence models are performed with all meshes analyzed. The swirl number and the axial velocity profiles are used to investigate the behavior of different refined meshes.
The simplified form of the swirl number equation is taken according to the experiments [8,20]. The same method for the calculation of the swirl number applied in the experiments is used also in the numerics to obtain a more accurate comparison between the two approaches. For the swirl number analysis, the simplified swirl number is calculated at two different distances, respectively: a quarter and half of the inlet diameter D. In order to obtain it, velocity profiles are extracted from line sampling in the x and y directions. The integration of absolute velocity values is performed by using a Riemann sum. The results of this integration are used for calculating the swirl number. A value of swirl number is obtained for an x-parallel line of samples and for the y-parallel line, then an averaging of both values is performed (as shown in Equations (1)–(3)). The suggestions shown in the literature [7] have been used to select the burner exit diameter as an integral boundary.
S x = 2 0 D 2 v w x 2 d x D 0 D 2 w 2 x d x
S y = 2 0 D 2 u w y 2 d y D 0 D 2 w 2 y d y
S = S x + S y 2
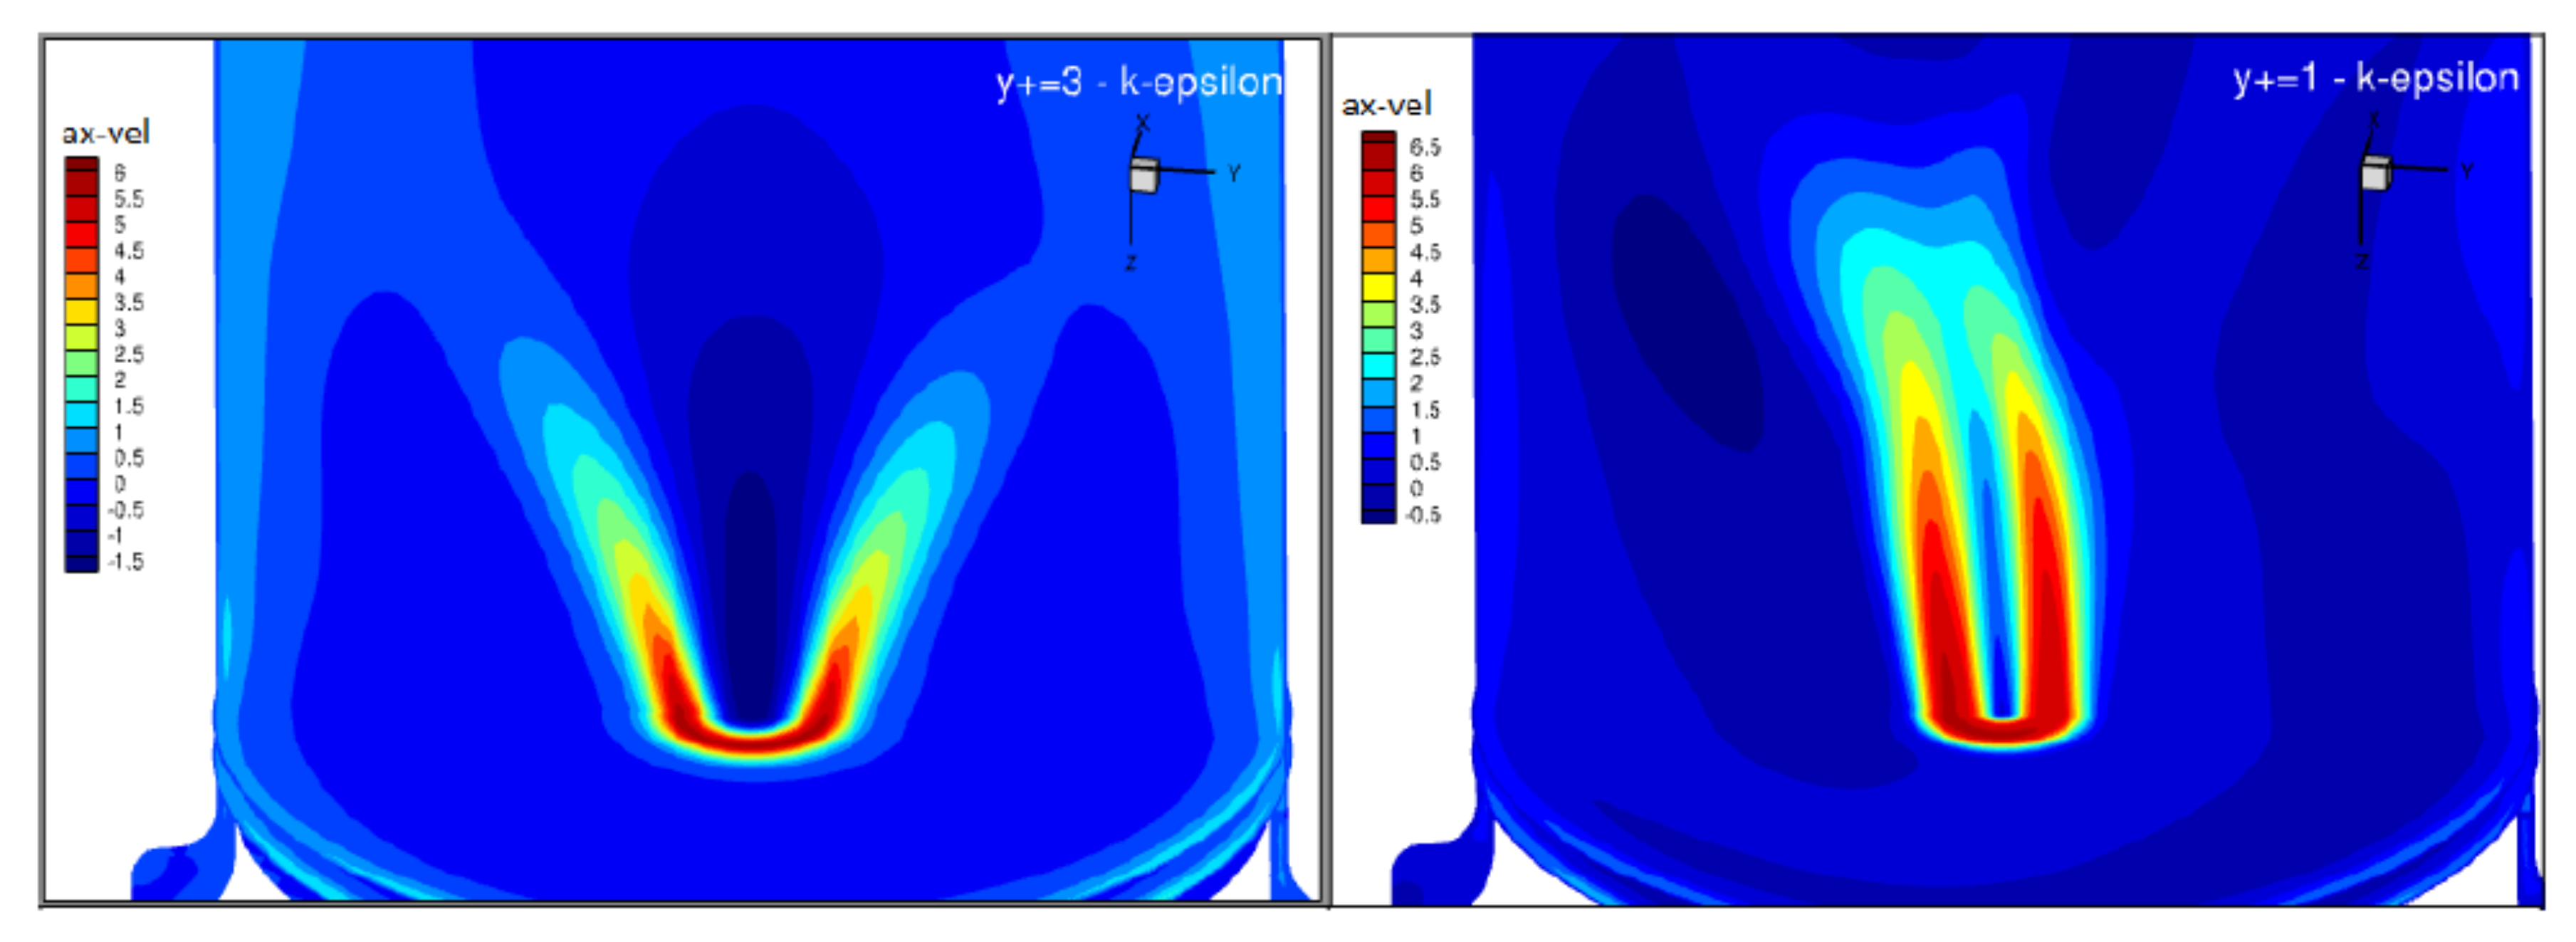
For the cold flow simulations, the averaged swirl numbers obtained with the coarsest mesh y + = 3 and with the finer mesh y + = 1 with both RNG k- ϵ and k- ω turbulence models are presented in Table 1 and Table 2 at both D / 4 and D / 2 calculated distances. It can be observed that the higher swirl numbers are reached by the coarsest mesh with y + = 3. Figure 5 shows the axial velocity profile on the middle plane for the k- ϵ model with y + = 3 mesh (on the left side) and k- ϵ with y + = 1 mesh (on the right side). This parameter underlines, for the k- ϵ model with the y + = 3 mesh, a flow type II according with respect to the nomenclature of the International Flame Research Foundation. This case presents a V-shaped or M-shaped expansion of the flame with an angle of about 40°, pointing out a similar trend as observed in the measurements (for more details see the section “Results”). Instead, the axial velocity profile for the k- ϵ with the y + = 1 mesh shows a type of flow quite different and more similar to a flow type I. For this reason, the coarsest mesh with y + = 3 is chosen because the swirl is slightly better conserved along the burner exit region with values slightly higher and closer to the experiments, and it guarantees less numerical time compared to the finer meshes generated.
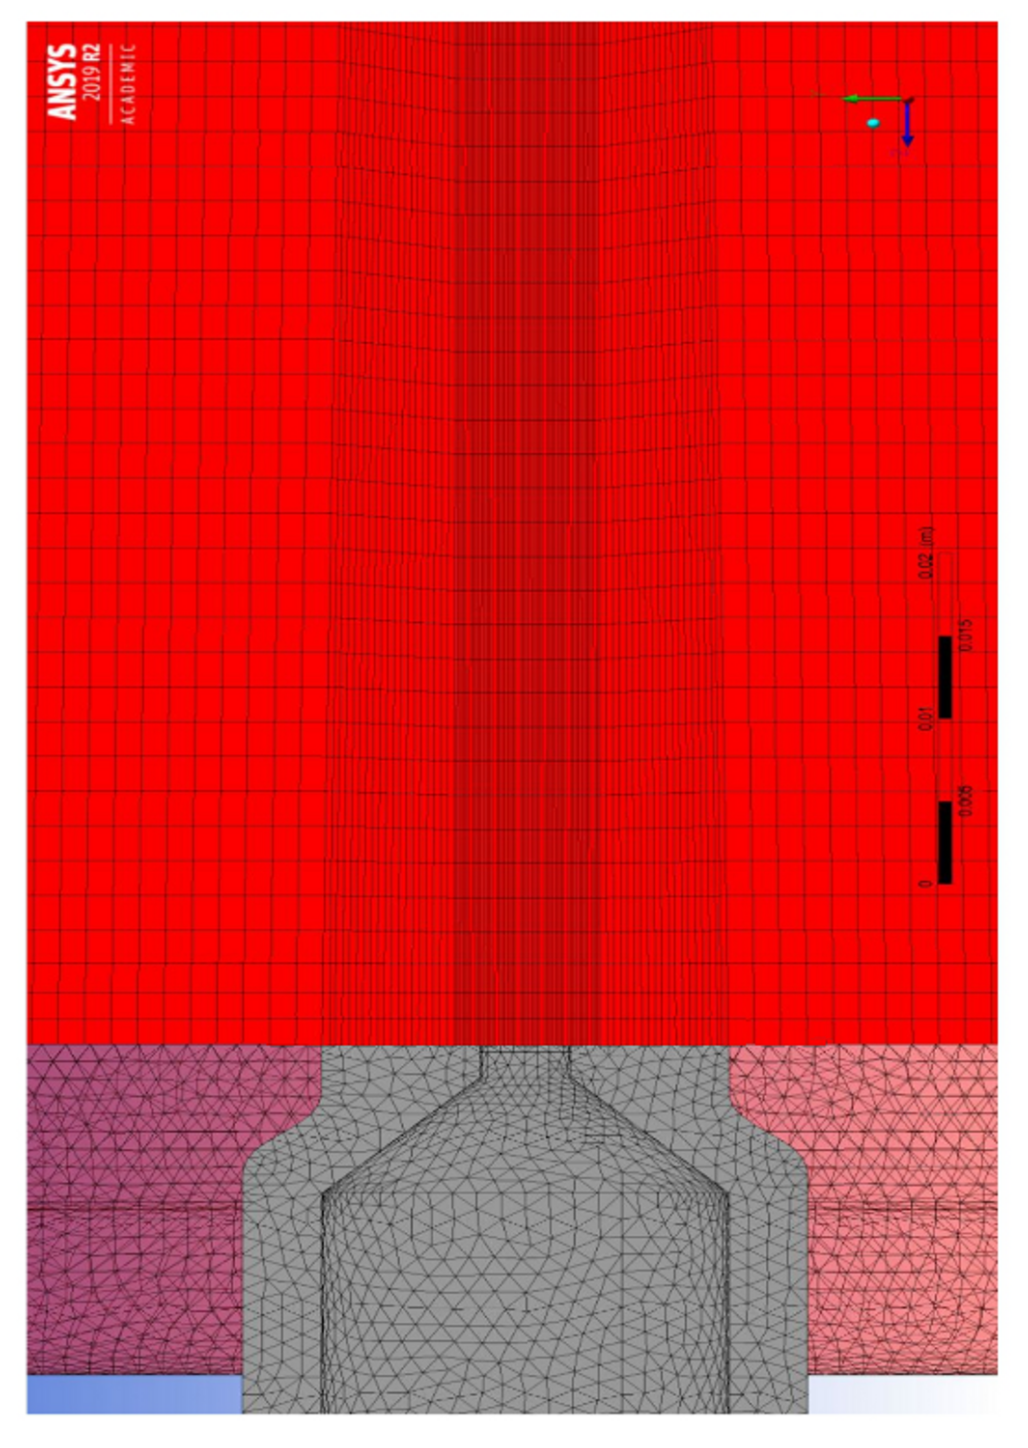
A detail of the mesh used for the simulations is shown in Figure 6. A hybrid mesh is proposed for a better resolution of the domain. In order to decrease computational time, a reduced domain consisting of the entire hexahedral cylindrical exit burner is adopted for the combustion simulations.
The cell structure applied in the generated meshes is presented in Figure 6. In the area where the flame occurs, which is influenced by high velocity and temperature gradients, hexahedral cells are used to ensure high numerical reliability. The hex-cells produce reduced numerical dissipation compared to the tetrahedral cell shape, seeing that they are aligned with the flow direction and they decrease the number of cells (the reader is referred to [13]). Due to the fact that the region inside the burner is represented by a configuration with the swirler consisting of small tubes, it is modelled using tetrahedral cells. This mesh is also used in the transient simulation. An approximate estimation for the integral length scale l 0 could be evaluated using k, ϵ and ω values from the RANS simulations. In order to resolve an eddy with a length scale l, it is necessary to have a couple of cells in each direction. Then, a resolution of the eddies with sizes larger than half size of the integral length scale ( l 0 /2) is required to obtain 80% of the turbulent kinetic energy (as stated in [23,24]). Approximately five cells are needed across the integral length scale l 0 [23], and the current mesh is also used in the unsteady simulation presented this feature.

5. Numerical Approach

In this work, the RANS numerical method is applied through the CFD code ANSYS Fluent to identify the main flow features within the cold flow and combustion processes. The simulations are performed in such a manner that the effects of the turbulence model are isolated. The SIMPLE method is used pressure–velocity coupling. The segregated solver is applied since partially premixed models do not allow the use of the coupled one. Concerning spatial discretization, the second order upwind scheme is preferred over the quadratic upwind scheme QUICK for the turbulent kinetic energy, momentum and specific dissipation rate in order to ensure a smoother simulation trend. The Peclet number is calculated as the ratio of the hyperbolic part of the Navier–Stokes equations relative to the parabolic part and using the first cell height for each mesh elaborated. The minimum value computed is 70, which indicates a considerable amount of advection. Pressure discretization type PRESTO is used. The Reynolds number 2554 is calculated based on inlet conditions. The convergence obtained with several parameters, such as velocity, temperature, CH 4 and CO 2 species, is detected through monitor points that are positioned at few locations close to the burner’s exit.
FGM with premixed flamelets approach is also applied for transient simulation since it shows accurate results in RANS simulations and ensures reduced computational time. The SIMPLE approach for pressure-velocity coupling is considered. For LES, the Subgrid-Scale model (SGS) Kinetic Energy Transport is applied since it ensures lower computational cost, and it should be suitable for flows with strong recirculation zones. For the LES numerical simulation, a time step of Δ t = 0.000025 s is taken with a time duration up to 0.75 s.

5.1. Boundary Conditions Applied

The numerical boundary conditions are derived by the measurements in order to ensure a validation of the numerics against the experimental data available. The mean equivalence ratio of Φ = 1 λ = 0.88 ( λ set as fixed air excess parameter) and a constant thermal power of P t h = 3.44 kW are considered for the current numerical study. For cold flow calculations, the density is maintained constant, while it has an effect in the combustion process. The following values are taken for the mass flows: m ˙ C H 4 = 0.068 g/s, m ˙ a x = 0.705 g/s, m ˙ t a n = 0.628 g/s and m ˙ c o o l i n g = 1.2 g/s, matching the experimental values. The domain is specified by setting mass flow and total temperature at the inlets and atmospheric pressure at the burner’s outlet. Concerning the smaller region used for combustion simulations, one inlet mass flow is assigned in the axial direction consisting of premixed fuel, axial and tangential air. For the LES case, a forced response approach has been also used in the simulations, imposing a pressure wave excitation at the inlet of the combustor. The signal applied is a sine signal. Due to the fact that at a perturbation frequency of 225 Hz, a sharp peak of thermo-acoustic oscillations was recorded during the measurements, the same excitation frequency has been used also in the simulations. The formula applied for the mass flow fluctuations at the geometry inlet is shown in Equation (4).
m ˙ = 0.001366 + 0.000035025 s i n ( 2 π × 225 × t )
The fluctuating mass flow value of 0.000035025 represents almost 3% of the constant mass flow term 0.001366. Pressure signals have been recorded at various points along the flow path during numerical calculations. The walls of the combustor have been set as diabatic taking the same glass temperature measured in the experiments. The Discrete Ordinates (DO) model is also applied to include the thermal radiation. Enhanced wall treatment is adopted as model for the flow near the wall (see [24,25]) assigning the value y + = 3 along the burner walls.

5.2. Turbulence-Chemistry Models

Many elementary reactions and species are included within the methane-air combustion. In order to lower computational effort in CFD combustion calculations, the species number has to be reduced. In order to describe the chemistry of methane-air mixtures, several reaction mechanisms are available in literature. The two-step mechanism introduced by Westbrook [26] is applied for the ED model in this work. The GRI-3.0 detailed mechanism of methane-air combustion is also adopted for the cases with flamelets formulation. This last chemical method is described by Smith et al. [27] for hydrocarbon combustion and is further verified in the literature.
Within the current study, the Eddy Dissipation Model was analyzed, and the outcomes are compared against FGM and SLF flamelet approaches.
Laminar flames are used to model the turbulent flame front in the flamelet formulations. Density, temperature and species concentration are obtained as results of the equations in every location of the laminar flamelet main reaction zone. The mixture fraction and scalar dissipation are used as main parameters to define the concentrations of fuel and oxidant. A Probability Density Function (PDF) combines instantaneous temperature and species values obtained from flamelet calculation with the turbulent flow [24]. For this study, both premixed and diffusion flamelets are selected to calculate the flamelet manifold. Finite Rate is used for the progress variable source. The turbulence-chemistry interaction approach in FGM is described by the variances of the progress variable and mixture fraction.

6. Results

6.1. Cold Flow

For the cold flow case, a converged solution with RNG k- ϵ turbulence model is obtained. RNG k- ϵ turbulence model with enhanced wall treatment is chosen because it is suited low Reynolds flows. Figure 7 shows the velocity magnitude profile for the cold flow along the middle plane. The radial section of the velocity field is introduced for all cold flow and combustion simulations due to its axial symmetry (x = 0 burner axis). With a similar but unconfined burner geometry, different turbulence and combustion models were already investigated in Fluent by Farisco et al. [12].
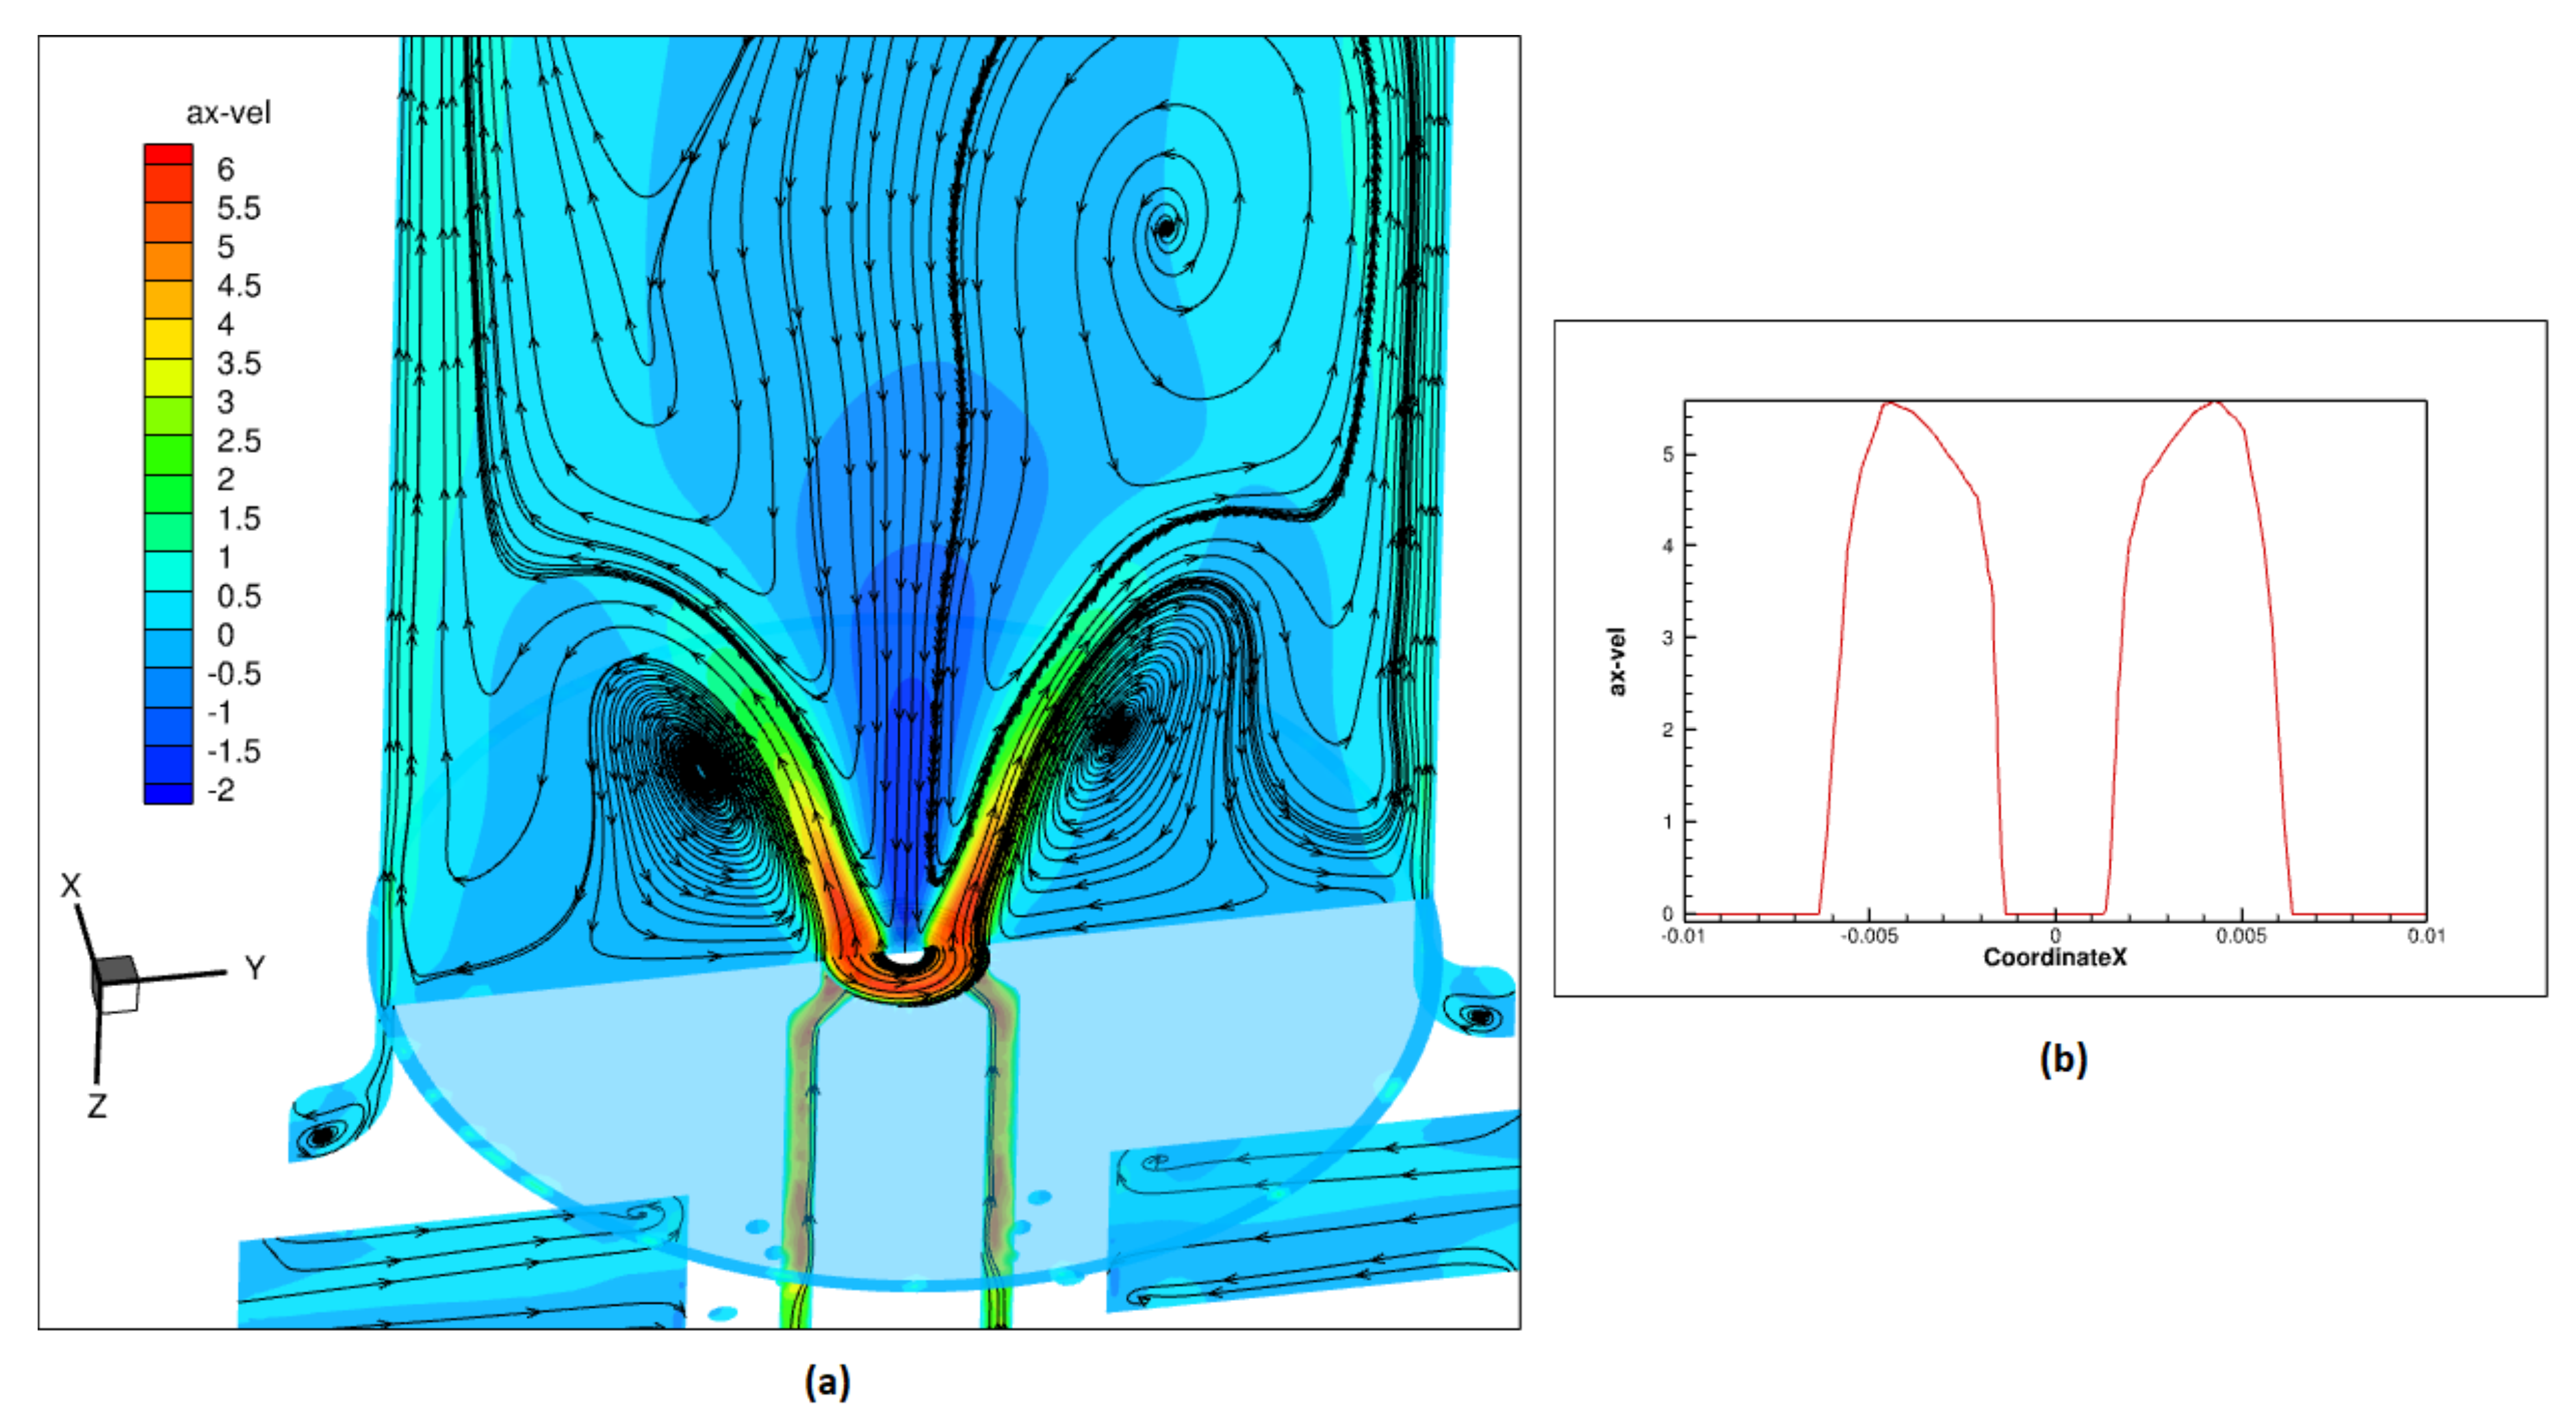
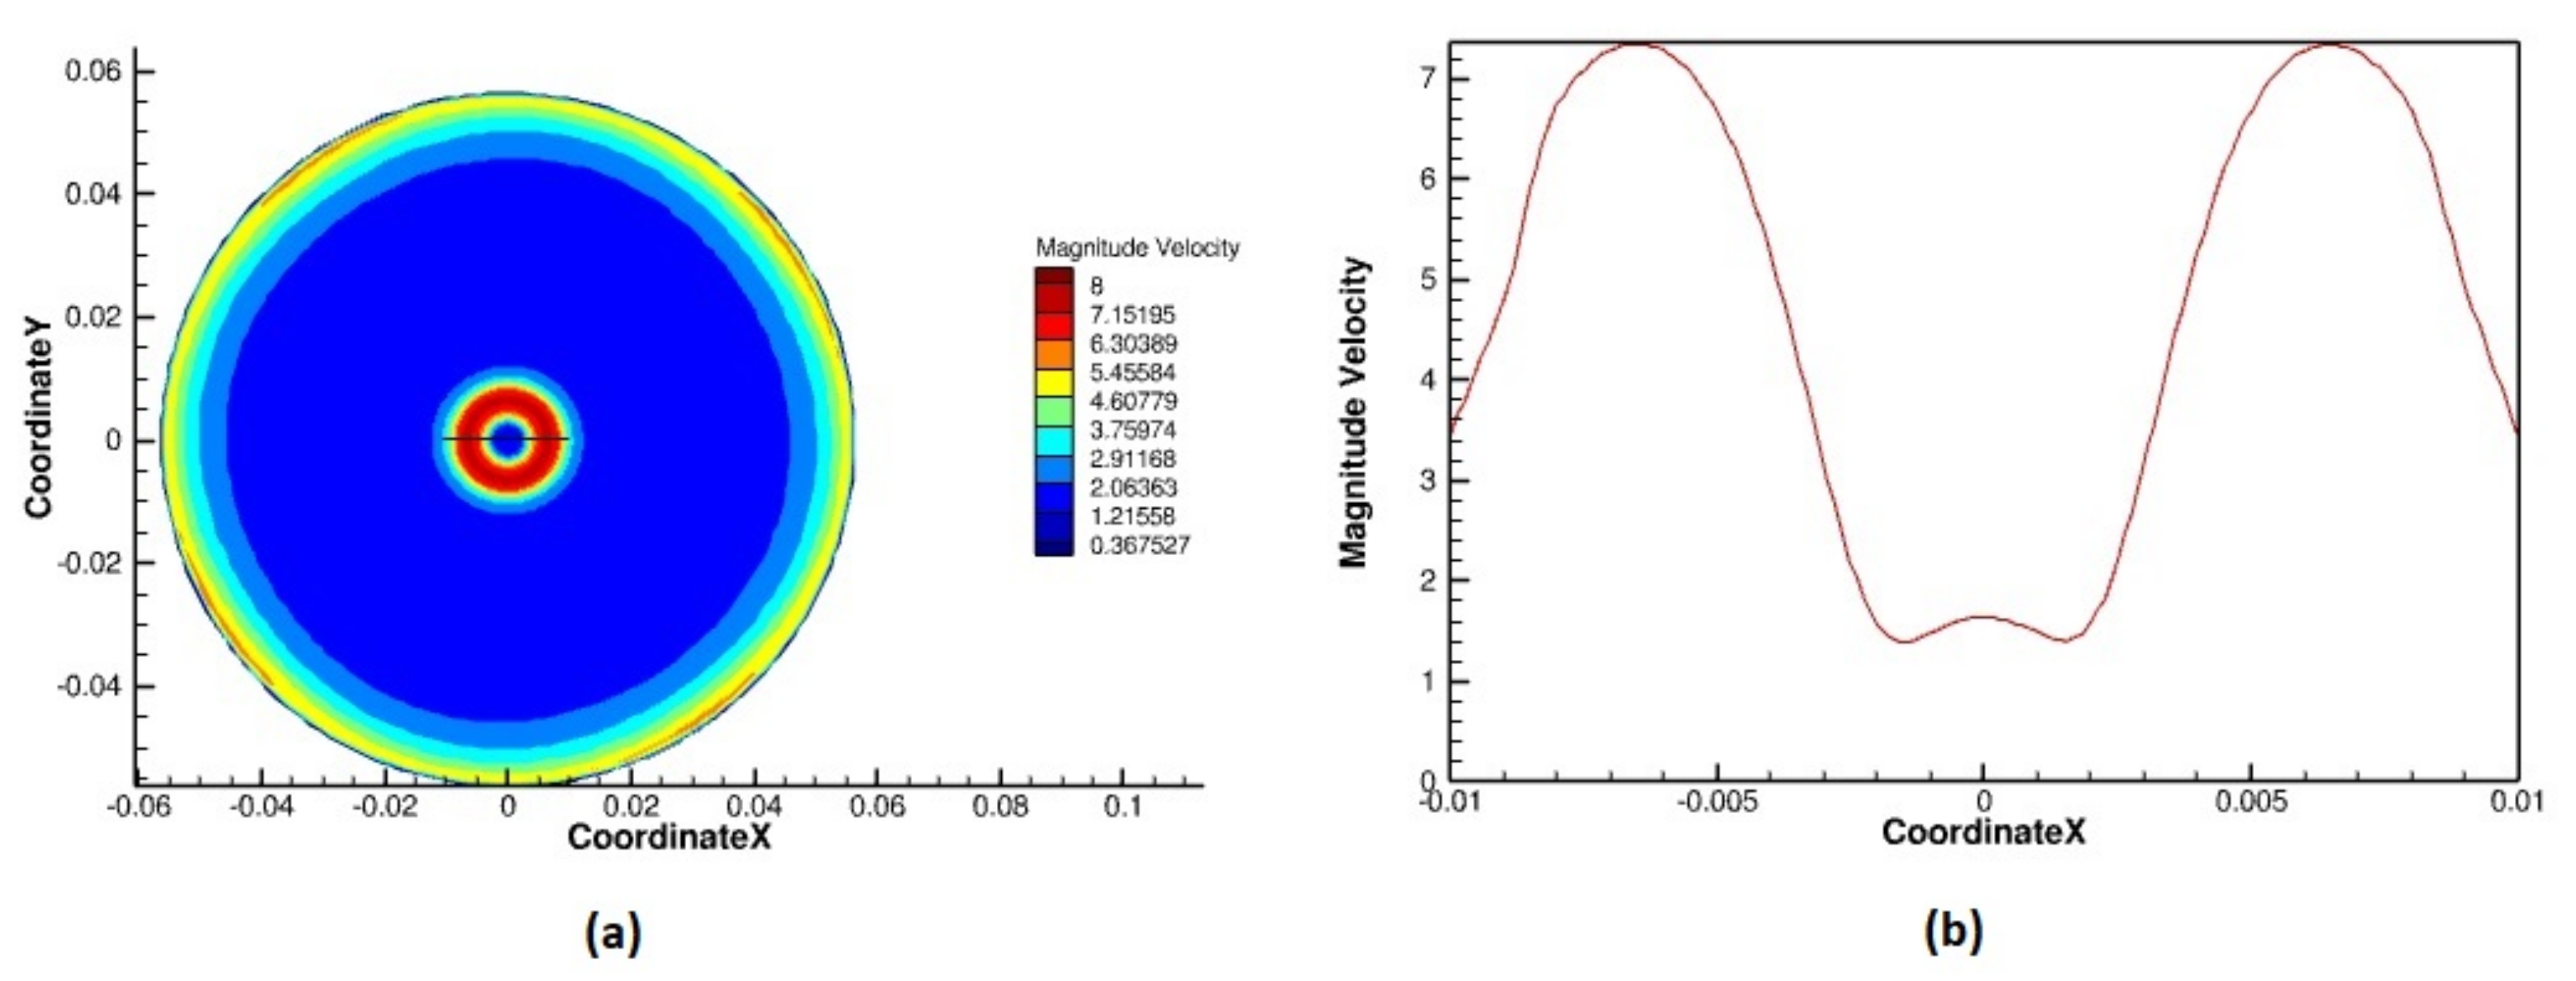
The swirl-induced jet opening at the exit burner area produces a narrow shape of the velocity magnitude profile. The highest velocity values of around U = 7.5 m/s are observed up to d = 10 mm above the burner. The velocity in the cold flow is reduced to U = 3 m/s beyond d = 15 mm above the burner, due to the lack of combustion processes that would cause a gas expansion in this region with enhanced absolute and tangential velocities. The numerical cold flow velocity profile is placed in line with the central axis in contrast with the cases with combustion. This is related to the fact that in the hot cases, the coming flow is accelerated and diverted at the flame front. The density differences between reactants and products and the entering swirl angle flow influence this flow deflection in the combustion process. For the cold flow simulation with RNG k- ϵ turbulence model, the averaged swirl number obtained is presented in Table 1. Figure 8a presents the cold flow axial velocity profile along the middle plane and at the burner exit (inlet plane for the combustion simulations). In Figure 8b, the 2D axial velocity profile is shown along a line taken at the burner exit plane. Figure 9a underlines the velocity magnitude contour obtained along a z-plane 5 mm above the nozzle opening. The 2D plot observed in Figure 9b points out the velocity trend along the black line shown in Figure 9a on the z-plane = 5 mm. The velocity magnitude reaches the highest values of about 7.5 m/s in the simulations, and it represents a good approximation compared to the measurements. The velocity magnitude U = (7.67 ± 0.03) m/s has been recorded also in the experiments (with DANTEC Dynamics CTA module 91C10, three components at 150 kS/s, StreameWare Pro Software and DANTEC PRO Calibrator) for the cold flow case at the same plane 5 mm above the nozzle opening. For this reason this current result is used as input for the following combustion simulations.

6.2. Hot Flow Using Combustion Models

Concerning the combustion models, the Eddy Dissipation Model (EDM), the Steady Flamelet (SF) partially premixed model and Flamelet Generated Manifold (FGM) model with both premixed and diffusion flamelets approaches are applied. Each one of the combustion models is used in combination with the following turbulence models: RNG k- ϵ with enhanced wall treatment, k- ω and k- ω SST with low Reynolds corrections.
Table 3 points out the swirl number values calculated for all combustion and turbulence models used. The Steady Flamelet approach shows overall the lowest swirl number values compared with all turbulence models. Both EDM and FGM present similar swirl numbers for the k- ϵ and SST models with lower values than in the experimental case. EDM and FGM with both premixed and diffusion flamelets with k- ω turbulence model conserve swirls along the entire axial direction, showing an accurate approximation with experimental values. For this reason, velocity contour plots for EDM and FGM are shown in this study. FGM with premixed flamelets is chosen instead of FGM with diffusion flamelets because both models did not show substantial differences.
Combustion data were available and comparisons with experiments were carried out for temperature and heat release contours. As first, the temperature and heat release contours for the FGM are presented, because the swirl numbers calculated for this combustion model and k- ω represent the closest approximation to the experimental values. Figure 10 shows the numerical temperature profiles for LES and for FGM with both k- ϵ and k- ω compared with the experimental data in Figure 10a. The temperature contours for FGM and k- ω SST turbulence models are omitted because they present a similar behavior and swirl number value compared to the k- ϵ model.
In order to obtain a temperature profile more accurate and similar to the experiments in the numerics, a radiation model was added to the already converged FGM simulation with premixed flamelet. In order to define which radiation model to use, the optical thickness parameter was taken into account:
O p T h = α L
where α = ( l n ( 1 ϵ ) ) / S stands for a representative absorption, and L is the characteristic length of the combustor. Domain emissivity is represented by ϵ , and S is a geometric parameter of the domain ( S = V / A ) with V being the total volume of the domain, and A being the total surface of the domain. After evaluating the optical thickness as O p T h = 0.049046 (the emissivity taken from the quartz glass that was used for the confinement in the experiments), model Discrete Ordinates (DOs) were chosen since it requires O p T h < 1 .
The numerical temperature fields present maximum values that are higher compared to the experimental investigation. The reason could be related to the simulated combustion process where simplified and limited chemical reactions need to be taken into account due to computational efforts. During the simulations, it was observed that the radiation model DO decreased the temperature to about 100 °C compared to the case with adiabatic walls. Moreover, in the measurements, the energy loss due to radiation was only 3% (see as reference page 323 of [10]). For this reason, it would be more effective in correctly simulating heat loss through the walls. In this study, a fixed temperature wall with value taken from the experiments was set, but it would be necessary to perform a Conjugate Heat Transfrer (CHT) analysis as the next step.
The main difference that is observed between Figure 10b,c is related to the flame shape. The k- ϵ model produces a V-flame attached, and the k- ω model generates a detached flame with M-shape. All simulations present a flow type II generating a V-shaped or M-shaped flame with angle of about 45° pointing out a similar trend as in the experiments shown in Figure 10a.
The averaged temperature profile for LES in Figure 10d shows also a flame with an overall accurate shape and trend compared to the experiments. The region located at an axial distance from the burner above d = 10–20 mm shows the highest temperature values compared to the experiments. This area represents the main reaction zone.
As already shown in the section “Swirl flow structure,” due to velocity and pressure, differences significant vortex structures form, and a vortex spiral evolves from the shear layer. This is related to the Kelvin–Helmoltz instability. This vortex turns around the centerline before breaking into small fragments. Figure 11 (left) presents a slice cut along the symmetry axis with temperature as contour for the LES simulation and isosurfaces at a temperature of T = 1600 °C. Figure 11 (right) presents a slice cut along the symmetry axis with vorticity magnitude as contour for LES and isosurfaces at a vorticity magnitude of ω = 2000 s 1 . LES provides better accuracy in terms of larger vortex structure resolution, as already observed in Figure 10d. The toroidal Kelvin–Helmholtz vortices are observed clearly around the central axis. The LES simulation presents the development of large eddies and toroidal isosurfaces that rapidly transition into small vortex fragments.
Next, the flame’s chemiluminescence is taken in order to characterize the overall structure of the flame. The heat release in the numerics has different units compared to OH* emission in the experiments. For this reason, a relative value in the simulations is calculated, and a qualitative comparison between the numerical results and the experiments can be carried out. For the simulations, the total heat release relative profile is shown in order to allow a clearer comparison of the main reaction zone position between numerics and experiments.
In Figure 12a, the local amplitude of OH* chemiluminescence emission is presented as recorded for [19]. Local data were derived from experimental line-of-sight-data by Abel transform. OH* chemiluminescence resembles heat release [28]. As already discussed in Section 5.2, the RANS simulation results represent steady flow, and they are obtained as the baseline for the LES simulation, where pressure fluctuations were also considered, as in the experiments. Thus, LES represents the final numerical step that also includes a perturbation frequency of 225 Hz. Figure 12a shows a maximum of heat release located at about x = 8 mm. In the numerics, the total heat release that corresponds to the temperature contour is shown for the FGM test case with both k- ϵ and k- ω in Figure 12b,c and for LES in Figure 12d. In LES in Figure 12d, the highest heat release values are located in a similar position compared to the measurements. Thus, the LES simulation shows the most accurate flow behaviour and stabilization mode compared to the experiments. Concerning the RANS simulations, one reason that could explain the performance of the k- ω model is related to the new formulation of the Wilcox model implemented in ANSYS Fluent that has reduced the dependency of the model to freestream. Production terms have been added to both the k and ω equations, which have improved the accuracy of the model for predicting free shear flows. A low Reynolds number modification term was also enabled in this setup for the k- ω model because the low Reynolds number term can result in a delayed onset of the boundary layer transition and, therefore, constitute a quite accurate model for laminar to turbulent transitions.
A RNG model was also chosen for the k- ϵ approach because it has shown substantial improvements over the standard model where the flow features include strong streamline curvature, vortices and rotation. This model would provide probably the best estimation for a strong swirl flow, whereas the present burner points out a moderate swirl.
A progress variable and its variances are added to the mixture fraction in the numerical formulation of FGM model. These included parameters can affect the location of the flame in the numerics. It is notable that the same RANS procedure applied to an unconfined burner resulted in much higher temperature values (see paper of Farisco et al. [12]). This outcome could be related to fact that the solver was not able to simulate correctly a sufficient entrainment of fresh ambient air that cools down the mixture in an unconfined configuration.
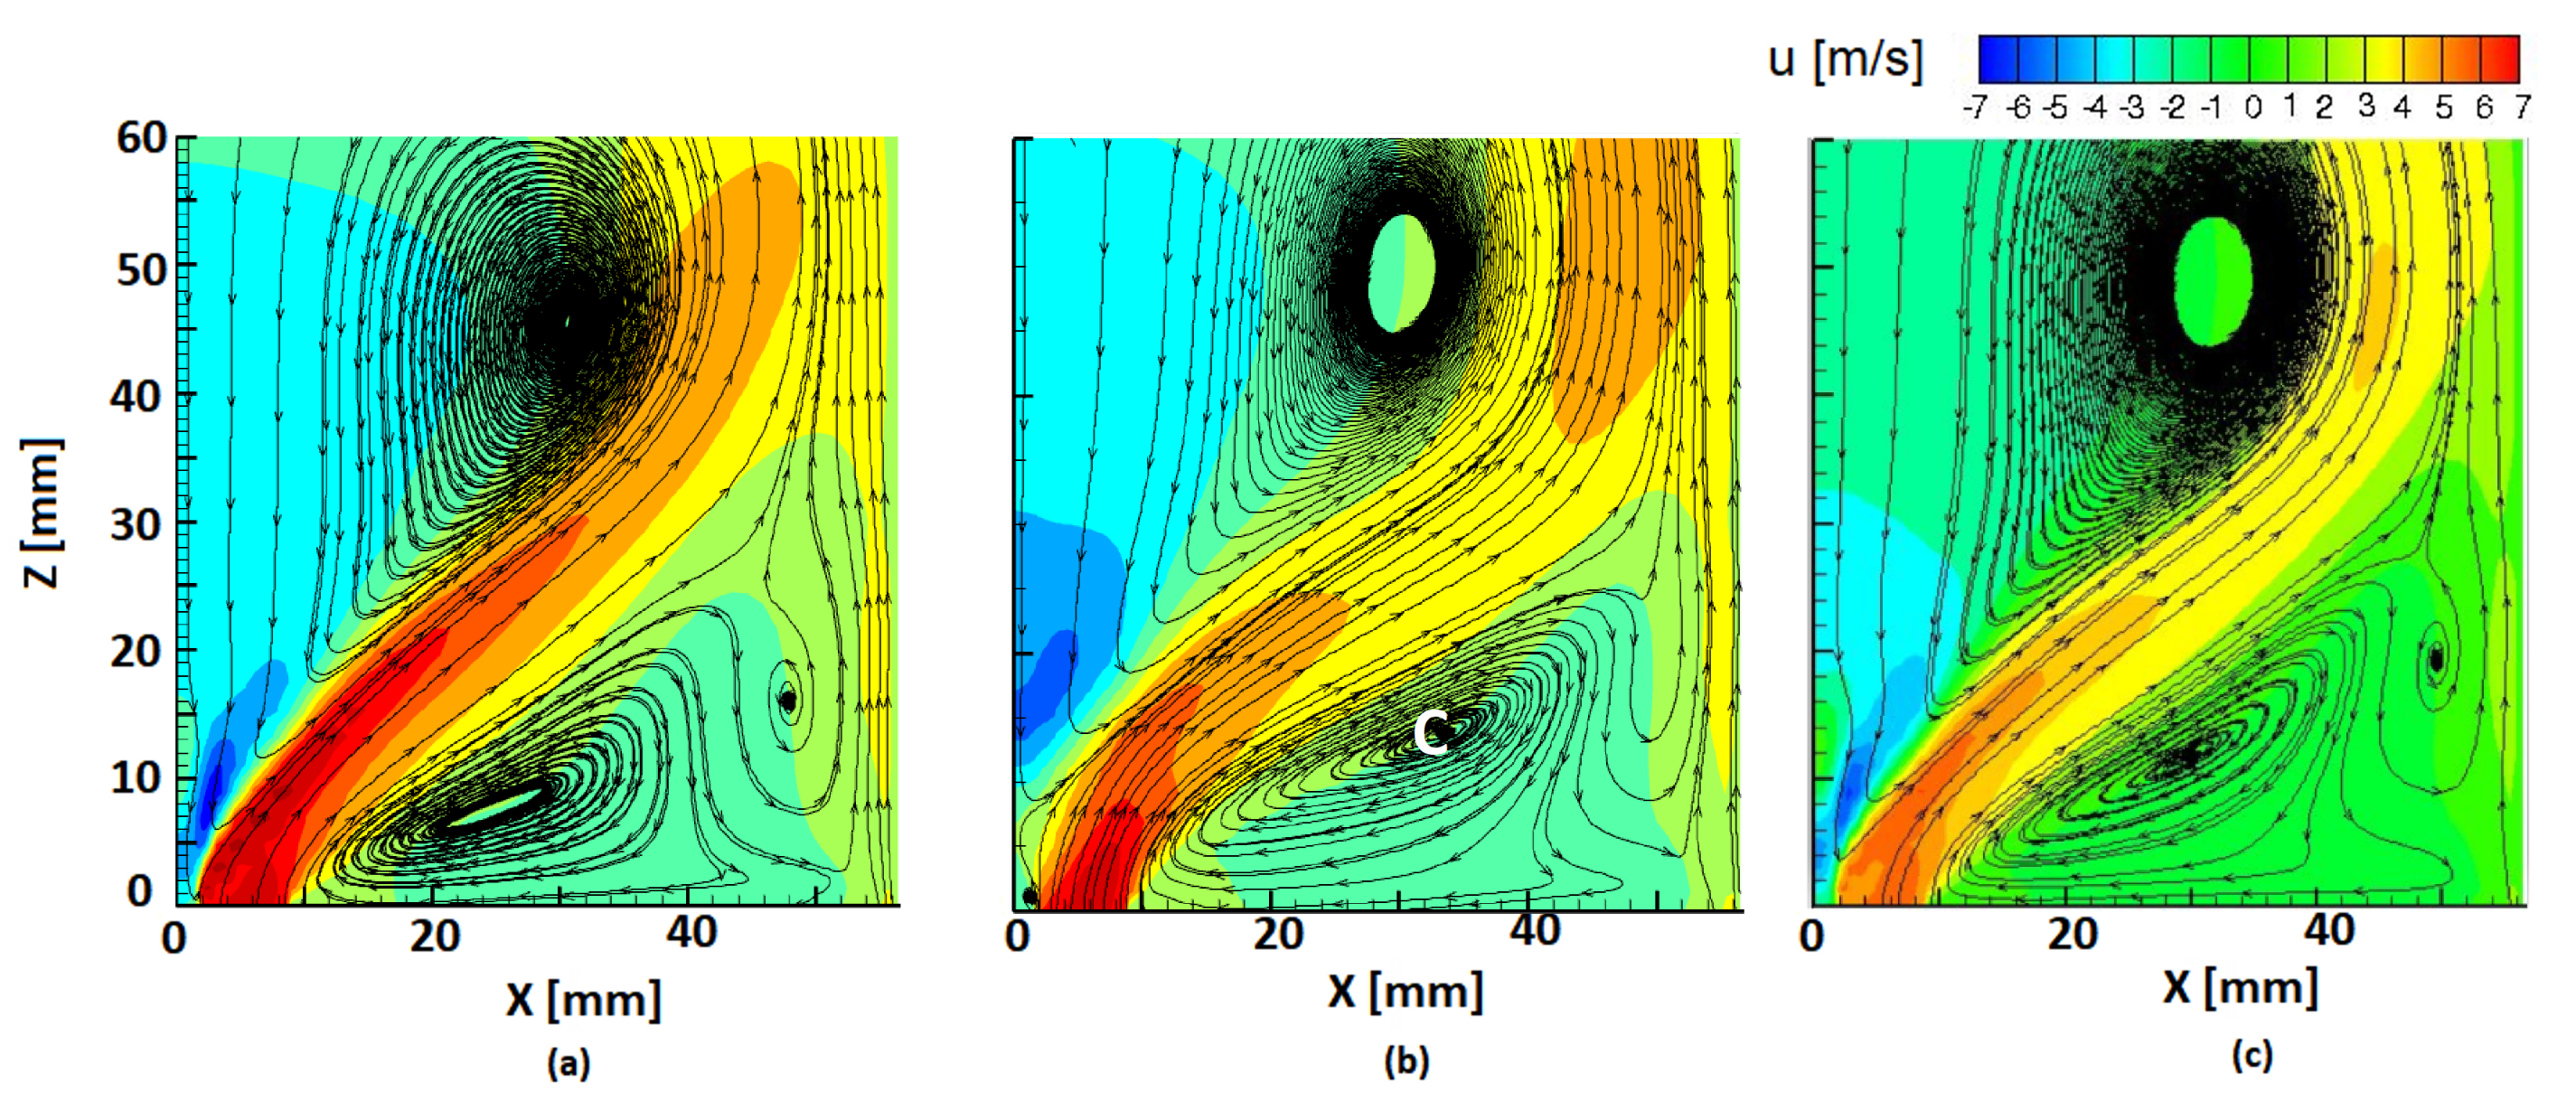
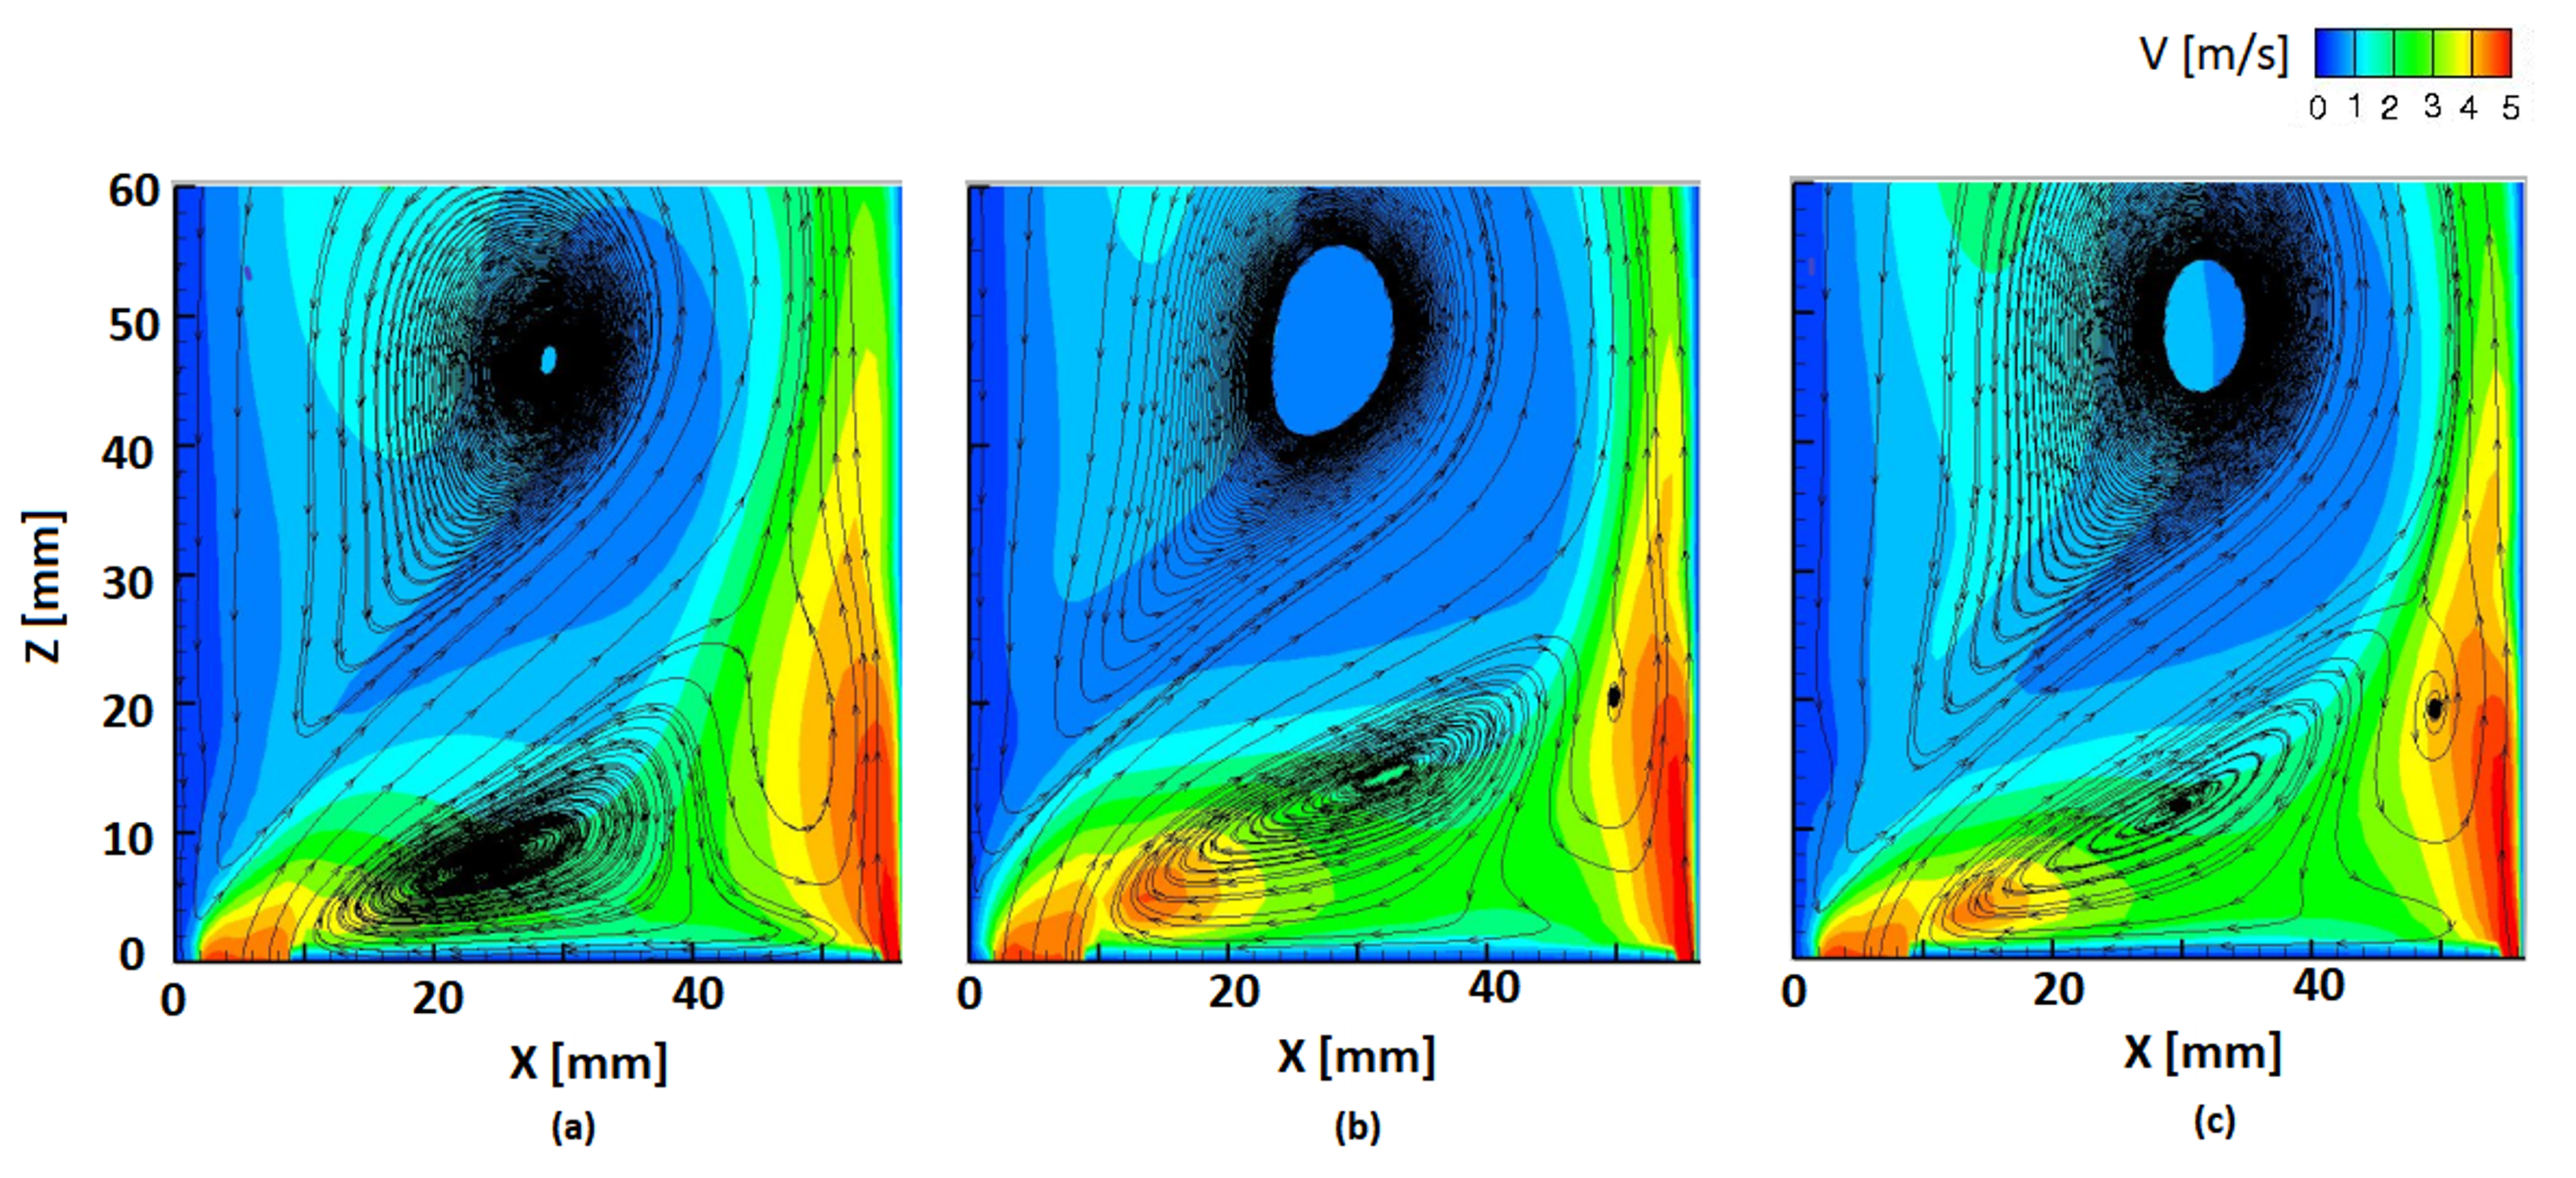
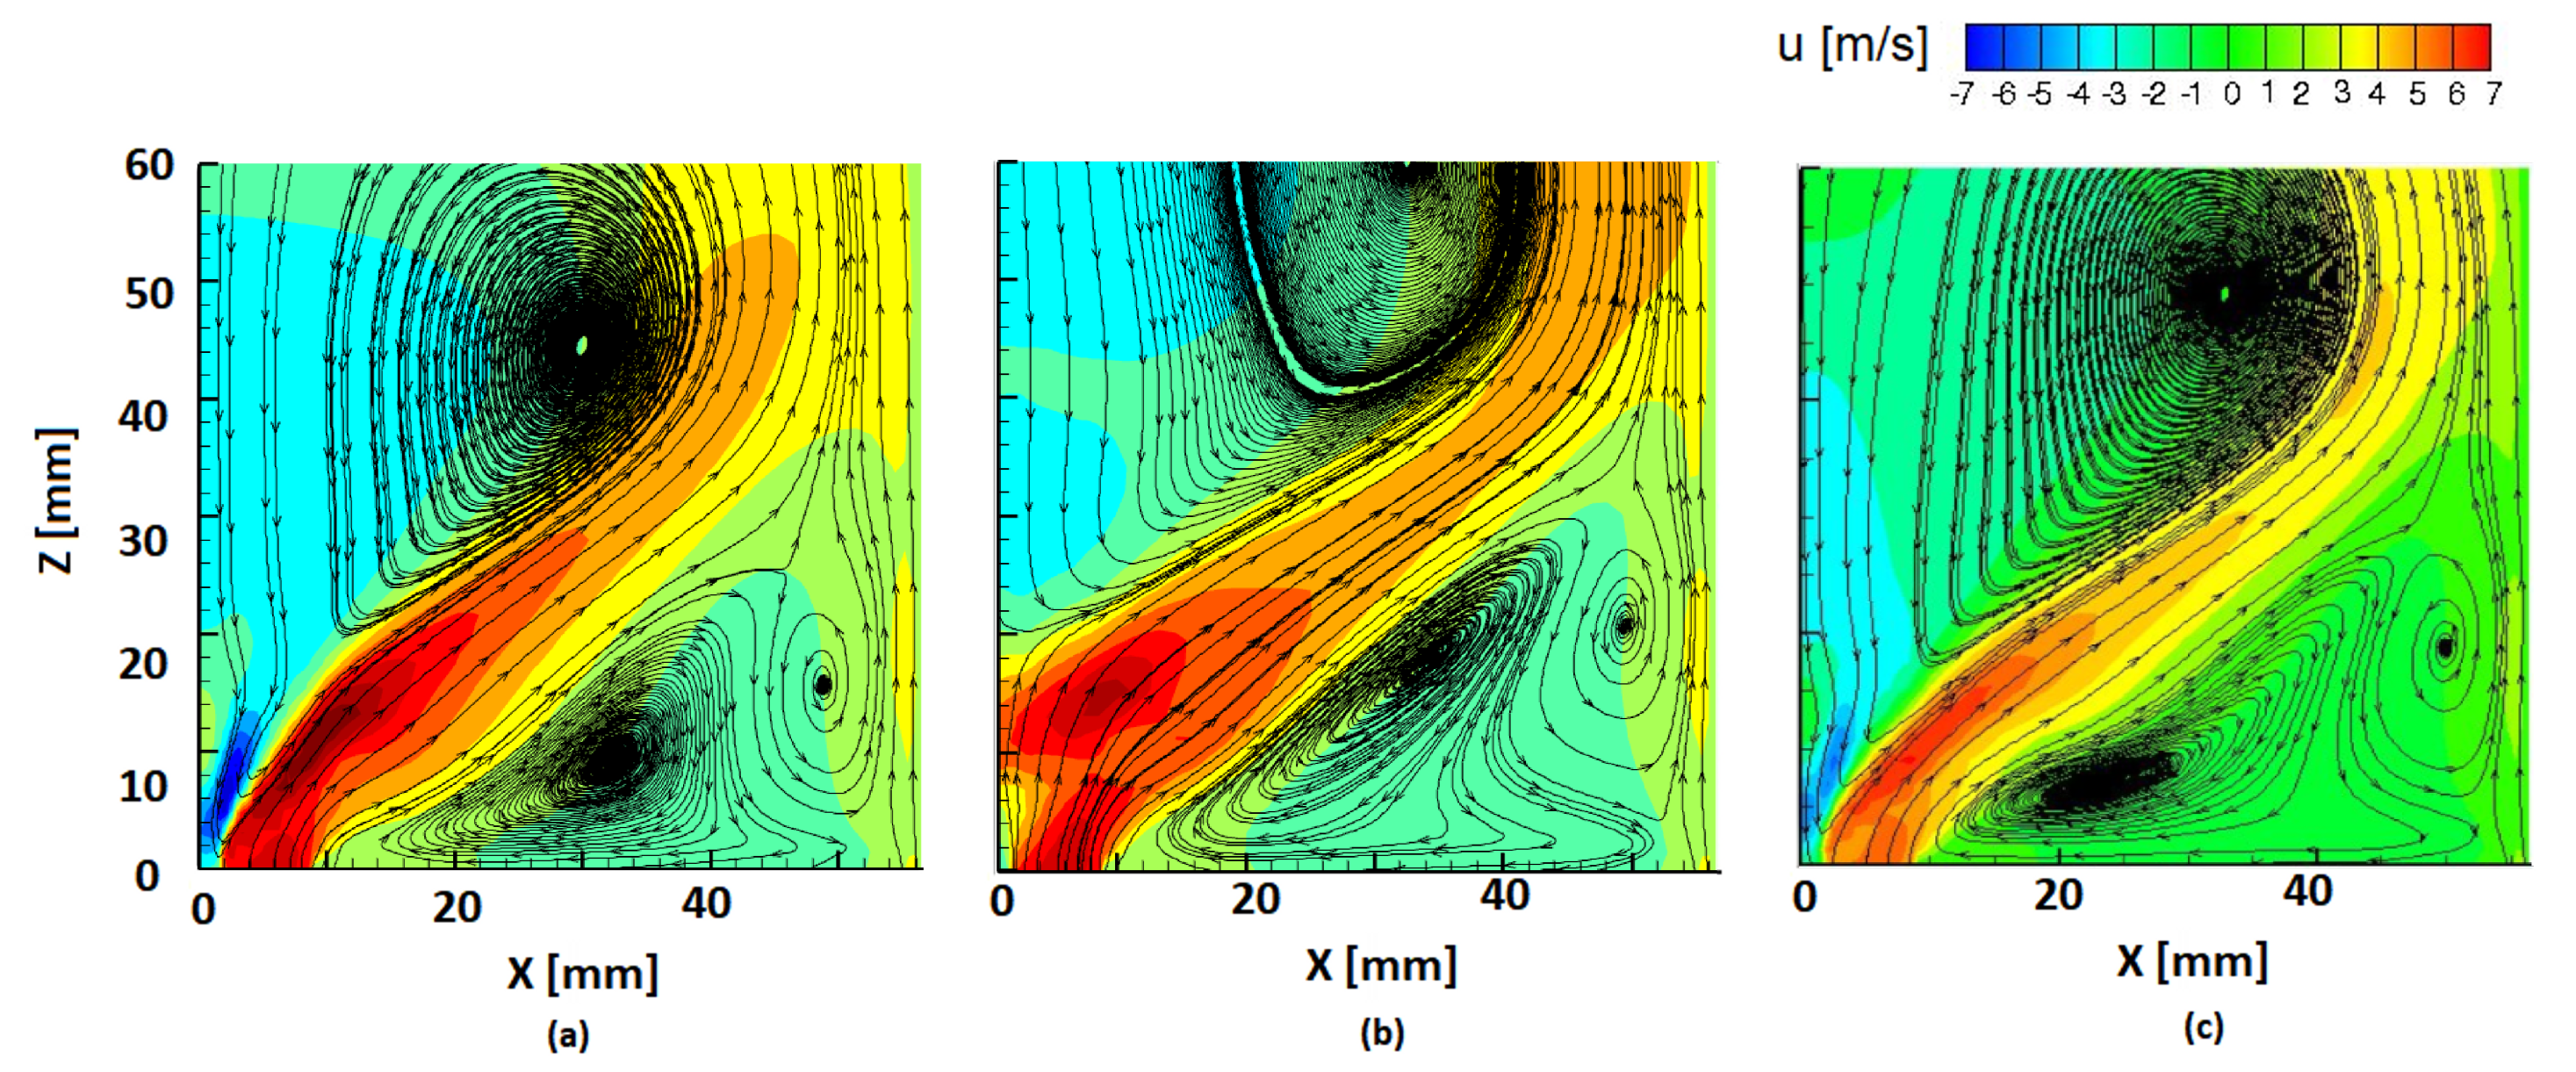
Figure 13 and Figure 14 present the axial and tangential velocity profiles and streamlines for the simulations with the EDM and the three turbulence models analyzed in this study, RNG k- ϵ , k- ω and k- ω SST, with low Reynolds corrections. Both axial and tangential velocity components are also shown because the swirl number depends on the ratio of these parameters.
Figure 13 points out a similar axial velocity shape for the turbulence models k- ϵ and SST with higher overall values for the k- ϵ model. The k- ω model presents the core of the vortical structure (C) highlighted in Figure 13b located at higher axial distance from the burner exit compared with the other two turbulence models. This behavior underlines the flame lift-off in the k- ω model.
In Figure 14 the tangential velocity plots do not show significant differences between the different turbulence models, highlighting the negative velocity values within the inner recirculation zone.
A similar trend for the axial velocity contours is presented in Figure 15 for the FGM premixed flamelet model with several turbulence models investigated. The highest velocities in FGM k- ω are reached further downstream above d = 20 mm compared to Figure 13b. On the contrary, the other two models show the highest velocity close to the burner axis up to d = 15 mm. This results in lower swirl numbers evaluated for the k- ϵ and SST models compared to k- ω . The tangential velocity component for the FGM model is omitted because it shows the same trend that is already observed in Figure 14 for the ED model.
Figure 16 shows the velocity magnitude profile for the simulations with EDM and FGM. Figure 16a,b present the velocity magnitude contour for EDM with RNG k- ϵ and k- ω . The SST turbulence model is now neglected since it is a combination of the two previous cited models, and its results did not present substantial differences compared with the other models.
In EDM with both k- ϵ and k- ω models, the main reaction zone is located near the central axis along the burner exit. This can be explained by the fact that the ED model is based on the fast chemistry approach where the reaction starts as the reactants come into contact. The area with the lowest velocity values around the central burner axis represents the inner recirculation zone or vortex breakdown region. K- ϵ in Figure 16a presents higher velocity magnitude in the range d = 5–15 mm compared to k- ω in Figure 16b.
Figure 16c,d present the absolute velocity contour for FGM model also with k- ϵ and k- ω . K- ϵ model points out a similar behaviour for both combustion models ED and FGM. K- ω model underlines in FGM a wider main reaction zone located at higher axial distance (in the range between d = 10–25 mm) that is extended until the burner axis in Figure 16d. FGM with k- ω shows also the core of the vortical structure (C) located at higher axial distance from the burner exit compared to the other cases. It can be clearly observed that the simulations show a flow of type II according to the nomenclature of the International Flame Research Foundation with stabilization at the inner recirculation producing a V-shaped or M-shaped expansion of the flame with an angle of 45°. Figure 11 taken from the study of [19] also presents the different flow types observed in the combustor confined analysed in the current paper compared to an unconfined case. These results were obtained via Density Tagging Velocimetry (DVT) and show the difference in inner recirculation between the confined flame analysed in the current paper and the unconfined flame. We observe that the confined case has a stronger inner recirculation zone compared to the unconfined case. This type of flow has been already observed in Figure 12a, where the position of heat release underlines also an expansion of the flame with an angle of about 40°.
Both experiments and simulations show in the current confined case a type II of flow with stabilization at the inner recirculation.

7. Conclusions

The commercial CFD code ANSYS Fluent is used in this investigation to analyze a confined swirl stabilized combustor configuration. Several different turbulence and combustion models were compared, and the numerical outcomes were validated against available experimental data. The current study represents a follow-up work of the paper of Farisco et al. [12], where the same RANS numerical procedure was applied to a different unconfined combustor. In that case, no turbulence and combustion models were able to correctly predict the type of flow and stabilization mode of the flame, and the predicted temperature values were too high compared to the experiments.
In the present work, a better agreement was found. Steady and unsteady calculations were carried out with the aim to validate the combustion model’s performances by examining temperature and heat release profiles. The ED model predicts the main reaction region to be closer to the burner’s exit, and this is explained with the infinitely fast chemistry approach used as a basis of this combustion model. The same outcome is also confirmed by the results shown in [12] for the unconfined burner geometry.
The remarkable improvement compared to the previous analysis in [12] was found for the coupling of the combustion model FGM with the k- ω turbulence model that could conserve the swirl along the entire axial direction, resulting in an accurate approximation of the experimental values.
This RANS approach and especially the LES results demonstrated the most accurate agreement in terms of temperature and heat release profile shape with the experiments. The same RANS procedure applied to the previous similar but unconfined burner resulted in much higher temperature values, resulting in the conclusion that the solver is not able to correctly simulate a sufficient entrainment of fresh ambient air that cools down the combustion gases. Instead, in this study, both RANS and especially the transient simulations could predict the main combustion features for the the current confined combustor analyzed. In a follow-up study, an investigation will be performed in order to further decrease the effect of backward flow at the outlet of the combustion chamber in the simulations. For this reason, different boundary conditions at the combustor outlet will be tested next. Moreover, an acoustic analysis of the oscillations influencing the flame and the flow field should be performed with a more accurate method.

Author Contributions

Conceptualization, F.F., J.W., W.S. and L.C.; methodology, L.C., F.F., W.S. and J.W.; software, L.C. and F.F.; validation, F.F., L.C., W.S. and J.W.; formal analysis, L.C. and F.F.; investigation, L.C. and F.F.; resources, W.S.; data curation, F.F. and L.C.; writing—original draft preparation, F.F.; writing—review and editing, F.F., W.S., J.W. and L.C.; visualization, F.F., W.S., J.W. and L.C.; supervision, W.S. and J.W.; project administration, W.S., J.W. and F.F.; funding acquisition, J.W. All authors have read and agreed to the published version of the manuscript.

Funding

The project is a Lead-Agency D-A-CH project in cooperation between Graz University of Technology, Austria and Technische Universität Dresden, Germany, and was funded by the Austrian Science Fund FWF within Grant No. FWF-I2544-N30. Open Access Funding by the Austrian Science Fund (FWF).

Conflicts of Interest

The authors declare no conflict of interest. The funders had no role in the design of the study; in the collection, analyses or interpretation of data; in the writing of the manuscript; or in the decision to publish the results.

Abbreviations

The following abbreviations are used in this manuscript:
dFlame length above burner exit (mm)
DBurner exit diameter (mm)
f D Frequency shift of laser light (Hz)
UVelocity magnitude (m/s)
uAxial velocity component (m/s)
VTangential velocity component (m/s)
λ Air/fuel ratio (-)
Φ Equivalence ratio (-)
CFDComputational Fluid Dynamics
DESDetached Eddy Simulation
DLEDry-Low Emission
DODiscrete Ordinates
EDEddy Dissipation
FGMFlamelet Generated Manifold
FM-DGVFrequency Modulated Doppler Global Velocimetry
IRZInner Recirculation Zone
LESLarge Eddy Simulation
LIVLaser Interferometric Vibrometry
ORZOuter Recirculation Zone
PDFProbability Density Function
PIVParticle Image Velocimetry
QUICKQuadratic Upstream Interpolation for Convective Kinematics;
RANSReynolds-averaged Navier–Stoke
SASScale Adaptive Simulation
SLFSteady Laminar Flamelet

References

  1. Lucca-Negro, O.; O’Doherty, T. Vortex breakdown: A review. Prog. Energy Combust. Sci. 2001, 27, 431–481. [Google Scholar] [CrossRef]
  2. Huang, Y.; Yang, V. Dynamics and stability of lean-premixed swirl-stabilized combustion. Prog. Energy Combust. Sci. 2009, 35, 293–364. [Google Scholar] [CrossRef]
  3. Schuermans, B.B.; Guethel, H.F.; Pennell, D.; Guyot, D.; Paschereit, D.O. Thermoacoustic modeling of a gas turbine using transfer functions measured under full engine pressure. J. Eng. Gas Turbines Power 2010, 132, 111503. [Google Scholar] [CrossRef]
  4. Peterleithner, J.; Marn, A.; Woisetschläger, J. Interferometric investigation of the thermoacoustics in a swirl stabilized methane flame. In Turbo Expo: Power for Land, Sea, and Air; GT2015-42743; ASME Turbo Expo: Montreal, QC, Canada, 15–19 June 2015. [Google Scholar]
  5. Sattelmayer, T.; Polifke, W. Assessment of methods for the computation of the linear stability of combustors. Combust. Sci. Technol. 2003, 175, 453–476. [Google Scholar] [CrossRef]
  6. Lauer, M.R.W. Determination of the Heat Release Distribution in Turbulent Flames by Chemiluminescence Imaging. Ph.D. Thesis, University of Technology Munich, Munich, Germany, 2011. [Google Scholar]
  7. Peterleithner, J.; Stadlmair, N.V.; Woisetschläger, J.; Sattelmayer, T. Analysis of measured flame transfer functions with locally resolved density fluctuation and OH-Chemiluminescence Data. J. Eng. Gas Turbines Power 2016, 138, 031504. [Google Scholar] [CrossRef]
  8. Peterleithner, J.; Basso, R.; Heitmeir, F.; Woisetschläger, J.; Schlüssler, R.; Czarske, J.; Fischer, A. Comparison of flame transfer functions acquired by chemiluminescence and density fluctuation. In Turbo Expo: Power for Land, Sea, and Air; GT2016-57485; ASME Turbo Expo: Seoul, Korea, 13–17 June 2016. [Google Scholar]
  9. Balachandran, R.; Ayoola, B.O.; Kaminski, C.; Dowling, A.P.; Mastorakos, E. Experimental investigation of the nonlinear response of turbulent premixed flames to imposed inlet velocity fluctuations. Combust. Flame 2005, 143, 37–55. [Google Scholar] [CrossRef]
  10. Greiffenhagen, F.; Peterleithner, J.; Woisetschläger, J.; Fischer, A.; Gürtler, J.; Czarske, J. Discussion of laser interferometric vibrometry for the determination of heat release fluctuations in an unconfined swirl-stabilized flame. Combust. Flame 2018, 201, 315–327. [Google Scholar] [CrossRef]
  11. Greiffenhagen, F.; Woisetschläger, J.; Gürtler, J.; Kuschmierz, R.; Czarske, J. Camera based full-field laser interferometric vibrometry for combustion diagnostics. In Proceedings of the 19th International Symposium on the Application of Laser and Imaging Techniques to Fluid Mechanics, Lisbon, Portugal, 16–19 July 2018. [Google Scholar]
  12. Farisco, F.; Notsch, P.; Prieler, R.; Greiffenhagen, F.; Woisetschlaeger, J.; Heitmeir, F.; Hochenauer, C. Numerical investigation of a swirl stabilized methane fired burner and validation with experimental data. In Turbo Expo: Power for Land, Sea, and Air; GT2019-90452; ASME Turbo Expo: Phoenix, AZ, USA, 17–21 June 2019. [Google Scholar]
  13. Abou-Taouk, A.; Whiddon, R.; Sigfrid, I.R.; Eriksson, L.E. CFD Investigation of Swirl-Stabilized Flexi-Fuel Burner using Methane-Air Mixture for Gas Turbines. In Proceedings of the Conference ISABE, Gothenburg, Sweden, 12–16 September 2011; pp. 2011–2122. [Google Scholar]
  14. Hatziapostolou, A.; Orfanoudakis, N.G.; Koukou, M.K.; Raptis, G. CFD modeling of the swirl-stabilised flame produced by a laboratory-scale combustor. selection of the turbulence model. In Proceedings of the 4th WSEAS International Conference on Heat Transfer, Thermal Engineering and Environment, Elounda, Greece, 21–23 August 2006; pp. 83–88. [Google Scholar]
  15. Van Oijen, J.A.; Donini, A.; Bastiaans, R.J.M.; ten Thije Boonkkamp, J.H.M.; de Goey, L.P.H. State-of-the-art in premixed combustion modeling using flamelet generated manifolds. Prog. Energy Combust. Sci. 2016, 57, 30–74. [Google Scholar] [CrossRef] [Green Version]
  16. Puggelli, S.; Bertini, D.; Mazzei, L.; Andreini, A. Scale Adaptive Simulations of a swirl stabilized spray flame using Flamelet Generated Manifold. Energy Procedia 2016, 101, 1143–1150. [Google Scholar] [CrossRef]
  17. Magnussen, B.F.; Hjertager, B.H. On Mathematical Modelling of Turbulent Combustion with Special Enphasis on Soot Formation and Combustion. In Symposium (International) on Combustion; Elsevier: Amsterdam, The Netherlands, 1977; Volume 16, pp. 719–729. [Google Scholar]
  18. Peters, N. Laminar diffusion flamelet models in non-premixed turbulent combustion. Prog. Energy Combust. Sci. 1984, 10, 319–339. [Google Scholar] [CrossRef]
  19. Greiffenhagen, J.; Woisetschläger, A.; Gürtler, J.; Czarske, J. Quantitative measurement of density fluctuations with a full-field laser interferometric vibrometer. Exp. Fluids 2020, 61, 1–15. [Google Scholar]
  20. Candel, S.; Durox, D.; Schuller, T.; Bourgouin, J.; Moeck, J.P. Dynamics of swirling flames. Annu. Rev. Fluid Mech. 2014, 46, 147–173. [Google Scholar] [CrossRef]
  21. Yiheng, T. Experimental and Numerical Investigations of Flames Stabilized by Swirl Flow and Bluff-Body: Flame Structures and Flame Instabilities. Ph.D. Thesis, Lund University, Lund, Sweden, October 2017. [Google Scholar]
  22. Bompelly, R.K. Lean Blowout and Its Robust Sensing. Ph.D. Thesis, Georgia Institute of Technology, Atlanta, GA, USA, May 2013. [Google Scholar]
  23. ANSYS. Quick Guide to Setting Up LES-Type Simulations; ANSYS FLUENT Version 1.4; Prepared and Compiled by Aleksey Gerasimov; ANSYS Sweden AB: Stockholm, Sweden, 2016. [Google Scholar]
  24. ANSYS. ANSYS FLUENT Theory Guide; ANSYS FLUENT Release 14.5; ANSYS: Canonsburg, PA, USA, 2012. [Google Scholar]
  25. Tanneberger, T.; Reichel, T.G.; Krüger, O.; Terhaar, S.; Paschereit, C.O. Numerical investigation of the flow field and mixing in a swirl-stabilized burner with a non-swirling axial jet. In ASME Turbo Expo: Power for Land, Sea, and Air; GT2015-43382; ASME Turbo Expo: Montreal, QC, Canada, 15–19 June 2015. [Google Scholar]
  26. WestBrook, C.K.; Dryer, F.L. Simplified reaction mechanism for the oxidation of hydrocarbon fuels in flames. Combust. Sci. Technol. 1981, 27, 31–43. [Google Scholar] [CrossRef]
  27. Smith, G.P.; Golden, D.M.; Frenklach, M.; Moriarty, N.W.; Eiteneer, B.; Goldenberg, M.C.; Bowman, T.; Hanson, R.K.; Song, S.; Gardiner, W.C.; et al. GRI-Mech. Available online: http://www.me.berkeley.edu/grimech/ (accessed on 20 January 2021).
  28. Hardalupas, Y.; Orain, M. Local measurements of the time-dependent heat release rate and equivalence ratio using chemiluminescent emission from a flame. Combust. Flame 2004, 139, 188–207. [Google Scholar] [CrossRef]
Figure 1. Schematic burner section.
Ijtpp 06 00046 g001
Figure 2. Vortex core overview. (left) current combustor; (right) sketch of flow patterns in a confined, premixed swirl stabilized combustor [22].
Ijtpp 06 00046 g002
Figure 3. Vortex structure of PVC [21].
Ijtpp 06 00046 g003
Figure 4. Sketch of the combustor and computational domain.
Ijtpp 06 00046 g004
Figure 5. Axial velocity field comparison between k- ϵ   y + = 3 (left) and k- ϵ   y + = 1 (right).
Ijtpp 06 00046 g005
Figure 6. View of the chosen mesh.
Ijtpp 06 00046 g006
Figure 7. Velocity magnitude profile for the cold flow case with RNG k- ϵ turbulence model.
Ijtpp 06 00046 g007
Figure 8. Axial velocity profile for the cold flow case with RNG k- ϵ turbulence model (a) and axial profile 2D plot set at the inlet of the combustion simulations (b).
Ijtpp 06 00046 g008
Figure 9. Velocity magnitude profile for the cold flow case with RNG k- ϵ turbulence model at the z-plane = 5 mm (a) and velocity magnitude profile 2D plot along the black line on z-plane = 5 mm (b).
Ijtpp 06 00046 g009
Figure 10. Flow comparison-temperature profile shown for (a) experiments, (b) FGM premixed with RNG k- ϵ , (c) FGM premixed with k- ω and (d) LES.
Ijtpp 06 00046 g010
Figure 11. Snapshot of isosurfaces at temperature T = 1600 °C (left) and isovorticity surface ω = 2000 s 1 (right) for LES.
Ijtpp 06 00046 g011
Figure 12. Flow comparison heat release profile shown for (a) OH* chemiluminescence experiments, (b) FGM premixed with RNG k- ϵ , (c) FGM premixed with k- ω and (d) LES.
Ijtpp 06 00046 g012
Figure 13. Flow comparisons-axial velocity profile shown for the combustion model ED and different turbulence models: (a) RNG k- ϵ , (b) k- ω and (c) SST.
Ijtpp 06 00046 g013
Figure 14. Flow comparisons-tangential velocity profile shown for the combustion model ED and different turbulence models: (a) RNG k- ϵ , (b) k- ω and (c) SST.
Ijtpp 06 00046 g014
Figure 15. Flow comparisons-axial velocity profile shown for FGM premixed and different turbulence models: (a) RNG k- ϵ , (b) k- ω and (c) SST.
Ijtpp 06 00046 g015
Figure 16. Velocity magnitude profile for combustion model ED with (a) RNG k- ϵ , (b) k- ω and FGM with (c) RNG k- ϵ and (d) k- ω .
Ijtpp 06 00046 g016
Table 1. Cold flow case with y + = 3.
y + = 3 k- ϵ k- ω
S D / 4 0.56840.4548
S D / 2 0.536250.54065
Table 2. Cold flow case with y + = 1.
y + = 1 k- ϵ k- ω
S D / 4 0.480350.4278
S D / 2 0.439350.40995
Table 3. Swirl number for the combustion and turbulence models analyzed.
Eddy Dissipationk- ϵ k- ω SST
S0.385050.6057850.3929925
Steady Flameletk- ϵ k- ω SST
S0.365690.277410.36799
FGM Premixed Flameletk- ϵ k- ω SST
S0.3786450.53139750.3744125
FGM Diffusion Flameletk- ϵ k- ω SST
S0.37991750.5234150.374775
Publisher’s Note: MDPI stays neutral with regard to jurisdictional claims in published maps and institutional affiliations.