Contamination of Brush Seals by Oil and Salt and Its Impact on Rubbing and Hysteresis Behaviour

Abstract
:1. Introduction
2. Materials and Methods
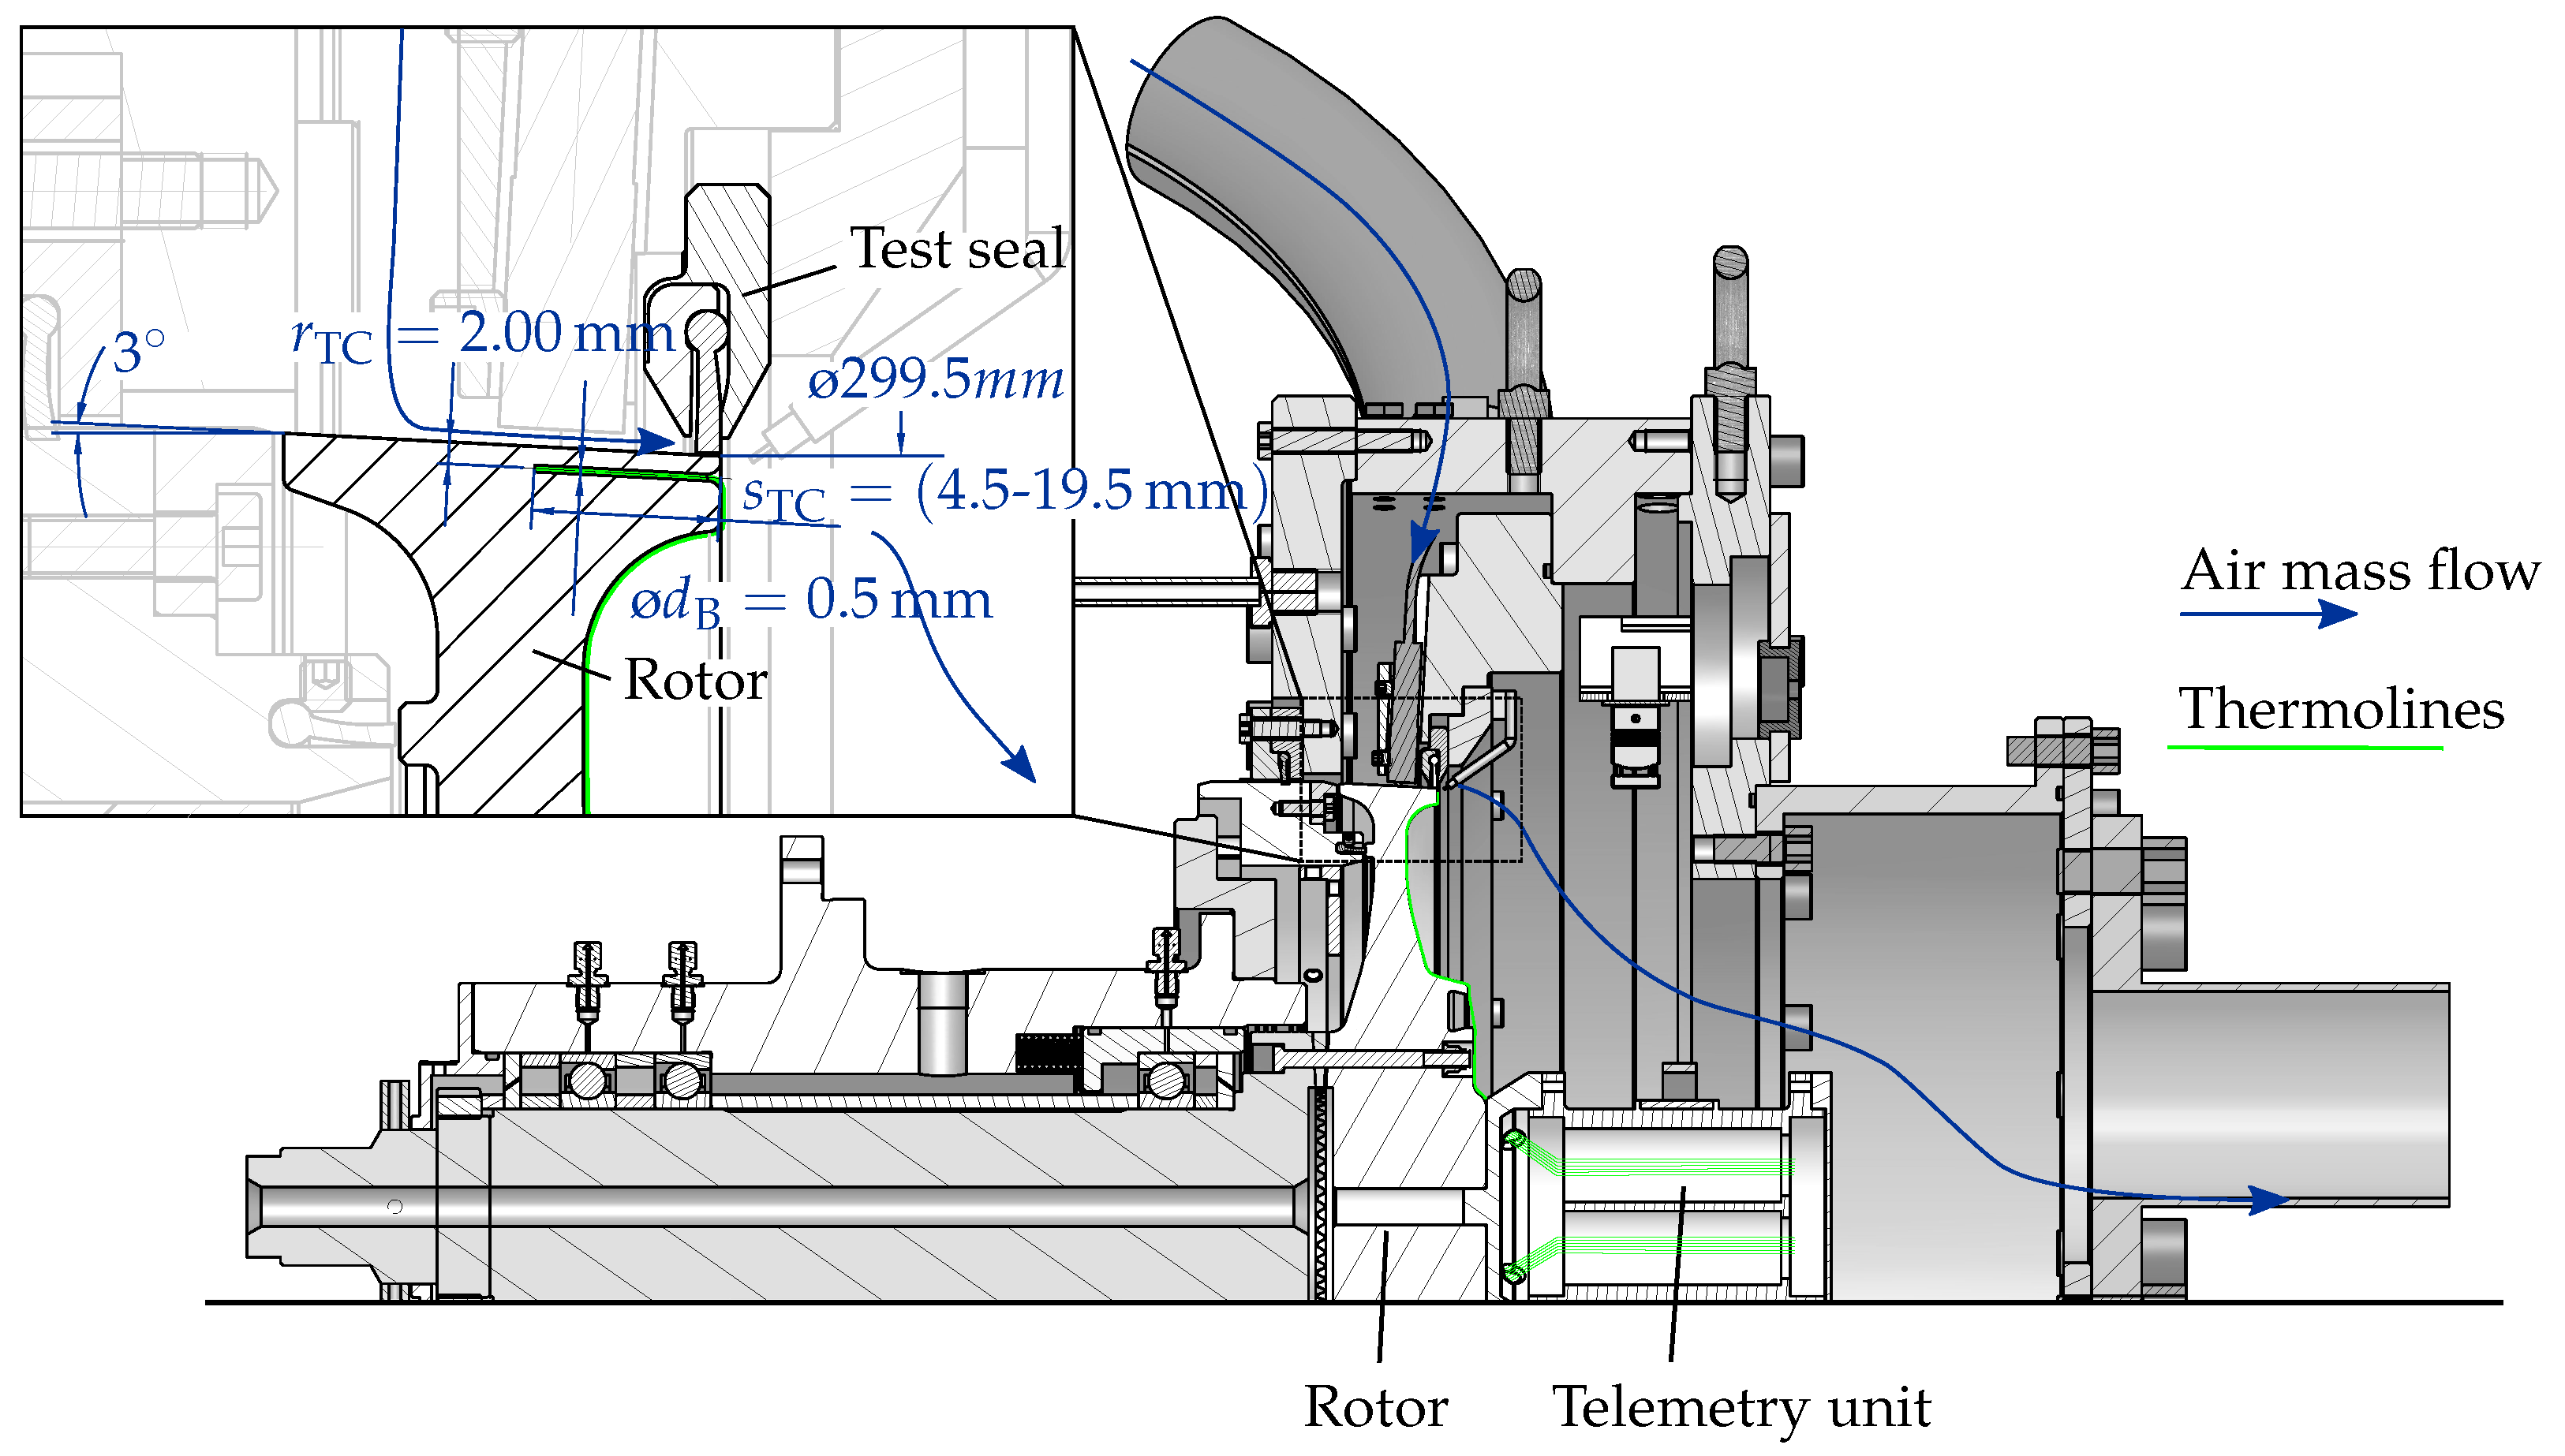
2.1. Brush Seal Test Rig
2.2. Evaluation Method
2.3. Investigated Seals
2.3.1. Treatment of Contaminated Seals
2.3.2. Evaluation of the Treatment
2.4. Test Parameters
3. Results and Discussion
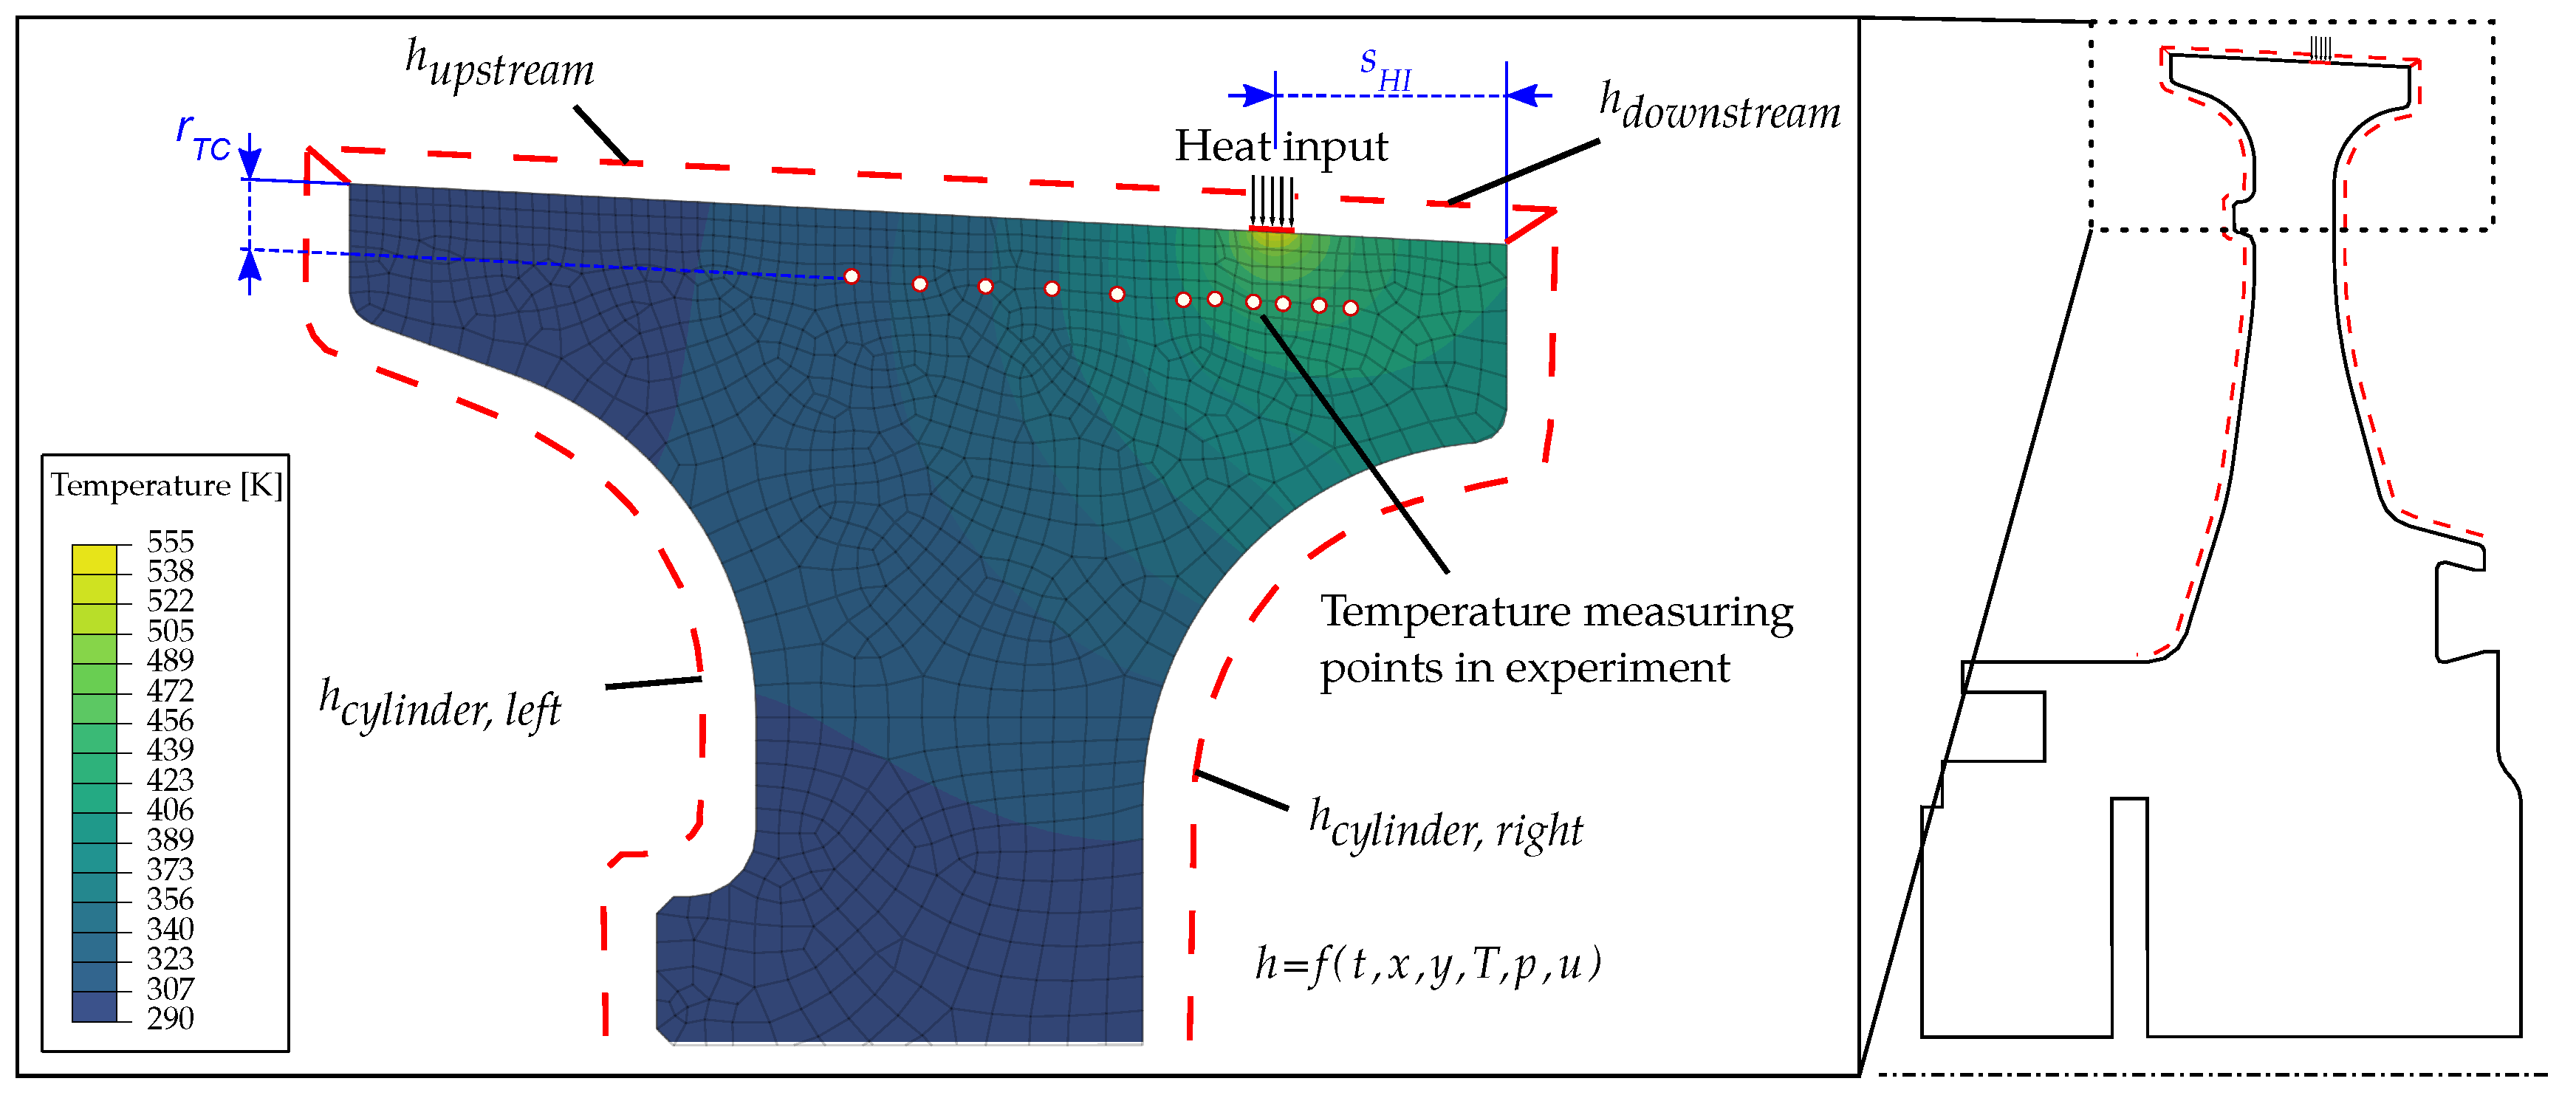
3.1. Generation and Distribution of Rubbing Heat
3.2. Results Seal S
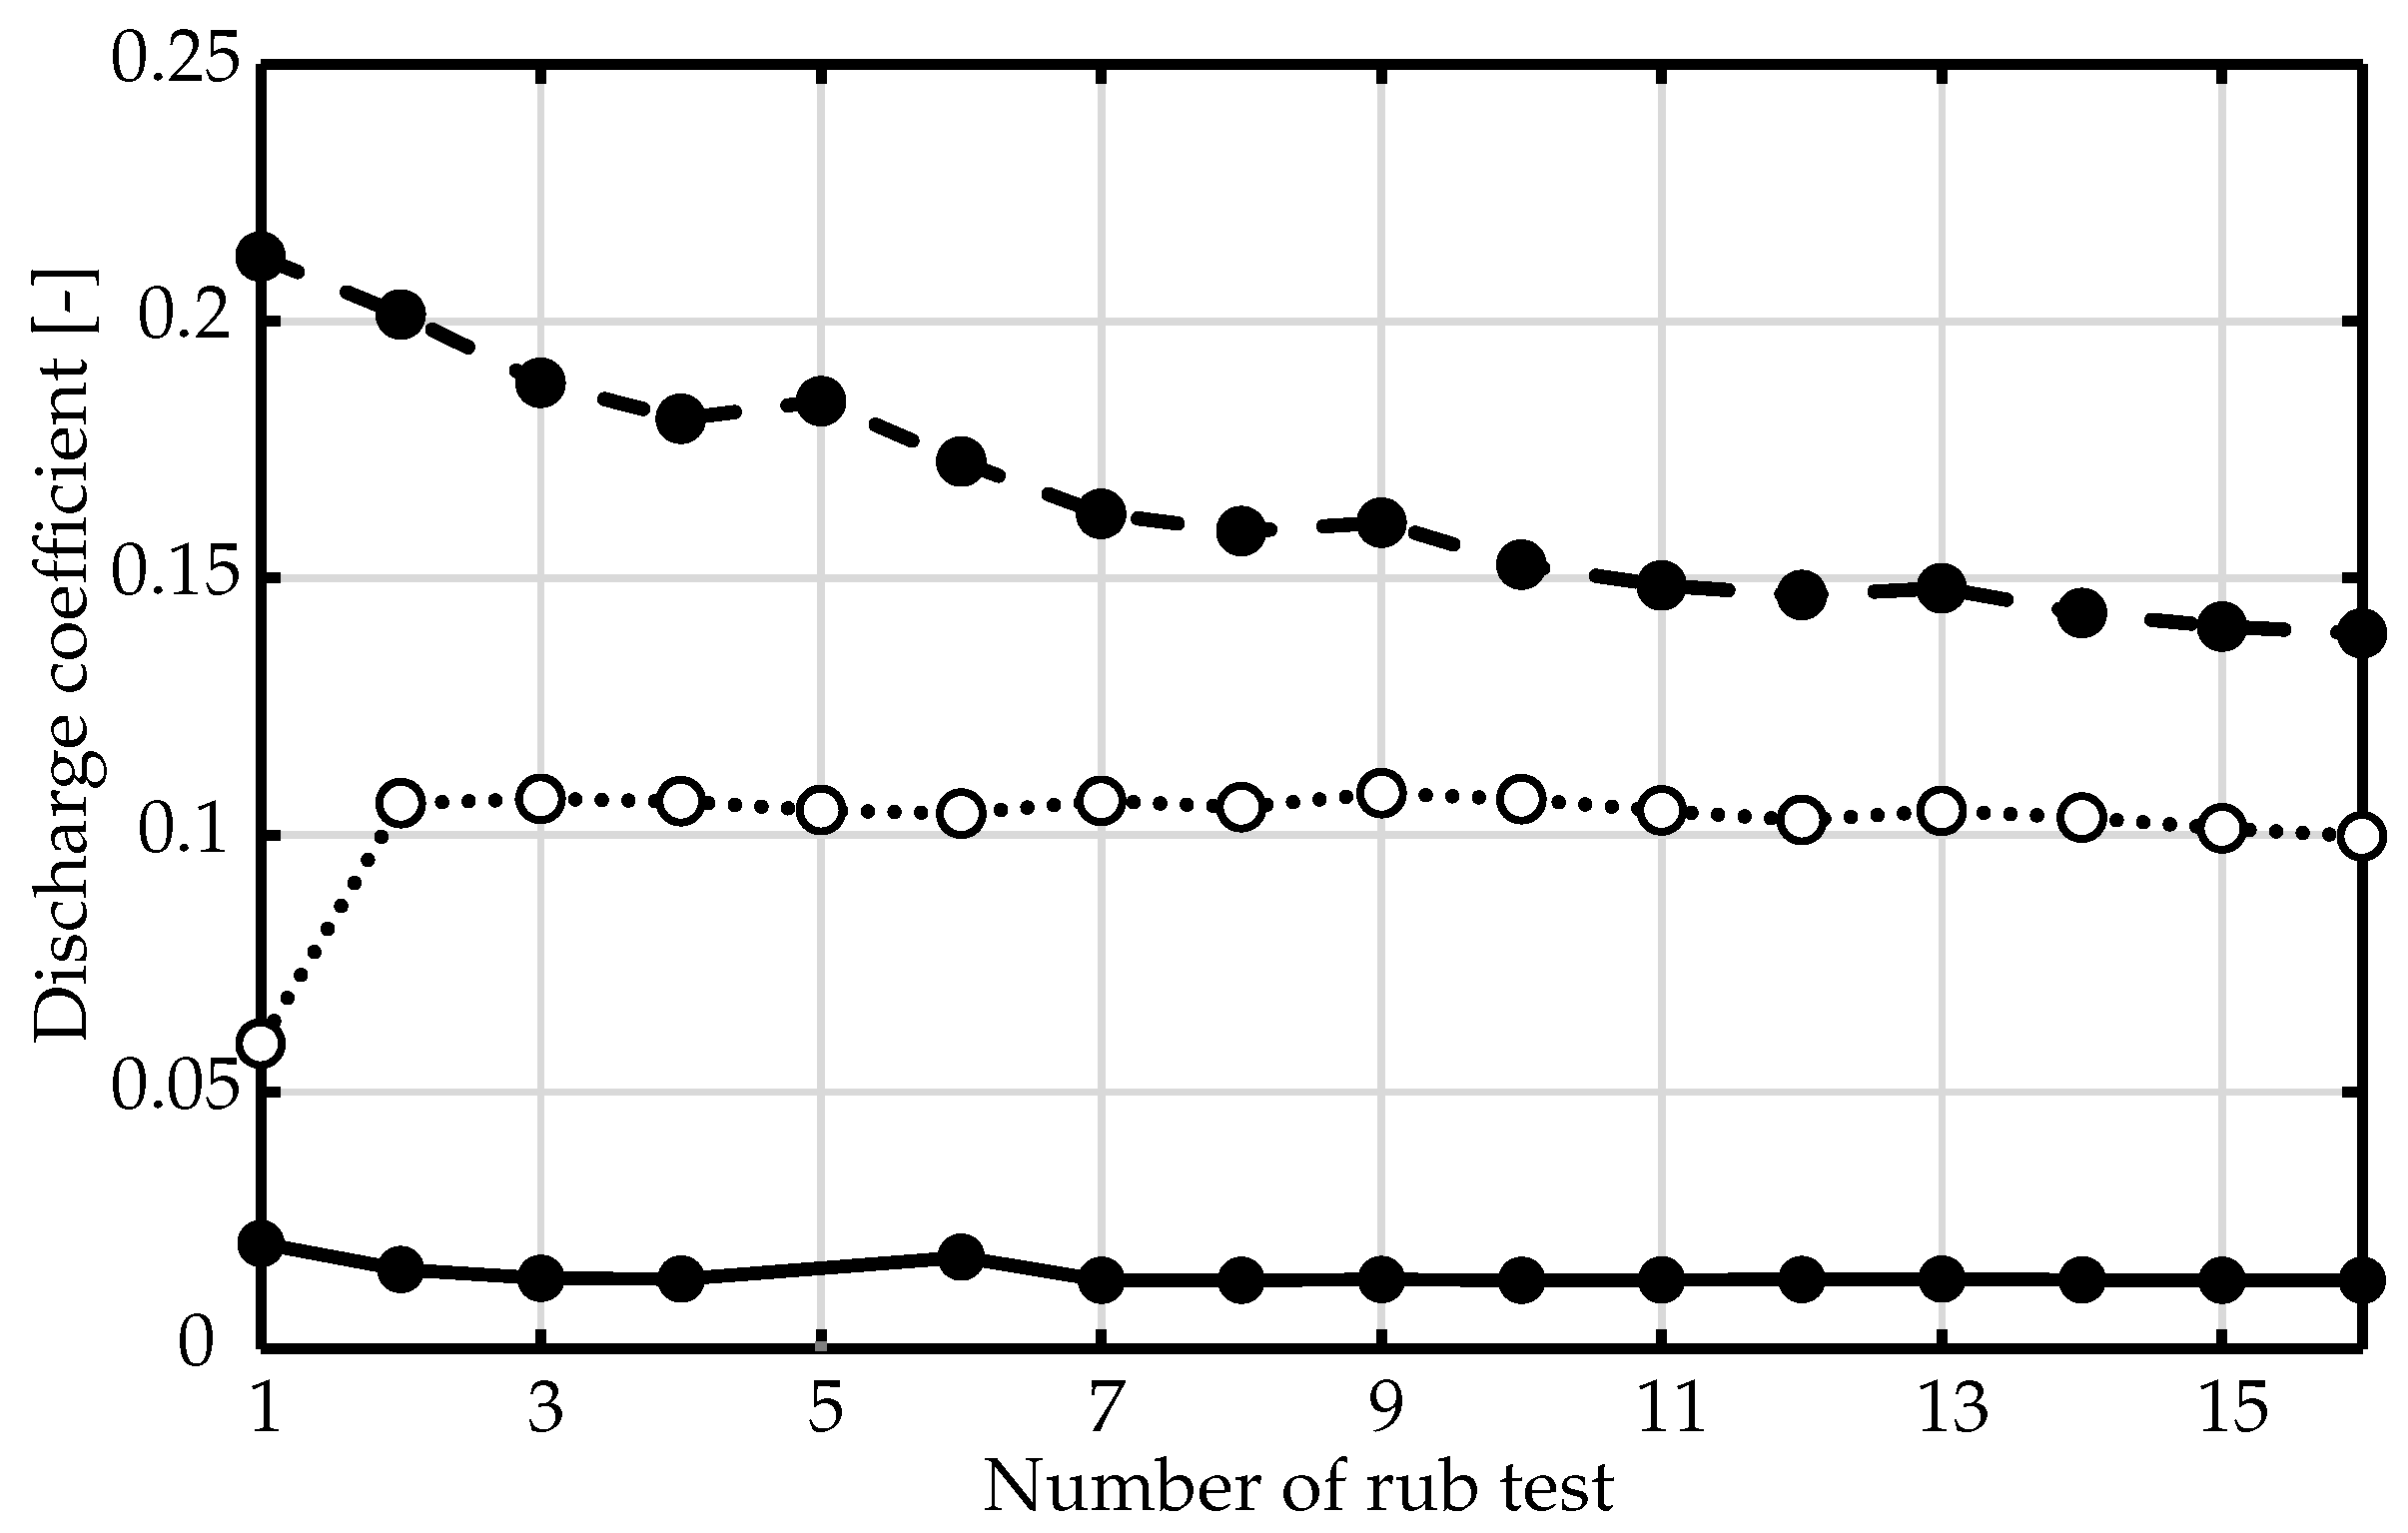
- The total power loss and the rotor heat input increase until the second repeat measurement.
- This increase can be observed again every fourth measurement.
3.3. Results Seal O
3.4. Comparison of Stamp Measurement and Rub Tests
4. Conclusions
Author Contributions
Funding
Acknowledgments
Conflicts of Interest
Abbreviations
| A | Gap area between back plate and rotor |
| b | Bristle pack width |
| Discharge coefficient | |
| Bristle diameter | |
| Bore hole diameter | |
| Seal inner diameter | |
| h | Heat transfer coefficient |
| Mass flow through brush seal | |
| Idealized, inviscid gap flow | |
| p | Pressure |
| R | Specific gas constant |
| Radial distance of bore hole to rotor surface | |
| Axial distance of package to back plate | |
| Axial position of heat impact | |
| Depth of the bore hole | |
| T | Temperature |
| u | Circumferential velocity |
| Greek Symbols | |
| Heat capacity ratio | |
| Laying angle | |
| Packing density | |
| Subscripts | |
| in | Inlet |
| out | Outlet |
| t | Total |
| Abbreviations | |
| ITS | Institut für Thermische Strömungsmaschinen (engl.: Institute of Thermal Turbomachinery) |
| FEA | Finite element analysis |
| KCl | Potassium chloride |
| NaCl | Sodium chloride |
| O | Oil |
| S | Salt |
| TC | Thermocouple |
References
- Holle, G.F.; Krishnan, M.R. Gas Turbine Engine Brush Seal Applications. In Proceedings of the 26th AIAA/ASME/SAE/ASEE Joint Propulsion Conference & Exhibit, Orlando, FL, USA, 16–18 July 1990. [Google Scholar] [CrossRef]
- Mahler, F.; Boyes, E. The Application of Brush Seals in Large Commercial Jet Engines. In Proceedings of the 31st AIAA/ASME/SAE/ASEE Joint Propulsion Conference & Exhibit, San Diego, CA, USA, 10–12 July 1995. [Google Scholar] [CrossRef]
- Wolfe, C.E.; Chiu, R.P.; Cromer, R.H.; Crum, G.A.; Marks, P.T.; Stuck, A.E.; Turnquist, N.A.; Reluzco, G.; Dinc, O.S. Brush Seals in Industrial Gas Turbines. In Proceedings of the 33rd AIAA/ASME/SAE/ASEE Joint Propulsion Conference & Exhibit, Seattle, WA, USA, 6–9 July 1997. [Google Scholar] [CrossRef]
- Soditus, M.S. Commercial Aircraft Maintenance Experience Relating to Current Engine Seal Technology. In Proceedings of the 34th AIAA/ASME/SAE/ASEE Joint Propulsion Conference & Exhibit, Cleveland, OH, USA, 13–15 July 1998. [Google Scholar] [CrossRef]
- Chupp, R.E.; Ghasripoor, F.; Turnquist, N.A.; Demiroglu, M.; Aksit, M.F. Advanced Seals for Industrial Turbine Applications: Dynamic Seal Development. J. Propul. Power 2002, 18, 1260–1266. [Google Scholar] [CrossRef]
- Osterhage, T.; Büscher, S.; Kosyna, G.; Glienicke, J.; Urlichs, K. Multiple Rows Brush Seal Testing for Steam Turbine Applications with High Temperature and High Pressure Conditions and Long Service Intervals. In Proceedings of the 6th European Conference on Turbomachinery, Lille, France, 7–11 March 2005. [Google Scholar]
- Hildebrandt, M.; Schwarz, H.; Schwitzke, C.; Bauer, H.J.; Friedrichs, J. Effects of the Back Plate Inner Diameter on the Frictional Heat Input and General Performance of Brush Seals. Aerospace 2018, 5, 58. [Google Scholar] [CrossRef] [Green Version]
- Hildebrandt, M.; Schwitzke, C.; Bauer, H.J. Experimental Investigation on the Influence of Geometrical Parameters on the Frictional Heat Input and Leakage Performance of Brush Seals. J. Eng. Gas Turbines Power 2019, 141, 042504. [Google Scholar] [CrossRef]
- Demiroglu, M.; Tichy, J.A. An Investigation of Heat Generation Characteristics of Brush Seals. In Proceedings of the ASME Turbo Expo 2007: Power for Land, Sea, and Air, Montreal, QC, Canada, 14–17 May 2007. [Google Scholar] [CrossRef]
- Ruggiero, E.; Allen, J.; Demiroglu, M.; Lusted, R.M. Heat Generation Characteristics of a Kevlar Fiber Brush Seal. In Proceedings of the 43rd AIAA/ASME/SAE/ASEE Joint Propulsion Conference & Exhibit, Cincinnati, OH, USA, 8–11 July 2007; p. 5738. [Google Scholar] [CrossRef]
- Ruggiero, E.; Allen, J.; Lusted, R.M. Heat Generation Characteristics of a Carbon Fiber Brush Seal. In Proceedings of the 44th AIAA/ASME/SAE/ASEE Joint Propulsion Conference & Exhibit, Hartford, CT, USA, 21–23 July 2008; p. 4508. [Google Scholar] [CrossRef]
- Flouros, M.; Hendrick, P.; Outirba, B.; Cottier, F.; Proestler, S. Thermal and Flow Phenomena Associated With the Behavior of Brush Seals in Aero Engine Bearing Chambers. J. Eng. Gas Turbines Power 2015, 137, 092503. [Google Scholar] [CrossRef]
- Huang, S.; Suo, S.; Li, Y.; Wang, Y. Theoretical and Experimental Investigation on Tip Forces and Temperature Distributions of the Brush Seal Coupled Aerodynamic Force. J. Eng. Gas Turbines Power 2014, 136, 052502. [Google Scholar] [CrossRef]
- Raben, M.; Friedrichs, J.; Flegler, J. Brush Seal Frictional Heat Generation: Test Rig Design and Validation Under Steam Environment. In Proceedings of the ASME Turbo Expo 2016: Turbomachinery Technical Conference and Exposition, Seoul, Korea, 13–17 June 2016. [Google Scholar] [CrossRef]
- Pastrana, R.M.; Wolfe, C.E.; Turnquist, N.A.; Burnett, M.E. Improved Steam Turbine Leakage Control With A Brush Seal Design. In Proceedings of the 30th Turbomachinery Symposium; Texas A&M University, Turbomachinery Laboratories: College Station, TX, USA, 2001. [Google Scholar] [CrossRef]
- Golinkin, S.L.; Lipski, M.J.; Conlow, F.J. Modernization of Existing US Navy Steam Turbines: Efficiency, Reliability and Maintainability. In Proceedings of the ASME Turbo Expo 2010: Power for Land, Sea, and Air, Glasgow, UK, 14–18 June 2010; pp. 993–1012. [Google Scholar] [CrossRef]
- Aksit, M.; Bhate, N.; Bouchard, C.; Testo-Blakelock, C.; Demiroglu, M. Evaluation of Brush Seal Performance for Oil Sealing Applications. In Proceedings of the 39th AIAA/ASME/SAE/ASEE Joint Propulsion Conference & Exhibit, Huntsville, AL, USA, 20–23 July 2003; p. 4695. [Google Scholar] [CrossRef]
- Stephen, D.; Hogg, S.I. Development of Brush Seal Technology for Steam Turbine Retrofit Applications. In Proceedings of the International Joint Power Generation Conference collocated with TurboExpo 2003, Atlanta, GA, USA, 16–19 June 2003; pp. 505–512. [Google Scholar] [CrossRef]
- Neef, M.; Sulda, E.; Surken, N.; Walkenhorst, J. Design Features and Performance Details of Brush Seals for Turbine Applications. In Proceedings of the ASME Turbo Expo 2006: Power for Land, Sea, and Air, Barcelona, Spain, 8–11 May 2006; pp. 1385–1392. [Google Scholar] [CrossRef]
- Samudrala, O.; Wolfe, C.E.; Kumar, S.; Chupp, R.E. Design optimization of a retractable holder for compressor discharge brush seal. In Proceedings of the ASME 2011 Turbo Expo: Turbine Technical Conference and Exposition, Vancouver, BC, Canada, 6–10 June 2011; pp. 845–857. [Google Scholar] [CrossRef]
- Cardone, G.; Astarita, T.; Carlomagno, G. Heat Transfer Measurements on a Rotating Disk. Int. J. Rotat. Mach. 1997, 3, 1–9. [Google Scholar] [CrossRef] [Green Version]
- Hildebrandt, M.; Schwitzke, C.; Bauer, H.-J. Experimental Investigation on the Influence of Geometrical Parameters on the Frictional Heat Input and Leakage Performance of Brush Seals. In Proceedings of the ASME Turbo Expo 2017: Turbomachinery Technical Conference and Exposition, Charlotte, NC, USA, 26–30 June 2017. [Google Scholar] [CrossRef]


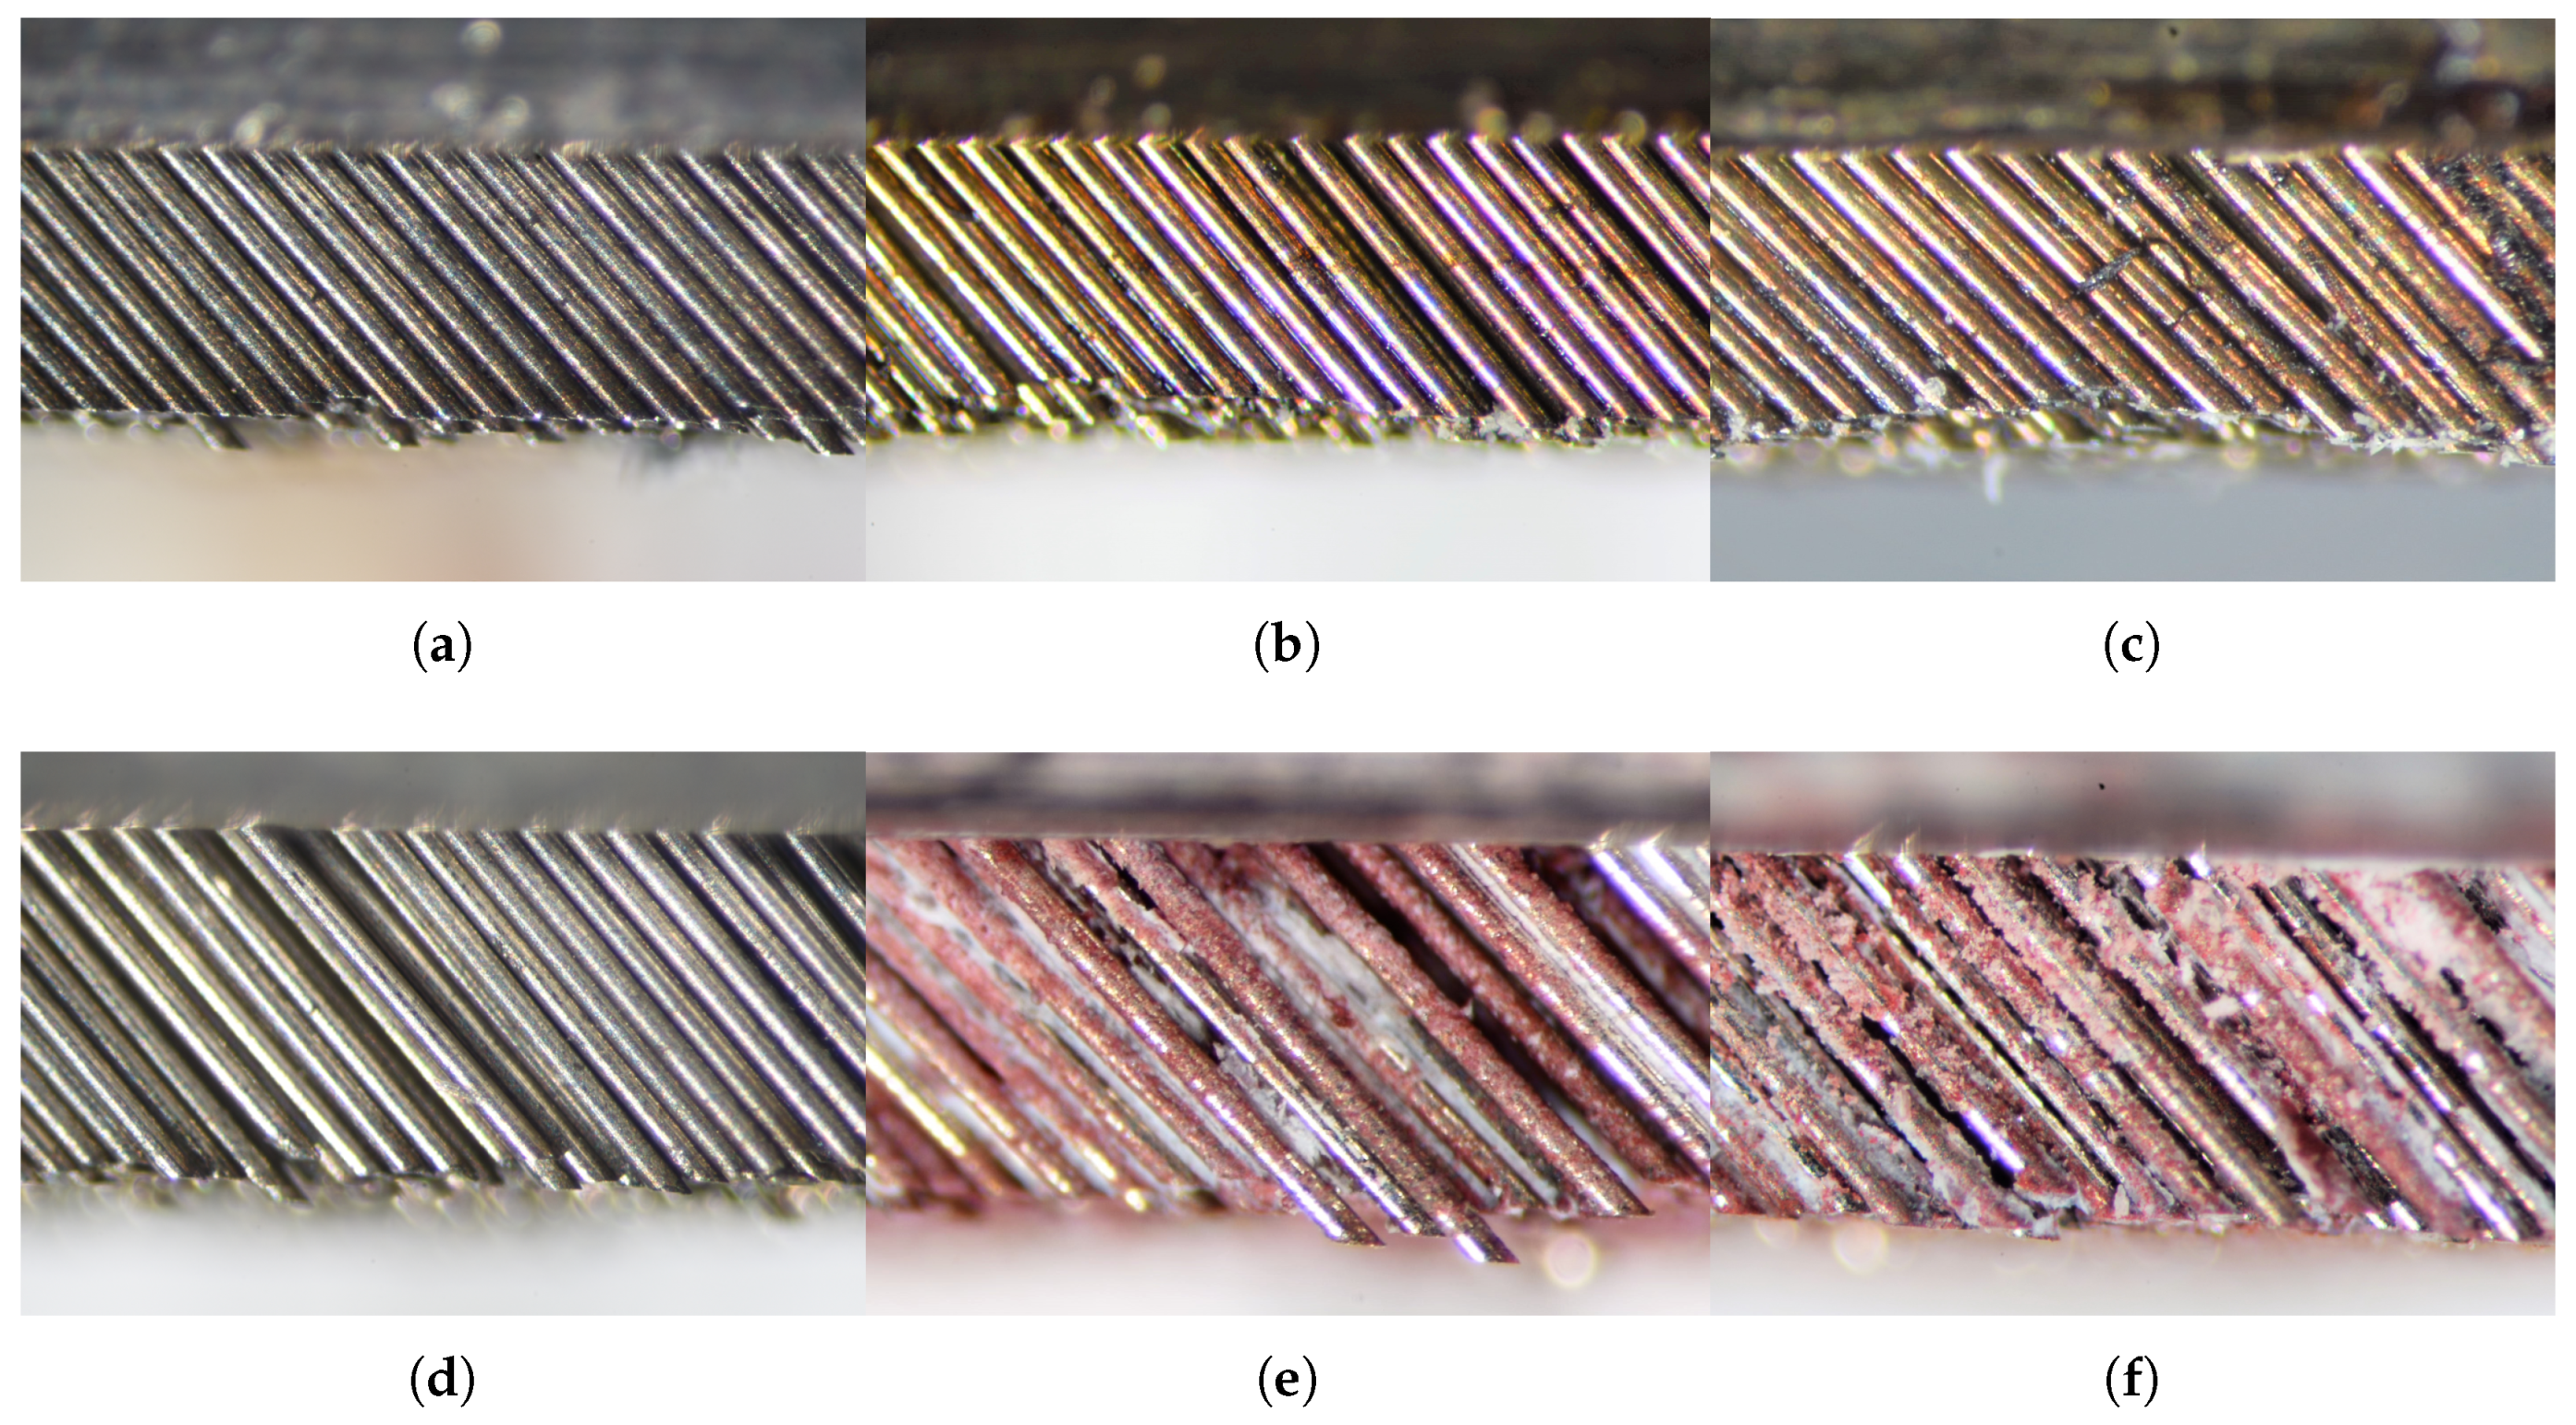
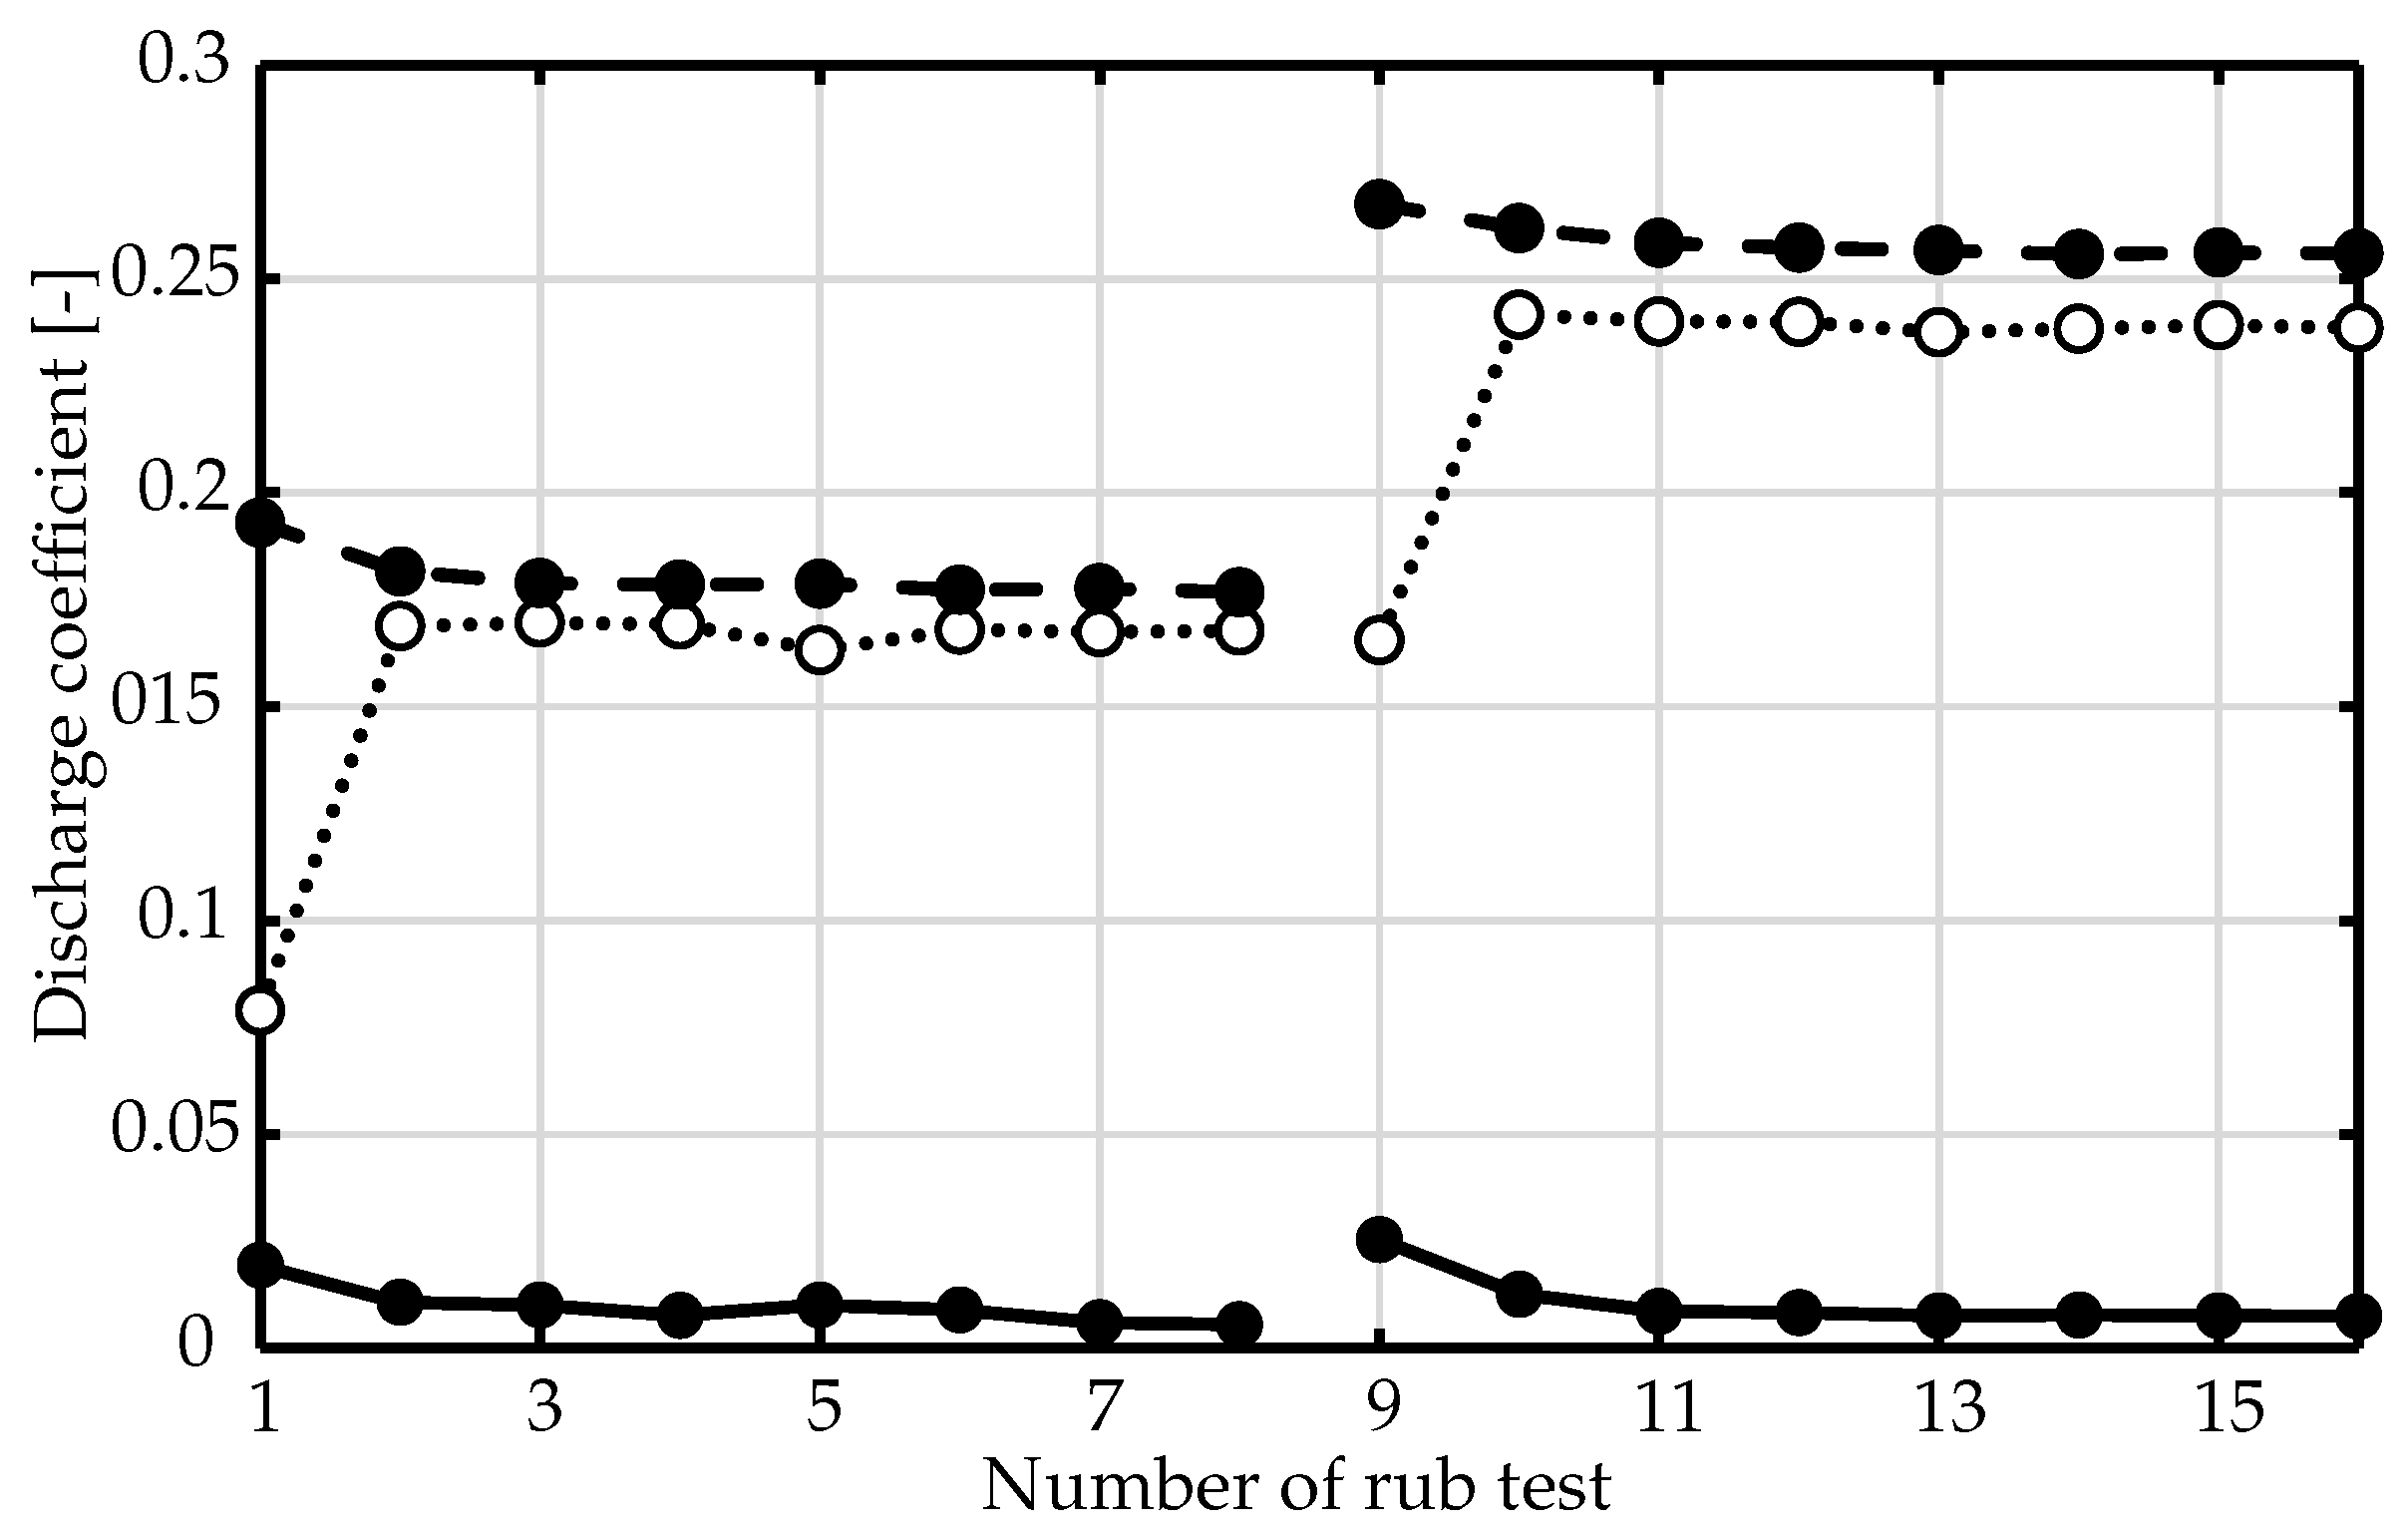
 ) and after the treatment (••••); the measurements were carried out by MTU Aero Engines AG.
) and after the treatment (••••); the measurements were carried out by MTU Aero Engines AG.
) and after the treatment (••••); the measurements were carried out by MTU Aero Engines AG. ) and after the treatment (••••); the measurements were carried out by MTU Aero Engines AG.
) and after the treatment (••••); the measurements were carried out by MTU Aero Engines AG.
) and after the treatment (••••); the measurements were carried out by MTU Aero Engines AG.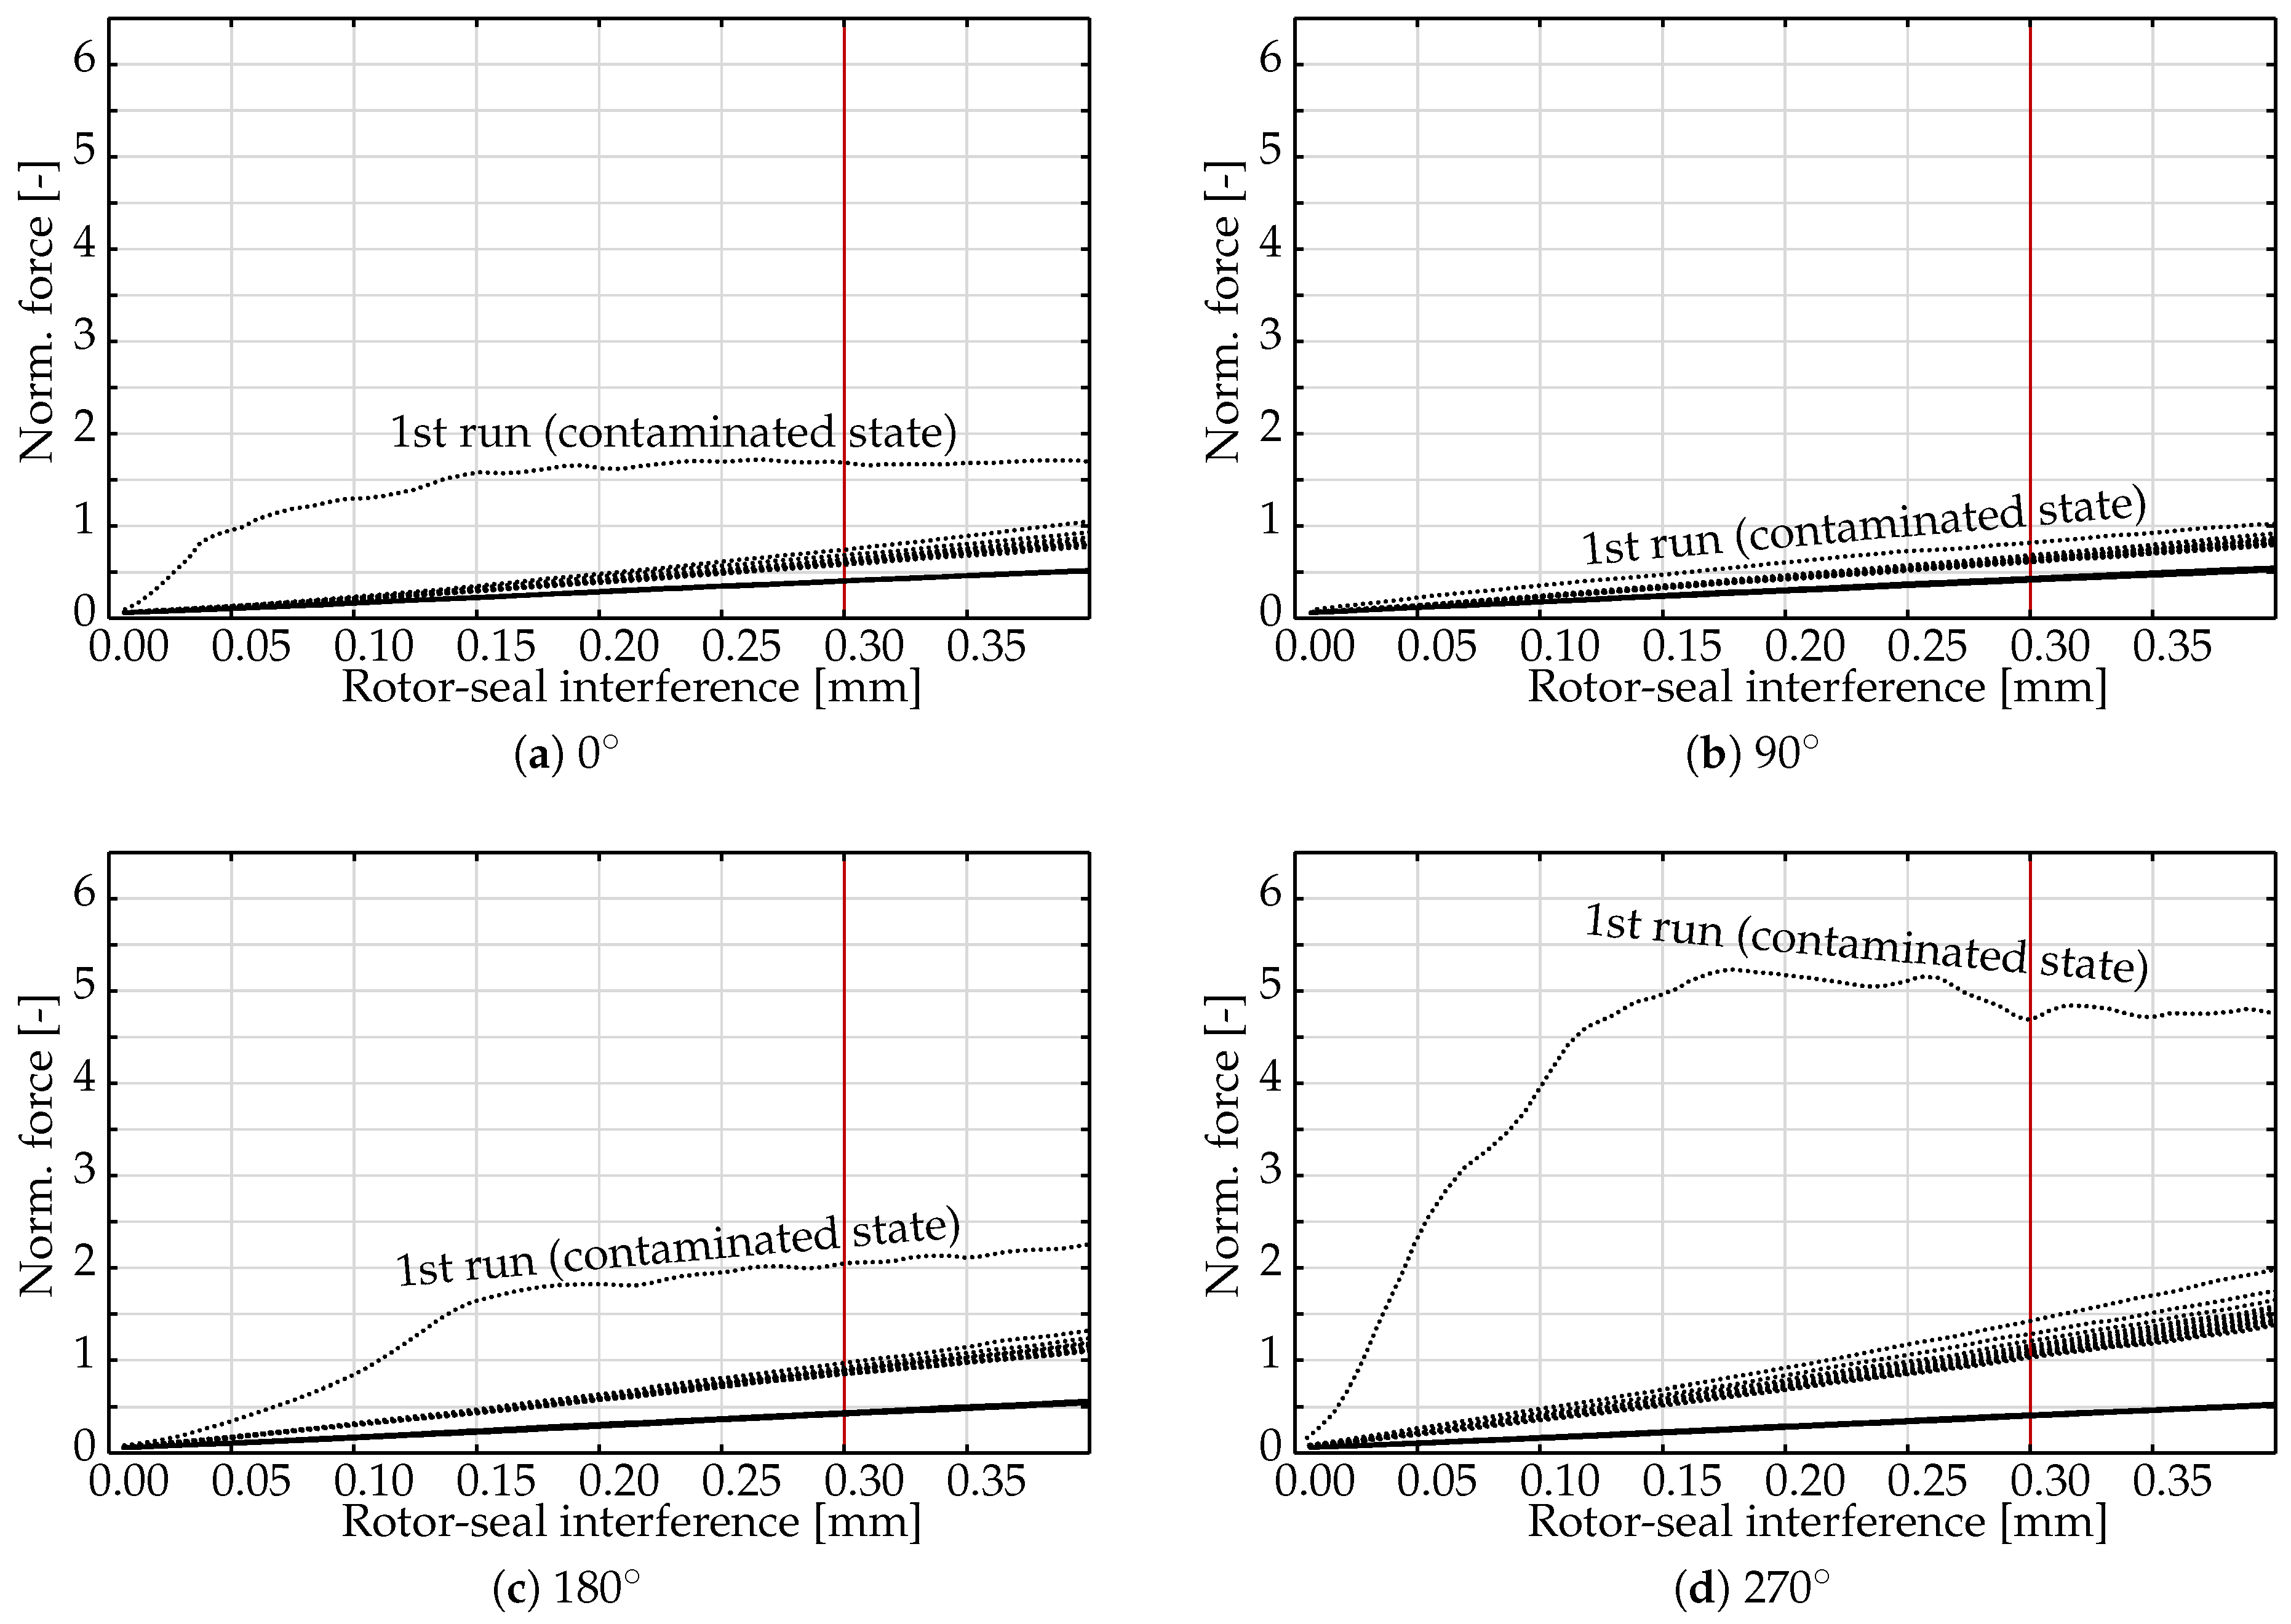
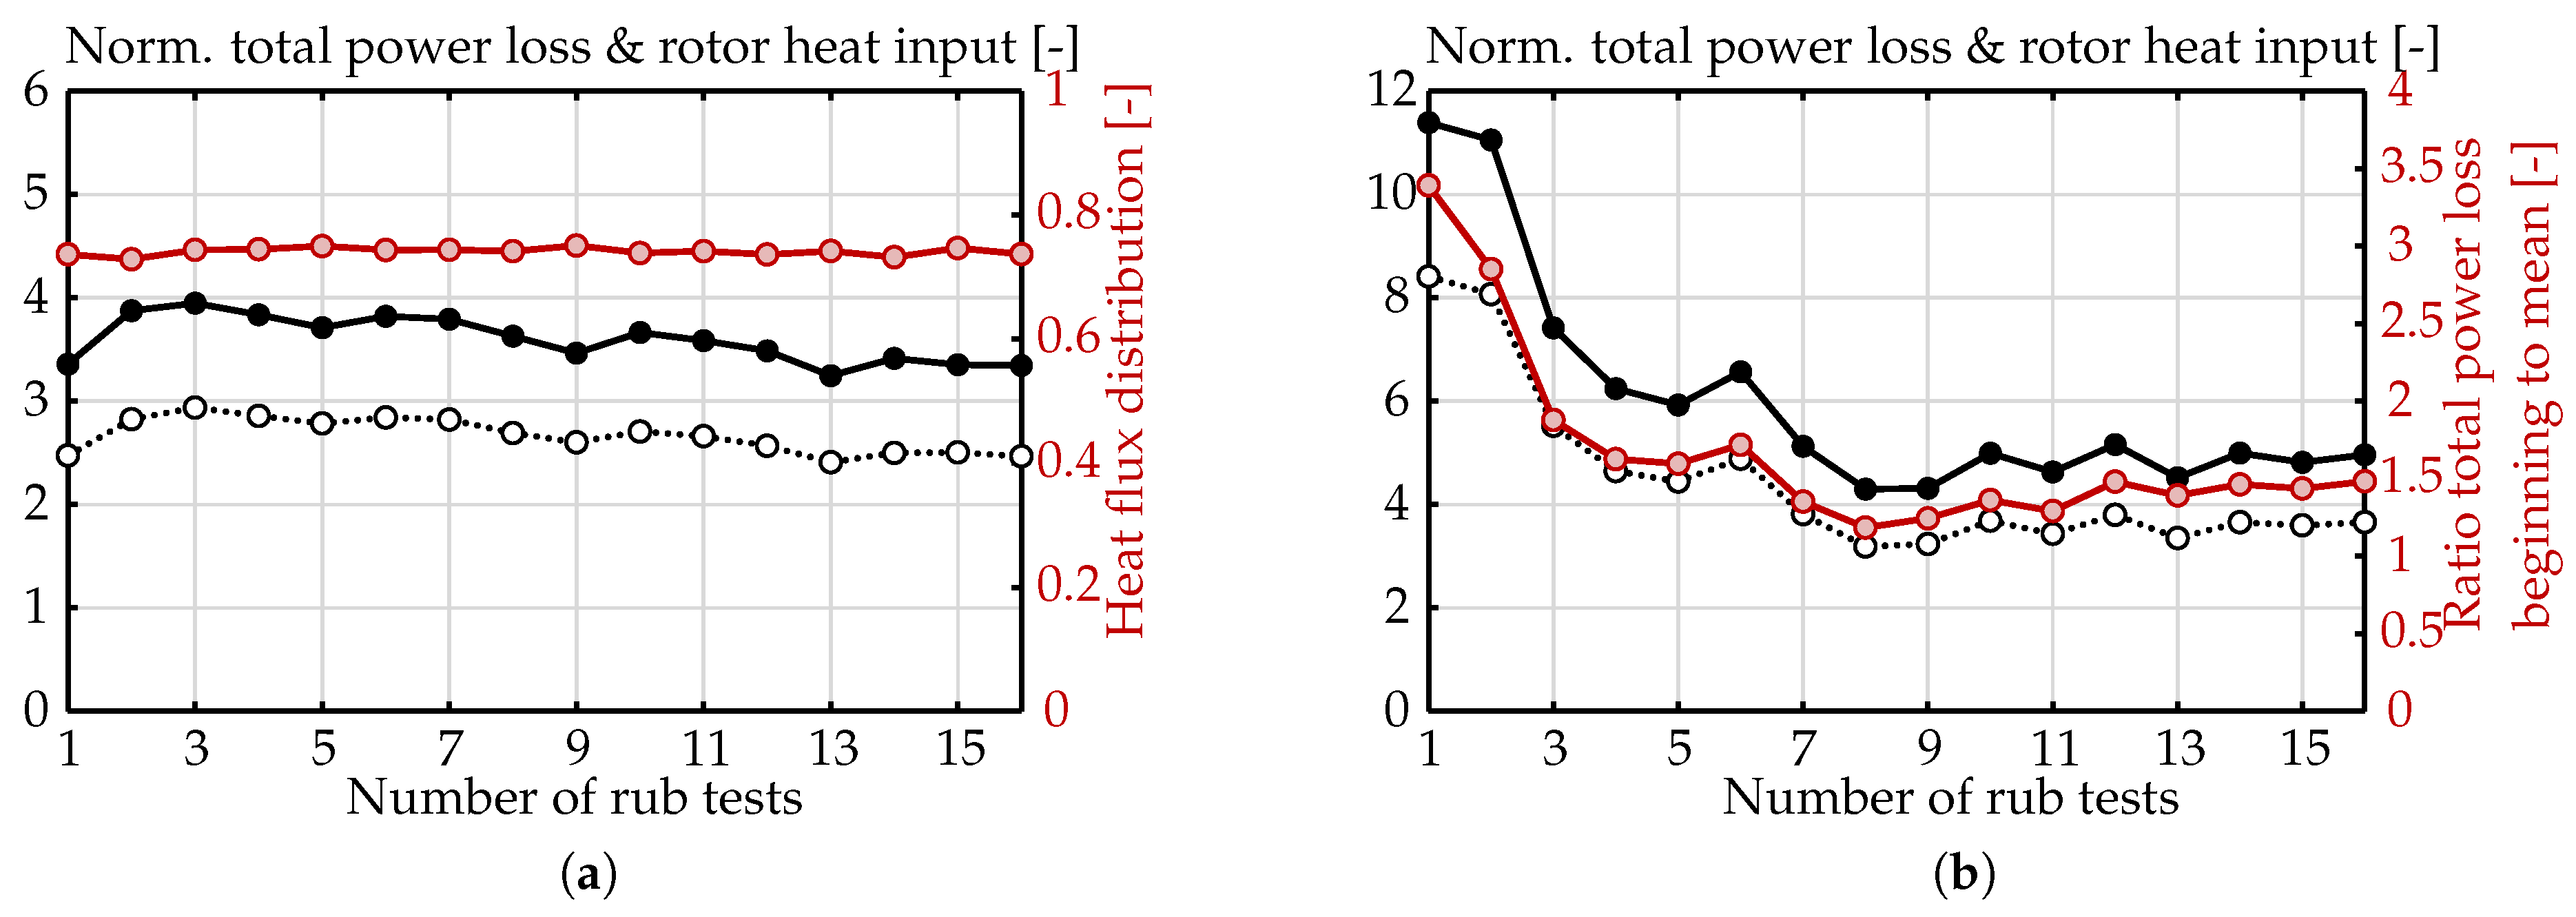
 ), rotor heat input (• ◯ •) and heat flux distribution (
  ); the results shown represent values averaged over the rubbing duration. (b) Normalised total power loss ( ), rotor heat input (• ◯ •) and ratio of total power loss at the beginning to averaged value ( ); the shown power losses and heat inputs represent values at the beginning of rubbing.
), rotor heat input (• ◯ •) and heat flux distribution ( ); the results shown represent values averaged over the rubbing duration. (b) Normalised total power loss ( ), rotor heat input (• ◯ •) and ratio of total power loss at the beginning to averaged value ( ); the shown power losses and heat inputs represent values at the beginning of rubbing.
); the results shown represent values averaged over the rubbing duration. (b) Normalised total power loss ( ), rotor heat input (• ◯ •) and ratio of total power loss at the beginning to averaged value ( ); the shown power losses and heat inputs represent values at the beginning of rubbing.
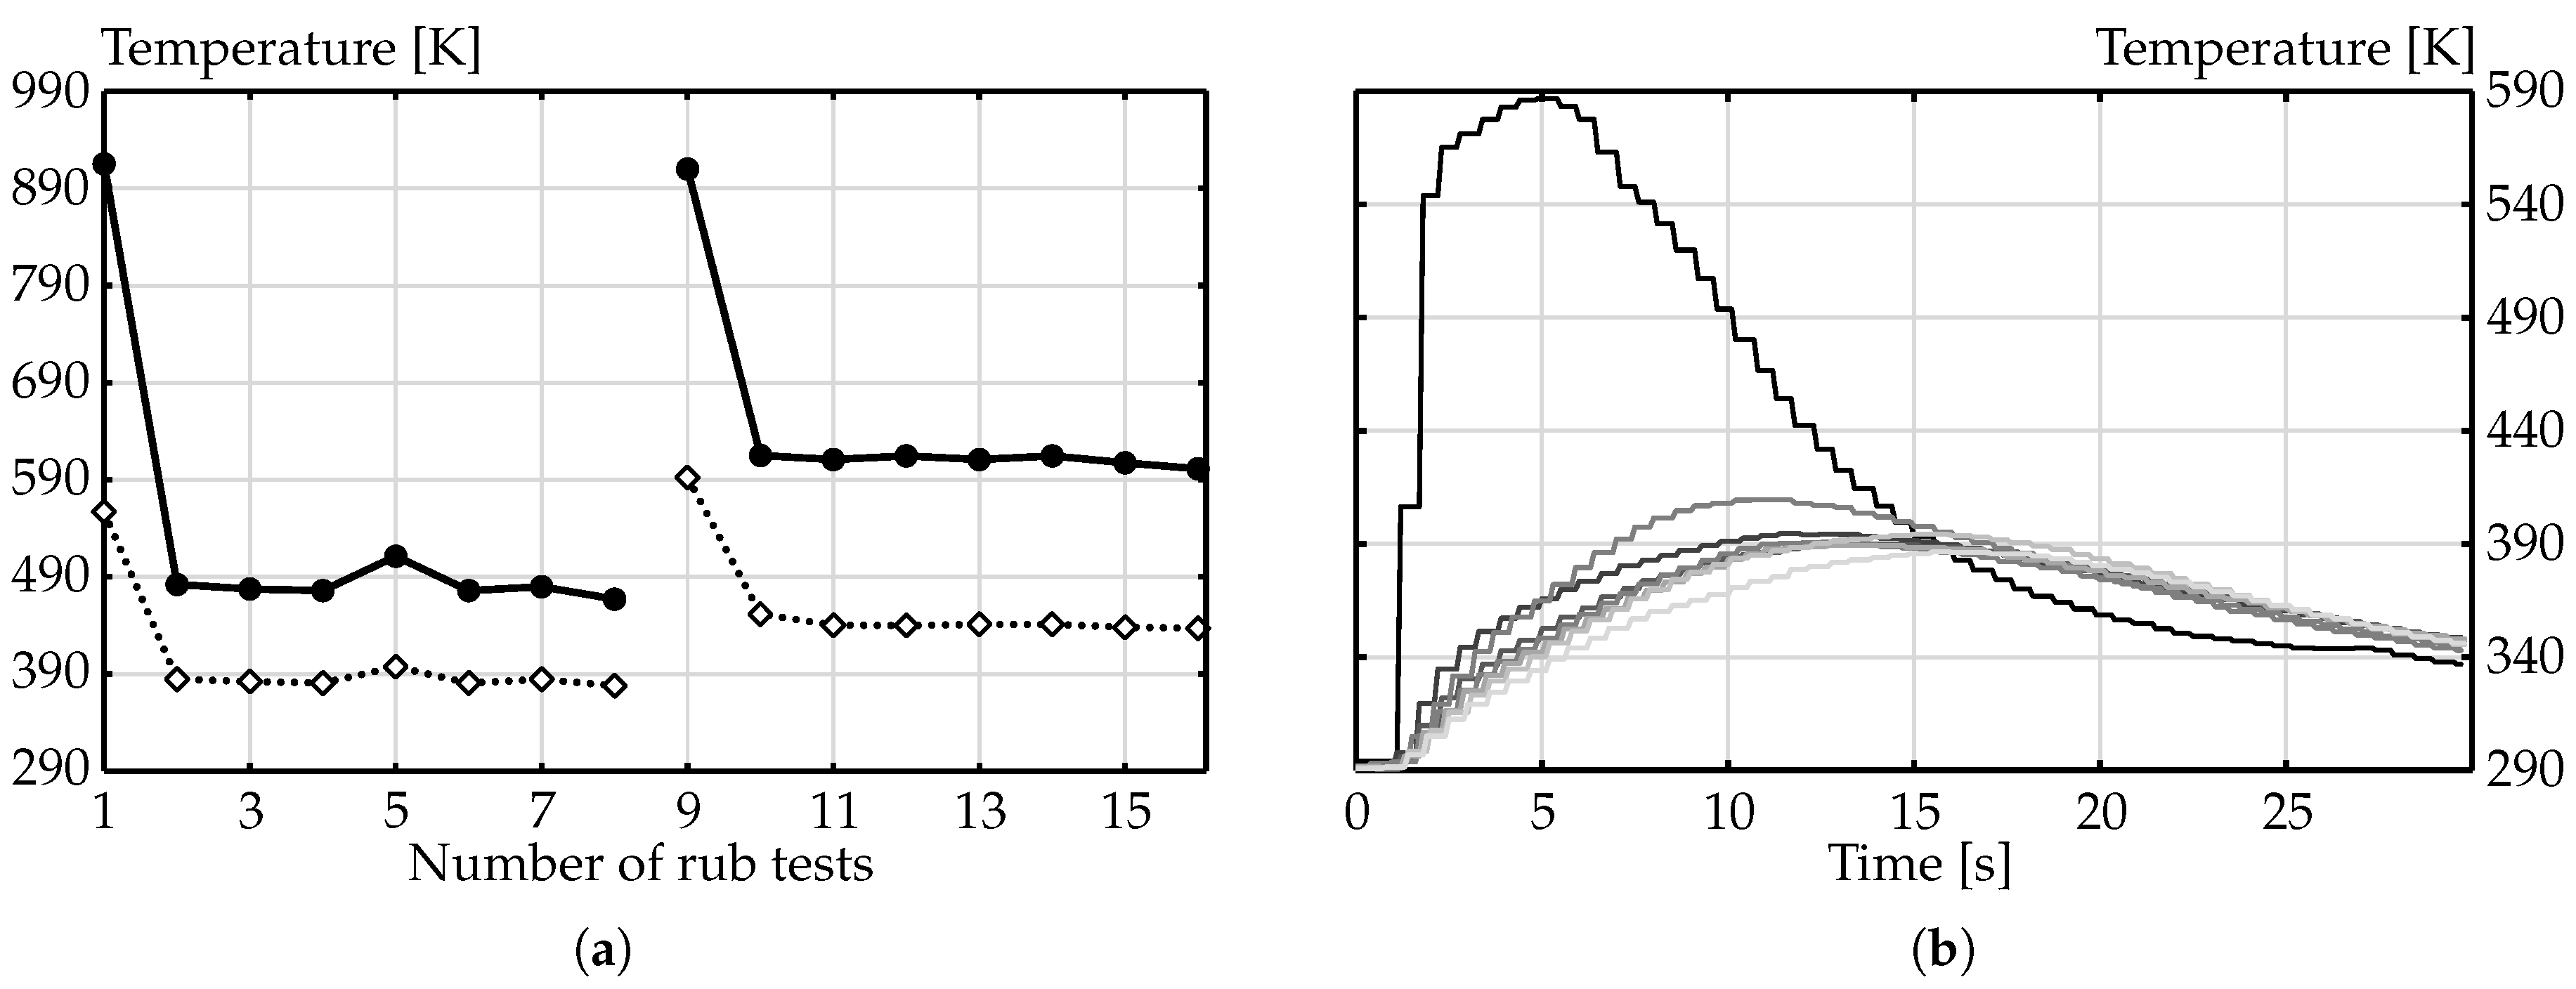
), rotor heat input (• ◯ •) and heat flux distribution ( ); the results shown represent values averaged over the rubbing duration. (b) Normalised total power loss ( ), rotor heat input (• ◯ •) and ratio of total power loss at the beginning to averaged value ( ); the shown power losses and heat inputs represent values at the beginning of rubbing. ) and maximum rotor temperature (
  ). (b) Course of the maximum rotor temperature over the rubbing duration, first run ( ) to last run (
  ).
) and maximum rotor temperature ( ). (b) Course of the maximum rotor temperature over the rubbing duration, first run ( ) to last run ( ).
).
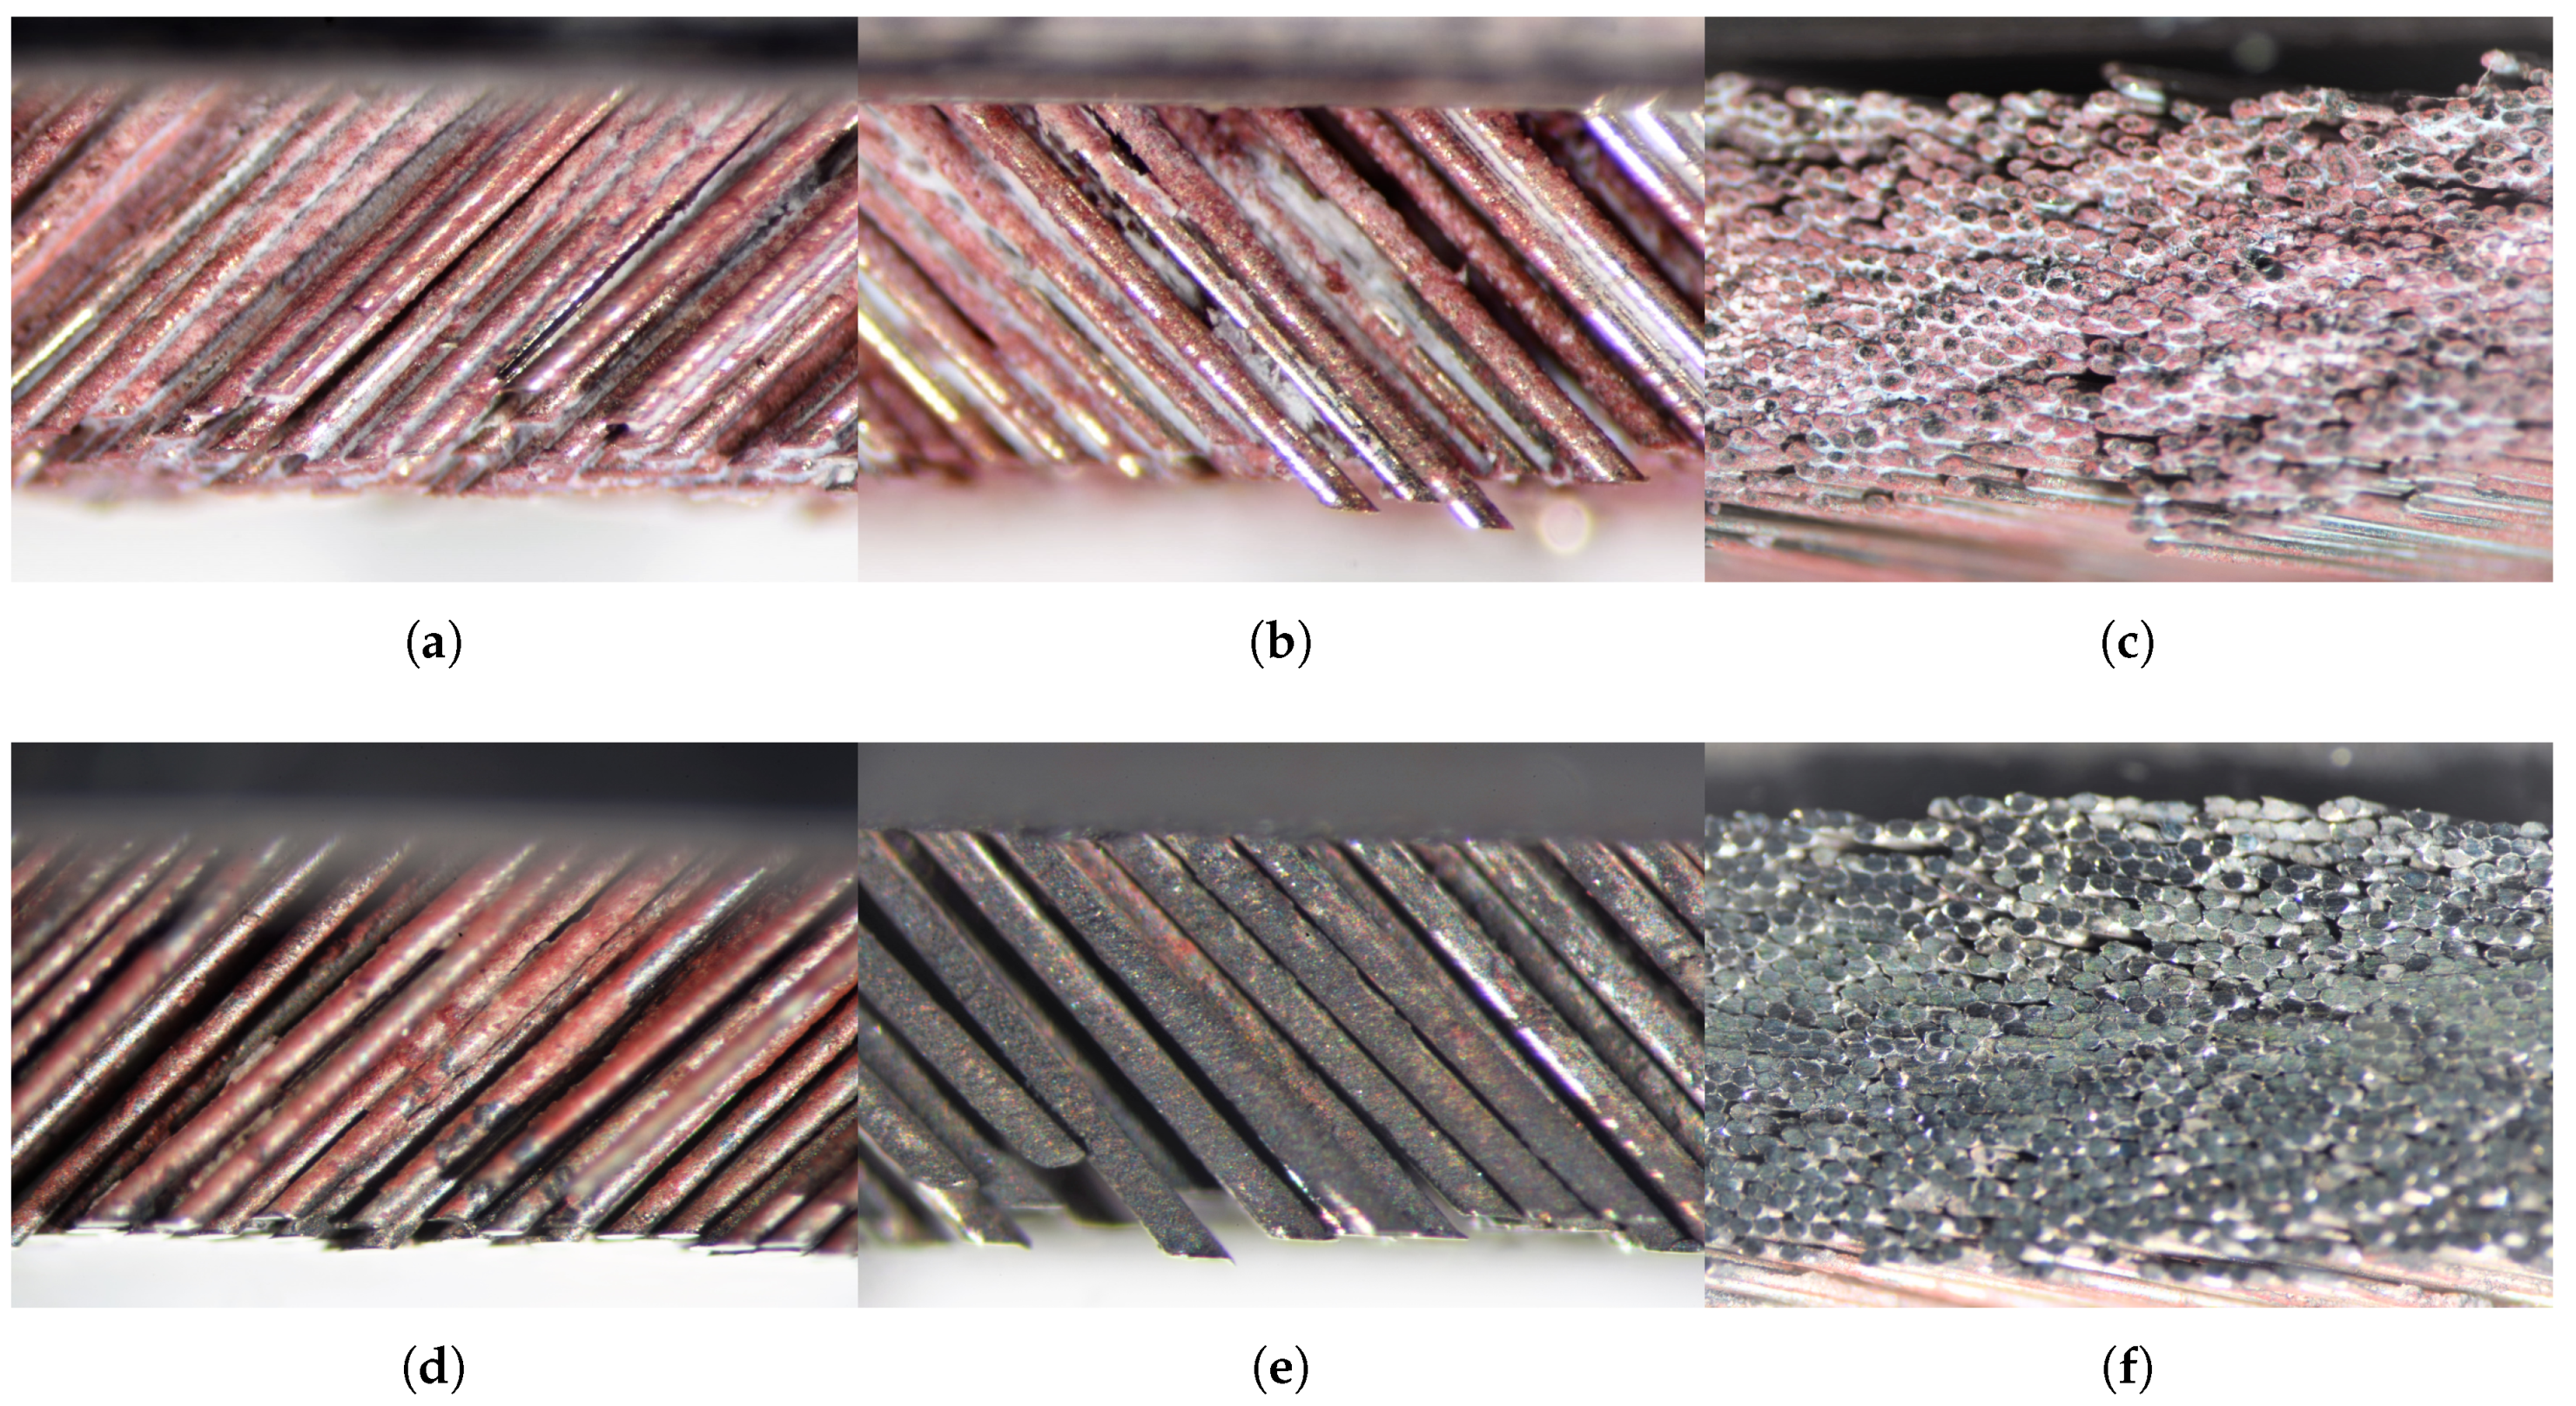
) and maximum rotor temperature ( ). (b) Course of the maximum rotor temperature over the rubbing duration, first run ( ) to last run ( ).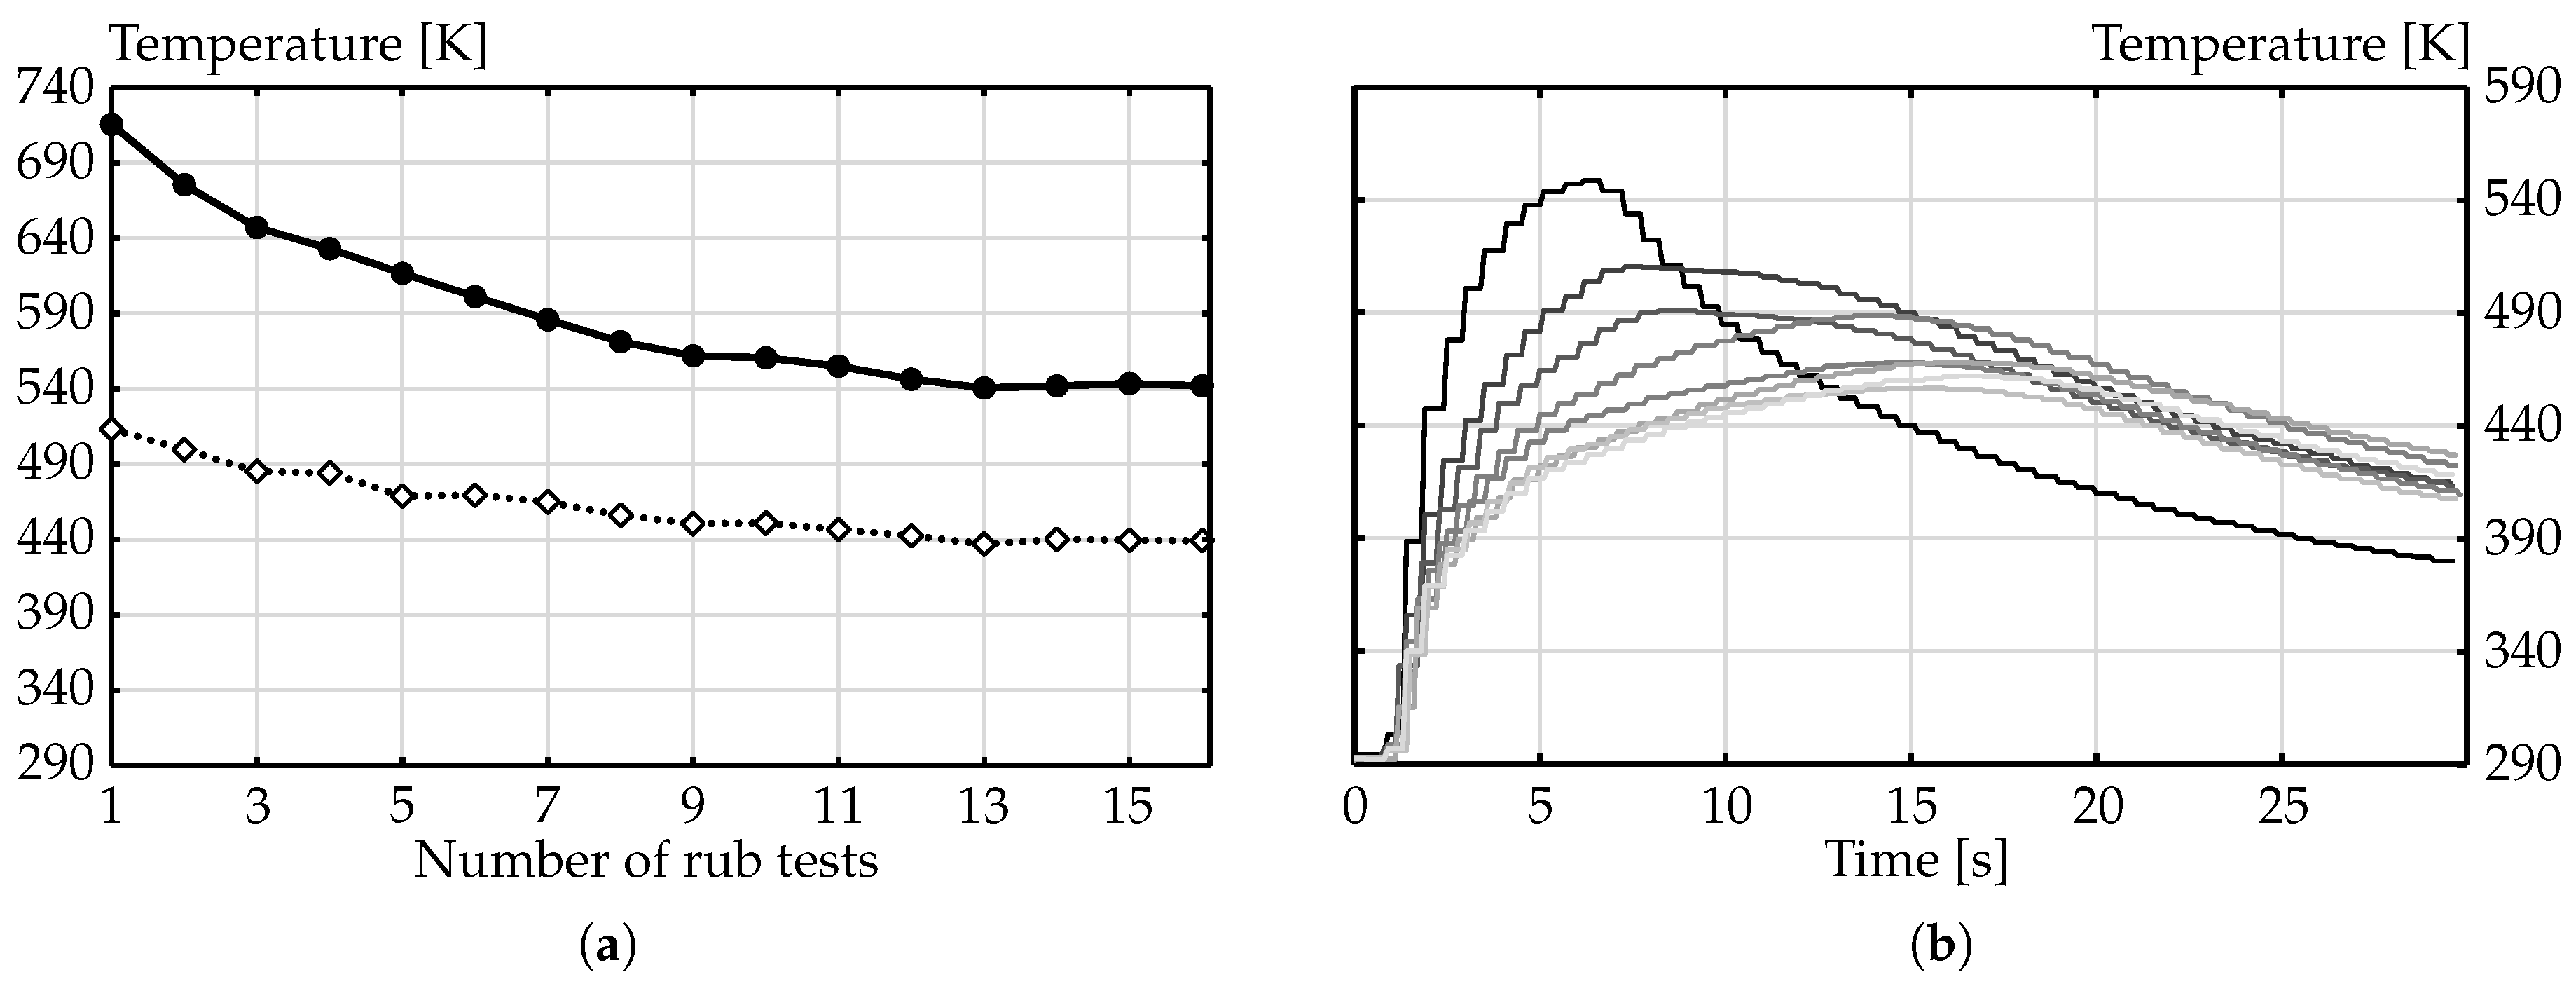 ) and after (
  ) rubbing.
 ), rotor heat input (• ◯ •) and heat flux distribution ( ); the results shown represent values averaged over the rubbing duration. (b) Normalised total power loss ( ), rotor heat input (• ◯ •) and ratio of total power loss at the beginning to averaged value ( ); the shown power losses and heat inputs represent values at the beginning of the rubbing duration.
), rotor heat input (• ◯ •) and heat flux distribution ( ); the results shown represent values averaged over the rubbing duration. (b) Normalised total power loss ( ), rotor heat input (• ◯ •) and ratio of total power loss at the beginning to averaged value ( ); the shown power losses and heat inputs represent values at the beginning of the rubbing duration.
), rotor heat input (• ◯ •) and heat flux distribution ( ); the results shown represent values averaged over the rubbing duration. (b) Normalised total power loss ( ), rotor heat input (• ◯ •) and ratio of total power loss at the beginning to averaged value ( ); the shown power losses and heat inputs represent values at the beginning of the rubbing duration.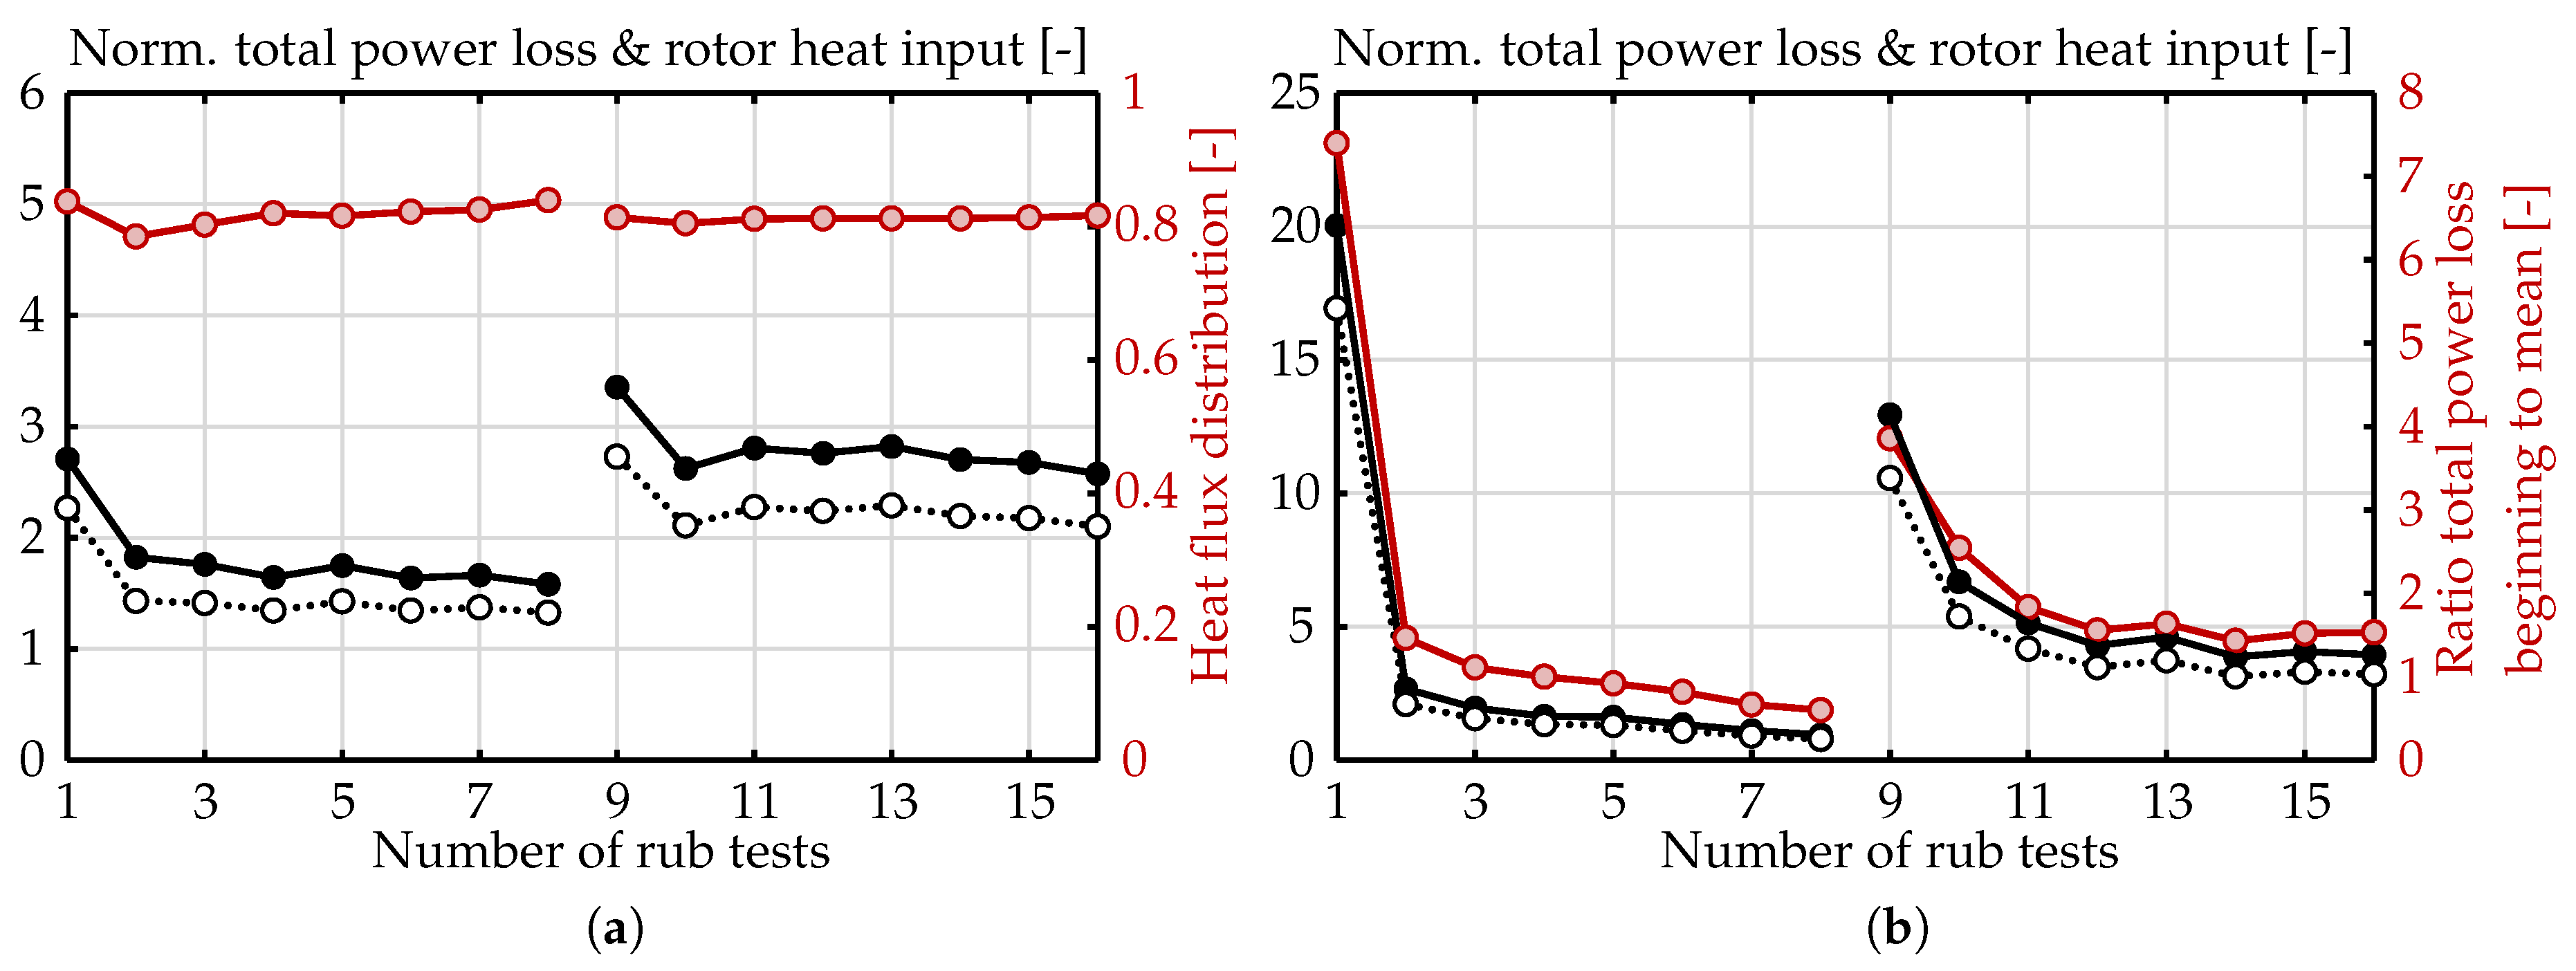 ) and maximum rotor temperature ( ). (b) Course of the maximum rotor temperature over the rubbing duration, first run ( ) to last run ( ).
) and maximum rotor temperature ( ). (b) Course of the maximum rotor temperature over the rubbing duration, first run ( ) to last run ( ).
) and maximum rotor temperature ( ). (b) Course of the maximum rotor temperature over the rubbing duration, first run ( ) to last run ( ). ) and after ( ) rubbing.
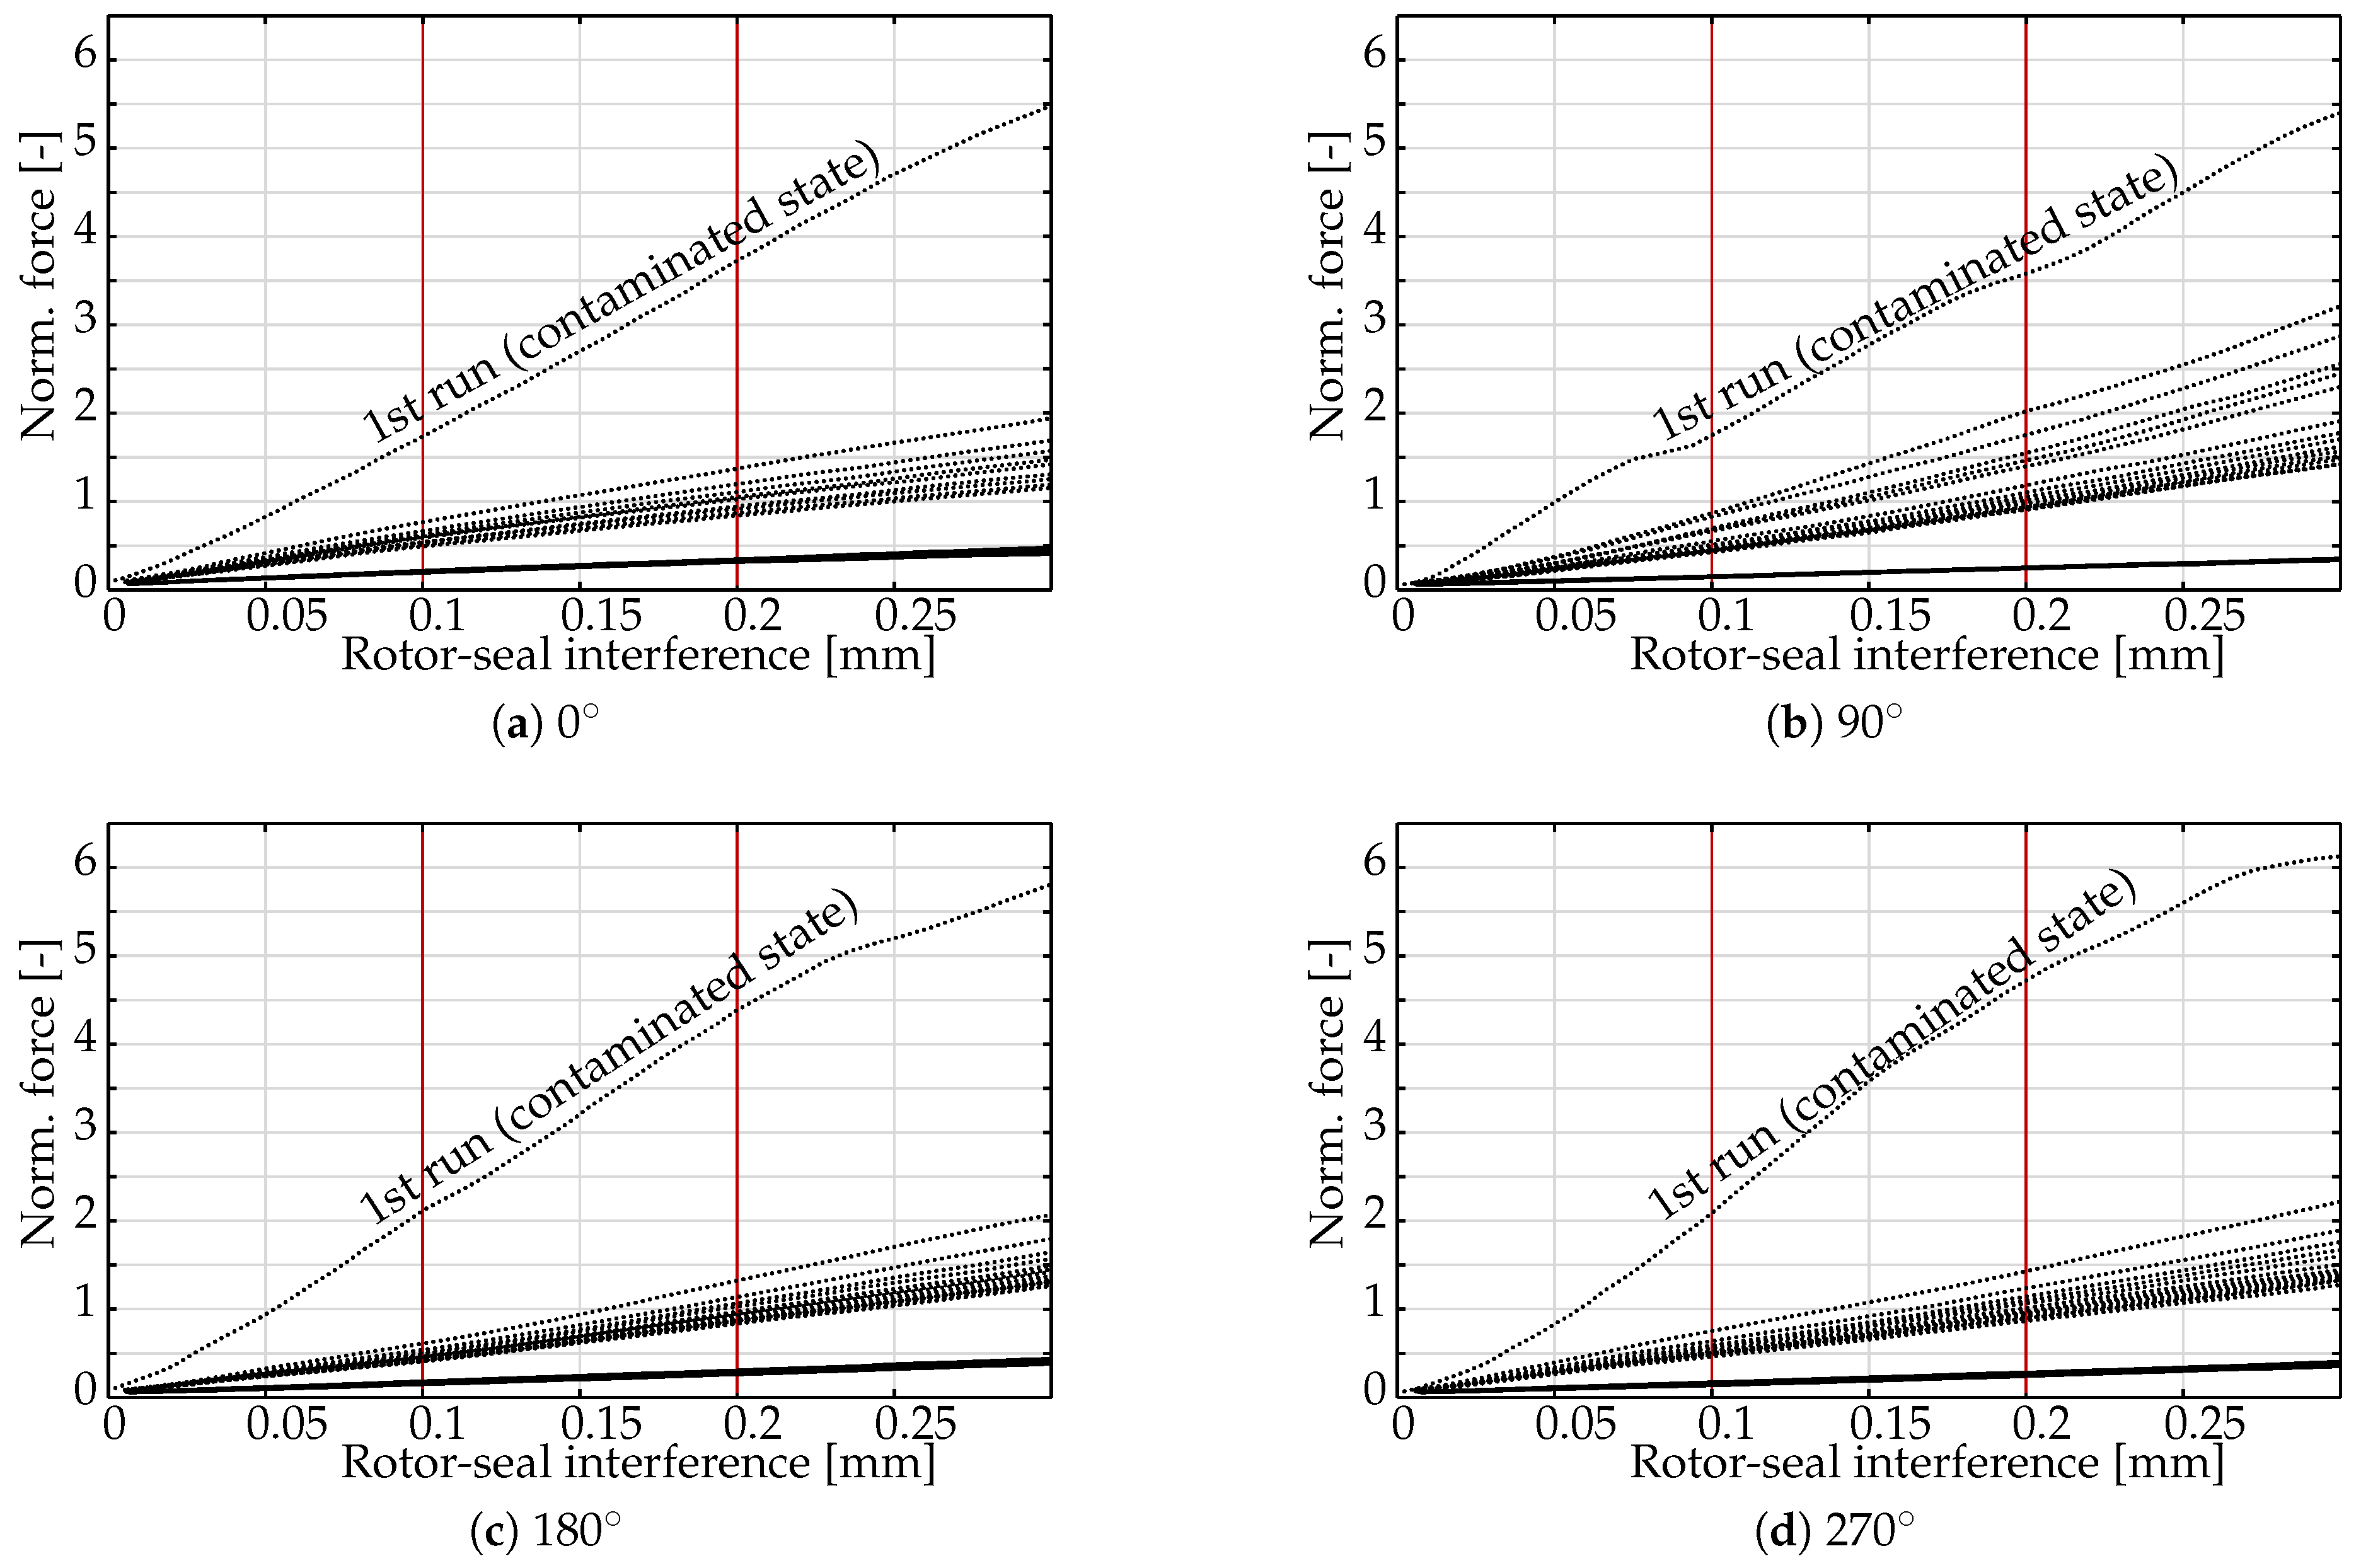
 ) and normalised stamping force ( ). (a) Seal O and rotor–seal interference of , (b) seal O and rotor–seal interference of , (c) seal S and rotor–seal interference of .
) and normalised stamping force ( ). (a) Seal O and rotor–seal interference of , (b) seal O and rotor–seal interference of , (c) seal S and rotor–seal interference of .
) and normalised stamping force ( ). (a) Seal O and rotor–seal interference of , (b) seal O and rotor–seal interference of , (c) seal S and rotor–seal interference of .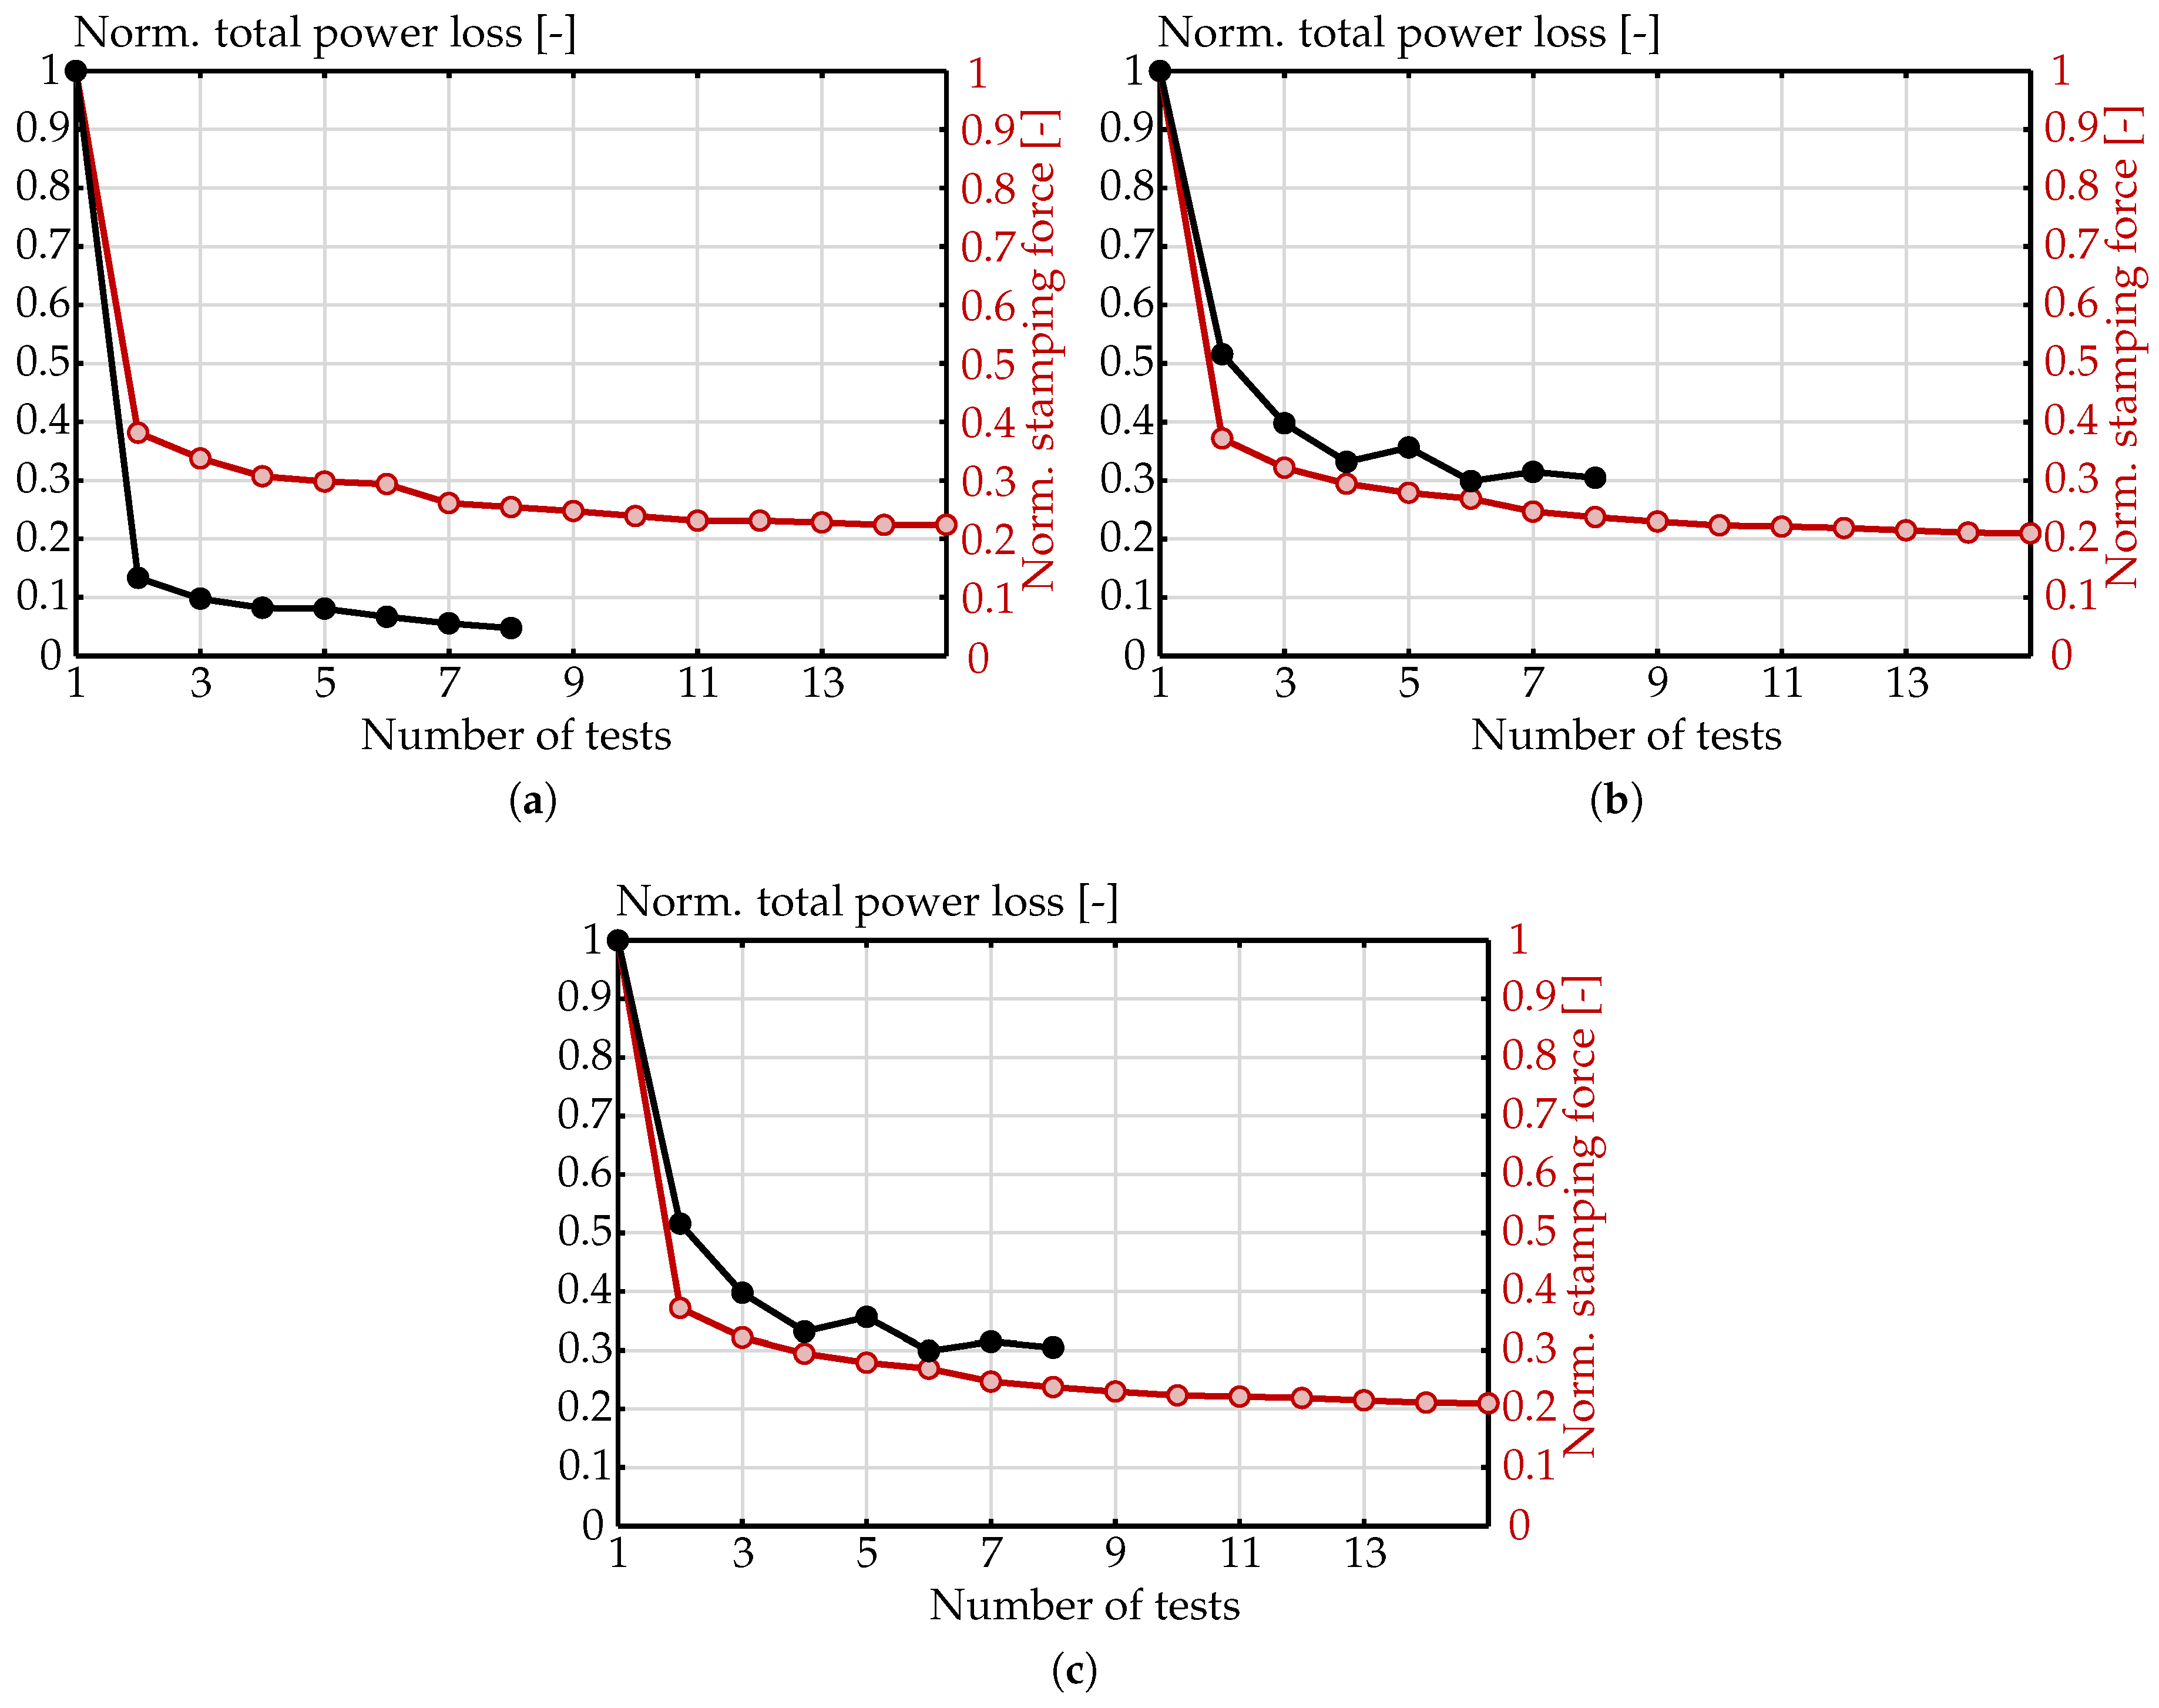

| Parameter | Seal O(il) | Seal S(alt) |
|---|---|---|
| seal inner diameter () | 300 | |
| laying angle () | 45 | |
| bristle diameter () | 0.10 | |
| packing density (Bpmm) | 140 | |
| back plate inner diameter | Identical | |
| nominal bristle pack width b () | 2.97 | |
| bristles material | Haynes 25 | |
| ax. dist. package to back plate () | 0.00 | 0.63 |
| Contamination medium | Turbine oil | Salt mixture |
| Run | Seal O | Seal O | Seal S |
|---|---|---|---|
| (0.1 mm Interference) | (0.2 mm Interference) | (0.3 mm Interference) | |
| 1 | 11.26 ± 1.19 | 14.61 ± 1.65 | 5.66 ± 3.54 |
| 2 | 4.30 ± 0.54 | 5.43 ± 0.93 | 2.33 ± 0.71 |
| 3 | 3.80 ± 0.62 | 4.70 ± 0.89 | 2.17 ± 0.61 |
| 4 | 3.46 ±0.44 | 4.30 ± 0.69 | 2.07 ± 0.56 |
| 5 | 3.36 ± 0.42 | 4.07 ± 0.65 | 2.03 ± 0.52 |
| 6 | 3.31 ± 0.48 | 3.93 ± 0.63 | 1.99 ± 0.52 |
| 7 | 2.94 ± 0.20 | 3.61 ± 0.37 | 1.96 ± 0.51 |
| 8 | 2.86 ± 0.18 | 3.47 ± 0.28 | 1.94 ± 0.47 |
| 9 | 2.79 ± 0.17 | 3.36 ± 0.27 | 1.94 ± 0.48 |
| 10 | 2.69 ± 0.18 | 3.26 ± 0.26 | 1.92 ± 0.47 |
| 11 | 2.60 ± 0.18 | 3.23 ± 0.17 | 2.06 ± 0.46 |
| 12 | 2.60 ± 0.16 | 3.20 ± 0.09 | 2.06 ± 0.46 |
| 13 | 2.57 ± 0.16 | 3.14 ± 0.11 | 2.03 ± 0.44 |
| 14 | 2.52 ± 0.20 | 3.08 ± 0.11 | 2.02 ± 0.44 |
| 15 | 2.52 ± 0.12 | 3.06 ± 0.11 | 2.04 ± 0.46 |
| Parameter | ||
|---|---|---|
| pressure difference () | Measurement accuracies | |
| total frictional power loss (-) | ||
| rotor–seal interference () | Repeat accuracies |
© 2019 by the authors. Licensee MDPI, Basel, Switzerland. This article is an open access article distributed under the terms and conditions of the Creative Commons Attribution (CC BY-NC-ND) license (http://creativecommons.org/licenses/by-nc-nd/4.0/).
Share and Cite
Hildebrandt, M.; Schwitzke, C.; Bauer, H.-J. Contamination of Brush Seals by Oil and Salt and Its Impact on Rubbing and Hysteresis Behaviour. Int. J. Turbomach. Propuls. Power 2019, 4, 40. https://doi.org/10.3390/ijtpp4040040
Hildebrandt M, Schwitzke C, Bauer H-J. Contamination of Brush Seals by Oil and Salt and Its Impact on Rubbing and Hysteresis Behaviour. International Journal of Turbomachinery, Propulsion and Power. 2019; 4(4):40. https://doi.org/10.3390/ijtpp4040040
Chicago/Turabian StyleHildebrandt, Manuel, Corina Schwitzke, and Hans-Jörg Bauer. 2019. "Contamination of Brush Seals by Oil and Salt and Its Impact on Rubbing and Hysteresis Behaviour" International Journal of Turbomachinery, Propulsion and Power 4, no. 4: 40. https://doi.org/10.3390/ijtpp4040040
APA StyleHildebrandt, M., Schwitzke, C., & Bauer, H.-J. (2019). Contamination of Brush Seals by Oil and Salt and Its Impact on Rubbing and Hysteresis Behaviour. International Journal of Turbomachinery, Propulsion and Power, 4(4), 40. https://doi.org/10.3390/ijtpp4040040