Article

Turbine Cascades of Last Stage Blades for Wide Range of Operating Conditions †

1
Research and Development, Doosan Skoda Power, Ltd., 30128 Pilsen, Czech Republic
2
Institute of Thermomechanics of the Czech Academy of Sciences, 182 00 Prague, Czech Republic
3
Faculty of Mechanical Engineering, Czech Technical University, 160 00 Prague, Czech Republic
4
Faculty of Mechanical Engineering, West Bohemian University, 301 00 Pilsen, Czech Republic
*
Author to whom correspondence should be addressed.
This Paper is an Extended Version of Our Paper Published in Proceedings of the European Turbomachinery Conference ETC13, Lausanne, Switzerland, 8–12 April 2019, Paper No. 350.
Int. J. Turbomach. Propuls. Power 2019, 4(4), 33; https://doi.org/10.3390/ijtpp4040033
Submission received: 22 July 2019 / Revised: 6 September 2019 / Accepted: 6 September 2019 / Published: 24 September 2019

Abstract

:
Recent trends in the electric energy market such as biomass, waste incineration or combined cycle power plants require innovative solutions in steam turbine design. Variable operating conditions cause significant changes in flow field surrounding the steam turbine last stage blades. Therefore, the enlargement of operating range for last stage blades presents new challenges in design of turbine cascades. Several turbine cascades were designed and analyzed by commercial and in-house software of CTU Prague. Selected profiles were experimentally validated in the high-speed wind tunnel for 2D cascade measurements of the Institute of Thermomechanics of the Czech Academy of Sciences which is equipped by an adjustable supersonic inlet nozzle, perforated inserts at side walls and adjustable perforated tailboard. Comparisons are presented of numerical results with optical and pneumatic measurements for a wide range of inlet and outlet Mach numbers for optimized hub and tip profile cascades.

1. Introduction

The last stage rotating blade is a key component of each steam turbine, directly contributing to overall efficiency of the thermal cycle. There are many challenges in the development and validation process of last stage blades both in terms of thermodynamic and mechanical design. High tip/hub ratio results in dense hub cascades and rare tip cascades. The proper stator blade design with advanced 3D shaping is highly important because it has significant impact on the relative velocity in the vicinity of the rotating blade. However, the relative Mach numbers exceeding 1 are commonly present in flow field surrounding the rotating blade due to high tangential velocities and even supersonic flow with inlet shock wave can occur, especially in the case of ultra-long full speed (3000 or 3600 RPM) last stage blades [1]. Final mechanical design must fulfill criteria of static strength which determines strict distribution of area for each section along the blade span. The combination of these requirements limits the design space and leads to the demanding process of optimal solution searching.
Analytical methods investigating flow field are an essential part of aerodynamic design process of turbine cascades of last stage blades. Obtaining reliable calculated data can be challenging task both due to very dense hub cascades with low convergence of channel and due to very rare tip cascades with supersonic flow velocities in the channel [2].
The experimental measurements of turbine blade cascades are an indispensable part of validation process of the analytical methods and the final aerodynamic solution. The careful design of the experiment together with a combination of suitable measurement methods is needed to analyze supersonic flow field [3,4]. Optical methods such as interferometry are particularly useful tool for spatial resolved analysis of high-speed aerodynamics investigations of various blade cascades [5].

2. Investigated Blade Cascades

Blade cascades described in the paper represent the tip section and the hub section. Original and innovative designs of the tip section are shown in Figure 1b. Whereas in the case of the original design the profiles are cambered in order to form the divergent interblade channel, profiles of the innovative design are practically flat with only the leading edge on the suction side and the trailing edge on the pressure side contoured.
Hub section blade cascades are shown in Figure 1a. Both were designed for the straight fir tree root dovetail. The main difference lies in the higher outlet metal angle and incidence angle of the original design. This was due to the requirement of low exit loss and straight fir tree root. In the case of the innovative design, the exit flow angle is lower and the incidence angle is zero. These favourable differences were made possible thanks to the redesign of guide vanes.

3. Experimental Setup

The optical measurements of transonic and supersonic flow fields were performed in a high-speed wind tunnel in the Aerodynamic Laboratory of the Institute of Thermomechanics of the Czech Academy of Sciences in Novy Knin. The atmospheric air treated by silica gel drier and filters is accelerated by inlet nozzle and enters the test section displayed in Figure 2. The perforated tailboard and sucked perforated wall prevent shock waves reflecting back to the measured flow field.
A Mach–Zehnder interferometer in an infinite fringe setting was used for capturing of interferograms presented in this paper. This experimental setup is described in detail in [5] and [3]. Static pressure was measured on both sides of the interblade channel during the optical measurement which allows evaluation of the distribution of isentropic Mach number Mis along the suction and pressure side of the measured profile.

4. Numerical Methods

An in-house code developed at the Faculty of Mechanical Engineering, Czech Technical University, Prague, was used for calculation of transonic and supersonic flow fields. The code is based on the solution of the Favre averaged Navier–Stokes equations and k–ω SST turbulence model by implicit finite volume method with AUSMPW+ scheme in high-resolution formulation. The detailed description of the numerical method can be found in [2]. Simulations were done also with the correlation based γ-Reθ transition and turbulence model by [6]; for details see [7].
Ansys Fluent software package (v18, Ansys Inc., Canonsburg, PA, USA) was used as representative commercial code for calculation of the same geometries at similar thermodynamic boundary conditions. The set of density averaged Navier–Stokes equations closed with the k–ω SST turbulence model.
Although both codes are based on similar models and similar numerical methods, they differ in some details including the implementation of boundary conditions and the solution procedure. Our experience show that the ANSYS Fluent has, despite very good overall performance, some difficulties with regimes with M1 ~ 1. Therefore, the in-house code was used for these problematic regimes.
For all calculations 2D single profile geometry with the periodicity boundary condition on the channel boundaries was used. The position of the inlet and outlet plane is far from the cascade compared to the axial chord. In case of the tip section simulations with in-house code, inlet and outlet were positioned in the distance of two chords upstream of the cascade and one chord downstream of the cascade, respectively. In the simulations with Ansys Fluent for both tip sections and root sections, inlet and outlet were positioned in the distance of one chord from the blade cascade. A non-reflecting boundary condition was applied at outlet plane.

5. Results and Discussion

Two very high values of aerodynamic loading representing two operation points of the innovative tip cascade of ultra-long last stage blade can be seen in Figure 3 and Figure 4. In both supersonic regimes the tip cascade exhibits impressive aerodynamic performance with only very small area where the aerodynamic force acts in the opposite direction, decreasing the overall torque of the last stage blade.
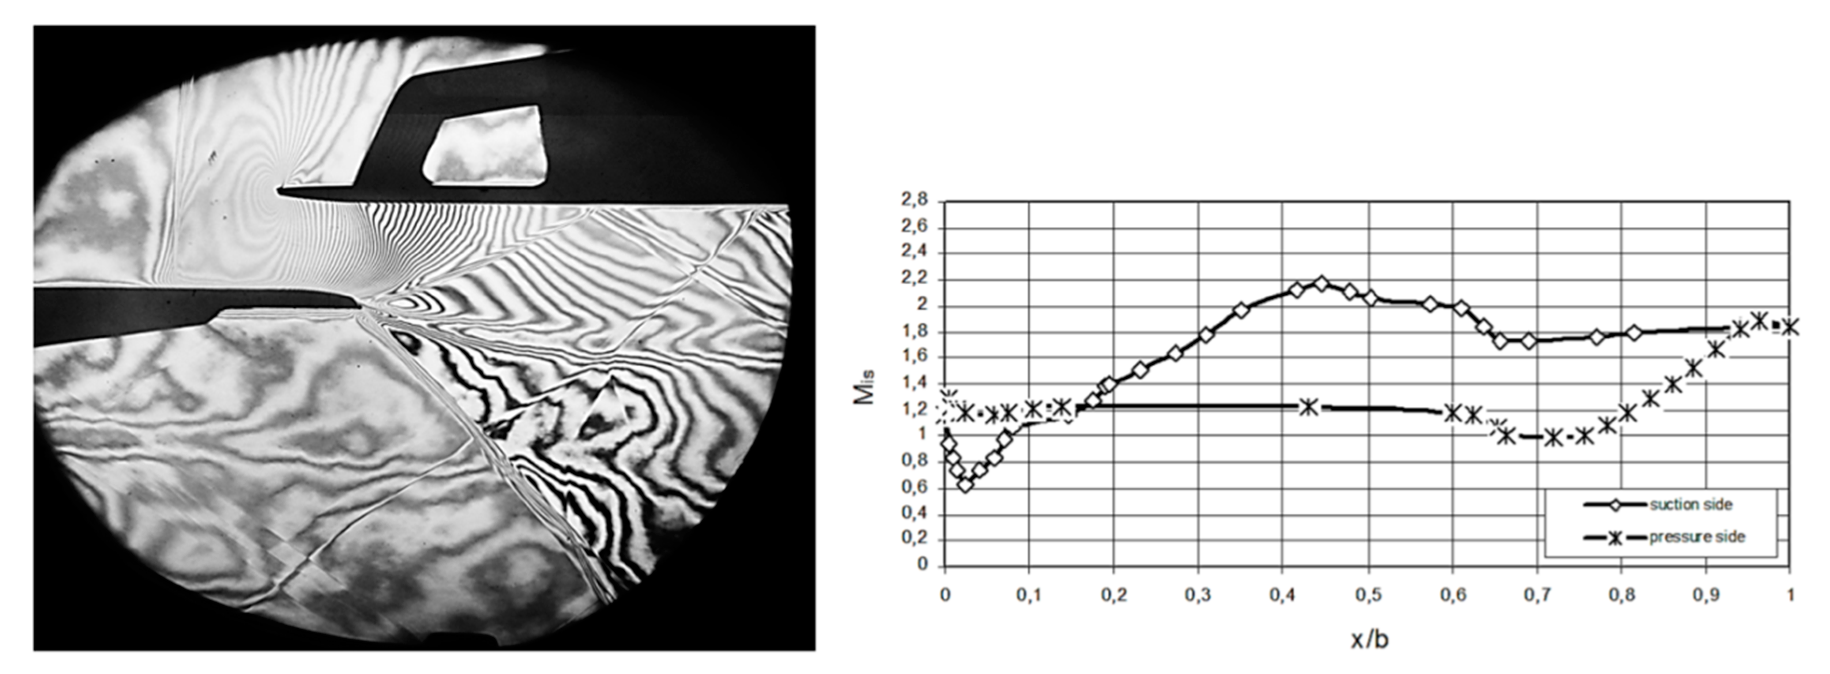
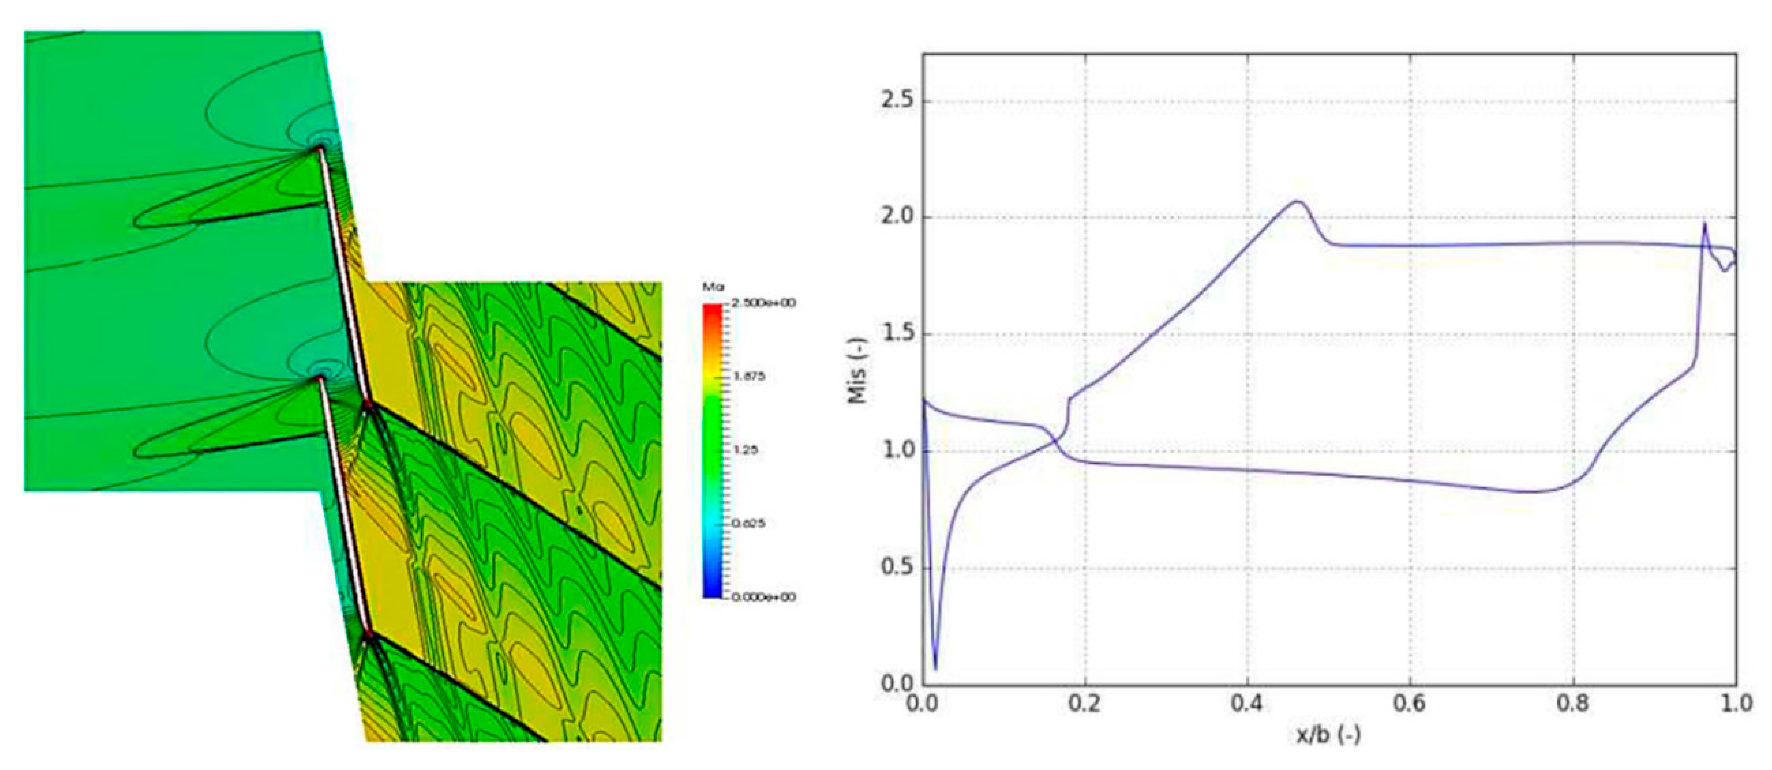
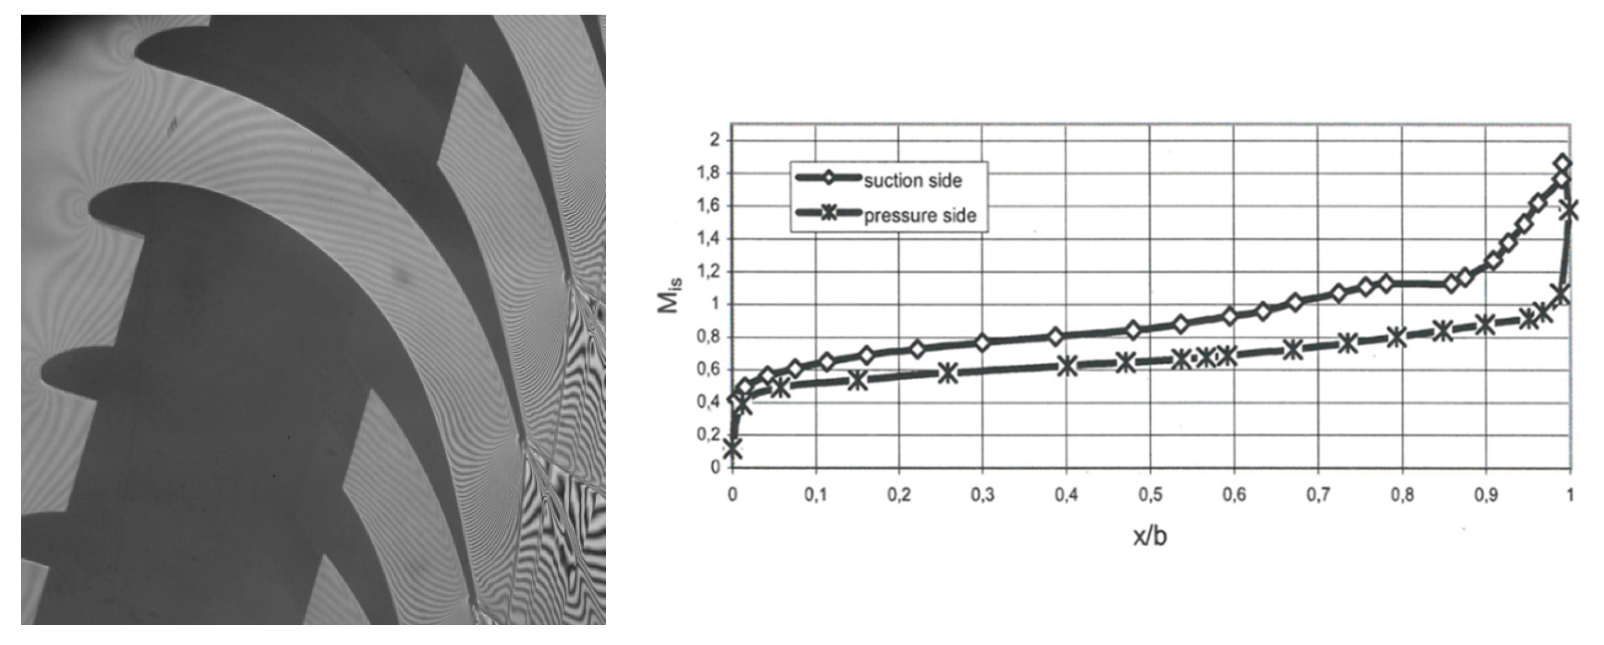
In Figure 3 the perpendicular inlet shock wave can be seen as a result of supersonic inlet Mach number. The inlet shock wave interacts with the pressure side of the neighboring profile which leads to a decrease of Mis near the 70% of axial chord as can be seen from Mach number distribution in Figure 3. The complicated flow structure can be seen at cascade exit including the inner and outer branch of the exit shock wave together with wake. Furthermore, the parasitic shock wave reflected into measured area from the exit flow boundary is present resulting in artificial decrease of Mis in the vicinity of the suction side of profile at 60% of axial chord.
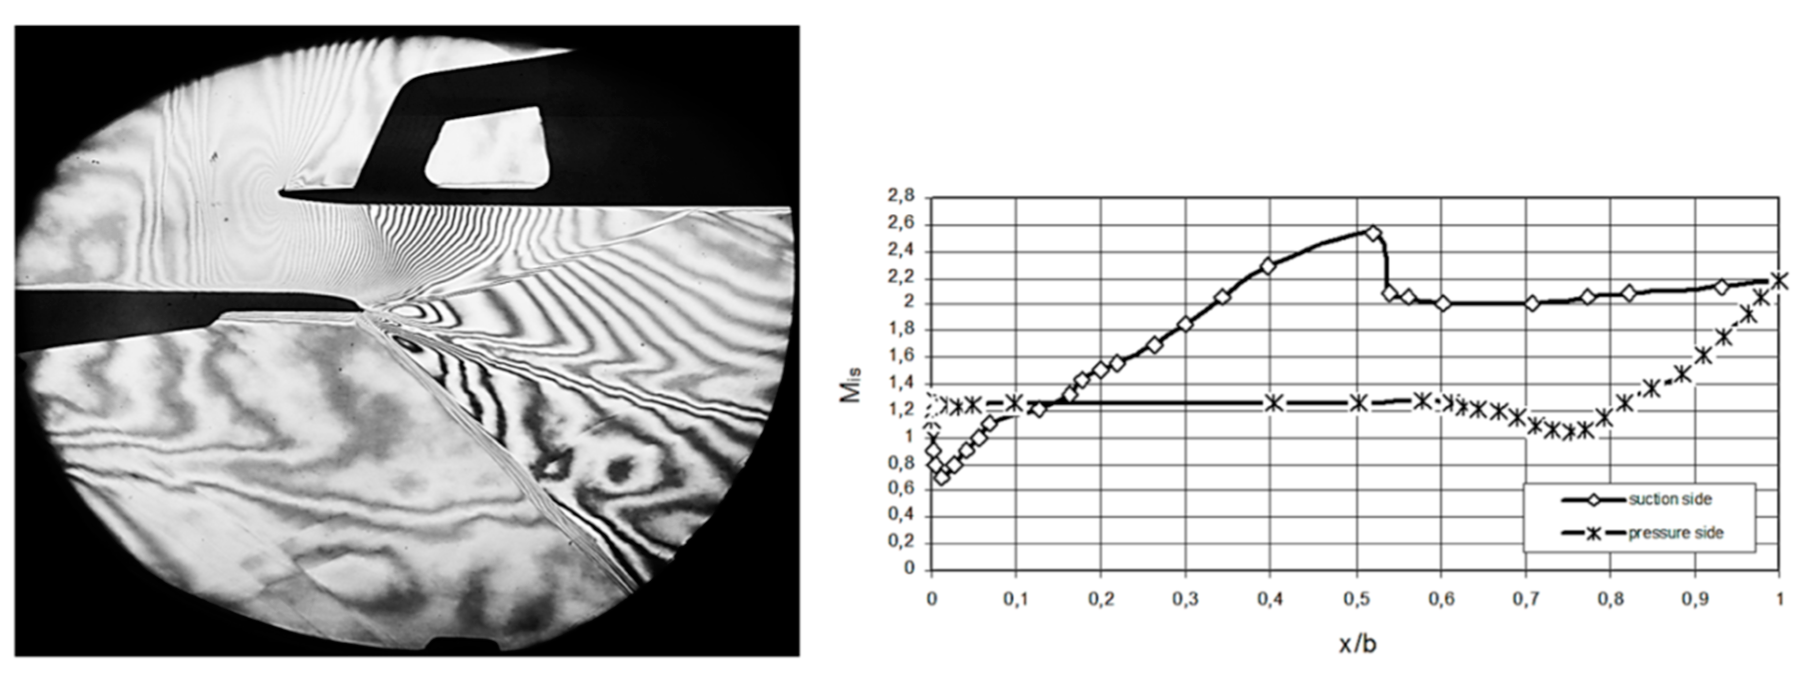
In Figure 4 the similar behavior of the perpendicular inlet shock wave together with interaction at pressure side of the corresponding profile can be seen. However, the differences appear behind the trailing edge of the profile with variation in angles of the inner and outer branch of the exit shock wave and wake indicating higher outlet velocity. Moreover, the parasitic shock wave is not present which results in a less complicated flow field better reflecting the real cascade performance.
In numerical methods there are serious complications for supersonic inlet due to the unique incidence rule (see [4]) which states that the value of the incidence angle corresponding to a particular inlet Mach number is dependent on the cascade geometry only. The inlet conditions and the overall flow field vary extensively with each 0.1° change of inlet incidence angle.
The regime closest to the measured ones was computed using in-house code with γ-Reθ transition and turbulence model and the result is shown in Figure 5. Inlet Mach number is relatively close to 1.2 and the isentropic exit Mach number is just between that of interferograms in Figure 3 and Figure 4. The flow structure is well predicted with the normal shock standing in front of the leading edge. Interaction of the inner branch of exit shock wave with the suction side boundary layer resulting in the local flow separation is in agreement with the experiments. The distribution of Mis along profiles also corresponds well to the experimental results. The difference in the level of Mis on the suction side behind x/b ~ 0.55 can be partially attributed to difficulties with evaluation of interferograms and presence of aperiodic flow phenomena.
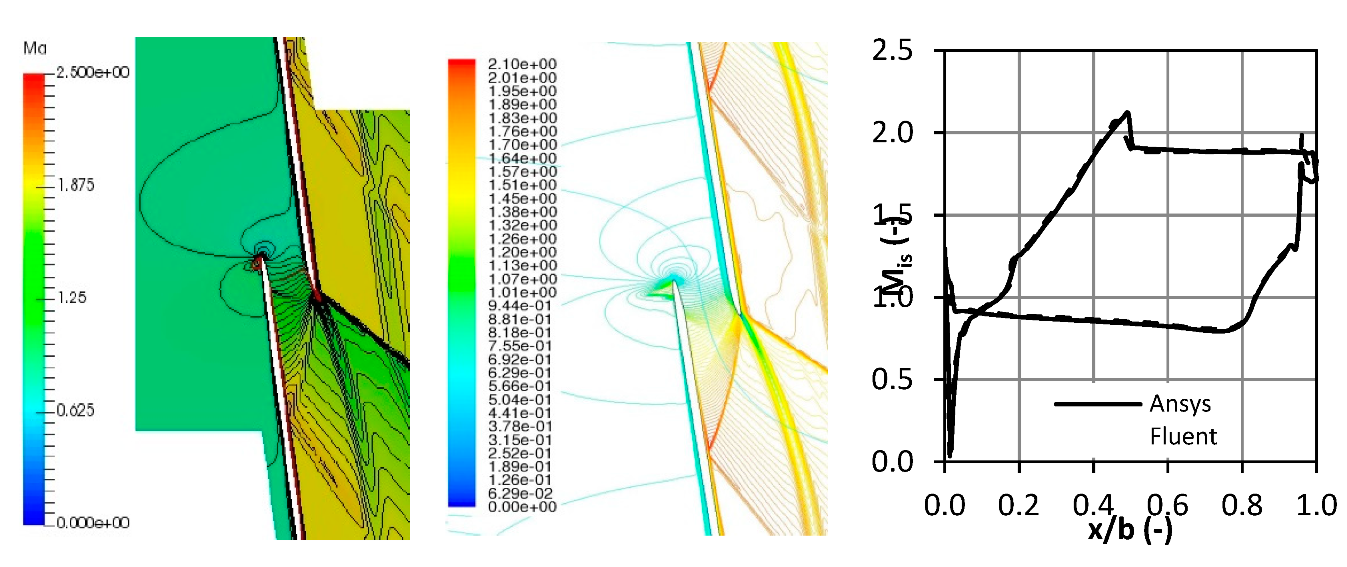
Operation point with the slightly supersonic inlet Mach number M1 = 1.03 was calculated by in-house code as can be seen in Figure 6. There is no normal inlet shock wave in front of the leading edge of profile. Instead, the supersonic area ending by shock wave at 20% of axial chord is present near the leading edge at the pressure side of the profile. Mis distribution is in the vicinity of suction side with a drop between 40% and 50% which is in good agreement with experimental results. This regime corresponds to Mis between the two measured aerodynamic loadings.
The results of commercial code calculation are shown in Figure 7 together with results of the in-house code. In this case inlet Mach number is even smaller, M1 = 0.88, since for higher inlet Mach numbers, commercial code predicted non-physical phenomena at inlet of the blade cascade. Agreement between the two codes in this regime is good. Both predicted a very small supersonic region terminated by a normal shock wave on the pressure side at the leading edge. The calculated exit flow field corresponds well to the results of experiments and calculations with in-house codes presented above.
A useful criterion for comparison of aerodynamic behavior of two different profiles of a rotating blade at the same thermodynamic boundary conditions (such as space and time distributions of pressure, enthalpy and velocity vector of working fluid) is the ratio of tangential and axial component of force affecting each profile. As the principle of the turbine is conversion of fluid thermodynamic free energy to torque of the rotor, the tangential component of the force can be seen as beneficial (contributing to torque), contrary to the axial component related with energy leaving the cascade without doing work. This means that profile with higher force ratio at the same thermodynamic conditions is more efficient in the energy to torque conversion.
The comparison of force ratio for original and innovative tip profile depending on flow inlet angle at two different aerodynamic loadings is shown in Figure 8. The original profile was described in detail by [4]. The innovative tip profile exhibits a similar evolution of the force ratio for both aerodynamic loadings while the original tip profile shows significantly worse force ratio for low aerodynamic loading.
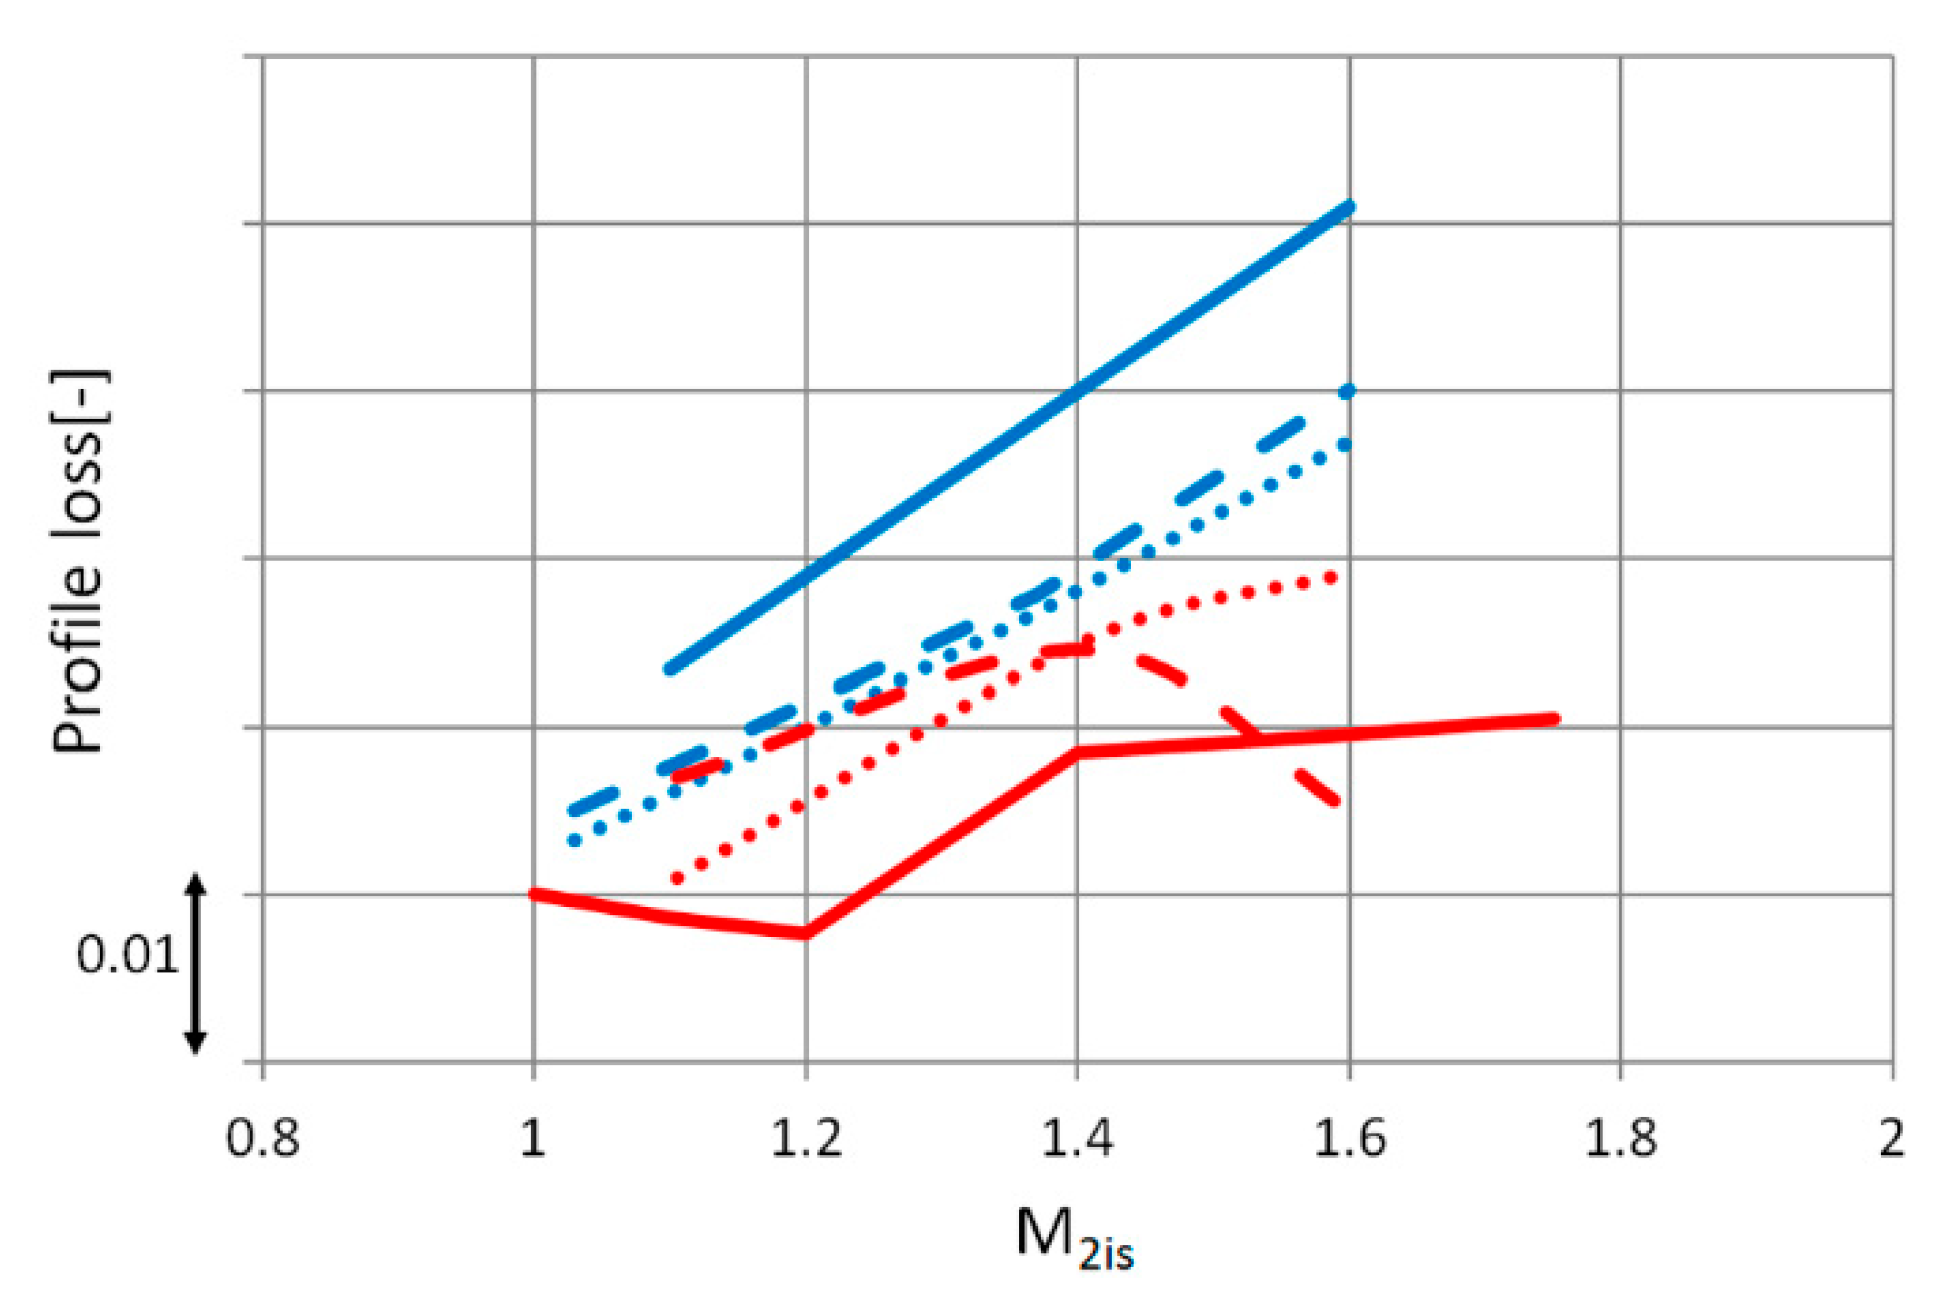
The full potential of innovative tip profile has been demonstrated by measurement in a high-speed tunnel. Comparison of measured profile loss for original and innovative tip profile for two values 1.0 and 1.2 of inlet Mach number is shown in Figure 9. There can be seen a similar low value of profile losses in a wide range of outlet Mach number for both values 1.0 and 1.2 of inlet Mach number for innovative design. Conversely, the profile losses of original tip profile rise significantly both for higher inlet Mach number and lower outlet Mach number. From these results is apparent that the innovative tip cascade provides strong benefits in a large operating range.
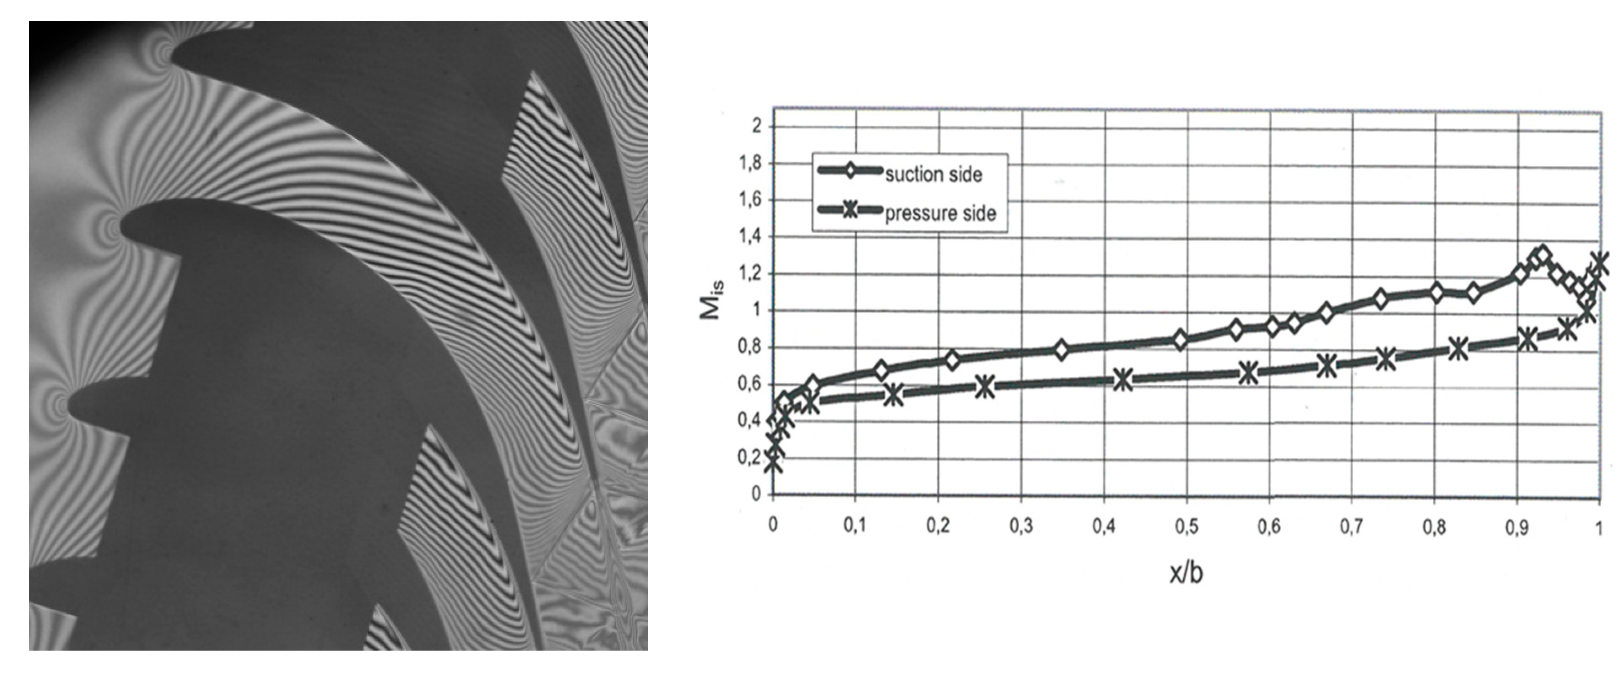
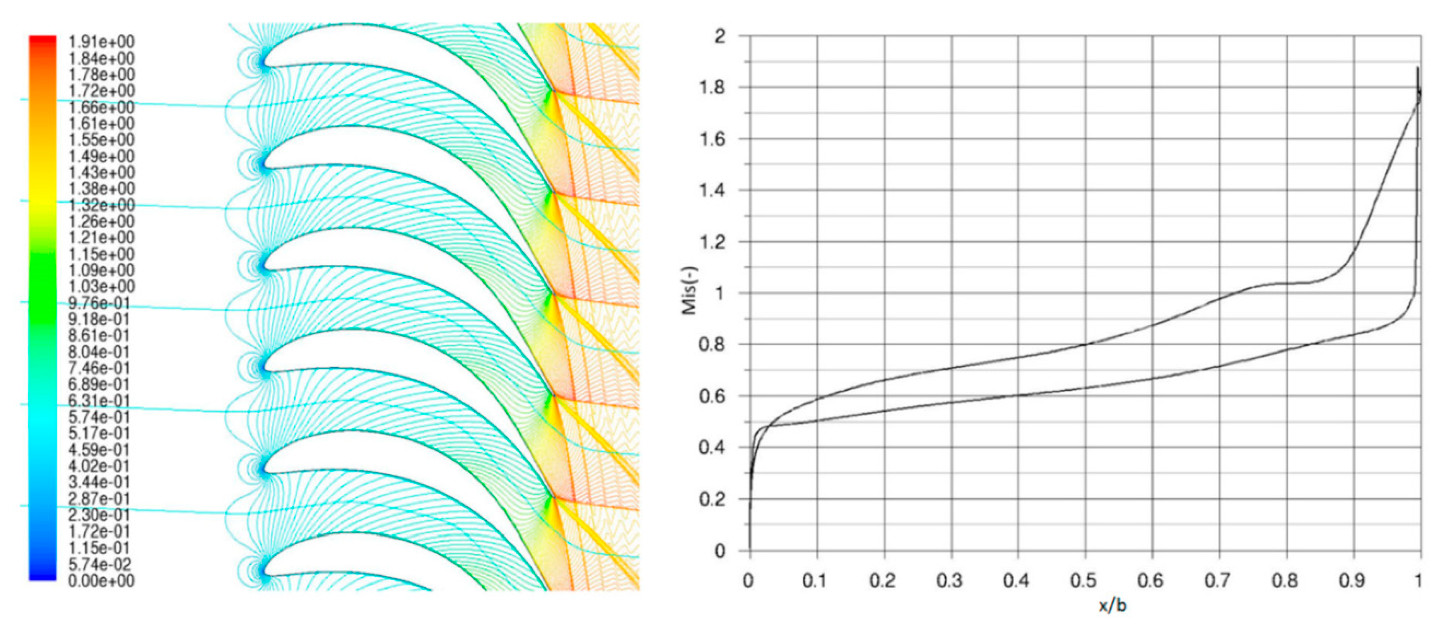
The flow field in the vicinity of the hub profile differs significantly from the tip cascade flow fields discussed above. The dense channel with low convergence results in slow steady acceleration of the flow as can be seen in Figure 10 and Figure 11. The inner branch of the exit shock wave together with wake and outer branch of the shock wave are visible both in the interferogram and in the computed Mach number isolines. The inner branch of the shock wave hits the suction side of neighboring profile near 90% of axial chord and results in a decrease of the Mach number in the vicinity of suction side trailing edge.
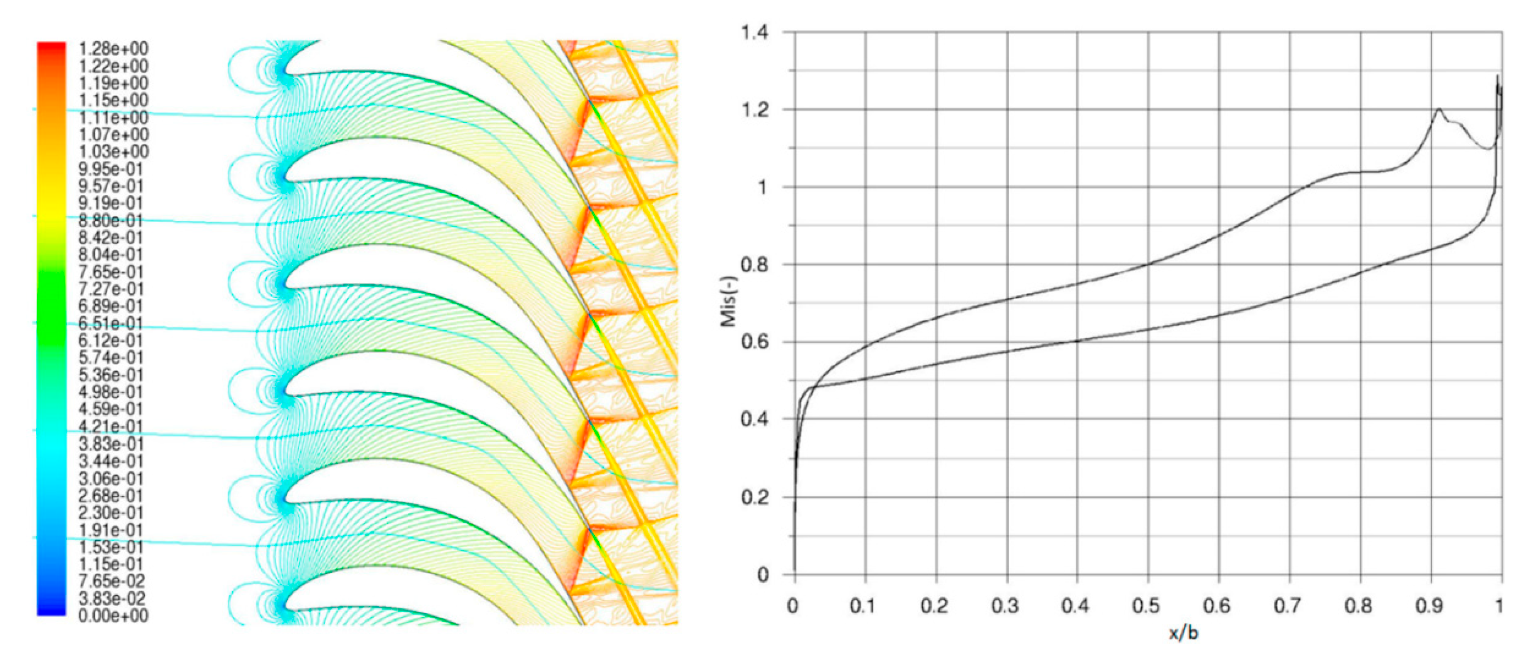
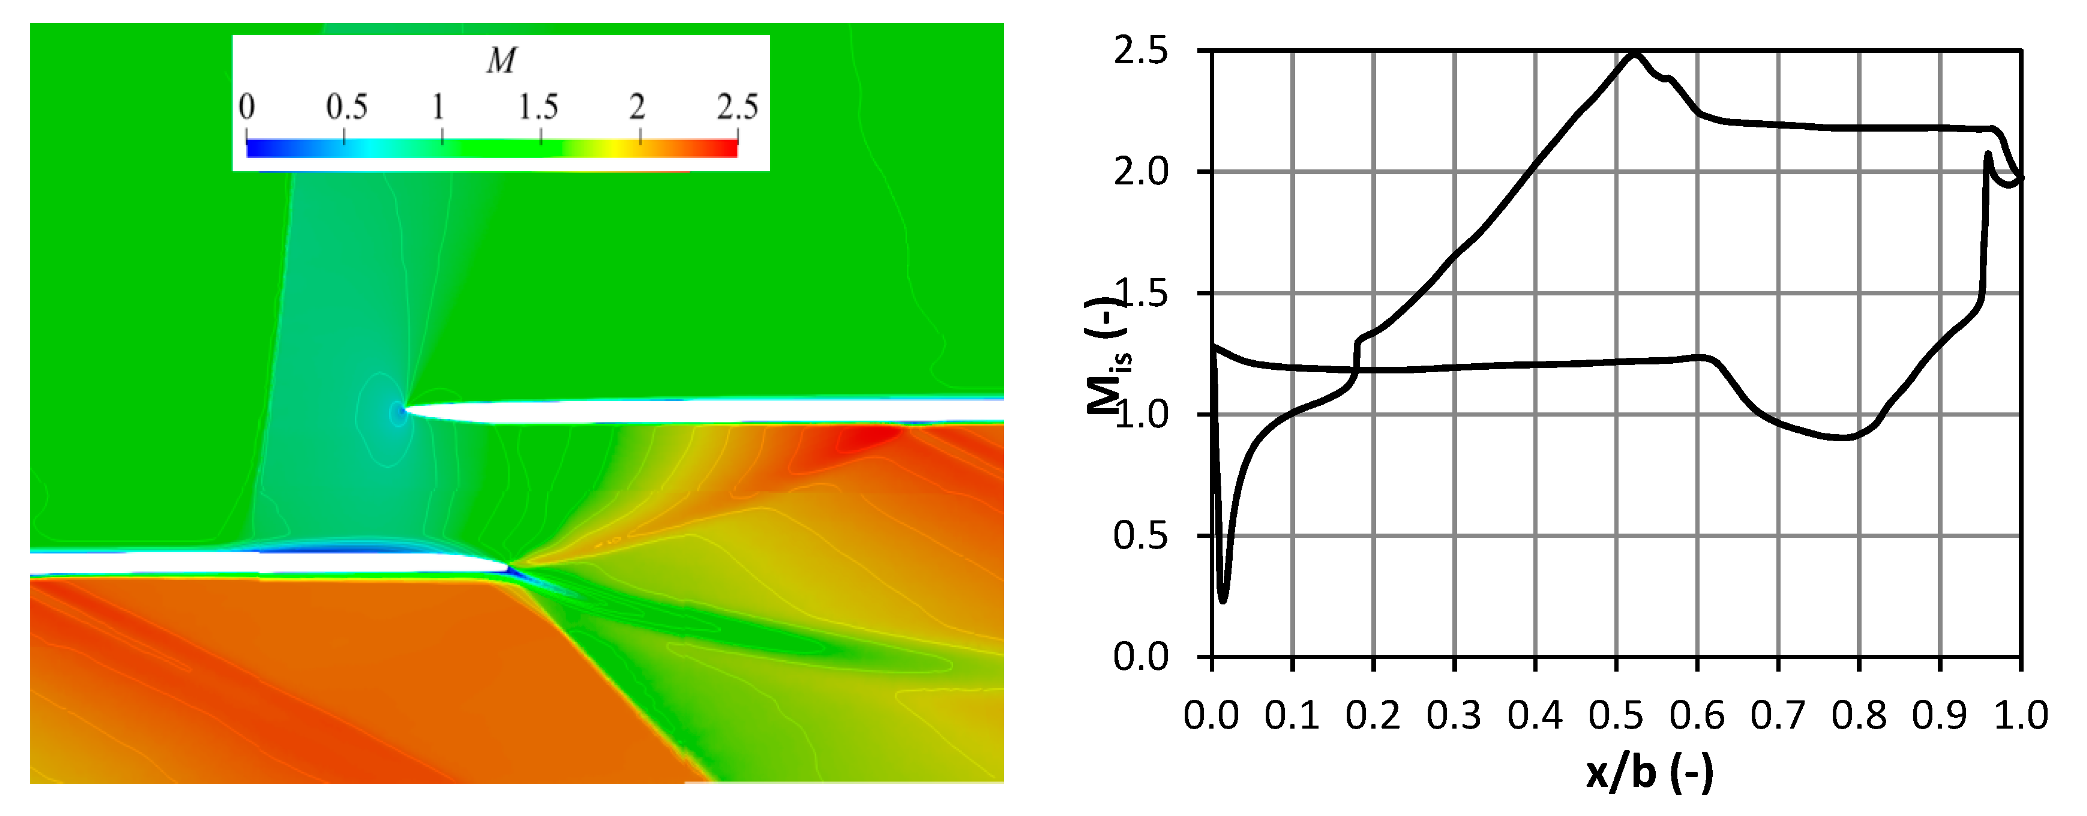
In Figure 12 and Figure 13 the different operating point with significantly higher aerodynamic loading and thus with higher M2is is present. The flow acceleration is slow and steady in the main portion of the channel in agreement with the previous case. The main difference is near the last 15% of axial chord where the rapid acceleration takes place with peak value up to Mis = 1.8. The sharper angle of inner and outer branch of the shock wave also confirms the higher outlet Mach number. The inner branch of the exit shock misses the suction side of neighbor profile indicating the operation beyond the limit load condition.
There can be seen high conformity in experimental and calculated results for both operating regimes of hub cascade in terms of flow field pattern and isentropic Mach number distribution. On the other hand, significant discrepancy can be seen for integral profile loss evaluation.
The profile loss function on aerodynamic loading represented by Mis can be seen in Figure 14. For the original hub profile (presented in [3]) the calculated values are almost the same for both in-house and commercial code. Furthermore, the trend of increasing of profile loss with higher aerodynamic loading of the hub cascade can be seen in experimental results as well, although the absolute value of the profile losses is approximately 1% higher.
On the other hand, for the presented innovative hub profile the profile loss evolution is more complicated. The calculated results for in-house and commercial code agree with each other up to Mis = 1.4. For higher aerodynamic loading the in-house code predicts the decrease in the profile losses. The non-linear dependency is confirmed with experimental data as well. The difference in profile losses is again around 1% but with lower profile losses for the experimental data.
The significantly higher experimental profile losses by 3% can be associated with more complicated structure of flow field for original hub cascade leading to higher energy dissipation as is described in more detail by [3]. This important information confirms the necessity of experimental verification of calculated results especially for complicated transonic and supersonic flow fields in the vicinity last stage blade cascades.

6. Conclusions

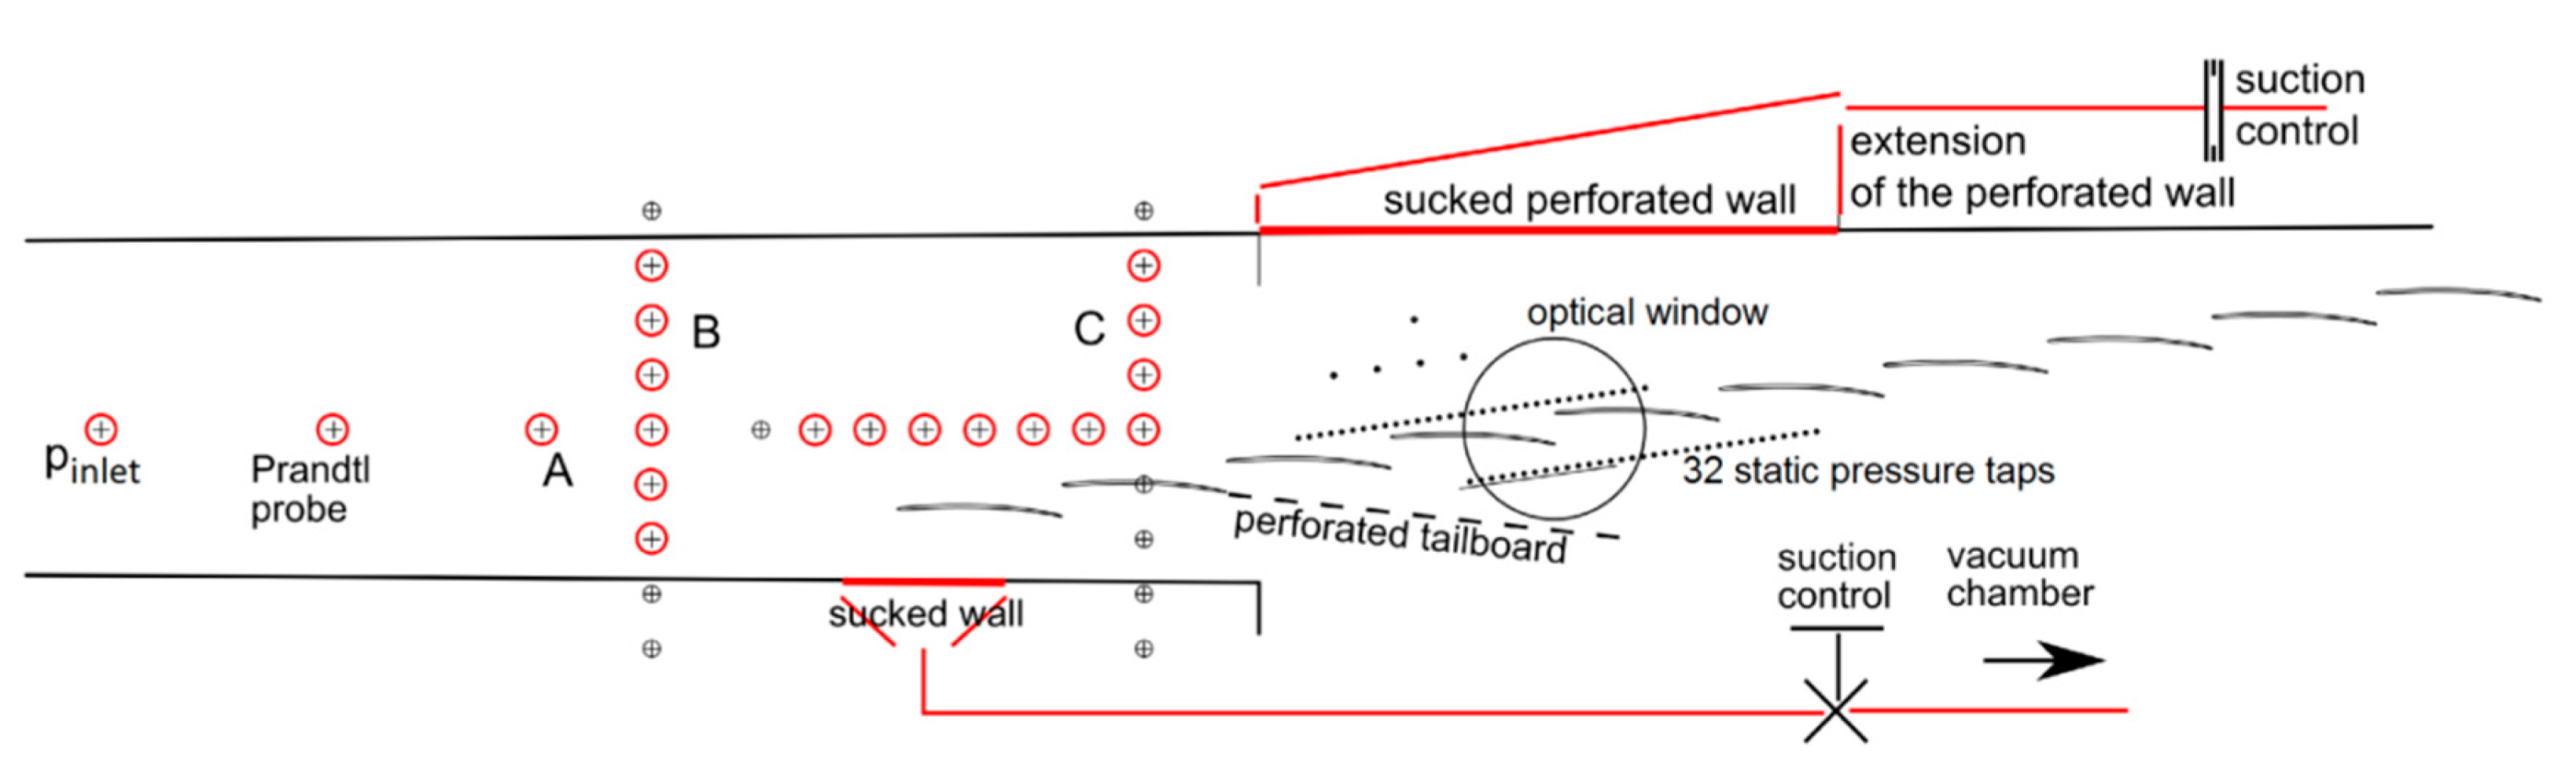
Advanced hub and tip profiles of ultra-long last stage blade were analyzed by both experimental and numerical methods. The optical measurements of transonic and supersonic flow fields were performed in high-speed wind tunnel in the Aerodynamic Laboratory of the Institute of Thermomechanics of the Czech Academy of Sciences. Commercial and in-house software of CTU Prague were used for calculating the corresponding flow fields.
For the tip cascade, the perpendicular inlet shock wave was observed as a result of supersonic inlet Mach number. This phenomenon could not be reproduced by tested numerical codes. The flow structure at cascade exit includes the inner and outer branch of the exit shock wave together with wake. These structures were well reproduced by numerical calculations including position of interaction of the inner branch of the exit shock with suction side of neighboring profile.
The dense hub channel with low convergence results in slow steady acceleration of the flow. The high conformity in experimental and calculated results in terms of flow field pattern and isentropic Mach number distribution was in contrast with significant discrepancy of integral profile loss evaluation.
Both hub and tip cascades were compared with the similar profiles presented in the past. The overall aerodynamic performance was significantly improved in both cases.
The comparison of experimental and numerical results shows limits of both methods. In particular, in the experiment, the parasitic shock wave reflected into measured area from the test section wall resulting in artificial decrease of isentropic Mach number near the suction side of the profile. On the other hand, the numerical methods had issues with supersonic inlet and integral profile loss evaluation. The in-house code exhibits lower overall discrepancy of loss evaluation for the innovative hub cascade.

Author Contributions

O.N.: publication, data management, vane and blade design; M.B.: new vane and rotor blade design, loss coefficient calculation, stage design; M.L.: conducting of optical measurements and its evaluation; analysis of results; J.F. (Jaroslav Fort): CFD team management, analysis of CFD results; B.R.: CFD calculations with commercional code ANSYS FLUENT, results evaluation; J.S.: original vane and blade design, new vane design, stage design; D.S.: conducting of pneumatic traverses and loss evaluation; analysis of results; J.F. (Jiri Furst): development of the in-house code, implementation of turbulence models; J.H.: analysis of CFD results; V.H.: CFD simulations including pre- and post-processing; J.P.: proposal of turbulence models for in-house codes; Z.S.: 1D throughflow calculations and design.

Funding

The authors would like to express their thanks to the Technology Agency of the Czech Republic, which supported this research under grant No. TA02020057. The APC was funded by Euroturbo.

Conflicts of Interest

The authors declare no conflict of interest.

References

  1. Senoo, S.; Ono, H. Development of Design Method for Supersonic Turbine Aerofoils near the Tip of Long Blades in Steam Turbines, Part 2: Configuration Details and Validation. In Proceedings of the ASME Turbo Expo 2013, GT2013-94039, San Antonio, TX, USA, 3–7 June 2013. [Google Scholar]
  2. Bobcik, M.; Fort, J.; Furst, J.; Halama, J.; Hric, V.; Louda, P.; Luxa, M.; Rudas, B.; Synac, J.; Simurda, D. Investigation of Transonic and Supersonic Flow in Rotor Tip Section of Last LP Steam Turbine Cascade under Different Turbulence Level. In Proceedings of the 12th European Conference on Turbomachinery, Stockholm, Sweden, 3–7 April 2017. [Google Scholar]
  3. Hala, J.; Luxa, M.; Simurda, D.; Bobcik, M.; Novak, O.; Synac, J.; Rudas, B. Optimization of Root Section for Ultra Long Steam Turbine Rotor Blade. In Proceedings of the 13th International Symposium on Experimental Computational Aerothermodynamics of Internal Flows, Okinawa, Japan, 7–11 May 2017. [Google Scholar]
  4. Luxa, M.; Simurda, D.; Fort, J.; Furst, P.; Safarik, P.; Synac, J.; Rudas, B. Aerodynamic Investigation of the Tip Section for Titanium Blade 54”. In Proceedings of the 11th European Conference on Turbomachinery, Madrid, Spain, 23–27 March 2015. [Google Scholar]
  5. Safarik, P.; Luxa, M. Using Optical Methods in High-Speed Aerodynamic Research. In Proceedings of the Measurement Techniques in Turbomachinery XX, Firenze, Italy, 21–22 September 2000; pp. 1–7. [Google Scholar]
  6. Langtry, R.B.; Menter, F.R. Correlation-Based Transition Modeling for Unstructured Parallelized Computational Fluid Dynamics Codes. AIAA J. 2000, 47, 2894–2906. [Google Scholar] [CrossRef]
  7. Musil, J.; Příhoda, J.; Fürst, J. Simulation of Supersonic Flow through the Tip-Section Turbine Blade Cascade with a Flat Profile. In Problems of Fluid Mechanics; Šimurda, D., Bodnár, T., Eds.; Topical: Prague, Czech Republic, 2019; pp. 169–174. [Google Scholar]
Figure 1. Schematics of blade cascades—original designs (a) and innovative designs (b).
Ijtpp 04 00033 g001
Figure 2. Test section for an investigation of the flow in a prismatic profile cascade with a small flow turning angle and supersonic inlet velocity.
Ijtpp 04 00033 g002
Figure 3. Interferogram and isentropic Mach number distribution along the innovative tip profile for the flow conditions: M1 = 1.19, Mis = 1.70.
Ijtpp 04 00033 g003
Figure 4. Interferogram and isentropic Mach number distribution along the innovative tip profile for the flow conditions: M1 = 1.21, Mis = 1.91.
Ijtpp 04 00033 g004
Figure 5. Mach number isolines and isentropic Mach number distribution along the innovative tip profile calculated by in-house code (g-ReQ model) for the flow conditions: M1 = 1.135, Mis = 1.796.
Ijtpp 04 00033 g005
Figure 6. Mach number isolines and isentropic Mach number distribution along the innovative tip profile calculated by in-house code for the flow conditions: M1 = 1.03, Mis = 1.79.
Ijtpp 04 00033 g006
Figure 7. Mach number isolines and isentropic Mach number distribution along the innovative tip profile calculated by commercial and in-house code for the flow conditions: M1 = 0.87, Mis = 1.76.
Ijtpp 04 00033 g007
Figure 8. Comparison of force ratio of tangential and axial component of force for original tip (blue lines) and innovative tip (red lines) at low (solid lines) and high (dashed lines) aerodynamic loading.
Ijtpp 04 00033 g008
Figure 9. Comparison of measured profile loss for original tip (blue lines) and innovative tip (red lines) for M1 = 1.0 (solid lines) and M1 = 1.2 (dashed lines).
Ijtpp 04 00033 g009
Figure 10. Interferogram and isentropic Mach number distribution along the hub innovative profile for the flow conditions: nominal inlet angle, Mis = 1.18.
Ijtpp 04 00033 g010
Figure 11. Mach number isolines and isentropic Mach number distribution along the hub innovative profile calculated by commercial code for the flow conditions: nominal inlet angle, Mis = 1.08.
Ijtpp 04 00033 g011
Figure 12. Interferogram and isentropic Mach number distribution along the hub innovative profile for the flow conditions: nominal inlet angle, Mis = 1.597.
Ijtpp 04 00033 g012
Figure 13. Mach number isolines and isentropic Mach number distribution along the hub innovative profile calculated by commercial code for the flow conditions: nominal inlet angle, Mis = 1.64.
Ijtpp 04 00033 g013
Figure 14. Comparison of measured profile loss for original hub (blue lines) and innovative hub (red lines) for experiment (solid lines), in-house code (dashed lines) and commercial code (dotted lines).
Ijtpp 04 00033 g014

