Article

Effect of Geometry Variability on Transonic Fan Blade Untwist

1
Rolls-Royce Vibration UTC, Imperial College London, London SW7 2AZ, UK
2
Rolls-Royce plc, Derby DE24 9HY, UK
*
Author to whom correspondence should be addressed.
This paper is an extended version of our paper published in Proceedings of the European Turbomachinery Conference ETC13, Lausanne, Switzerland, 8–12 April 2019, Paper No. 224.
Current address: Imperial College London, South Kensington, London SW7 2AZ, UK.
Int. J. Turbomach. Propuls. Power 2019, 4(3), 24; https://doi.org/10.3390/ijtpp4030024
Submission received: 19 June 2019 / Revised: 29 July 2019 / Accepted: 31 July 2019 / Published: 5 August 2019

Abstract

:
Due to manufacturing tolerance and deterioration during operation, fan blades in the same engine exhibit geometric variability. The absence of symmetry will inevitably exacerbate and contribute to the complexities of running geometry prediction as the blade variability is bound to be amplified by aerodynamic and centrifugal loading. In this study, we aim to address the fan blade untwist related phenomenon known as alternate passage divergence (APD). As the name suggests, APD manifests as alternating passage geometry (and hence alternating tip stagger pattern) when the fan stage is operating close to/at peak efficiency condition. APD can introduce adverse influence on fan performance, aeroacoustics behaviour, and high cycle fatigue characteristics of the blade. The main objective of the study is to identify the parameters contributing to the APD phenomenon. In this study, the APD behaviours of two transonic fan blade designs are compared.

1. Introduction

In order to meet increasingly strict emission regulations in civil aviation, aeroengine manufacturers are designing fuel-efficient, high bypass ratio engines with light-weight and highly-loaded fan blades. These blades are flexible and deform under centrifugal and gas loads during operation, which results in an ‘untwist’ of the original ‘cold’ geometry. Prediction of this ‘running’ shape is done routinely in industry [1] using coupled aeroelastic computations. However, individual fan blades in an assembly may have different cold geometries as a direct result of manufacturing tolerances [2] and operational wear. As noted by Wilson et al. [3], such geometry variability can be amplified by aerodynamic and centrifugal forces during operation, introducing complex effects in fan blade untwist behaviour. In contrast to the case where all blades untwist by the same extent in a nominal assembly, a single mis-staggered blade can initiate an alternating tip stagger pattern as illustrated in Figure 1. This phenomenon is termed alternate passage divergence (APD).
The APD phenomenon may significantly influence noise, aerodynamic efficiency, and aeromechanical stability. For example, blade-to-blade stagger variability is known to influence multiple pure tone (MPT)/‘Buzz–Saw’ noise [4,5]. However, most of the noise studies considered only blade-to-blade stagger variations created directly by manufacturing tolerances [5,6] which are significantly smaller than the stagger variability found during APD. Simultaneously, as demonstrated in a previous study [7], APD can lead to significant fan efficiency deterioration. APD also adds additional complexity to aeromechanical stability. Stagger variations are known to affect fan flutter [8]. Moreover, it is possible that APD itself triggers blade vibration as, under certain conditions, equilibrium between the air flow and blade geometry cannot be established [3].
The above examples indicate that APD may have profound impact on fan aerodynamics, aeroacoustics, and aeromechanics. This study aims to deliver some insight into APD mechanisms and the parameters driving it by investigating the APD behaviour of two research fans designed for long-haul civil airframes. As demonstrated previously [7], a randomly mis-staggered assembly can exhibit APD behaviour. In this study, the geometrical complexity is confined to one mis-staggered blade.
This paper is structured as follows. The test geometries and computational approach used for this study is first presented. Secondly, the untwist behaviour of a perfectly tuned fan assembly and the underlying mechanism for APD are discussed in general terms. The APD behaviours of the two fans are then compared across several speed lines and reasons for differences in behaviour are explored in detail. Lastly, the correlation between mistuning and APD is explored.

2. Test Cases and Computational Approach

2.1. Test Cases

In this study, APD behaviour is intentionally introduced onto two research fans, referred to as fan 1 and fan 2. Both fans are designed for long-haul commercial airliners. Key parameters are tabulated in Table 1. Fan 2 is the same fan used in the study by Wilson et al. [3].
All the analyses are performed at the sea-level-static (SLS) conditions. In contrast to the conditions at cruise altitude, the SLS condition has considerably higher air density and ambient pressure. As a result, the fan blades are subject to greater pressure untwist which amplifies the blade variability to a greater extent than at cruise altitude. Therefore, all the computations are performed at this condition.

2.2. Aeroelastic Solver

The computations for this study are performed using the in-house aeroelastic solver AU3D (developed by Rolls-Royce in collaboration with Imperial College London), which has been validated for numerous fans and compressors [8,9,10,11].
The underlying flow solver is a 3D time-accurate Reynolds-averaged Navier–Stokes (RANS) solver [12]. For this study, the one-equation Spalart–Allmaras turbulence model [13] is used to close the equation. The parameters in the model have been adjusted for high speed fan blades to attain good agreement up to the stability limit [14]. To be more specific, the constants in the turbulence models are tuned to achieve agreement with experimental data in terms of pressure ratio and overall radial distribution. The parameters are held constant in all studies.
The aeroelastic analysis is performed in a partially coupled fashion [9,15] in which fluid and structural domain are solved alternately with data exchanged at the fluid structure boundary at each time step. The underlying assumption of this aeroelastic model is that the structural motion could be represented by linear superposition of a few fixed modes. As the mass ratio is high, it is generally accepted that the mode shapes are unaffected by aerodynamics forces [16] and this assumption is valid. Mode shapes for aeroelastic analysis are obtained from a finite element (FE) solver and are interpolated onto the mesh for the fluid domain.

2.3. APD Computations

In order to obtain the APD geometry, time-accurate partially coupled computations are performed. The computations are started from the running geometry and blade-to-blade variability is introduced by mis-staggering a single blade. The mis-stagger was applied linearly from zero at the hub to 0.5 ° at the tip.
The aeroelastic computation was performed with the first three blade modes, shown in Figure 2. It was previously shown that these first few modes were responsible for the bulk of untwist behaviour [3] and that the contributions of higher modes are negligible. The first mode alone, the first flapwise bending mode in this case, accounts for 86% of the blade tip section untwist. The single blade mode shapes shown in Figure 2 were expanded to the full annulus. It was assumed that there is no mechanical coupling between blades via the disk which is an accurate assumption for the fans considered in this study as the disk is exceedingly stiff. During the computation, the aerodynamic loading on the mis-staggered blade deformed the mis-staggered blade and its neighbours, creating the APD pattern.
It was found that Fan 1 does not exhibit the same APD behaviour as that of Fan 2 at its nominal stiffness [7]. To introduce APD behaviour onto Fan 1, its stiffness is reduced.

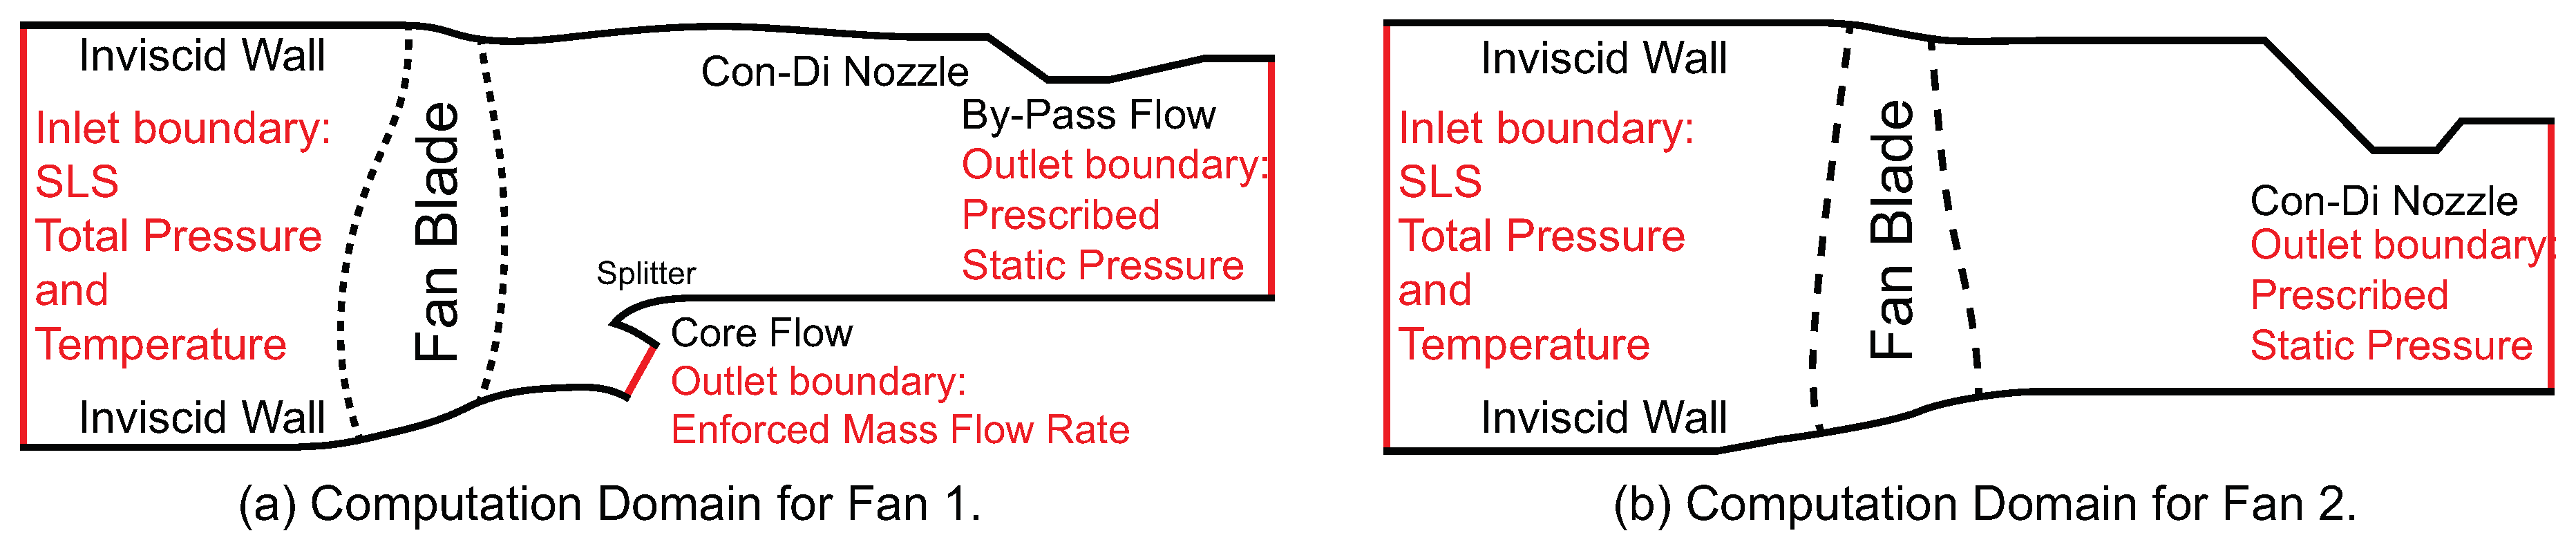
2.4. Computational Domain
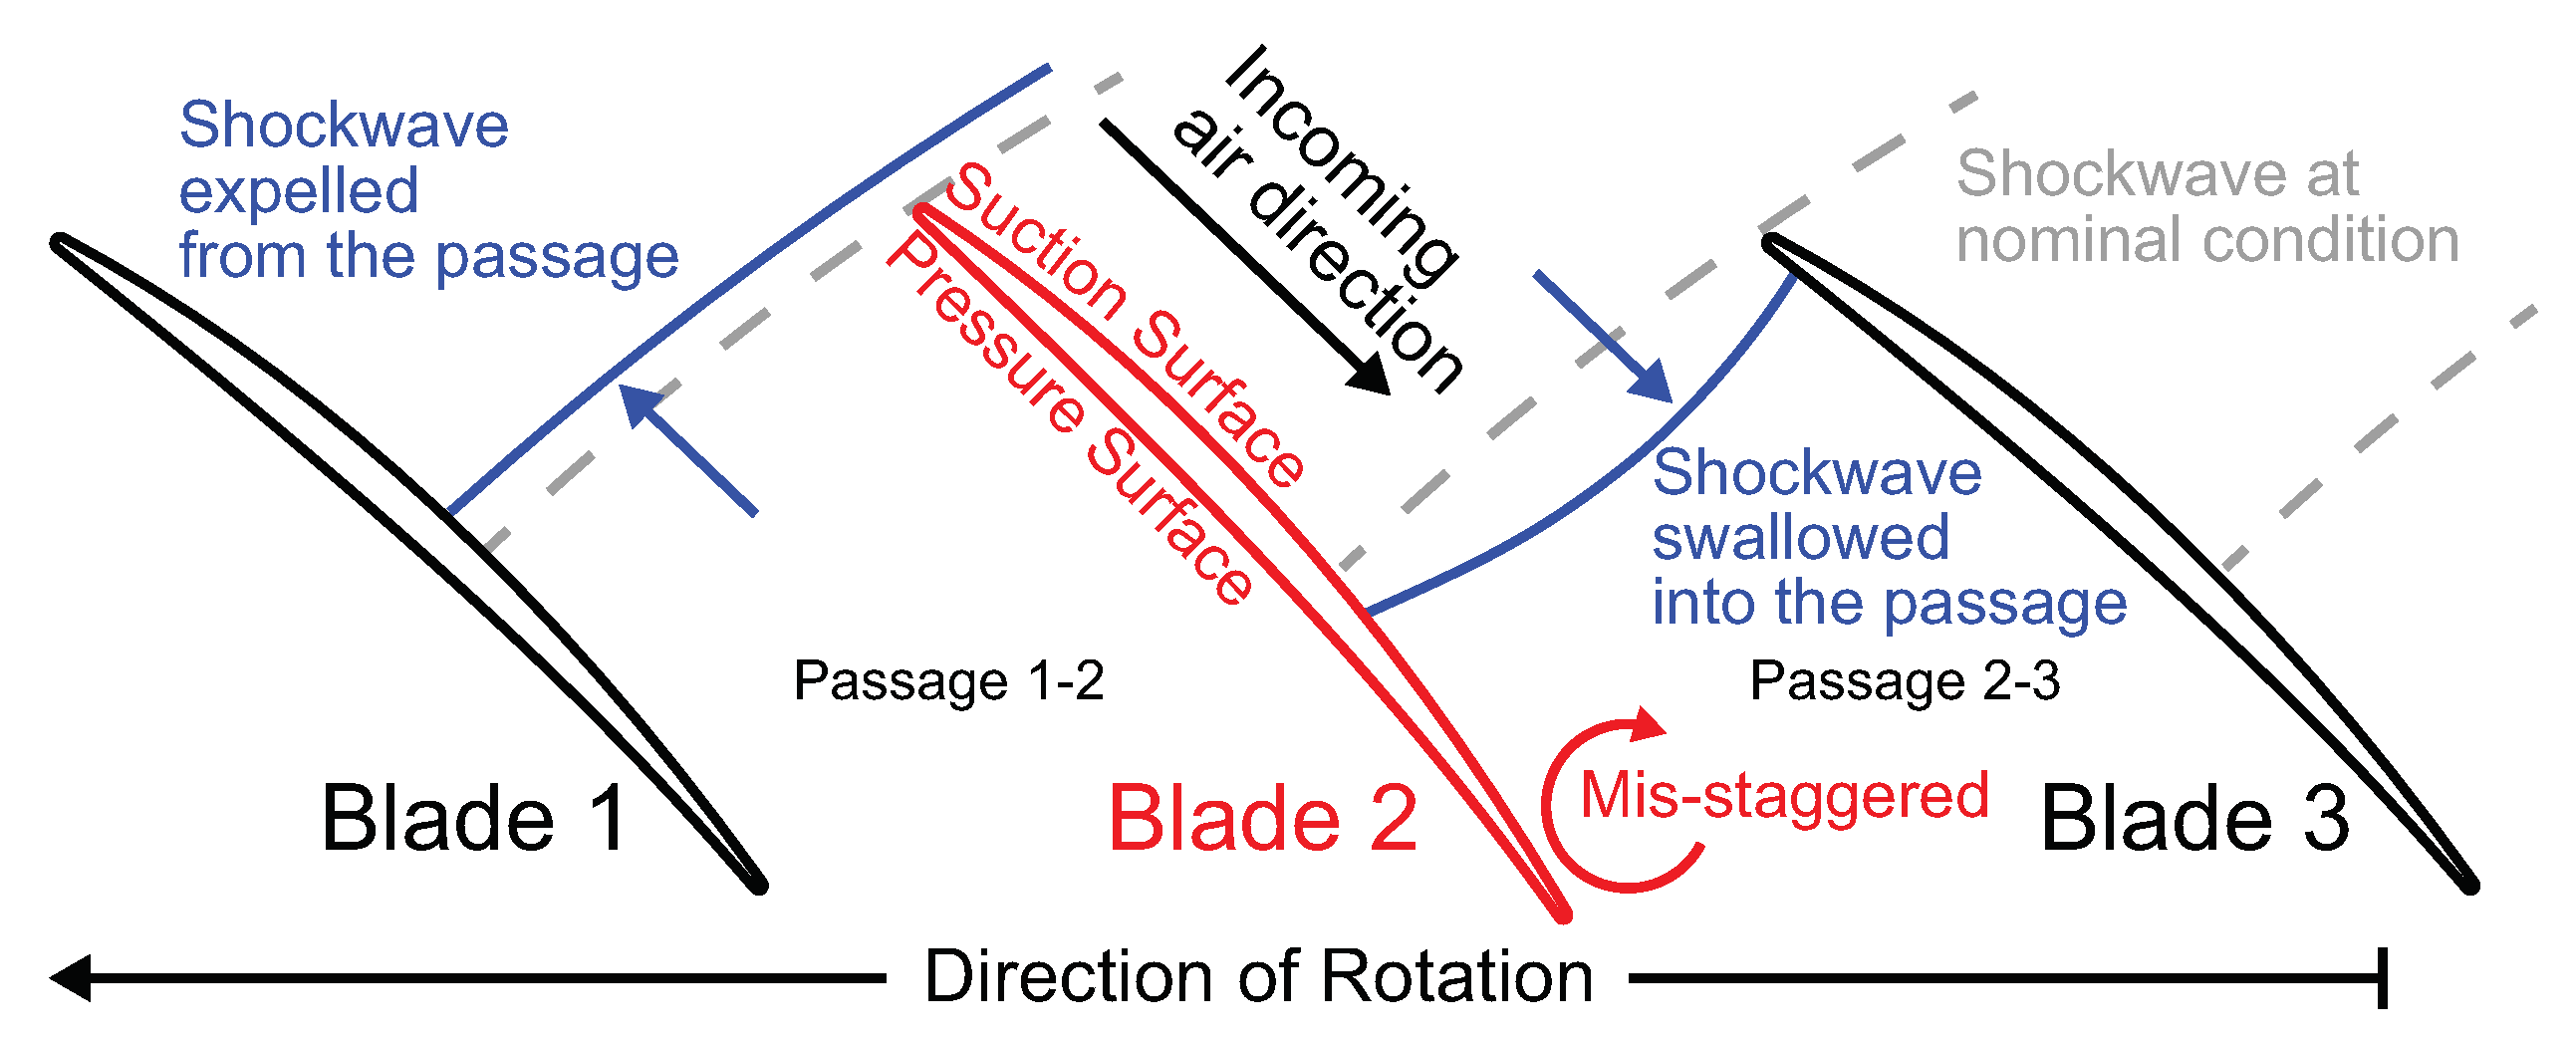
The computational domains used for this study are shown in Figure 3. The fan inlet is placed approximately 8 mid-span chord length away from the blade leading edge. Wilson et al. [3] concluded that tip clearance only influences the untwist behaviour marginally and hence the domains used in this study do not include a tip clearance. Thus, tip and hub regions are modelled as inviscid walls.
For fan 1, shown in Figure 3a, a mass flow boundary condition is prescribed at the inlet to the core compressor. The bypass stream exit boundary is modelled as a choked nozzle, which is adjusted to control the flow condition. It was shown by Lee et al. [14] that this form of boundary condition leads to results which are in good agreement with measured data. To reduce computational effort and simplify post-processing, engine section stators (ESS) and outlet guide vanes (OGV) are not included in the domain. Since the splitter geometry was not available for Fan 2, the downstream geometry is modelled as a single convergent-divergent nozzle as shown in Figure 3b. This is not expected to influence the untwist behaviour as Fan 1 is part of a very high by-pass ratio engine. Moreover, the maximum untwist occurs at the tip of the blade (i.e., Figure 2d).
There are approximately 1.2 million mesh nodes per passage in the domains. This number is determined from a mesh convergence study. Given that the blade untwist is sensitive to the pressure distribution on the blade surface, and thus shockwave movement within the passage, the mesh nodes are distributed evenly around the blade on each radial section.

3. APD Mechanism

Before a comparison of the two fan blades is shown, the mechanisms driving APD are explained in this section. The explanation concentrates on the tip section of the fan because the blade deflection and associated untwist is highest at the tip (see Figure 2d).
The main parameter driving untwist is the shockwave structure within the blade passage. If the fan is throttled along a constant speed line, the shock moves forward. This divides the operating map into three types of flow regimes. These regimes are shaded on the constant speed line of Fan 1 shown in Figure 4. Type A, unstarted flow, is characterised by the shockwave being expelled from the passage whereas Type C, started flow, can be easily identified by the swallowed passage shock. In between the two extremes is the type B, intermediate flow, which is characterised by the shockwave being in close proximity of the leading edge of the trailing blade. At this condition, the fan is operating close to peak efficiency [17,18] and untwist behaviour is most sensitive to changes in the flow condition, as shown previously [7].
The reasons for this are briefly recapitulated here with the help of Figure 4c,d where the aeromechanical properties of the fan blade, untwist moment, untwist angle and shock location on the suction side, are presented along a constant speed line for fan 1. The values of all the quantities are normalised by their respective value range, with 0.0 corresponding to the quantity near choke and 1.0 near stall. The untwist moment is calculated with respect to the blade’s centre of untwist which is located downstream of the trailing edge and a high normalised untwist angle corresponds to a low tip stagger angle (high incidence). As the operating point shifts from type B to type C, the shockwave moves into the passages. The suction surface shock movement and the associated drop in pressure on the pressure surface leading edge (see Figure 4b) result in the centre of pressure moving downstream. Consequently, the untwist moment is significantly reduced. Moving from types B to A, the shift in centre of pressure and resulting untwist is less pronounced. This is reflected in the curves shown in Figure 4d, where all parameters follow the same trend as mass flow is reduced.
The above discussion is on the untwist behaviour of a perfectly symmetrical assembly. When geometric variability is introduced, it will disturb the shock structure in adjacent passages and change the untwist moment, which leads to the APD phenomenon. As an example, consider Figure 5, where Blade 2’s tip stagger is reduced (incidence is increased). In this case, Blade 1’s suction surface passage shock is moved forward which results in a small increase in untwist of Blade 1. Blade 3, on the other hand, experiences a large change in untwist moment as the shock is moved into the passage. Consequently, the stagger angle of Blade 3 is increased, which in turn, results in a forward passage shock displacement onto the pressure surface of the blade trailing Blade 3. As this process repeats around the annulus in the opposite direction to rotation, all the blades in the assembly will be forced to deviate away from the nominal condition and adopt the alternating stagger pattern shown previously in Figure 1.
The above mentioned APD propagation mechanism can be illustrated through the relative tip stagger history shown in Figure 6. The data are obtained from a coupled computation of fan 2. The blade numbers are ascending in the direction opposite to rotation (i.e., same as in Figure 5). In this case, the initially mis-staggered Blade 2 (increased stagger) triggers the passage shock displacement on the trailing blades sequentially and eventually splits the the blades into two groups, those with higher relative stagger and those with lower values. Thus, the APD stagger pattern is formed.

4. Results and Discussion

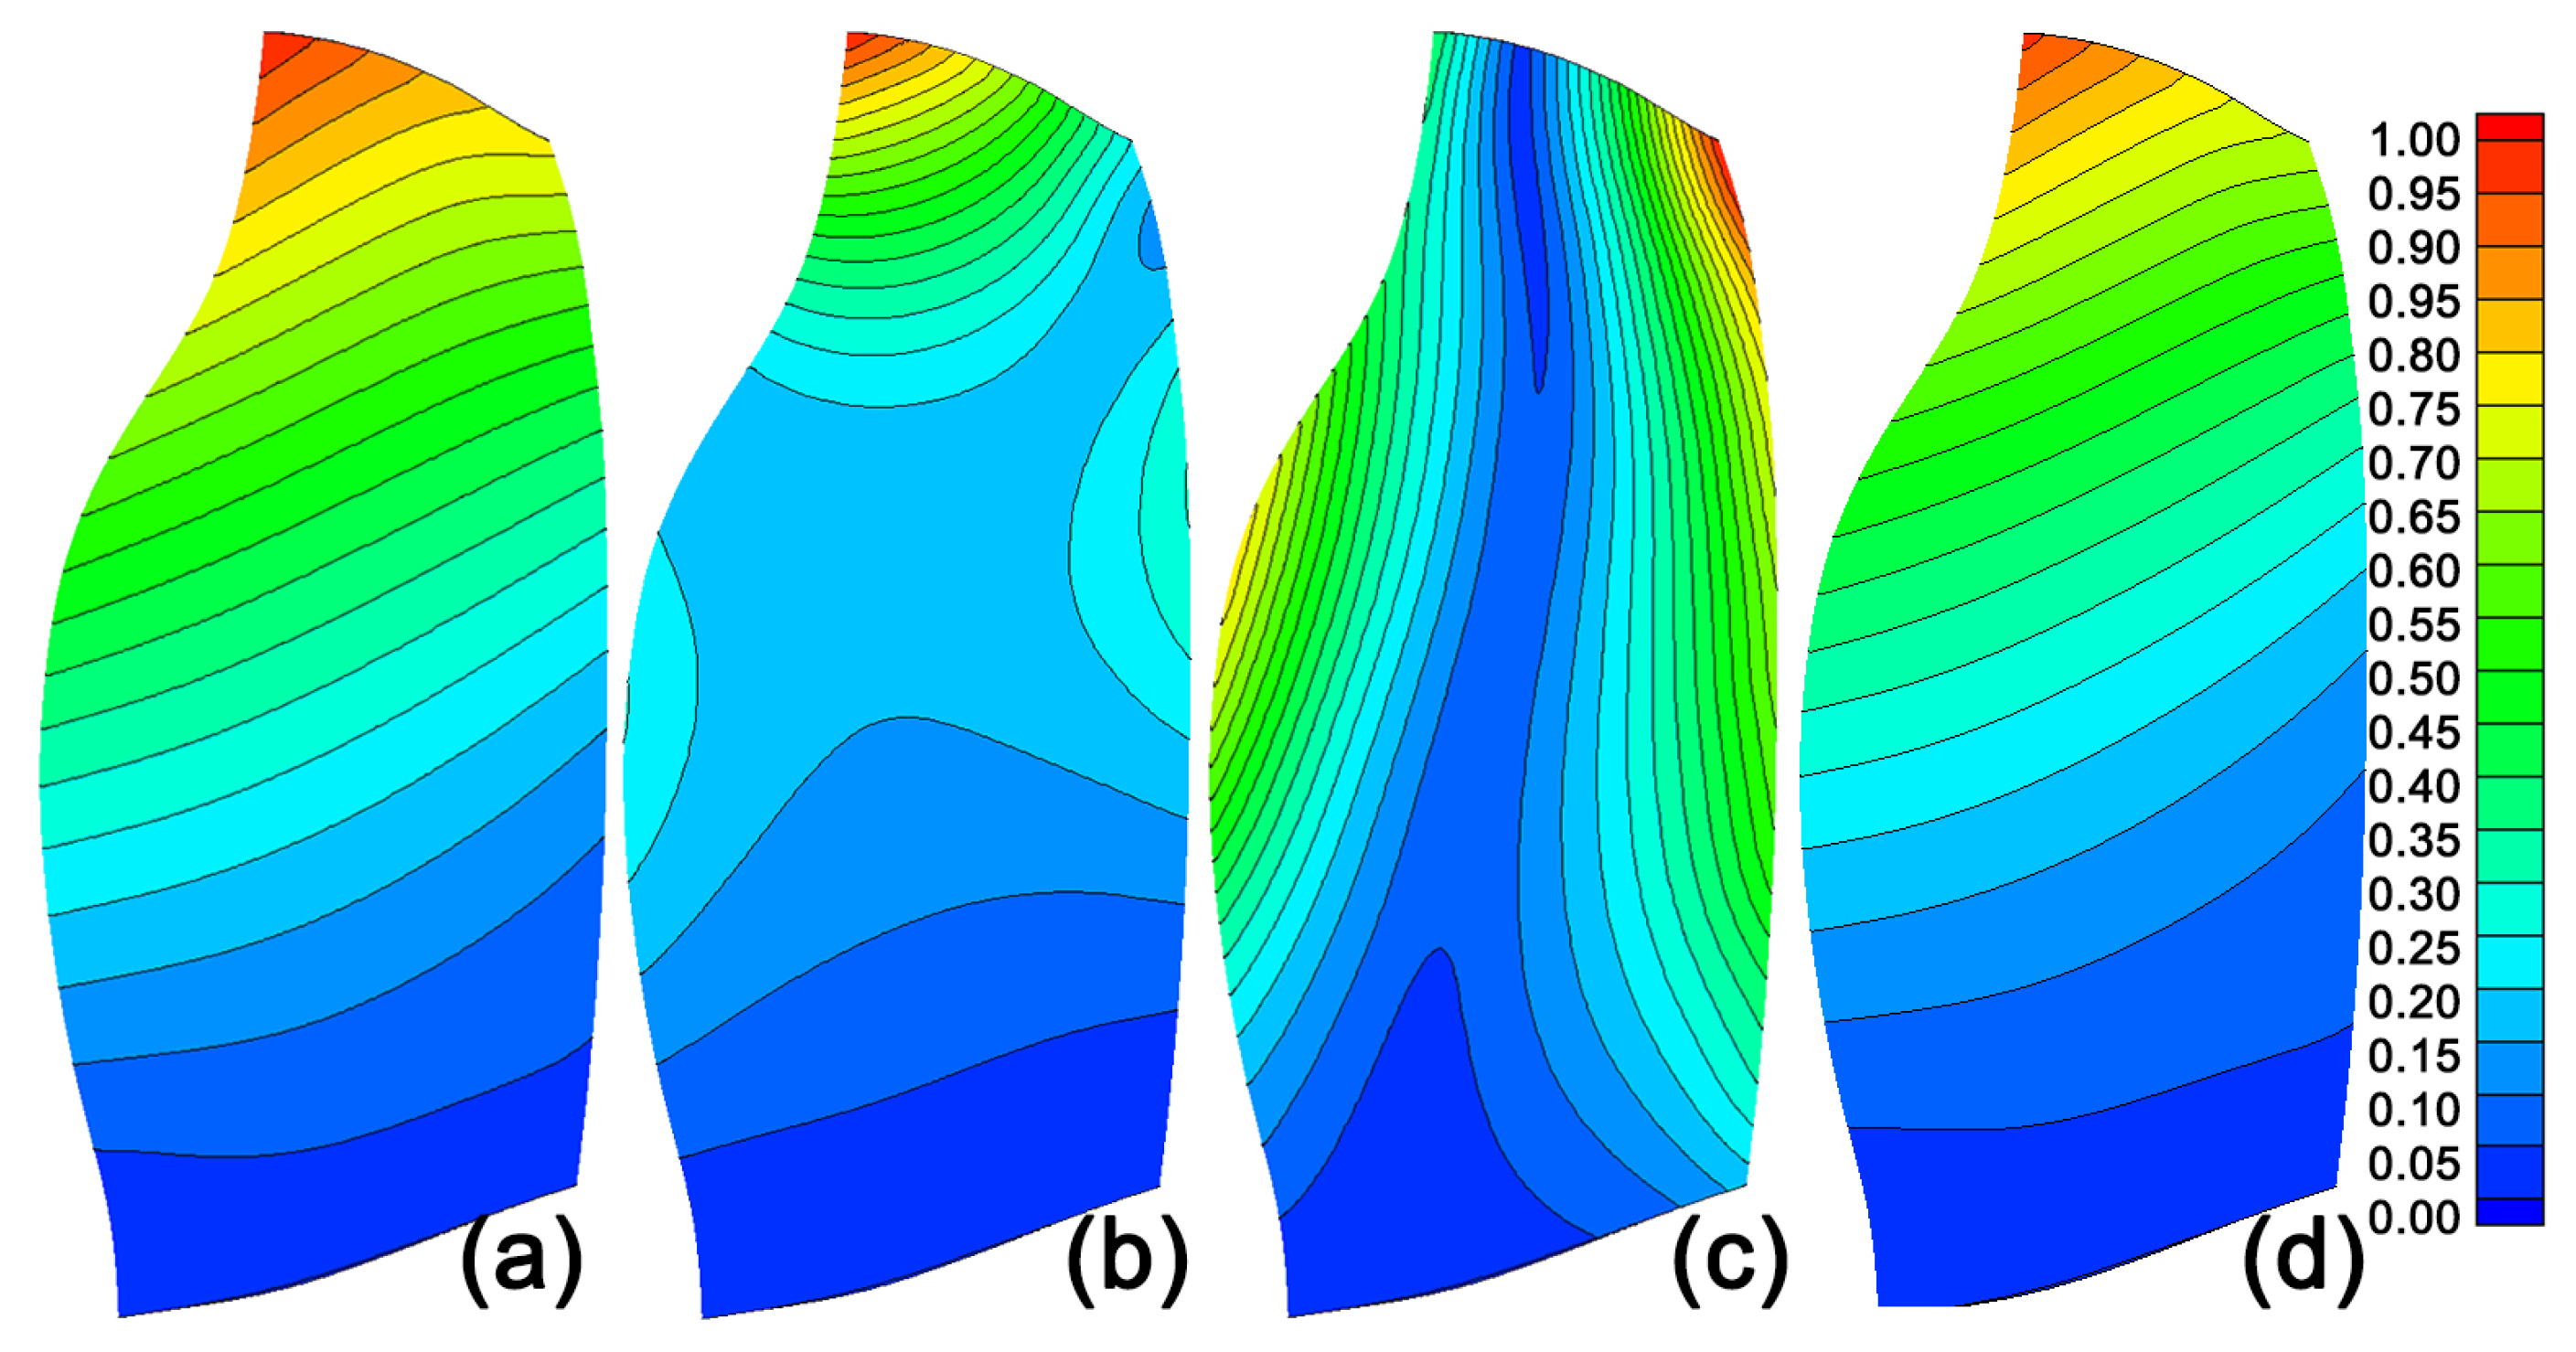
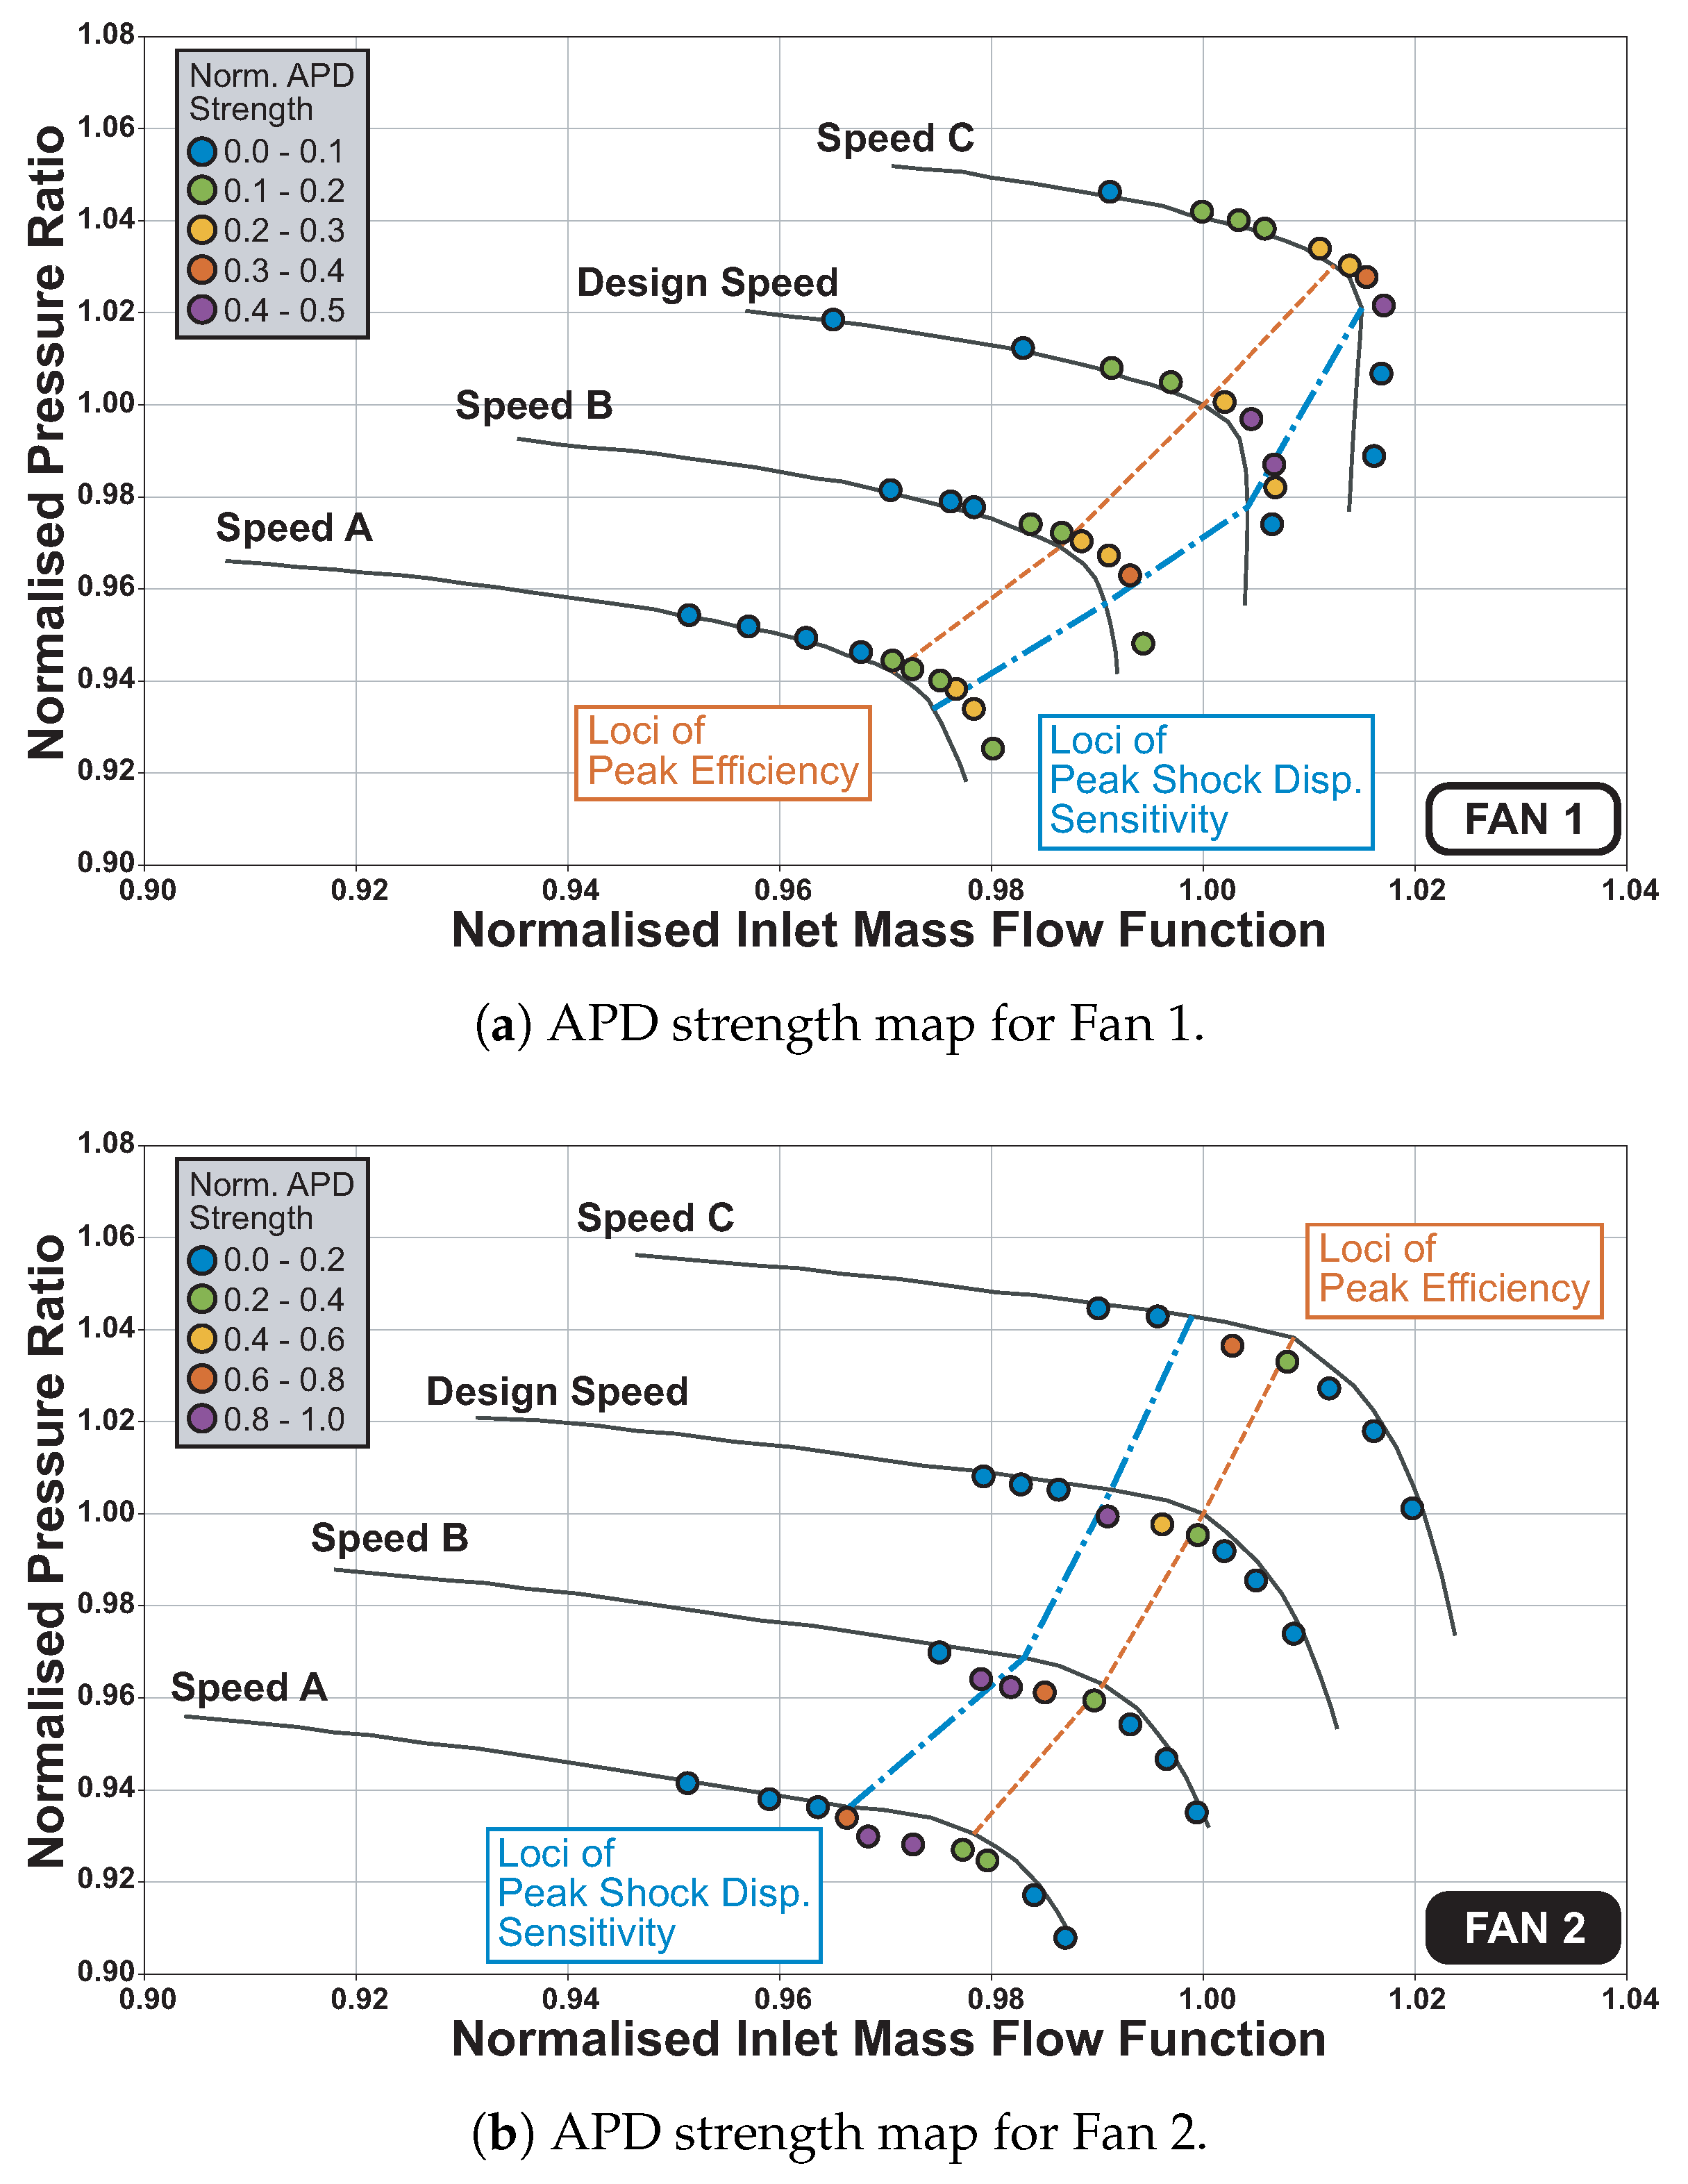
4.1. APD Intensity Map

In this study, the APD behaviour for the two fans was investigated across multiple speed lines. Following the APD computation approach described earlier, an aeroelastic calculation is performed to determine the resulting tip stagger pattern. The patterns are analysed through spatial FFT calculations. The amplitude of the 9th harmonic is used to define the APD intensity for Fan 1 (which has 18 blades) while the 13th harmonic signal is used for the 26-blade fan 2. The amplitudes are then normalised against the data range and mapped onto the fan maps in Figure 7, where fill colour denotes the APD intensity. The dark grey lines represent the constant-speed characteristics for an idealised perfectly uniform fan assembly, which were obtained from steady single-passage computations.
Towards stall, the APD intensity levels were low and the operating points aligned with those of a uniform assembly. This indicates that a single mis-staggered blade has a minor effect on the aerodynamic characteristics of the fan. It causes tip stagger variations in a few adjacent blades but does not affect the overall performance [7]. Near choke condition, assemblies with APD achieve a higher mass flow than the uniform assembly because some of the passages are more open. Comparing the two blades, two main features can be observed: (1) fan 2 exhibited more intense APD behaviour than fan 1 and (2) the relative location between peak APD intensity and peak efficiency was different for the two fans.
Firstly, the APD phenomenon was stronger on fan 2 than on fan 1. This can be explained from the differences in blade design and loading. As discussed earlier, the driving force for APD is the passage shock displacement and resulting change in untwist behaviour. The design feature governing this movement is the covered passage geometry, which is marked by the dashed lines in the sketch of Figure 8a. The length of the covered passage is measured as the length between the leading blade’s trailing edge and the foot in which the trailing blade’s leading edge is projected onto the leading blade’s chord line. At a given point in the covered passage, the covered passage width is measured as the distance between the suction surface of the leading blade and the pressure surface of the trailing blade in the direction perpendicular to the chord lines. This is plotted against chord for the two designs in Figure 8b. It is clear that the fan 1’s covered passage is divergent, whereas fan 2’s covered passage is convergent-divergent with a minimum throat area at around 80% chord. Another distinct difference is that fan 2 has twice the covered passage length as that of fan 1. This is mainly due to the difference in the number of blades. This subtle geometric difference determines the smoothness of the shockwave displacement within the passage and consequently the strength of APD.
For fan 2, the shock cannot be stabilised in the convergent region of the passage. A stable condition only exists if the shock is either resting on the leading edge of the tip or swallowed into the divergent section of the covered passage. This creates a discontinuity/step change in the shock structure of fan 2’s blades and consequently a discontinuity in aerodynamically induced untwist moment which creates strong blade-to-blade variations.
The above explanation is supported by the differences in blade pressure distributions. Figure 9a shows the pressure profiles for individual blades at fan 1’s peak APD amplitude case at the design speed. Figure 9b shows the corresponding behaviour for fan 2 (i.e., the peak APD amplitude case at the design speed). In Figure 9a, small differences in leading edge pressure and suction surface shock position between the adjacent blades are visible. Such differences contribute to approximately 10% difference in untwist moment at the tip. This alternating pressure distribution thus introduces APD onto the assembly. In contrast, a more distinct difference can be observed in Figure 9b where pressure surface shock position on adjacent blades differ by approximately 20% of chord length. Consequently, this leads to almost 40% difference in untwist moment between blade pairs which makes Fan 2 highly prone to exhibit APD behaviour.
To summarise, the main geometry feature which determines the smoothness of the passage shock displacement is the absence/existence of the throat. A passage with a converging-diverging section results in a discontinuity in shock displacement which maximises the differences in loading and associated untwist between adjacent blades, creating a strong APD pattern.
Secondly, the maximum APD amplitude occurs close to the peak efficiency loci drawn in Figure 7 but is shifted towards choke for Fan 1 and slightly towards stall for Fan 2. The location of maximum APD intensity depends on the sweep of the blade. The backward sweep on Fan 1’s blades (see Figure 2) dictates that its peak efficiency conditions is achieved when the shock is slightly expelled at the tip (i.e., Type A flow). Thus the peak APD cases are located slightly towards choke for Fan 1. Conversely, Fan 2’s distinct covered passage geometry prompts its peak efficiency condition to occur with passage shock right behind the throat (i.e., Type C flow). Accordingly, the worst-case APD cases occur ahead of the peak efficiency loci with lower mass flow rate.

4.2. Reduced Order Approach

The previous discussion showed how the passage shock is most sensitive to changes in flow condition when the shock sits near the leading edge (i.e., type B in Figure 4a). Thus, APD is highly correlated to shock displacement. This can be further investigated through Figure 10a which shows the relative shock position against mass flow rate. The relative shock position is normalised such that 0 corresponds to near-stall while 1 corresponds to choke. Thus, the most sensitive/unstable operating condition can be identified by locating the peak value of the second derivative of the shock position with respect to mass flow rate (i.e., the ‘acceleration’ of the passage shock). In Figure 10b, a peak can be clearly observed at the normalised mass flow above 1 (which corresponds to the peak efficiency condition). Note that the data for the extreme choke cases (cases in the blue rectangle in Figure 10a) are filtered out during the second derivative calculation.
This calculation was performed for each constant speed line and the operating points where the second derivative is at the highest for the particular speed line are mapped onto the APD map in Figure 7a,b as the blue dash-dot lines. From the plots, it is clear that the predicted peak APD intensity region has a strong correlation with the loci for peak shock displacement sensitivity for both blades. This reduced order approach can locate the worst-case APD condition in a computationally efficient fashion. Instead of performing full annulus coupled calculation to map the intensity map, the most undesirable case can be located through single passage untwist calculation and even uncoupled computation on the design blade geometry. With this approach, only a limited number of full annulus cases are required to gauge the strength of APD. For this study, the time required can be reduced from 400,000 CPU-hours to approximately 3000 CPU-hours for each blade.

5. APD and Mistuning

The above analysis is conducted under the assumption where the fan blades are structurally tuned. Given that intentional mistuning is sometimes used as a means to prevent fan flutter [19,20,21], it is interesting to explore whether mistuning alone can lead to APD behaviour. Therefore, a mistuning study is conducted for Fan 1. Frequency mistuning (of Mode 1/first flapwise mode) is introduced onto a perfectly symmetrical starting geometry. The starting operating condition is the one associated with the worst-case APD behaviour at the design speed.
As illustrated in Figure 11a, a random mistuning pattern with amplitude of ±2% is used in the coupled untwist computation of a full-annulus geometrically tuned fan assembly. Fourier decomposition of the mistuning pattern, shown in Figure 11c, reveals that the dominant signal is the 8th harmonic signal. Figure 11b shows the converged geometry in term of tip stagger. It should be noted that, without APD (i.e., not operating near the APD condition on the fan map), the final mis-stagger pattern follows the initial mistuning pattern and the magnitude of mis-staggering is significantly smaller than the APD case. Comparing Figure 11a to Figure 11b, it is evident that the final stagger pattern does not follow the initial mistuning pattern. The initially alternating mistuning pattern from Blade 8 to 18 has been translated into an alternating stagger pattern while a mild APD pattern is established between bladeslade 1 and 7 where the initial variability is not alternating in nature. Besides, as shown in Figure 11c, aeroelastic coupling has shifted the dominant signal to the ninth harmonics and suppressed signals from all the other harmonics. By comparing the patterns in Figure 11a,b, it is clear that mistuning can introduce APD behaviour into the system.

6. Conclusions and Future Work

The findings revealed in this study lead us to the following conclusions and direction for further studies:
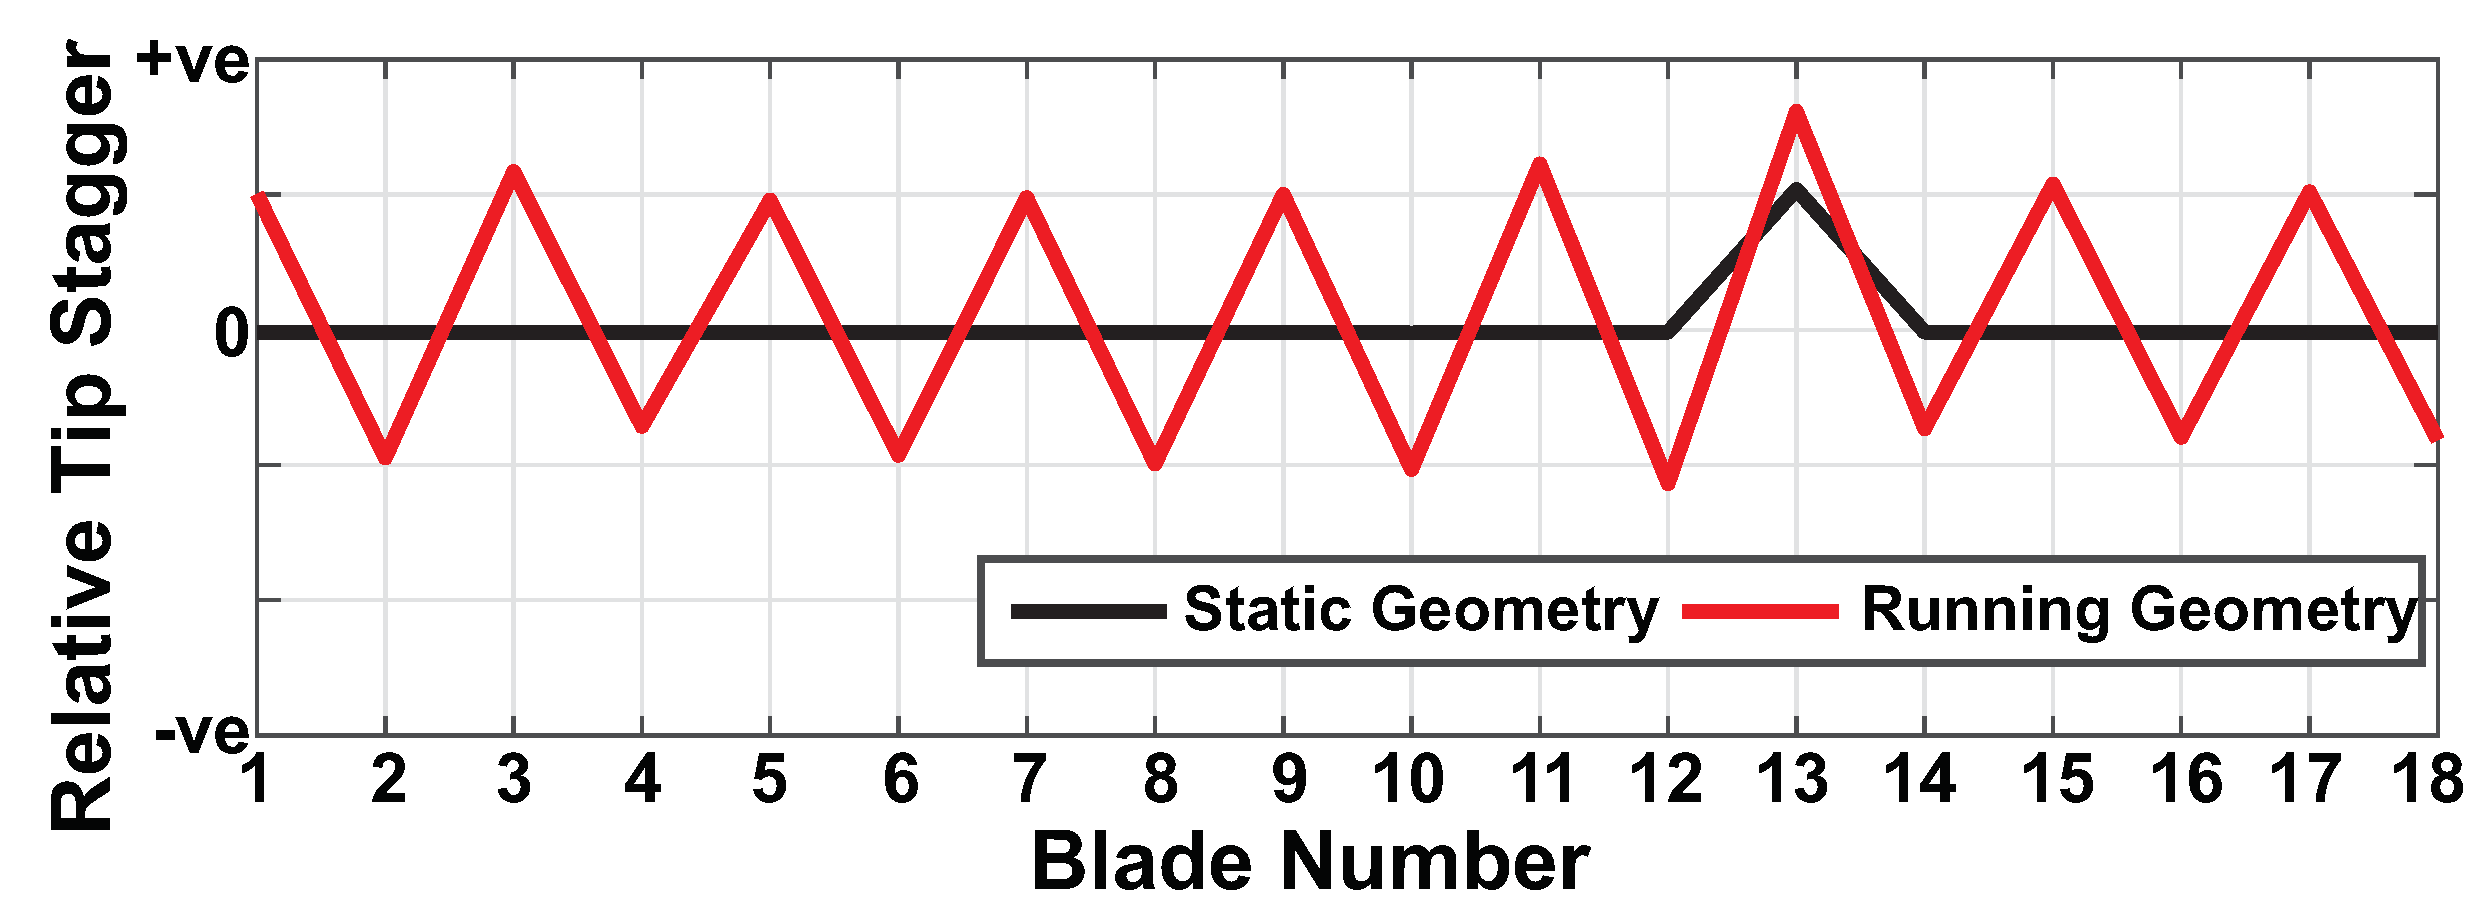
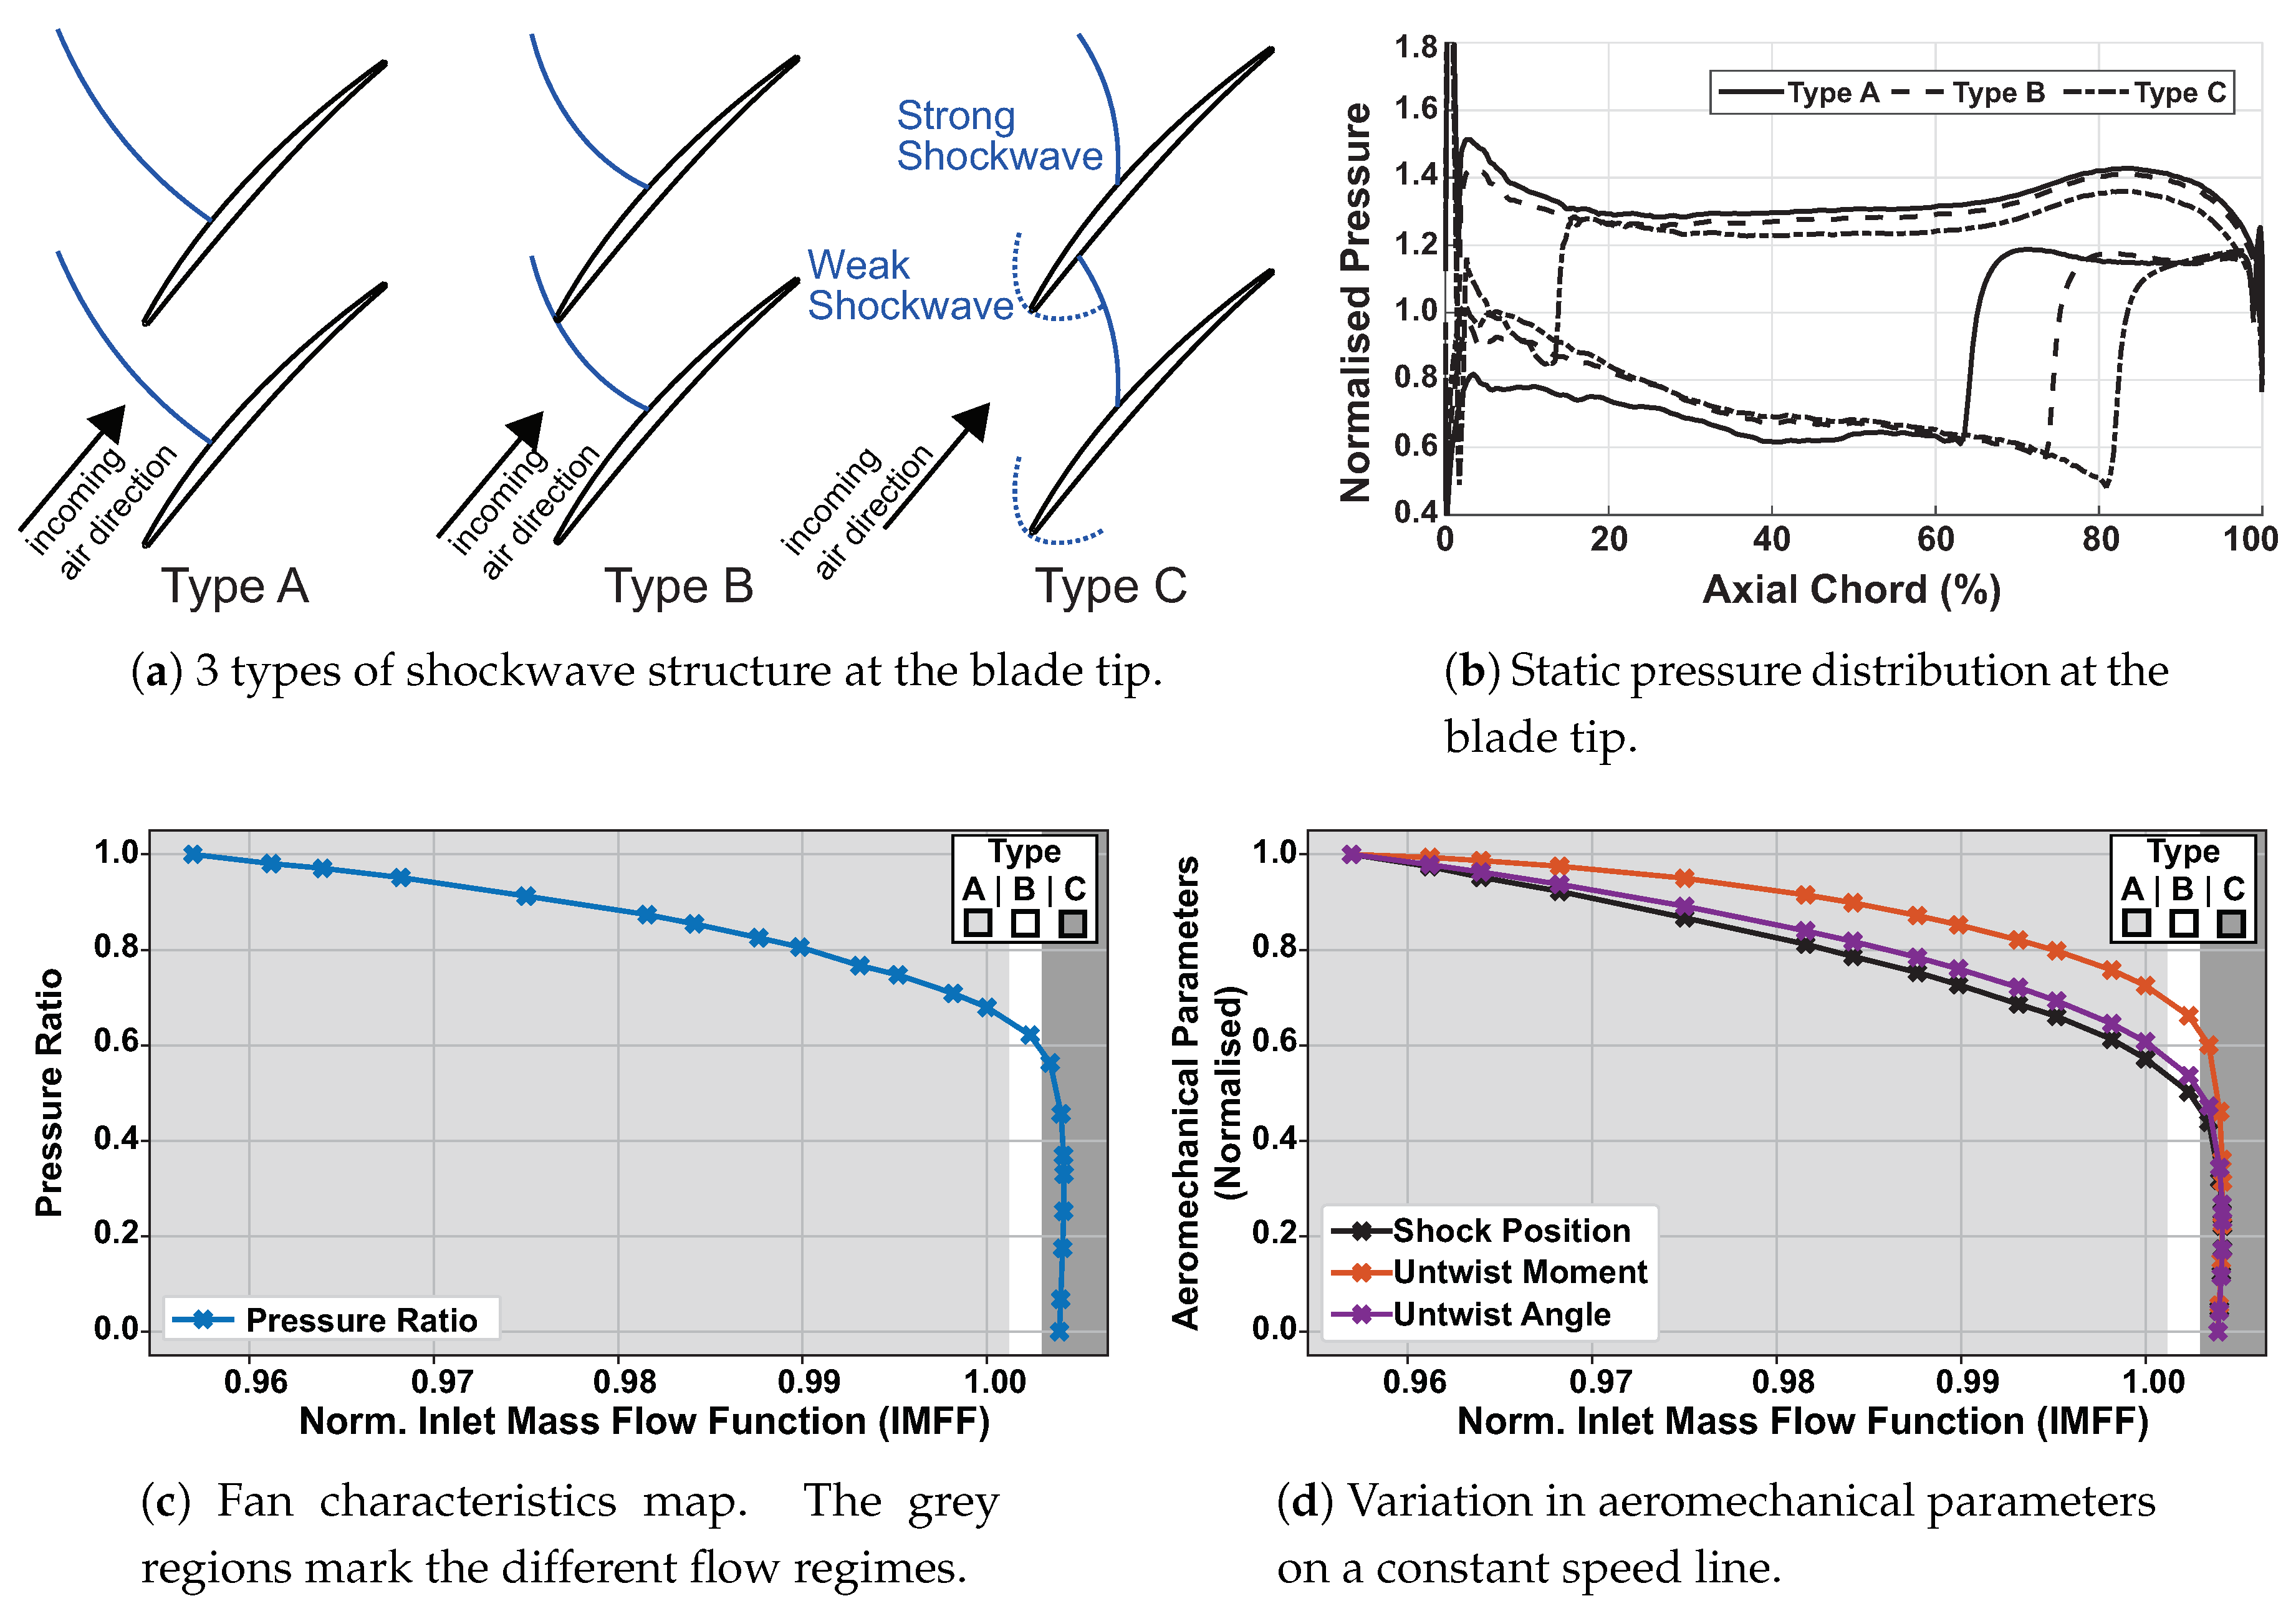
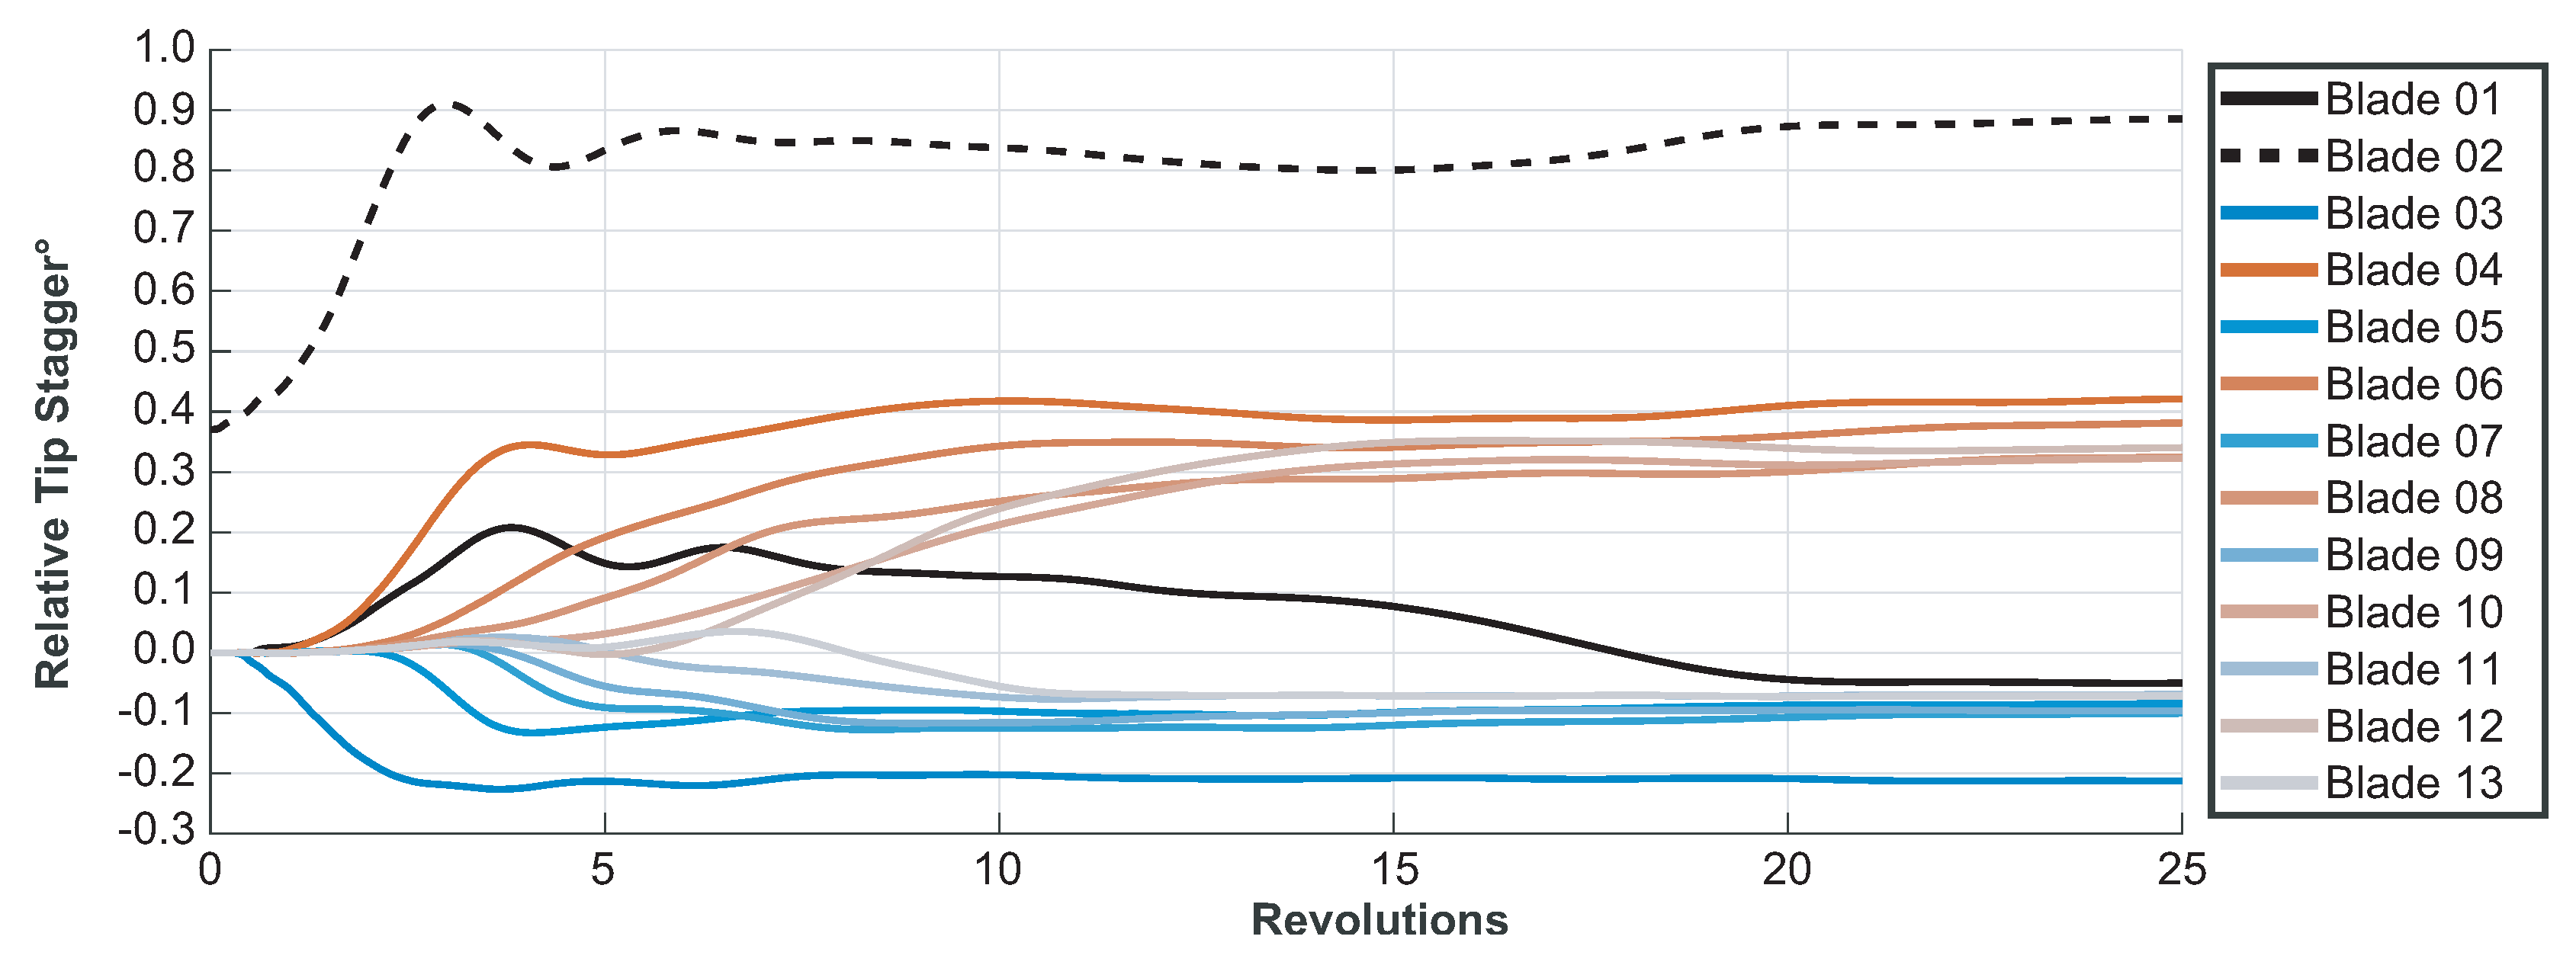
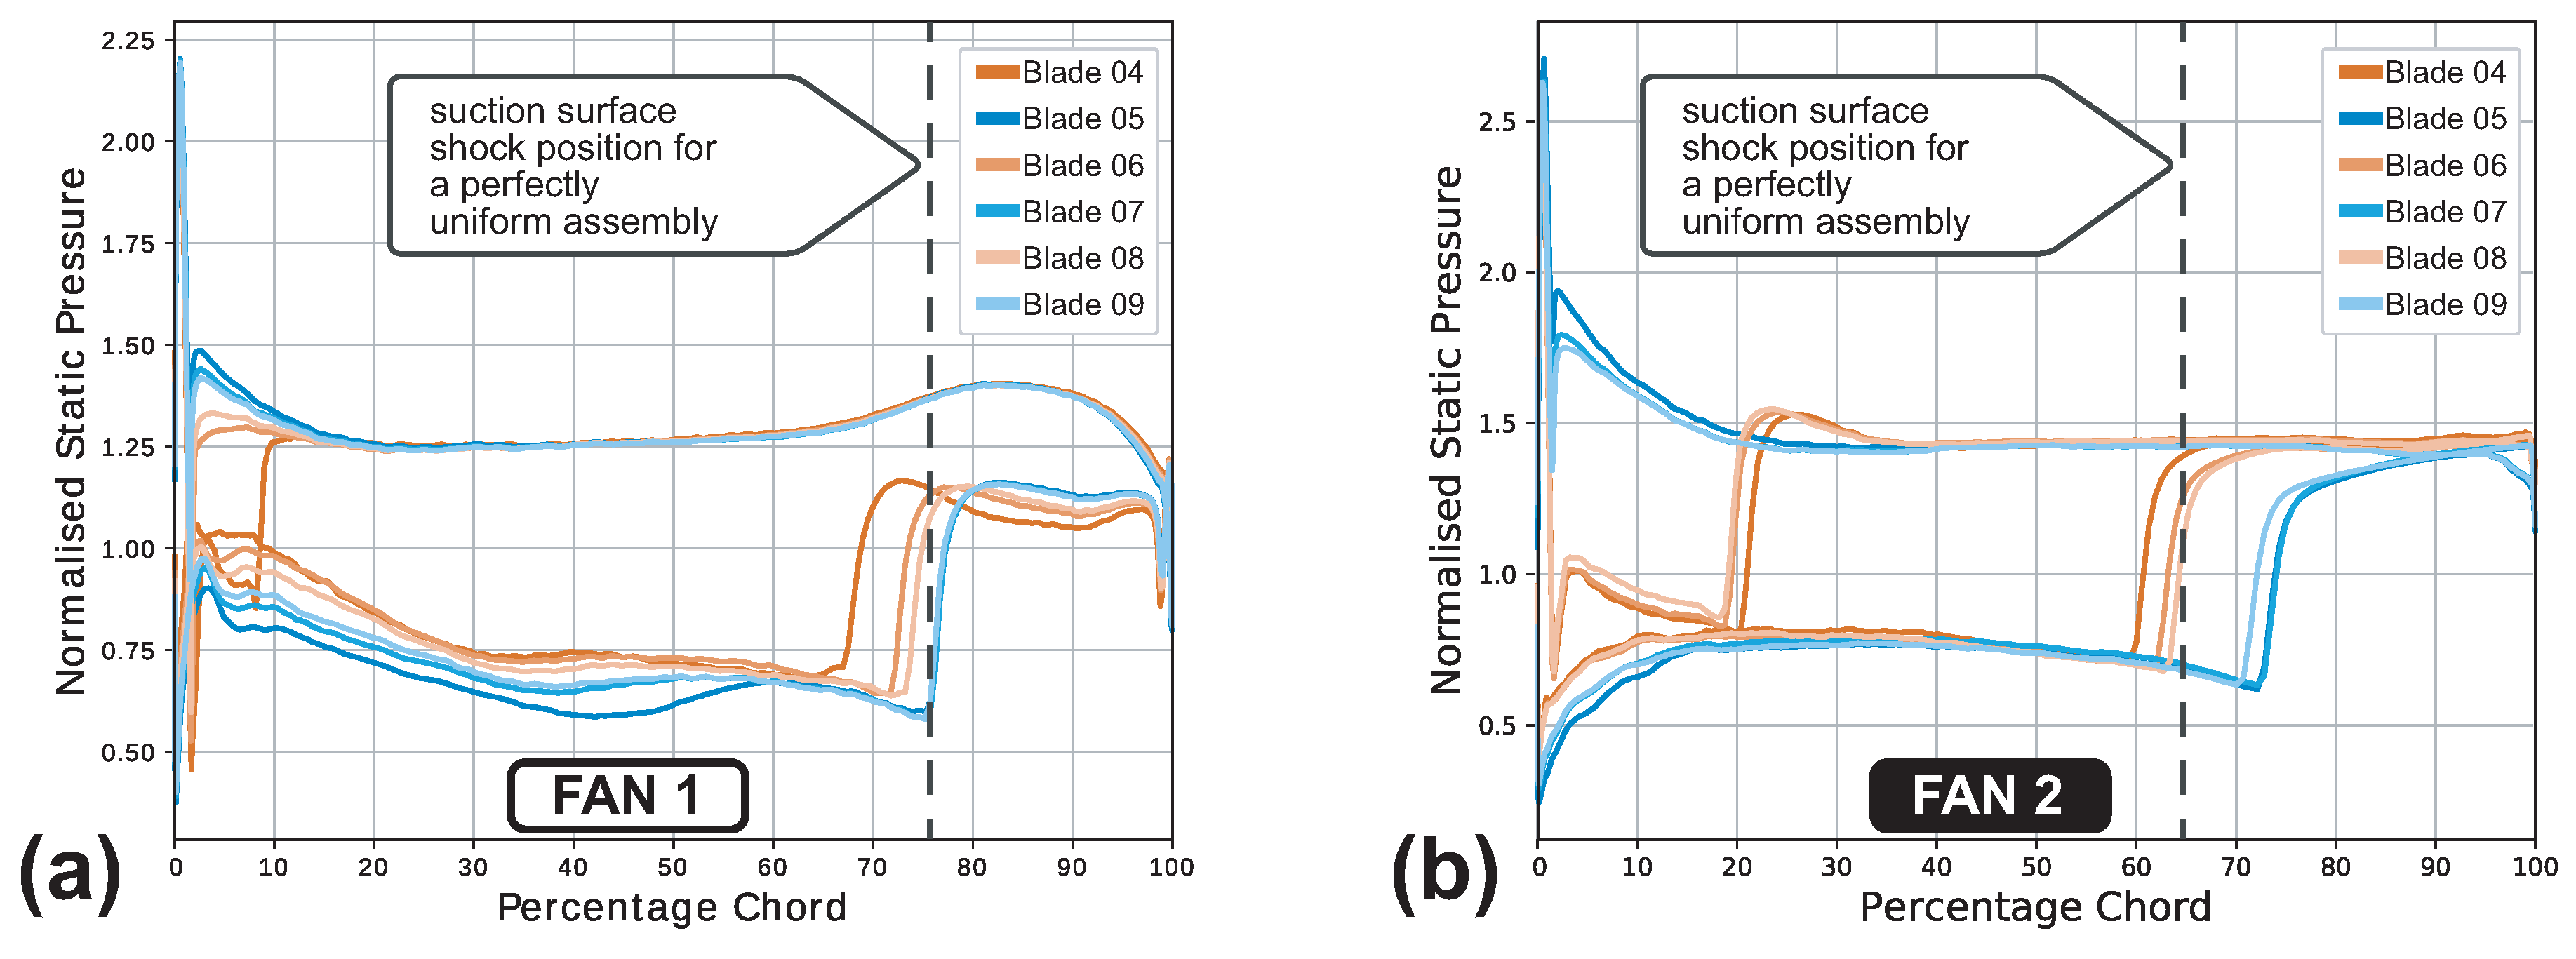
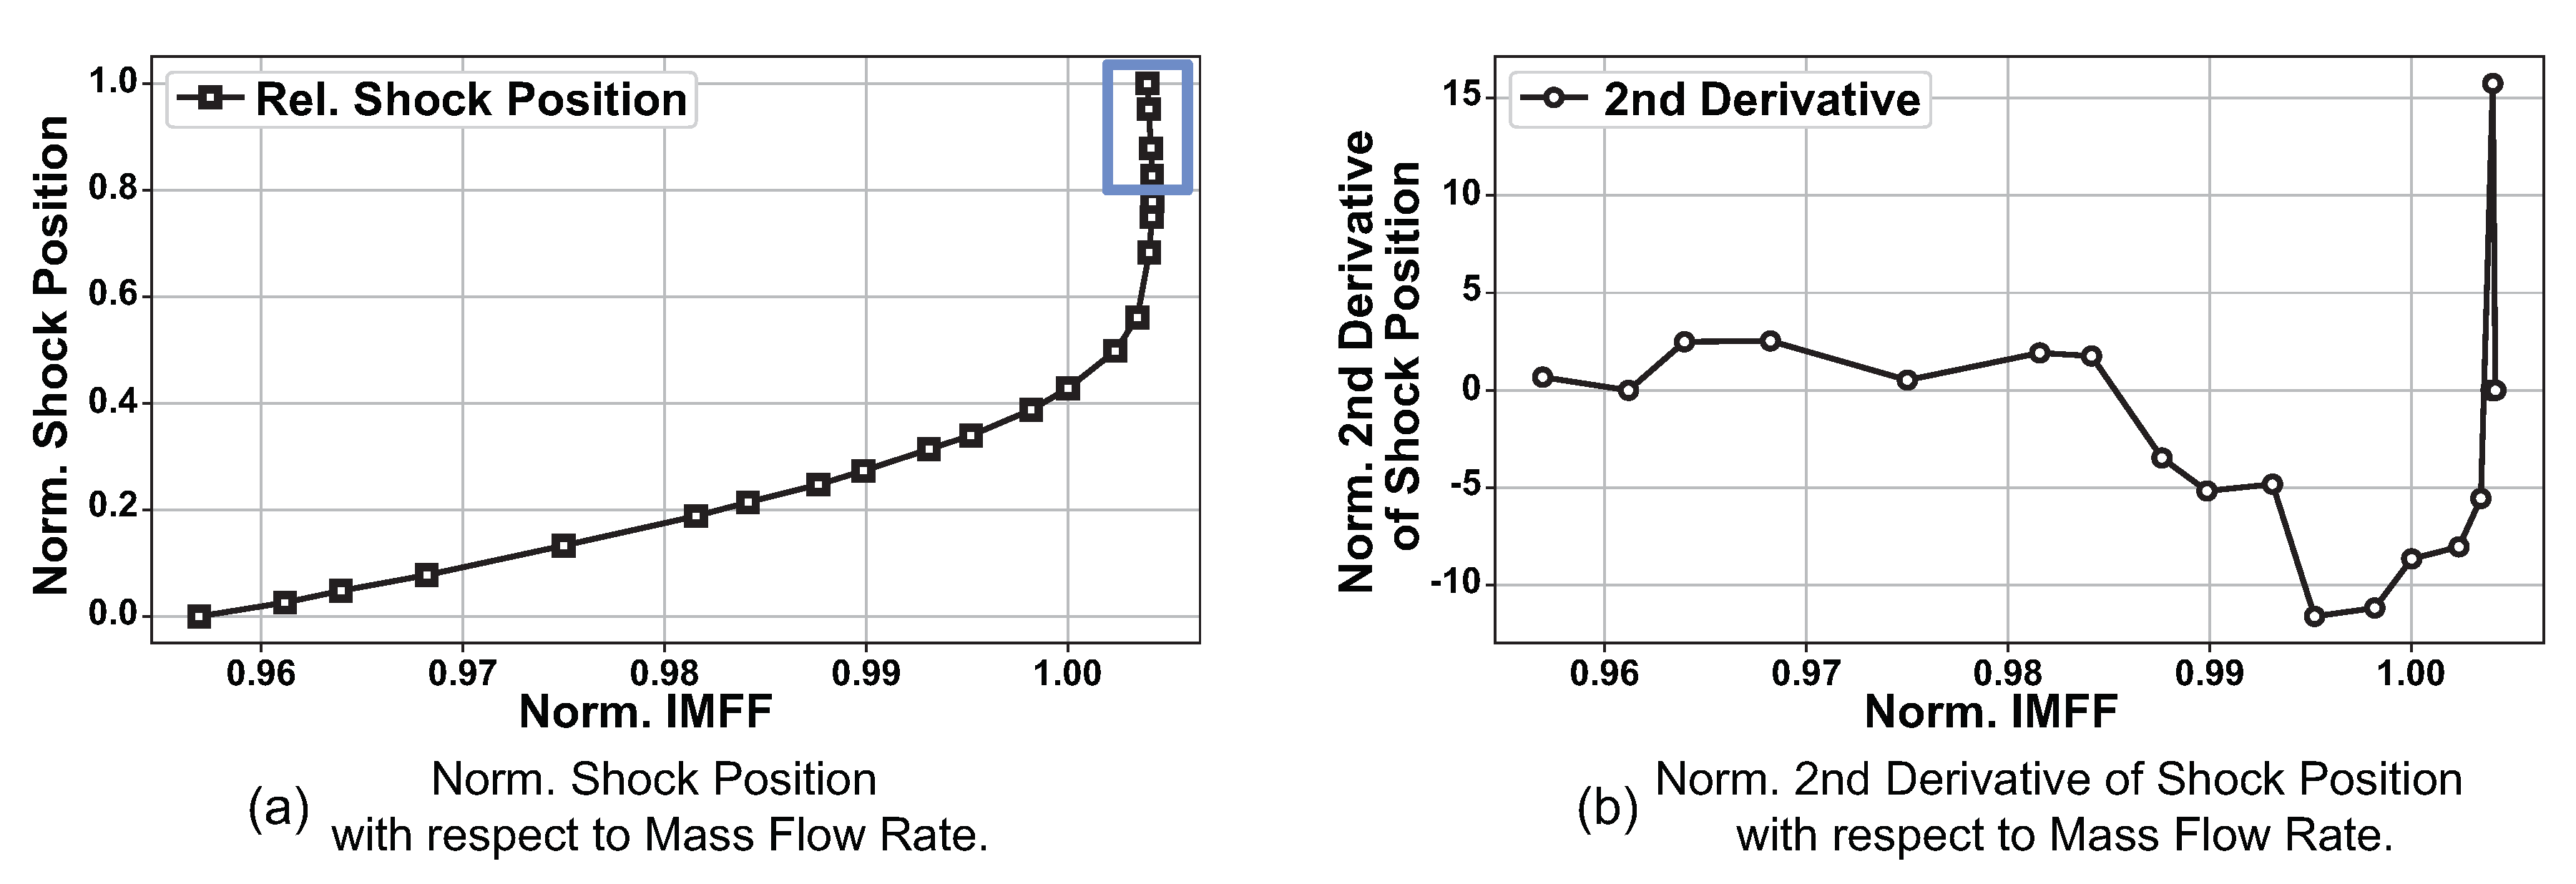
  • Through the APD contour map and the loci of peak shock displacement sensitivity, it can be concluded that APD is closely related to the discontinuity/non-linearity in the untwist behaviour of the fan blades.
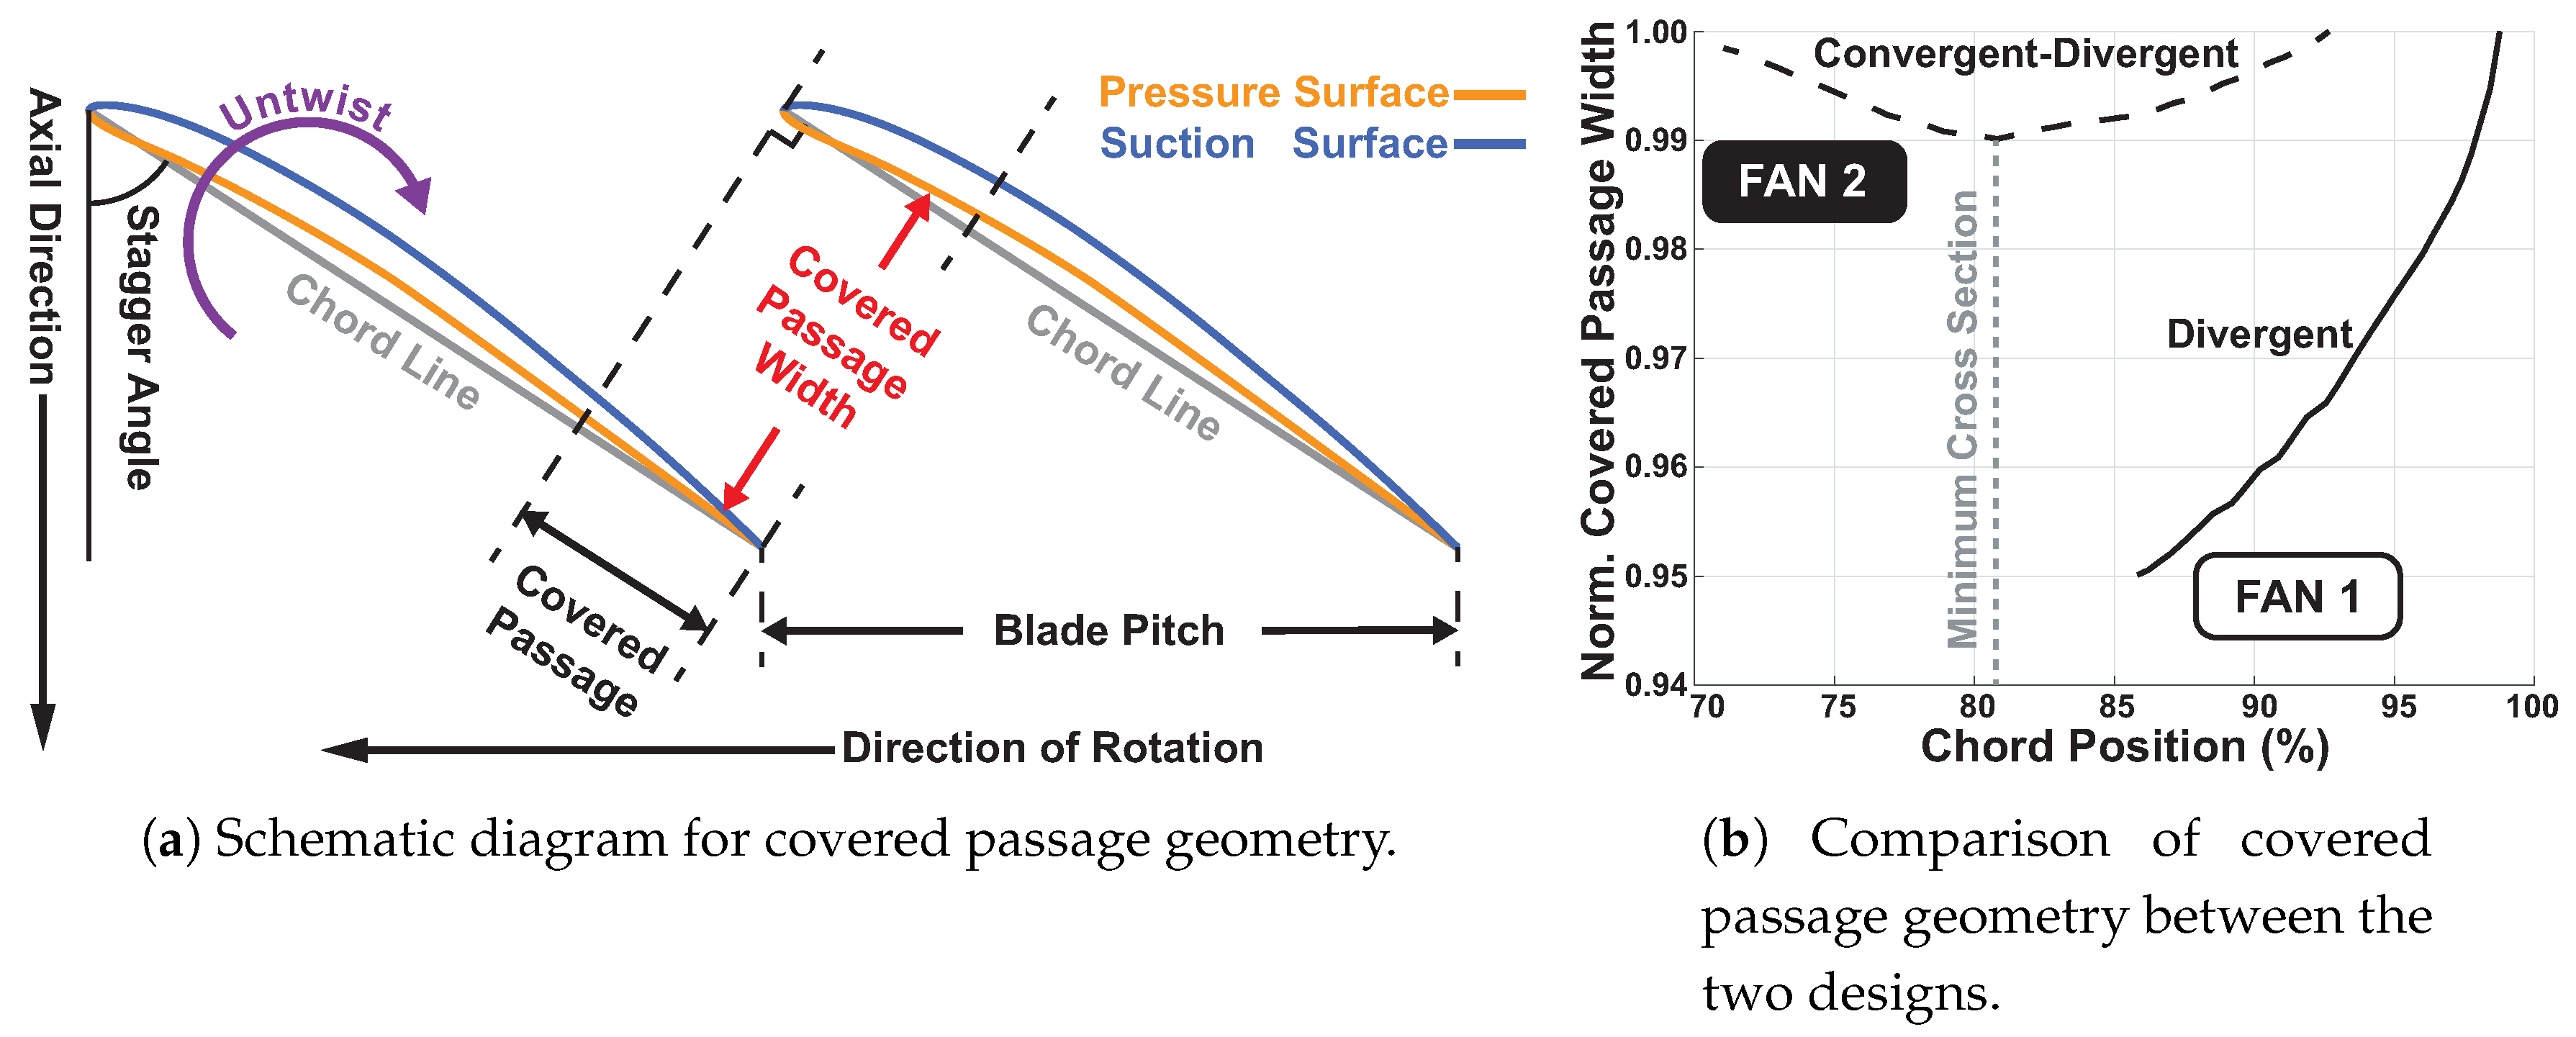
  • Comparison of the two blades’ geometry and the corresponding difference in their APD behaviour reveals that a discontinuous/abrupt transition in the passage shock position exacerbates the APD behaviour. A spin-off idea from this observation is the convergent section of the covered passage (where the passage shock cannot be stabilised) on fan 2 can introduce unsteadiness in the annulus because it prompts shock displacement and further aeromechanical change. In fact, it is previously observed that under certain conditions, APD can be accompanied by a travelling disturbance around the annulus. It is important to investigate the unsteady effect of APD because it can influence the fan blades’ high cycle fatigue life.
  • From the results comparison between the reduced order model and the full annulus coupled computation, it is evident that the peak APD conditions at each constant speed line can be located by the reduced order model. This will result in the reduction in computation cost. Therefore, it would be interesting to investigate whether reduced order model can be used to quantify APD intensity such that it can be incorporated into fan blade design approach.
  • As demonstrated, APD occurs in close proximity to design point which sets it apart from other types of aeromechanical instabilities (such as flutter) which usually occur at off-design conditions and thus of relatively less concern to the engine manufacturers. This makes it paramount for the manufacturers to comprehend this phenomenon.
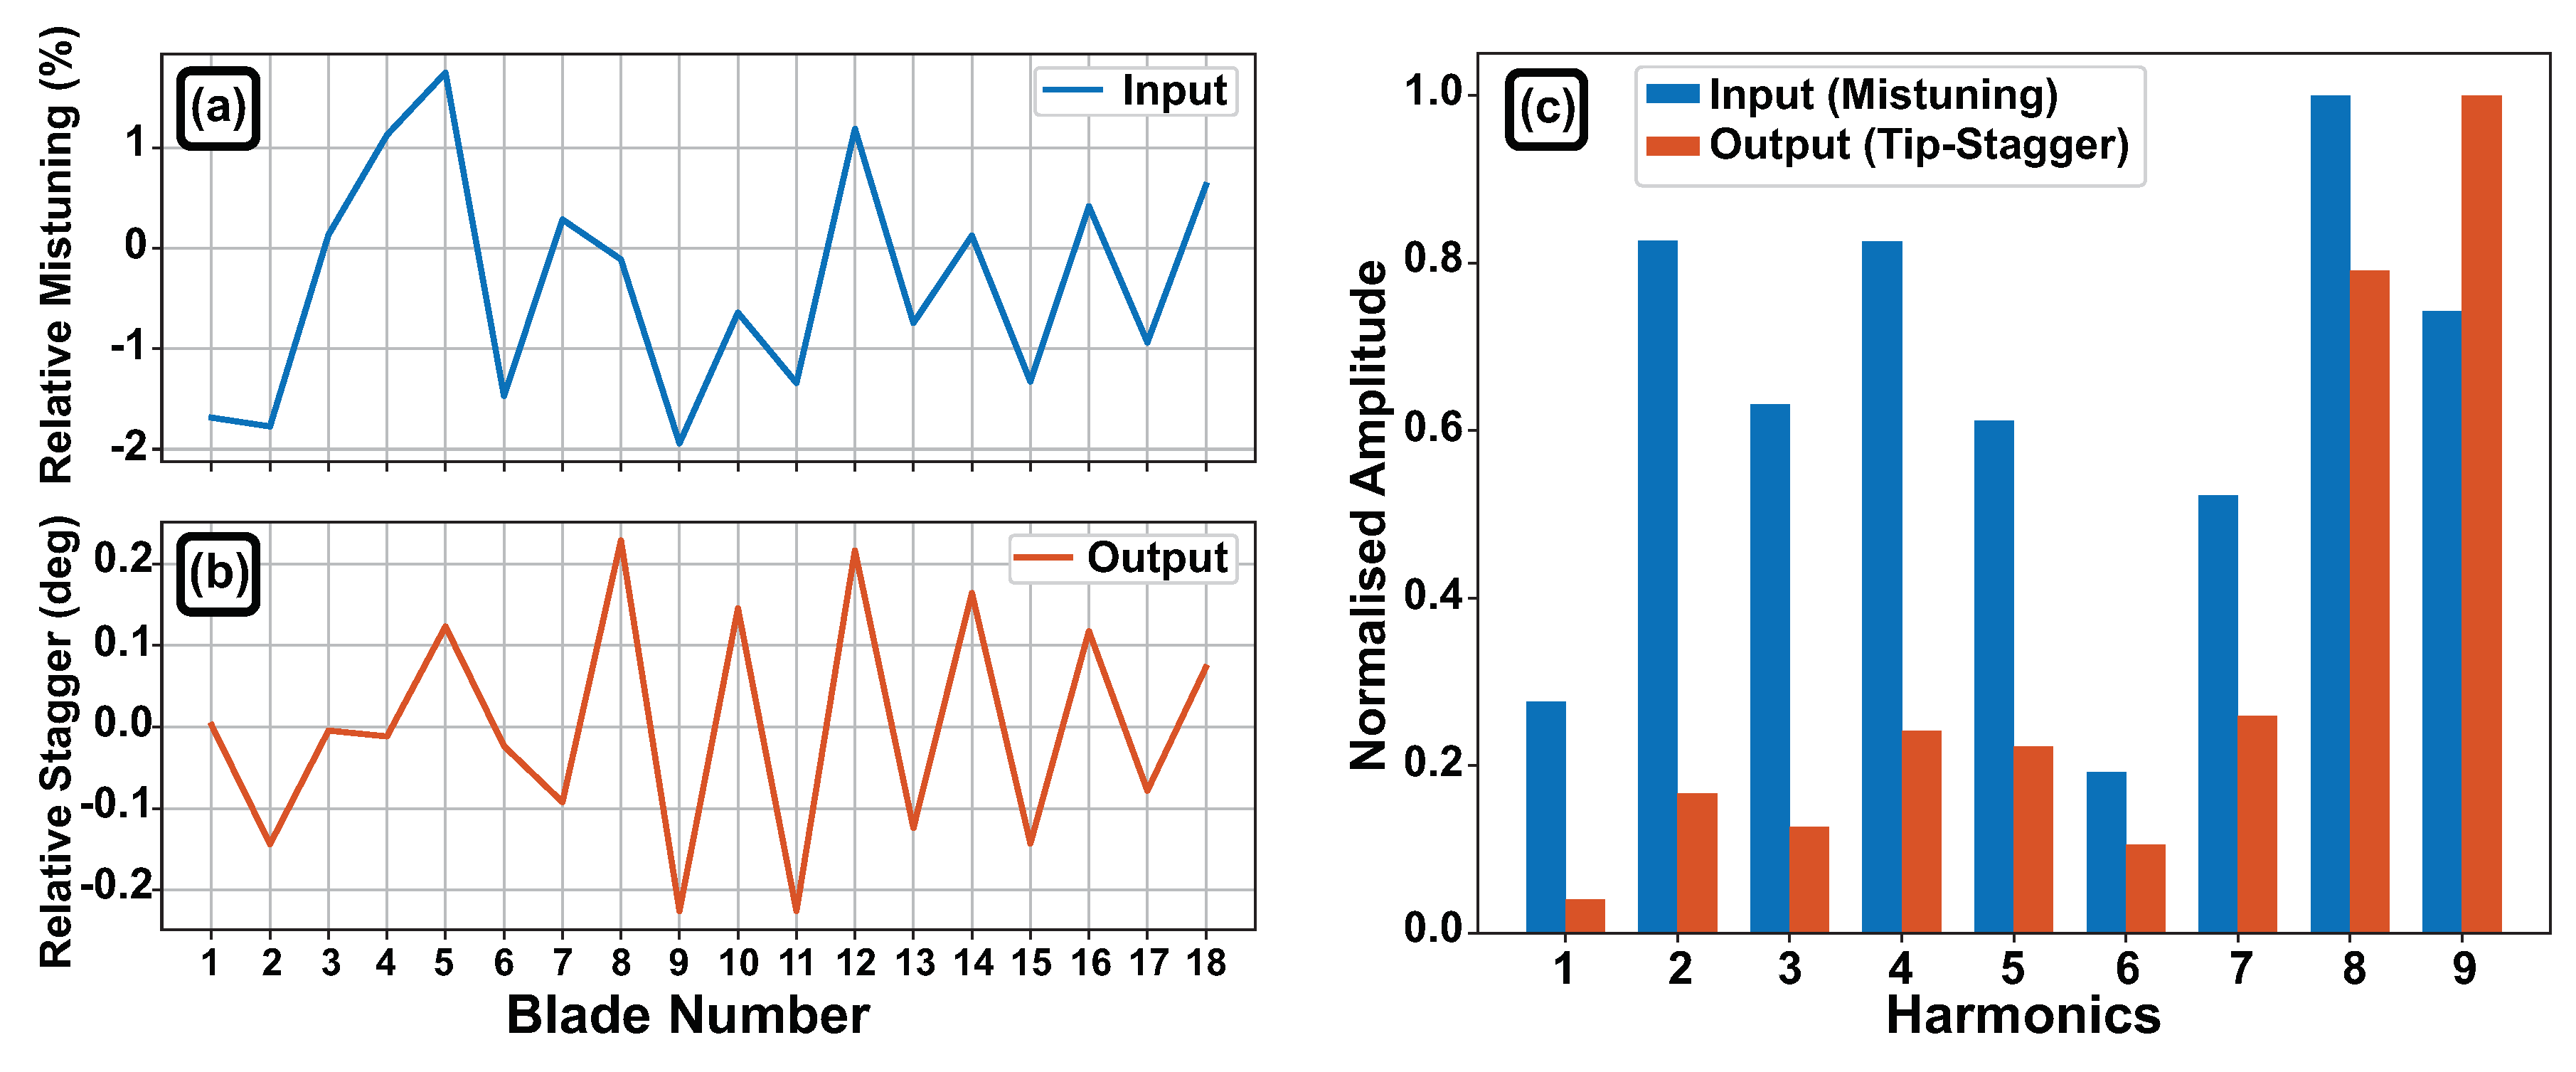
  • Given that intentional mistuning which is usually used to prevent flutter behaviour (i.e., at off-design conditions) can introduce APD behaviour (close to design condition), it is crucial for engine manufacturers to investigate the APD behaviour.

Author Contributions

Conceptualisation, B.L., J.G. and M.V.; data curation, Y.L.; formal analysis, Y.L.; funding acquisition, B.L., J.G. and M.V.; investigation, Y.L., M.V. and S.S.; methodology, Y.L., M.V. and S.S.; project administration, B.L., J.G. and M.V.; resources, B.L. and J.G.; software, M.V.; supervision, B.L., J.G., M.V. and S.S.; visualisation, Y.L.; writing—original draft, Y.L. and S.S.; writing—review and editing, Y.L., B.L., J.G., M.V. and S.S.

Funding

This research was funded by Rolls-Royce plc. The APC was funded by the Euroturbo Association.

Acknowledgments

The authors would like to thank Rolls-Royce plc for both sponsoring this study and allowing its publication. We would also like to express our gratitude to our colleagues at Imperial College London, Fanzhou Zhao and Prathiban Sureshkumar, for their contribution to this study.

Conflicts of Interest

The authors declare no conflict of interest.

Abbreviations

The following abbreviations are used in this manuscript:
APDAlternate passage divergence
ESSEngine section stator
FEFinite element
FFTFast Fourier transform
MPTMultiple pure tone
OGVOutlet guide vane
RANSReynolds-averaged Navier–Stokes
SLSSea level static

References

  1. Schuff, M.; Lengyel-Kampmann, T.; Forsthofer, N. Influence of the Steady Deformation on Numerical Flutter Prediction for Highly Loaded and Flexible Fan Blades. In ASME Turbo Expo 2017: Turbomachinery Technical Conference and Exposition; American Society of Mechanical Engineers: New York, NY, USA, 2017; p. V07BT36A011. [Google Scholar]
  2. Rugg, D. Trends and Issues—Titanium Alloy use in Gas Turbines. 2010. Available online: https://goo.gl/Hxzj6j (accessed on 2 July 2018).
  3. Wilson, M.J.; Imregun, M.; Sayma, A.I. The Effect of Stagger Variability in Gas Turbine Fan Assemblies. J. Turbomach. 2007, 129, 404–411. [Google Scholar] [CrossRef]
  4. Stratford, B.; Newby, D. A New Look at the Generation of Buzz-Saw Noise. In Proceedings of the AIAA 4th Aeroacoustics Conference, Atlanta, GA, USA, 3–5 October 1977; AIAA: Reston, VA, USA, 1977. AIAA Paper 77-1343. [Google Scholar]
  5. Han, F.; Sharma, A.; Paliath, U.; Shieh, C. Multiple Pure Tone Noise Prediction. J. Sound Vib. 2014, 333, 6942–6959. [Google Scholar] [CrossRef]
  6. McAlpine, A.; Fisher, M.; Tester, B. ‘Buzz-Saw’ noise: A Comparison of Measurement with Prediction. J. Sound Vib. 2006, 290, 1202–1233. [Google Scholar] [CrossRef]
  7. Lu, Y.; Green, J.; Vahdati, M.; Stapelfeldt, S.C. Effect of Geometry Variability on Fan Performance and Aeromechanical Characteristics. In Proceedings of the 15th International Symposium on Unsteady Aerodynamics, Aeroacoustics and Aeroelasticity of Turbomachines, Oxford, UK, 24–27 September 2018; pp. 24–27. [Google Scholar]
  8. Stapelfeldt, S.C.; Vahdati, M. On the Importance of Engine-Representative Models for Fan Flutter Predictions. J. Turbomach. 2018, 140, 081005. [Google Scholar] [CrossRef]
  9. Vahdati, M.; Simpson, G.; Imregun, M. Mechanisms for Wide-Chord Fan Blade Flutter. J. Turbomach. 2011, 133, 041029. [Google Scholar] [CrossRef]
  10. Choi, M.; Smith, N.H.; Vahdati, M. Validation of Numerical Simulation for Rotating Stall in A Transonic Fan. J. Turbomach. 2013, 135, 021004. [Google Scholar] [CrossRef]
  11. Stapelfeldt, S.C.; Parry, A.B.; Vahdati, M. Investigation of Flutter Mechanisms of A Contra-Rotating Open Rotor. J. Turbomach. 2016, 138, 051009. [Google Scholar] [CrossRef]
  12. Sayma, A.I.; Vahdati, M.; Sbardella, L.; Imregun, M. Modeling of Three-Dimensional Viscous Compressible Turbomachinery Flows using Unstructured Hybrid Grids. AIAA J. 2000, 38, 945–954. [Google Scholar] [CrossRef]
  13. Spalart, P.; Allmaras, S. A One-Equation Turbulence Model for Aerodynamic Flows. In Proceedings of the 30th Aerospace Sciences Meeting and Exhibit, Reno, NV, USA, 6–9 January 1992; p. 439. [Google Scholar]
  14. Lee, K.; Wilson, M.; Vahdati, M. Numerical Study on Aeroelastic Instability for a Low Speed Fan. In ASME Turbo Expo 2016: Turbomachinery Technical Conference and Exposition; American Society of Mechanical Engineers: New York, NY, USA, 2016; p. V07BT34A006. [Google Scholar]
  15. Sayma, A.; Vahdati, M.; Imregun, M. An Integrated Nonlinear Approach for Turbomachinery Forced Response Prediction. Part I: Formulation. J. Fluids Struct. 2000, 14, 7–101. [Google Scholar] [CrossRef]
  16. Mayorca, M.A. Numerical Methods for Turbomachinery Aeromechanical Predictions. Ph.D. Thesis, KTH Royal Institute of Technology, Stockholm, Sweden, 2011. [Google Scholar]
  17. Calvert, W.; Ginder, R. Transonic Fan and Compressor Design. Proc. Inst. Mech. Eng. Part C J. Mech. Eng. Sci. 1999, 213, 419–436. [Google Scholar] [CrossRef]
  18. Denton, J.D.; Xu, L. The Effects of Lean and Sweep on Transonic Fan Performance. In ASME Turbo Expo 2002: Power for Land, Sea, and Air; American Society of Mechanical Engineers: New York, NY, USA, 2002; pp. 23–32. [Google Scholar] [Green Version]
  19. V. Kaza, K.R.; Kielb, R.E. Flutter and Response of a Mistuned Cascade in Incompressible Flow. AIAA J. 1982, 20, 1120–1127. [Google Scholar] [CrossRef]
  20. Salles, L.; Vahdati, M. Comparison of Two Numerical Algorithms for Computing the Effects of Mistuning of Fan Flutter. In ASME Turbo Expo 2016: Turbomachinery Technical Conference and Exposition; American Society of Mechanical Engineers: New York, NY, USA, 2016; p. V07BT34A0188. [Google Scholar]
  21. Figaschewsky, F.; Kühhorn, A.; Beirow, B.; Nipkau, J.; Giersch, T.; Power, B. Design and Analysis of an Intentional Mistuning Experiment Reducing Flutter Susceptibility and Minimizing Forced Response of a Jet Engine Fan. In ASME Turbo Expo 2017: Turbomachinery Technical Conference and Exposition; American Society of Mechanical Engineers: New York, NY, USA, 2017; p. V07BT36A020. [Google Scholar]
Figure 1. Typical alternate passage divergence (APD) behaviour illustrated through relative tip stagger pattern.
Ijtpp 04 00024 g001
Figure 2. Normalised deflection contour plots for blade from fan 1. (a) First flapwise bending modes. (b) Second flapwise bending mode. (c) First torsional mode. (d) Untwist deflection contour at peak efficiency condition.
Ijtpp 04 00024 g002
Figure 3. Computation domains for the two fans. Meridional view. Not to scale.
Ijtpp 04 00024 g003
Figure 4. Three types of flow regimes on a constant speed line. Aeromechanical data from fan 1 are presented.
Ijtpp 04 00024 g004
Figure 5. Schematic diagram illustrating the passage shock displacement at blade tip under APD condition.
Ijtpp 04 00024 g005
Figure 6. Fan 2’s APD behaviour shown in term of relative tip stagger history (first 13 blades).
Ijtpp 04 00024 g006
Figure 7. APD strength map comparison.
Ijtpp 04 00024 g007
Figure 8. Covered Passage Geometry for nominal blade geometry.
Ijtpp 04 00024 g008
Figure 9. Pressure distribution at blade tips after a full annulus calculation (the worst APD case on the design speed line). (a) Pressure distribution changes on Fan 1. (b) Pressure distribution changes on Fan 2. Direction of rotation is represented by descending blade numbers. Blade 4 is initially mis-staggered.
Ijtpp 04 00024 g009
Figure 10. Relative shock displacement and its second derivative. The data are from fan 1’s design speed cases.
Ijtpp 04 00024 g010
Figure 11. Effect of mistuning on running geometry. (a) Initial mistuning pattern. (b) Resulting tip stagger pattern. (c) Fourier decomposition of the patterns. A mistuned system (frequency mistuning on mode 1) could results in alternating tip stagger from a perfectly symmetrical initial geometry.
Ijtpp 04 00024 g011
Table 1. Comparison of fan parameters.
Fan 1Fan 2
Aspect Ratio (Blade Height/Mid-Span Chord)2.02.3
By-Pass Ratio8–125–7
Number of Blades1826
Tip Stagger Angle63–68 ° 65–70 °

