1. Introduction
Modern gas turbines operate at high temperatures that exceed the endurance limit of the material, and therefore the turbine components are cooled by air taken from the compressor. The cooling provides a positive impact on the lifetime of a gas turbine (GT) but has a negative impact on its overall performance.
The cooling air bypasses the combustor and therefore provides less work in the turbine than the hot gas due to the lower enthalpy. Moreover, in multistage turbines this coolant provides less work as it is ejected further downstream of the flow path. However, the injection of cooling air has also a secondary effect—an increase in aerodynamic losses.
The aerodynamic losses in turbines have been intensively investigated since the middle of the 20th century. Different types of losses were identified (e.g., friction losses, trailing edge losses, secondary losses, etc.), and several correlations were proposed for each loss type. The results of these investigations have been published in numerous papers and books, with [
1,
2,
3,
4,
5,
6,
7,
8,
9,
10] representing the most frequently cited works.
One source of losses is cooling; its impact on turbine aerodynamic is twofold. Firstly, cooling requirements lead to restrictions on the blade shape, the most important factor being the limitation of the trailing edge size. To ensure cooling air injection, the blade should have a slot or holes at the trailing edge, and therefore the trailing edge thickness cannot be reduced according to aerodynamic requirements. This feature causes additional losses. Secondly, coolant injection disturbs the main flow and may lead to increased losses. As the coolant is mixed with the main flow, these losses are called mixing losses. The models for these losses are presented in [
2,
5,
7,
8,
9,
10,
11,
12,
13].
Many researchers investigated the trailing edge losses without cooling air injection (e.g., [
1,
2,
3,
4,
6,
14,
15,
16,
17,
18,
19,
20,
21,
22,
23,
24,
25,
26,
27]). Basically, these studies show that the direct way of trailing edge loss reduction is the application of thin trailing edges, which may be not applicable to the cooled blades.
However, few reports in the open literature have already pointed out that trailing edge thickness reduction is not the only way to achieve a reduction in the trailing edge loss. Chao Zhou et al. [
21] examined the effect of the trailing edge thickness on losses in ultra-high lift turbine blades. These blades had a significant unguided turning angle that allowed a profile loss reduction even with a thicker trailing edge. Granovskiy et al. [
22] reduced profile loss in a transonic vane by the suction surface curvature redistribution. Vagnoli et al. [
23] demonstrated the evolution of the trailing edge base pressure as function of the downstream Mach number (M) on the basis of the highly unsteady character of the near wake flow, which directly affects the trailing edge base pressure. Yoon et al. [
24] showed that for uncooled last turbine stages rotor trailing edge (TE) losses represent 44% of the total losses. For the cooled turbine stage, the figures are certainly different, but in any case the fraction of the TE losses will be significant.
In the present work the results of a combined experimental and numerical investigation of the effect of the unguided turning angle, TE shape, and coolant flow injection through the trailing edge on transonic cooled blade losses are presented.
To understand the effect of the unguided turning angle and TE shape, four linear vane cascades and three blade cascades were tested in a transonic wind tunnel over a wide range of exit Mach numbers (M2is = 0.7–1.2). A numerical study of these cascades has been carried out using the commercial code Fluent. Four vane cascades consist of blades having nearly the same profile and about the same basic geometric cascade parameters but differ from each other as regards the value of the unguided turning angle. Three blade cascades correspond to the tip, mean, and hub sections of a real cooled blade with two kinds of TE shapes.
To understand the impact of the trailing edge injection, one of the three vane cascades and a blade cascade were tested and numerically simulated at different flow rates of injected air.
2. Experimental and Numerical Procedures
2.1. Experimental Setup
Large-scale plane cascades were tested in a transonic wind tunnel. The air from the atmosphere is sucked through the test section, and therefore the inlet total pressure and total temperature correspond to ambient conditions (typically P0 ≈ 1.013 bar, T0 ≈ 295 K). Inlet turbulence intensity (Tu) was maintained at the level Tu = 0.02–0.06. The exit Mach number (M2is) varies in the range M2is = 0.67–1.12, and the Reynolds number (Re = c2isL/ν) based on profile true chord length varies in the range Re = (0.5–0.8) × 106.
The air injected through the trailing edge is supplied by a separate high pressure line. For simplicity this air is called cooling air, although it does not have a cooling function in these tests. More details on this rig can be found in [
5,
20]. The mass flow of injected air varied in the range 0 <
< 7%, where
is the ratio of injected air mass flow to the main mass flow.
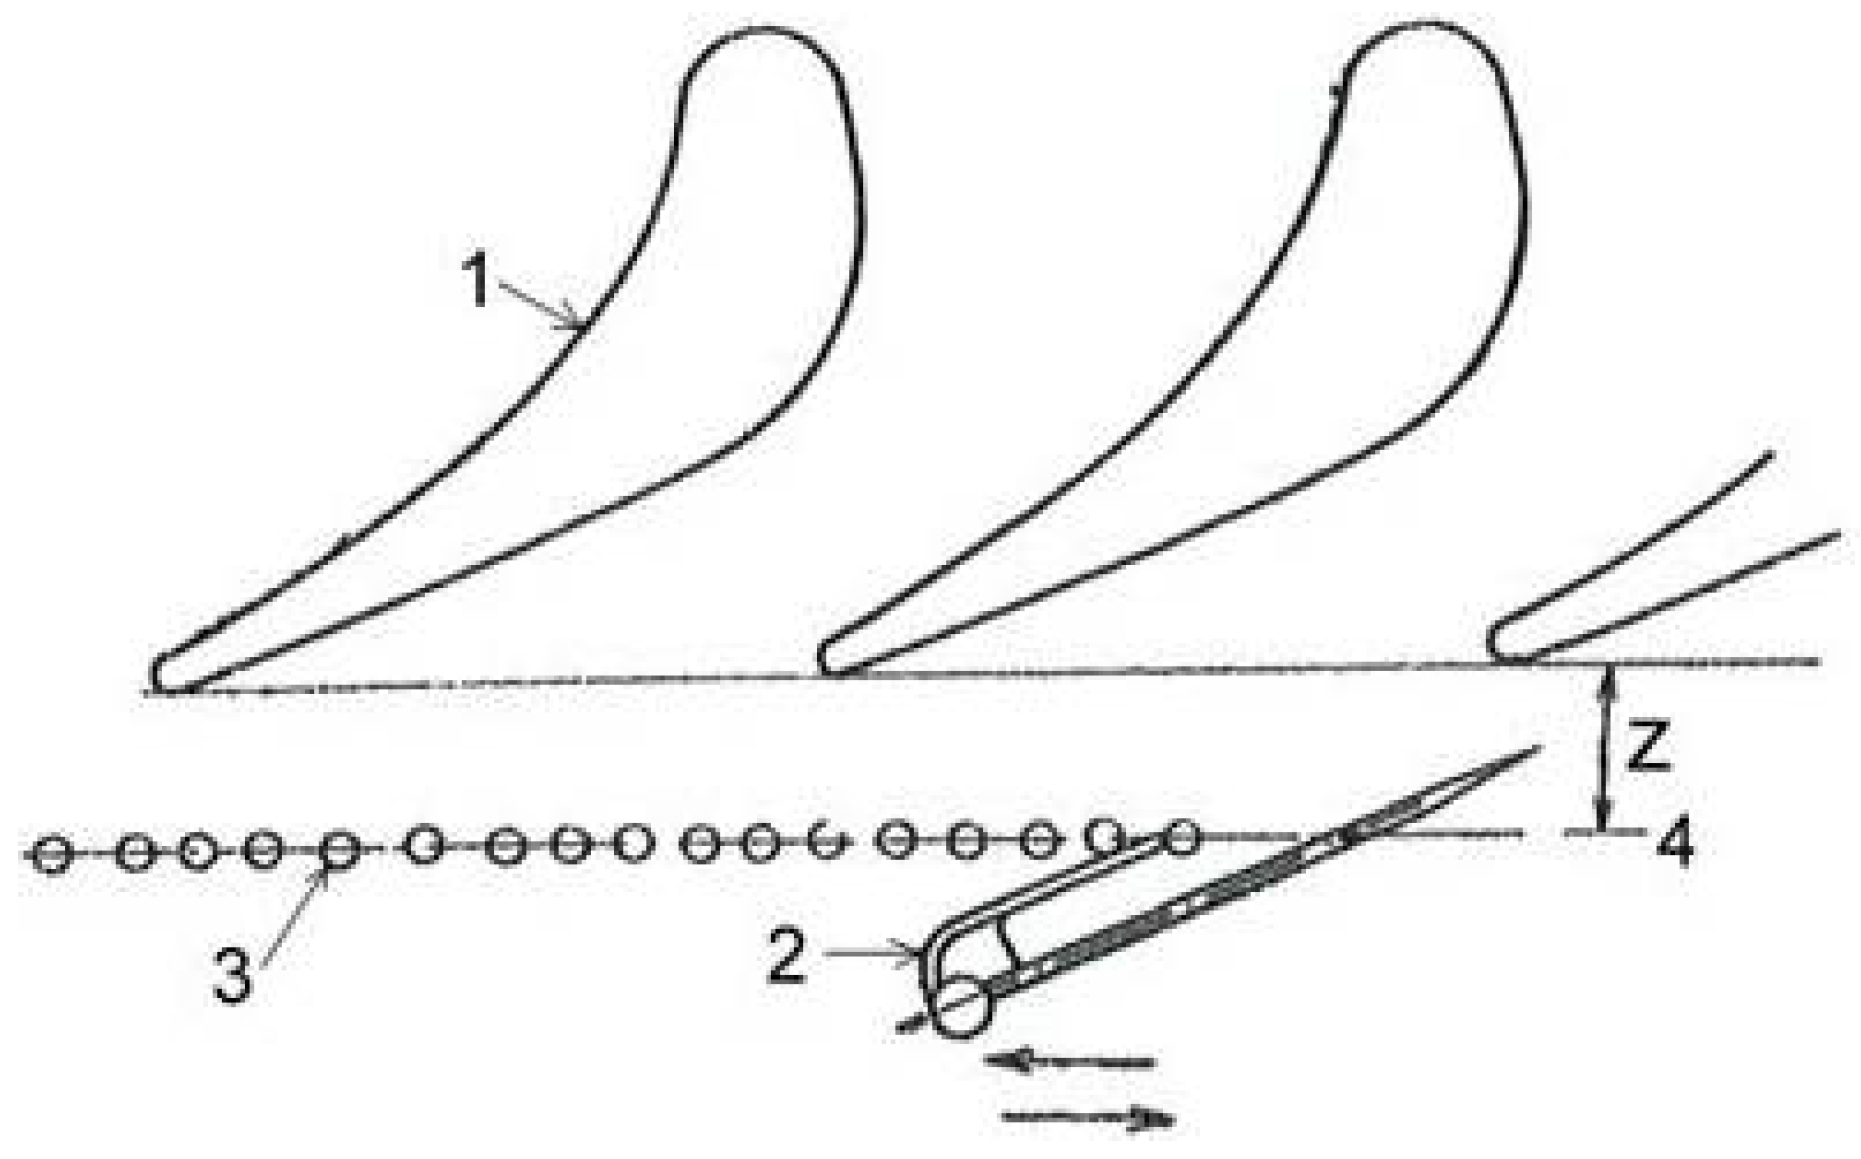
The experimental cascades consist of seven to nine aerofoils with height h = 125 mm. Basic geometric parameters of cascades are illustrated in
Figure 1.
The true chord length (L) varies in the range L = 50–90 mm (L depends on the type of aerofoil). The boundary layer accumulated on the walls of the test rig upstream of a test section is cut off by special expansion plates located near the endwalls of the cascade. The cooling air is injected through the simple slot in the trailing edge characterized by one parameter—width, Δ.
The total and static pressure distributions downstream of cascade are measured using a combined probe and pressure taps located at distance z behind the trailing edge. The relative value throat width/ distance between cascade and measurement plane (z/a
2) is in the range 0.3–1.5 (depending on throat size). The positioning of measurement planes is shown in
Figure 2.
The combined probe comprises a needle probe to measure the static pressure and, distant from it, a three-hole probe with a central hole for measuring the total pressure and the adjacent holes, angled at 45°, for the flow angle measurement. The probe can be positioned in different axial planes, and the pressure distributions are obtained by traversing the probe along the cascade. The static pressure distribution in front of the cascade is measured by 20–30 static taps located at a distance (1.5–2.0) a2 upstream of the leading edge. The static pressure distribution along the aerofoil and the base pressure on the trailing edge are measured by the static pressure taps at the midspan section. Traversing of flow in spanwise direction showed that total and static pressure distributions are uniform within half a span around the midspan position, and therefore the flow at the midspan can be considered as two-dimensional (2D). Traversing in tangential direction showed that the flow is periodic over at least three aerofoils at the middle of the cascade.
The accuracy of total and static pressure (P) measurements was estimated as follows: δP01 ≈ 0.14%, δP02 ≈ 0.25%, δP2 ≈ 0.5% at M2is = 0.82–1.3. Moreover, before every test a calibration of the probes was performed.
The mass flow rate of injected cooling air is measured by an orifice. The total pressure and temperature of injected air are measured in the supply line, and these parameters are practically the same at the injection point, since there are no cooling channels inside the aerofoil, just a hollow cavity with negligible losses.
Based on these measurements, the profile losses (Loos) are calculated using the following expressions (see e.g., [
12]):
Here V2is is the isentropic velocity of the main air (i.e., the velocity the air would have after expansion to pressure P2 without losses), Vcis is the isentropic velocity of the cooling air, V2 is the actual flow velocity at the cascade outlet, κ is the ratio of specific heats, and is the relative mass flow of cooling air. This expression is valid if the total parameters of cooling air are the same at all injection points, and therefore is valid in cases with a single injection slot considered in this work. If the total parameters at different injection locations are different, this expression should be modified appropriately.
The velocity at the outlet is related to the total pressure and temperature by the relationship
In cases without injection (
= 0) the Equation (1) can be reduced to
In cases without injections, the base pressure coefficient (C
pb) is calculated using the following expression:
Here
Pb the base pressure and
P2av averaged exit static pressure. This parameter, C
pb, characterizes the separation and wake width, and therefore is correlated with losses as shown in [
22]. The isentropic Mach number is derived from the equation
2.2. Numerical Model
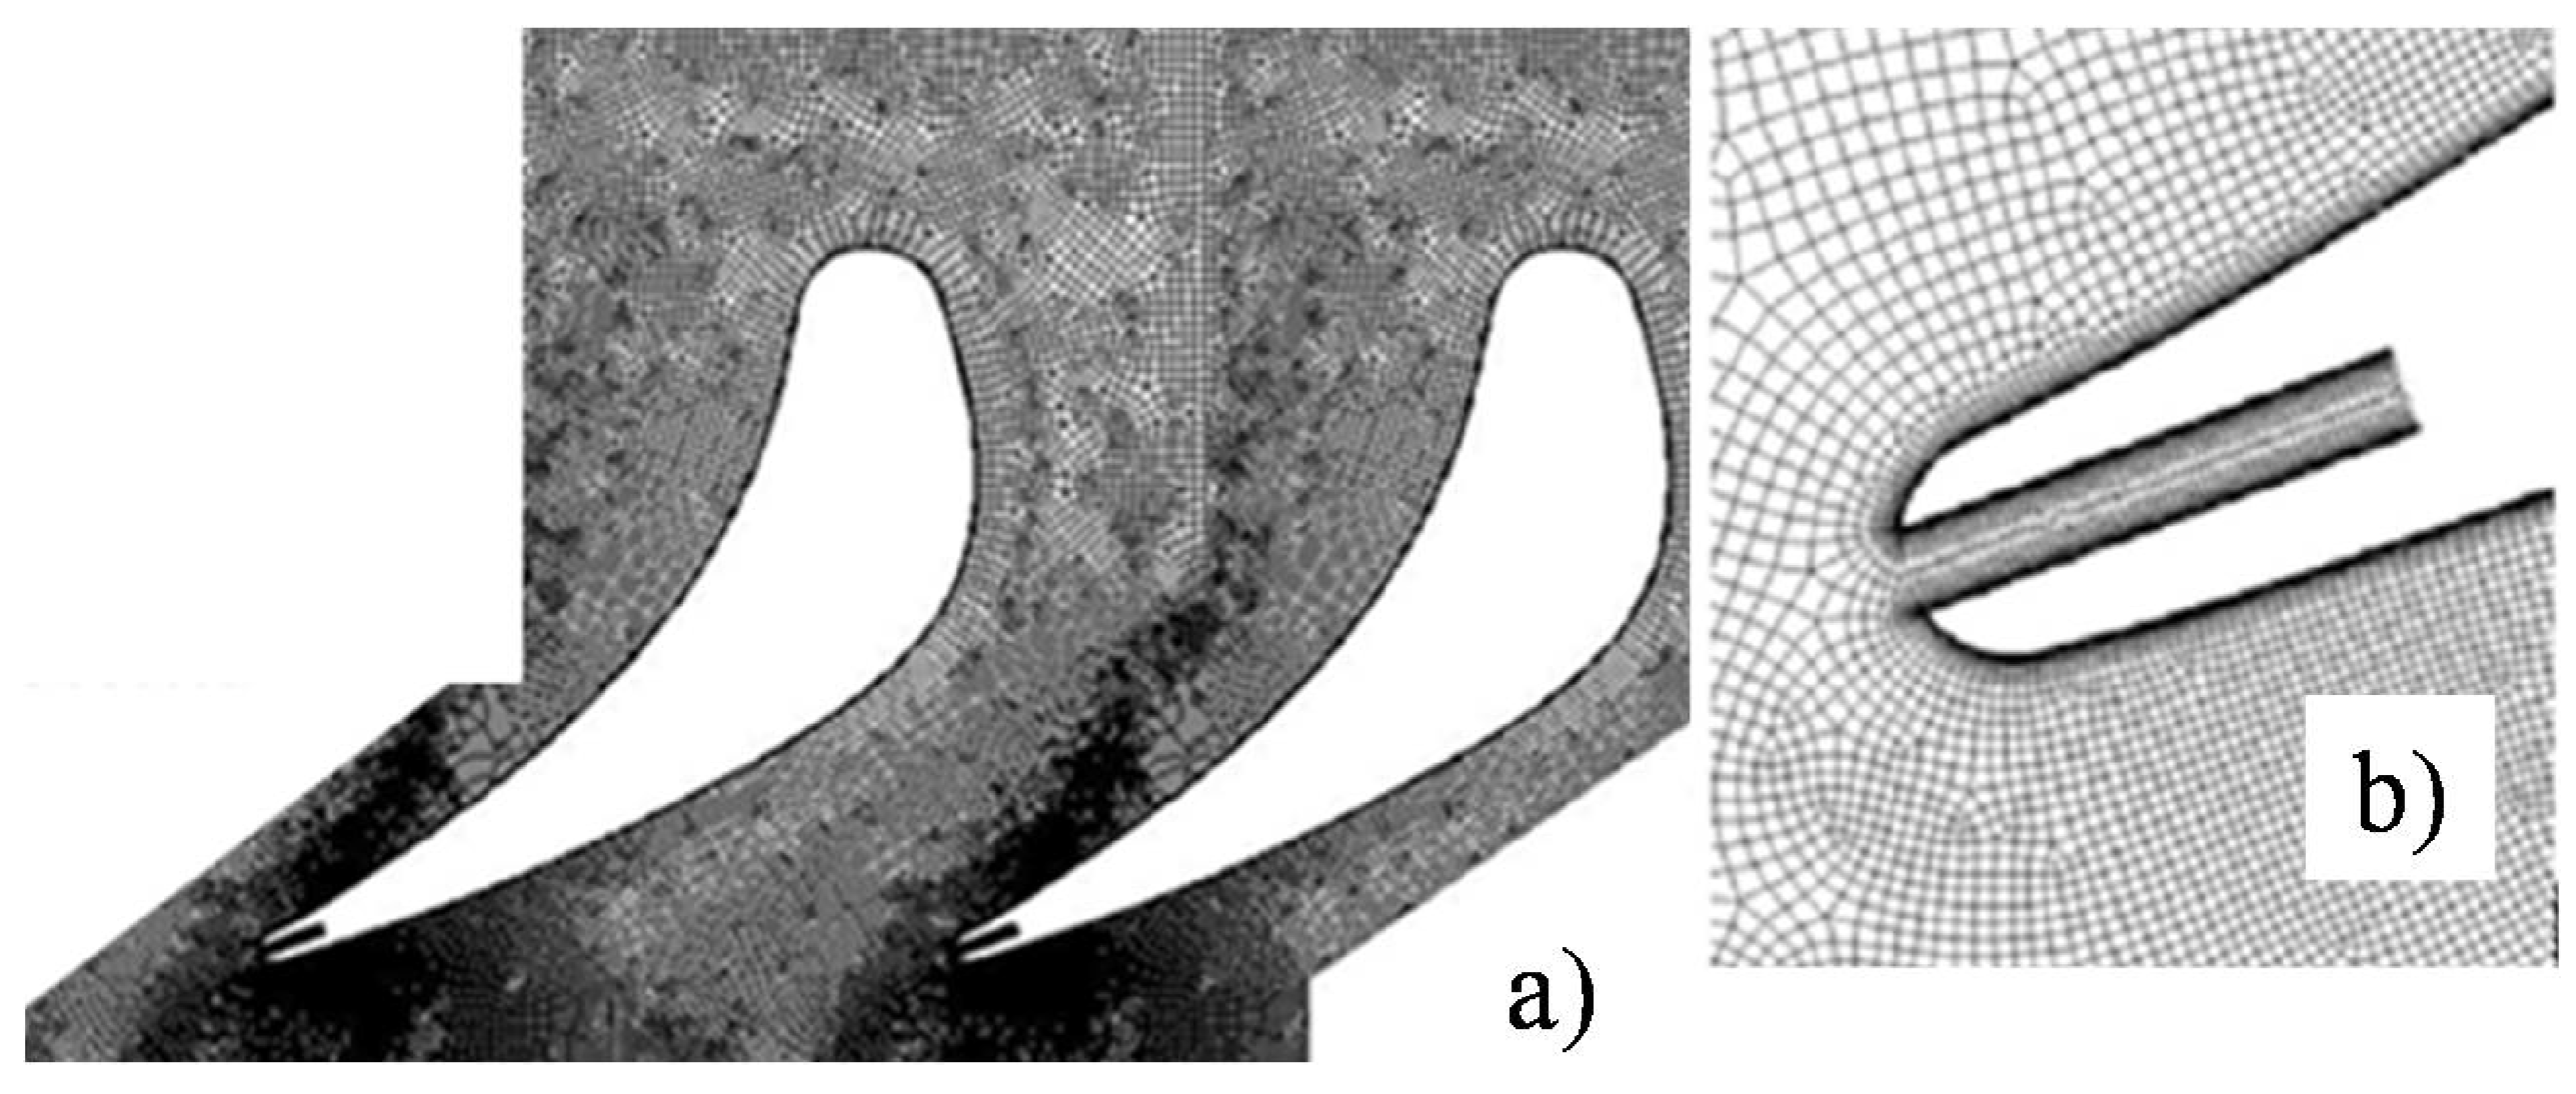
The numerical simulations were performed using the commercial solver Fluent (ANSYS, Canonsburg, PA, US). Calculations were conducted over a period of several years, so different versions of Fluent were used. In most cases Fluent version 14.5 (ANSYS) was used. The calculations are done at the mid span, and the flow is assumed to be 2D and periodic in a spanwise direction. The unstructured numerical mesh was generated using the commercial code Gambit.
Figure 3a shows this mesh, which contains 50,000 cells. The mesh is stretched within the boundary layer according to the exponential law, and the value of the numerical accuracy criterium (y+) in the first cell on the wall is below 1. The mesh behind the trailing edge is also refined to resolve the shocks at supersonic exit conditions.
In calculations with injection, the exit part of the slot is included in the domain, as shown in
Figure 3b. Calculations without injections were done using two meshes: (1) unstructured mesh described above, where the slot is present but not active; and (2) structured mesh without slot. The latter has value of y+ in the first cell on the wall below 1, but has two times less cells outside boundary layer. Nevertheless, the results obtained on both meshes are close to each other and in the following discussion only the data for the unstructured mesh are shown.
The turbulence was simulated using the k-ε realizable turbulence model. The turbulence intensity at the inlet equals experimental value Tu = 0.02.
In all cases considered, the flow at the cascade inlet is assumed to be uniform and axial, with a constant total pressure and temperature. At the cascade outlet the static pressure is specified (according to Equation (5) it is equivalent to the specified isentropic exit Mach number). The no-slip conditions are applied on the solid walls. The walls are considered adiabatic in the calculations without injection and with cold air injection.
In cases with injection, the total temperature and mass flow of injected air are prescribed at the inlet of the slot.
3. Unguided Turning Angle
The influence of the unguided turning angle (δ) on the base pressure and losses was studied using four vane cascades with about the same basic geometric parameters except for the angle δ. These basic parameters of the investigated cascades are presented in
Table 1. This shows that all cascades have exactly the same pitch to chord length ratio t/L = 0.734 and approximately the same ratio of trailing edge thickness to throat width d
2/a
2 = 0.115.
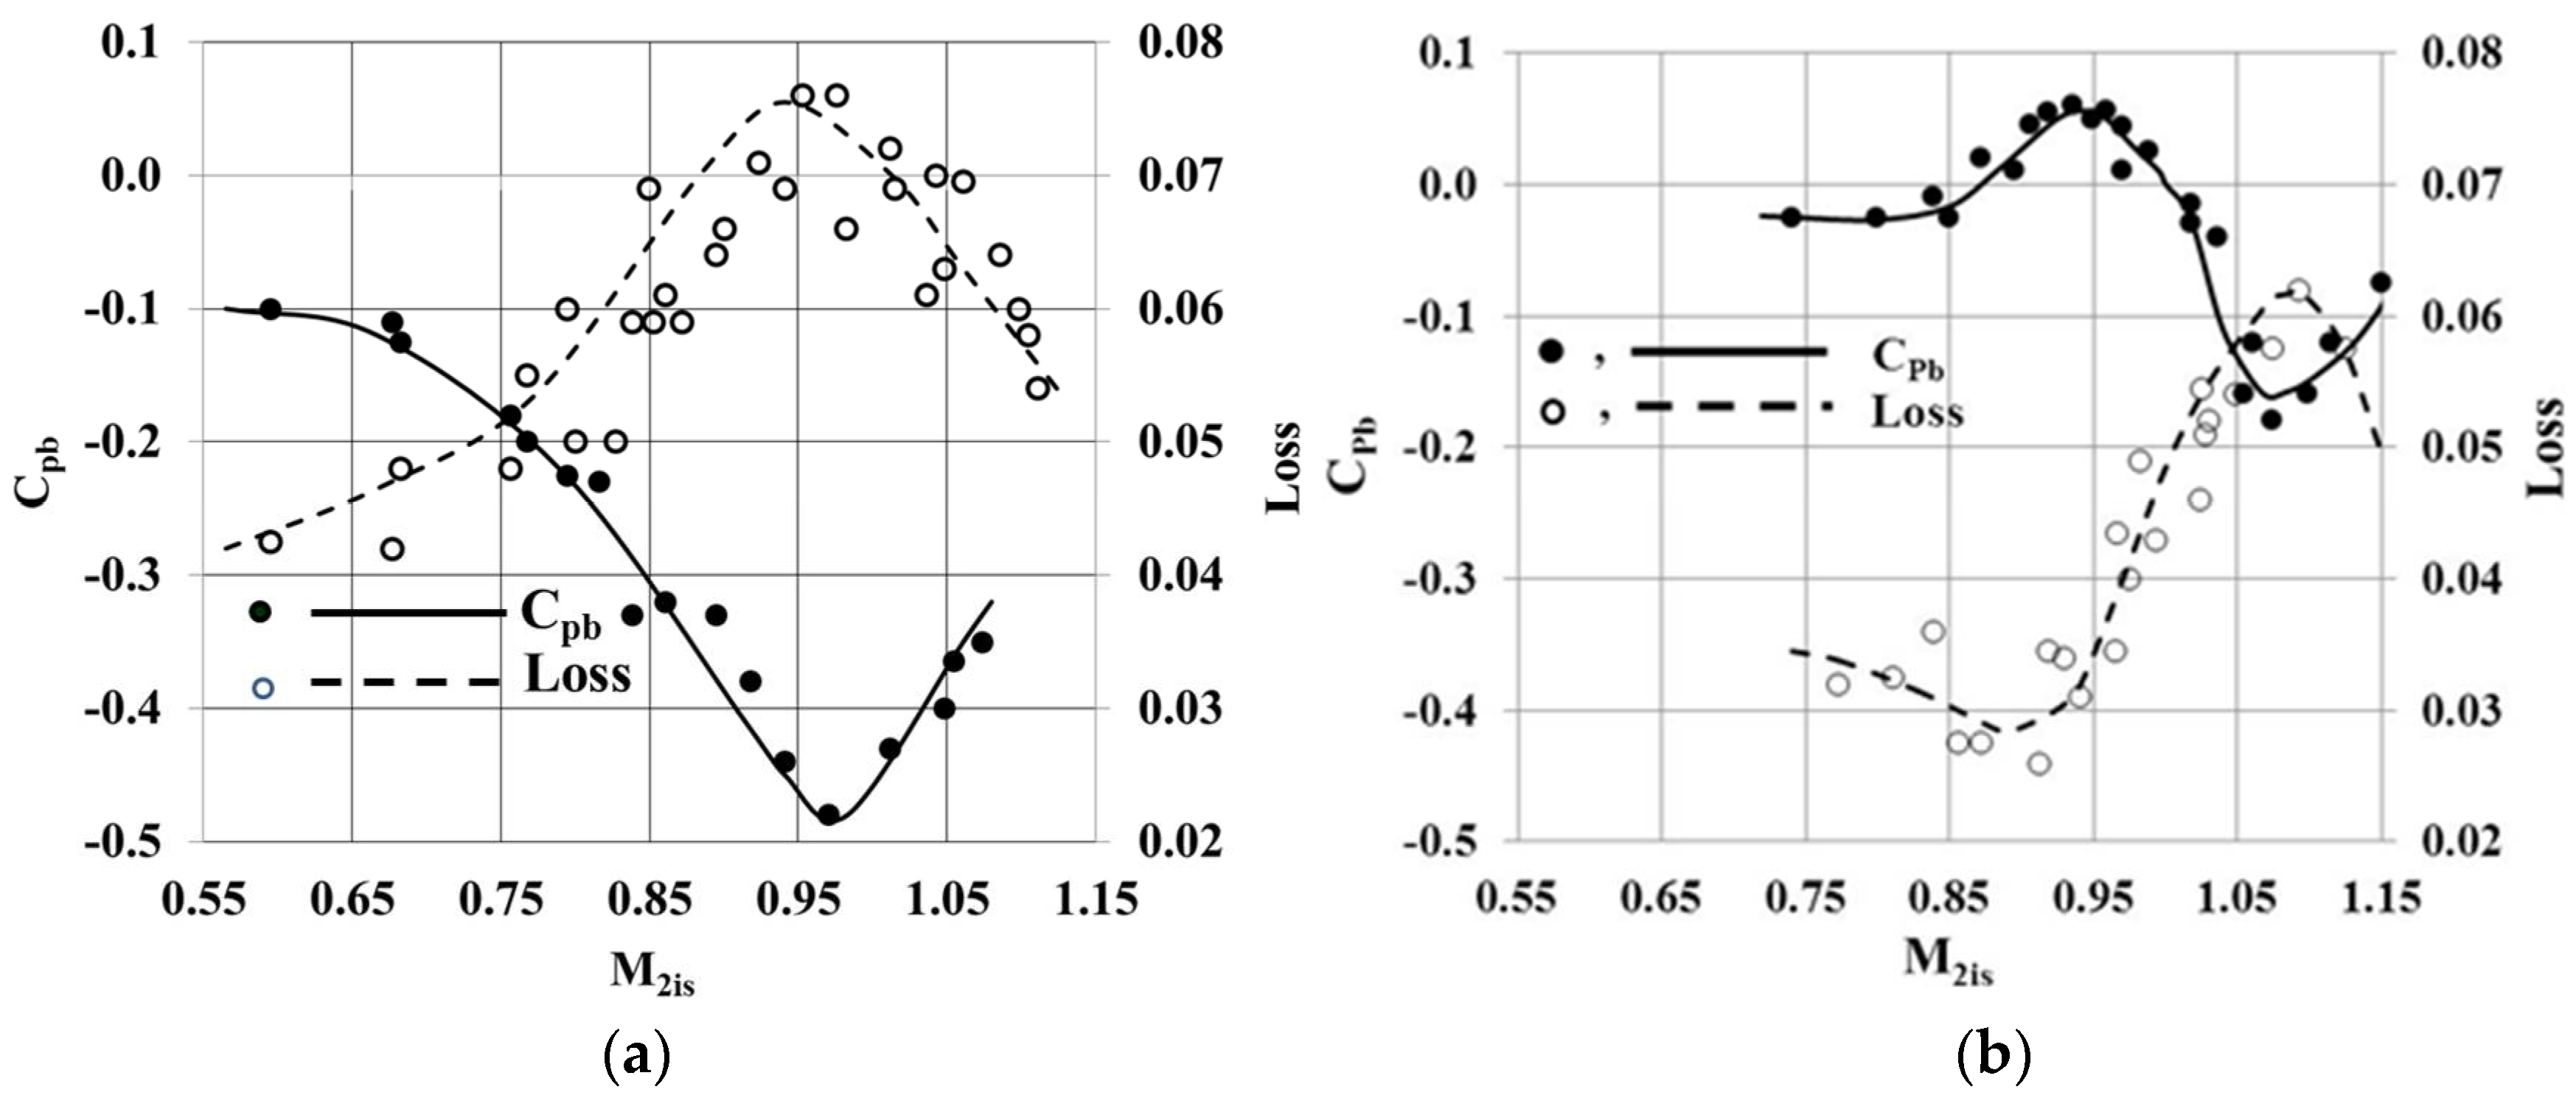
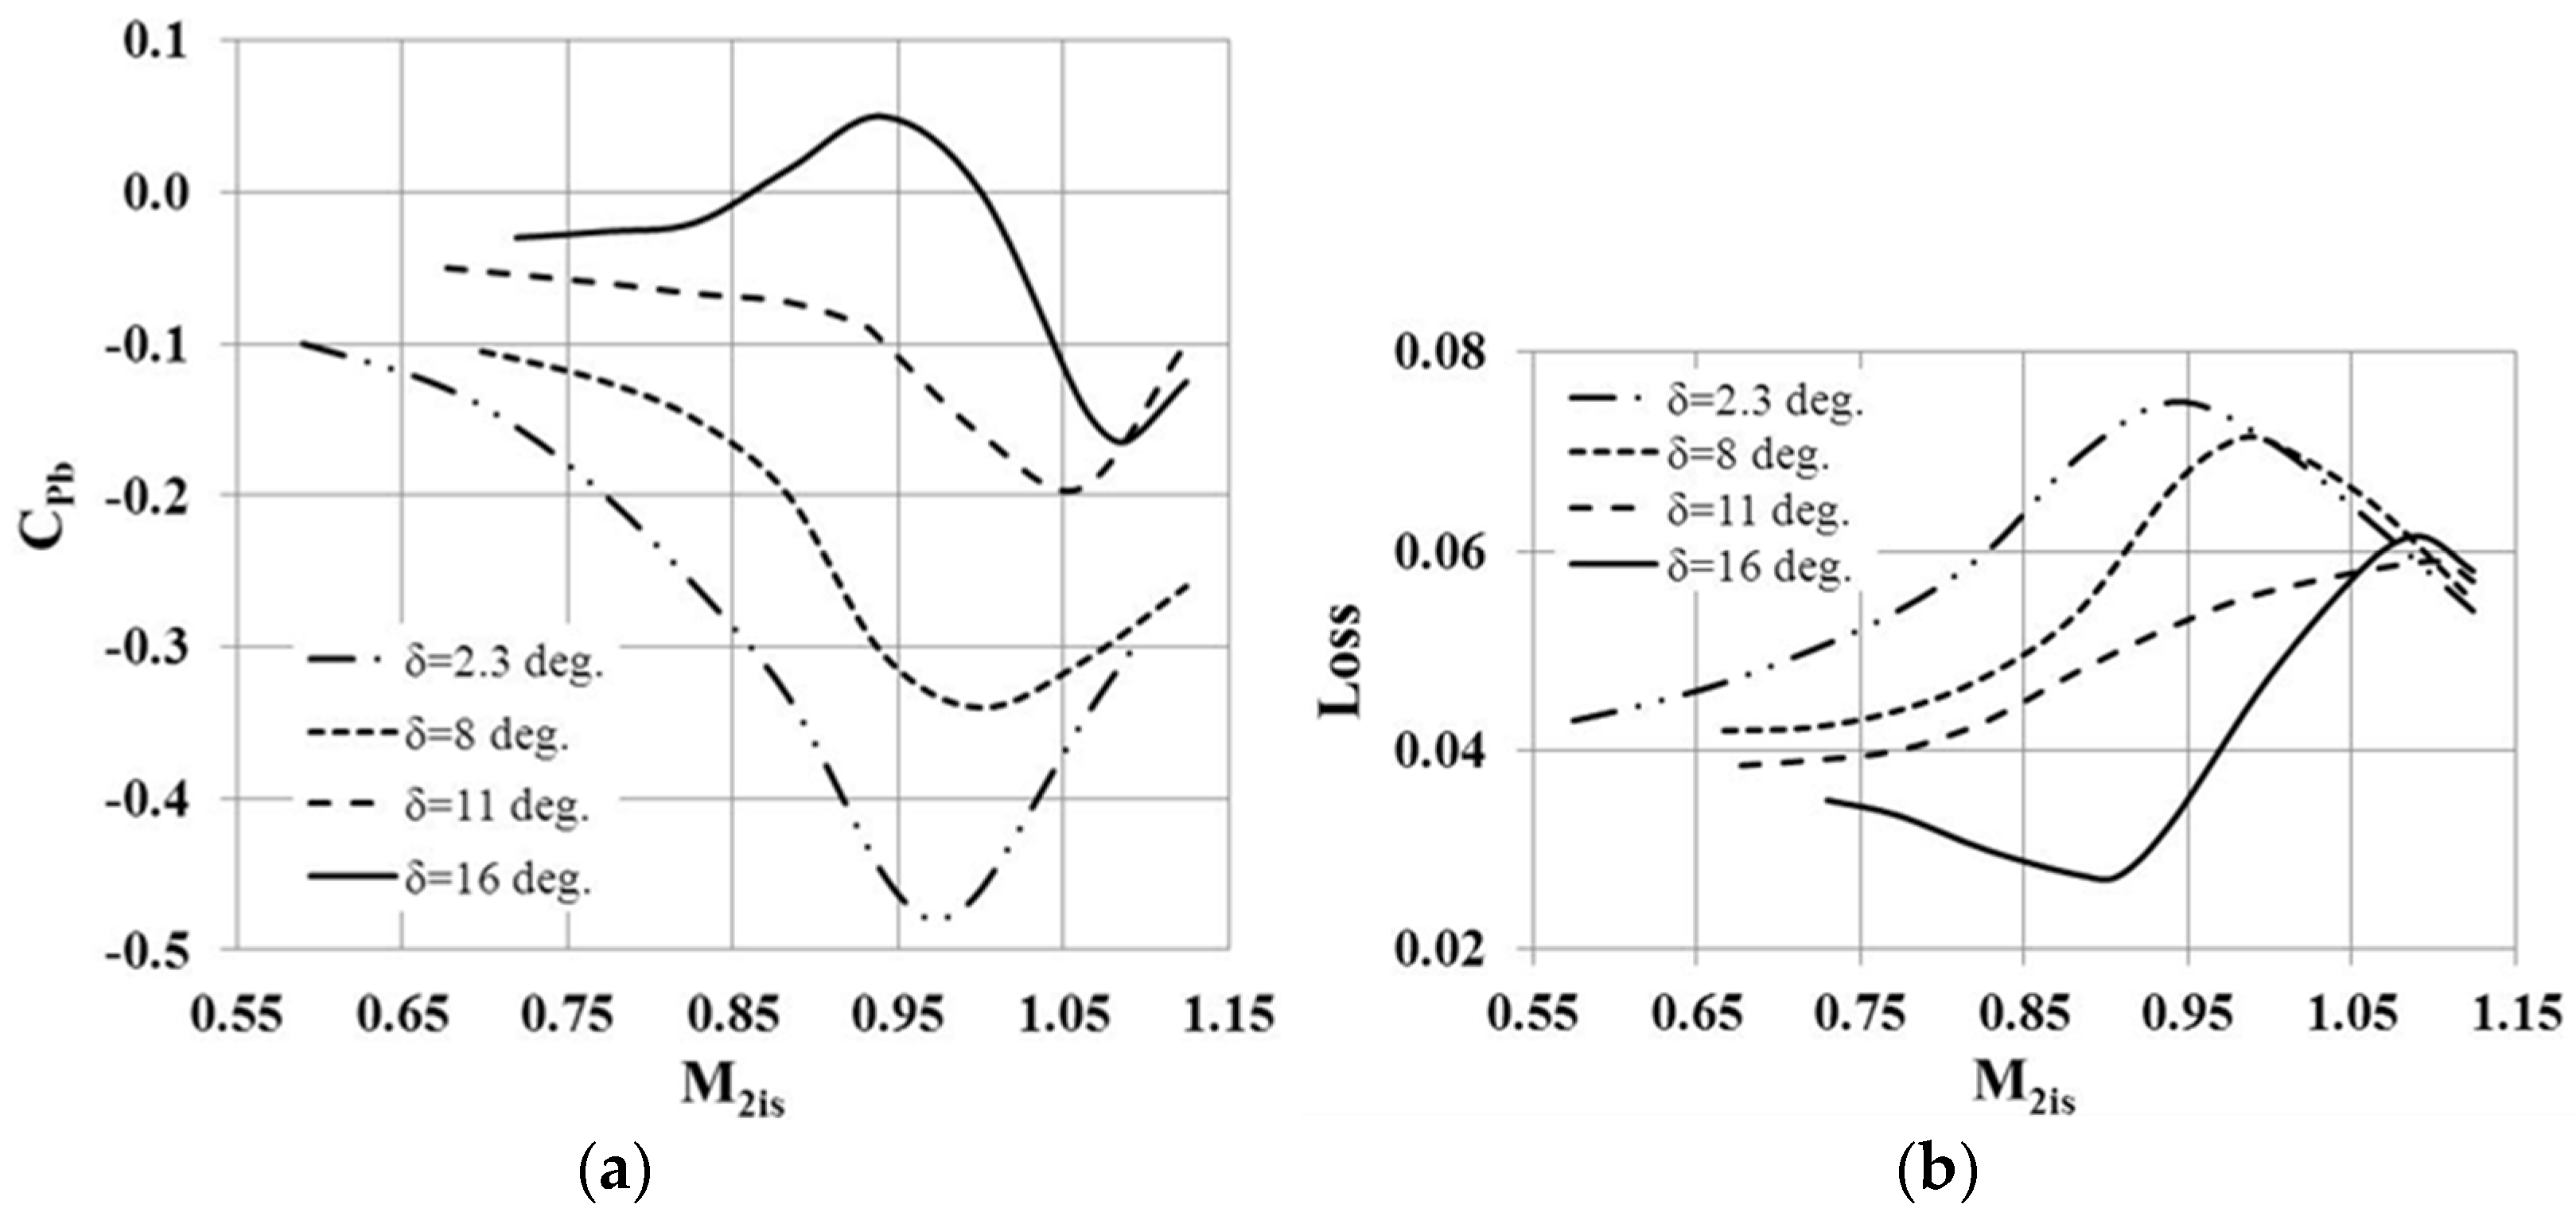
Figure 4 shows the measured profile loss and base pressure coefficient as functions of the exit Mach number for Cascade 1 and Cascade 4. There is a correlation between the base pressure coefficient and profile losses. In Cascade 1 (see
Figure 4a), with practically a flat suction surface after the throat (δ = 2.3°), the base pressure coefficient decreases from C
pb = −0.1 to C
pb = −0.49 over the exit Mach number range 0.6–0.98. At the same time, the profile loss increases from Loss = 0.043 to Loss = 0.075. At M
2is = 0.98 the base pressure coefficient reaches the minimum and the profile loss is at its maximum.
Figure 4b shows the measured profile loss and base pressure coefficient as functions of the exit Mach number for Cascade 4 with a maximal unguided turning angle of δ = 15.9°. In this case the base pressure coefficient increases from values close to zero to positive values C
pb > 0 and the profile loss goes down over the exit Mach number range 0.72–0.94. Over the range of M
2is = 0.94–1.1 the base pressure coefficient decreases and the profile loss grows.
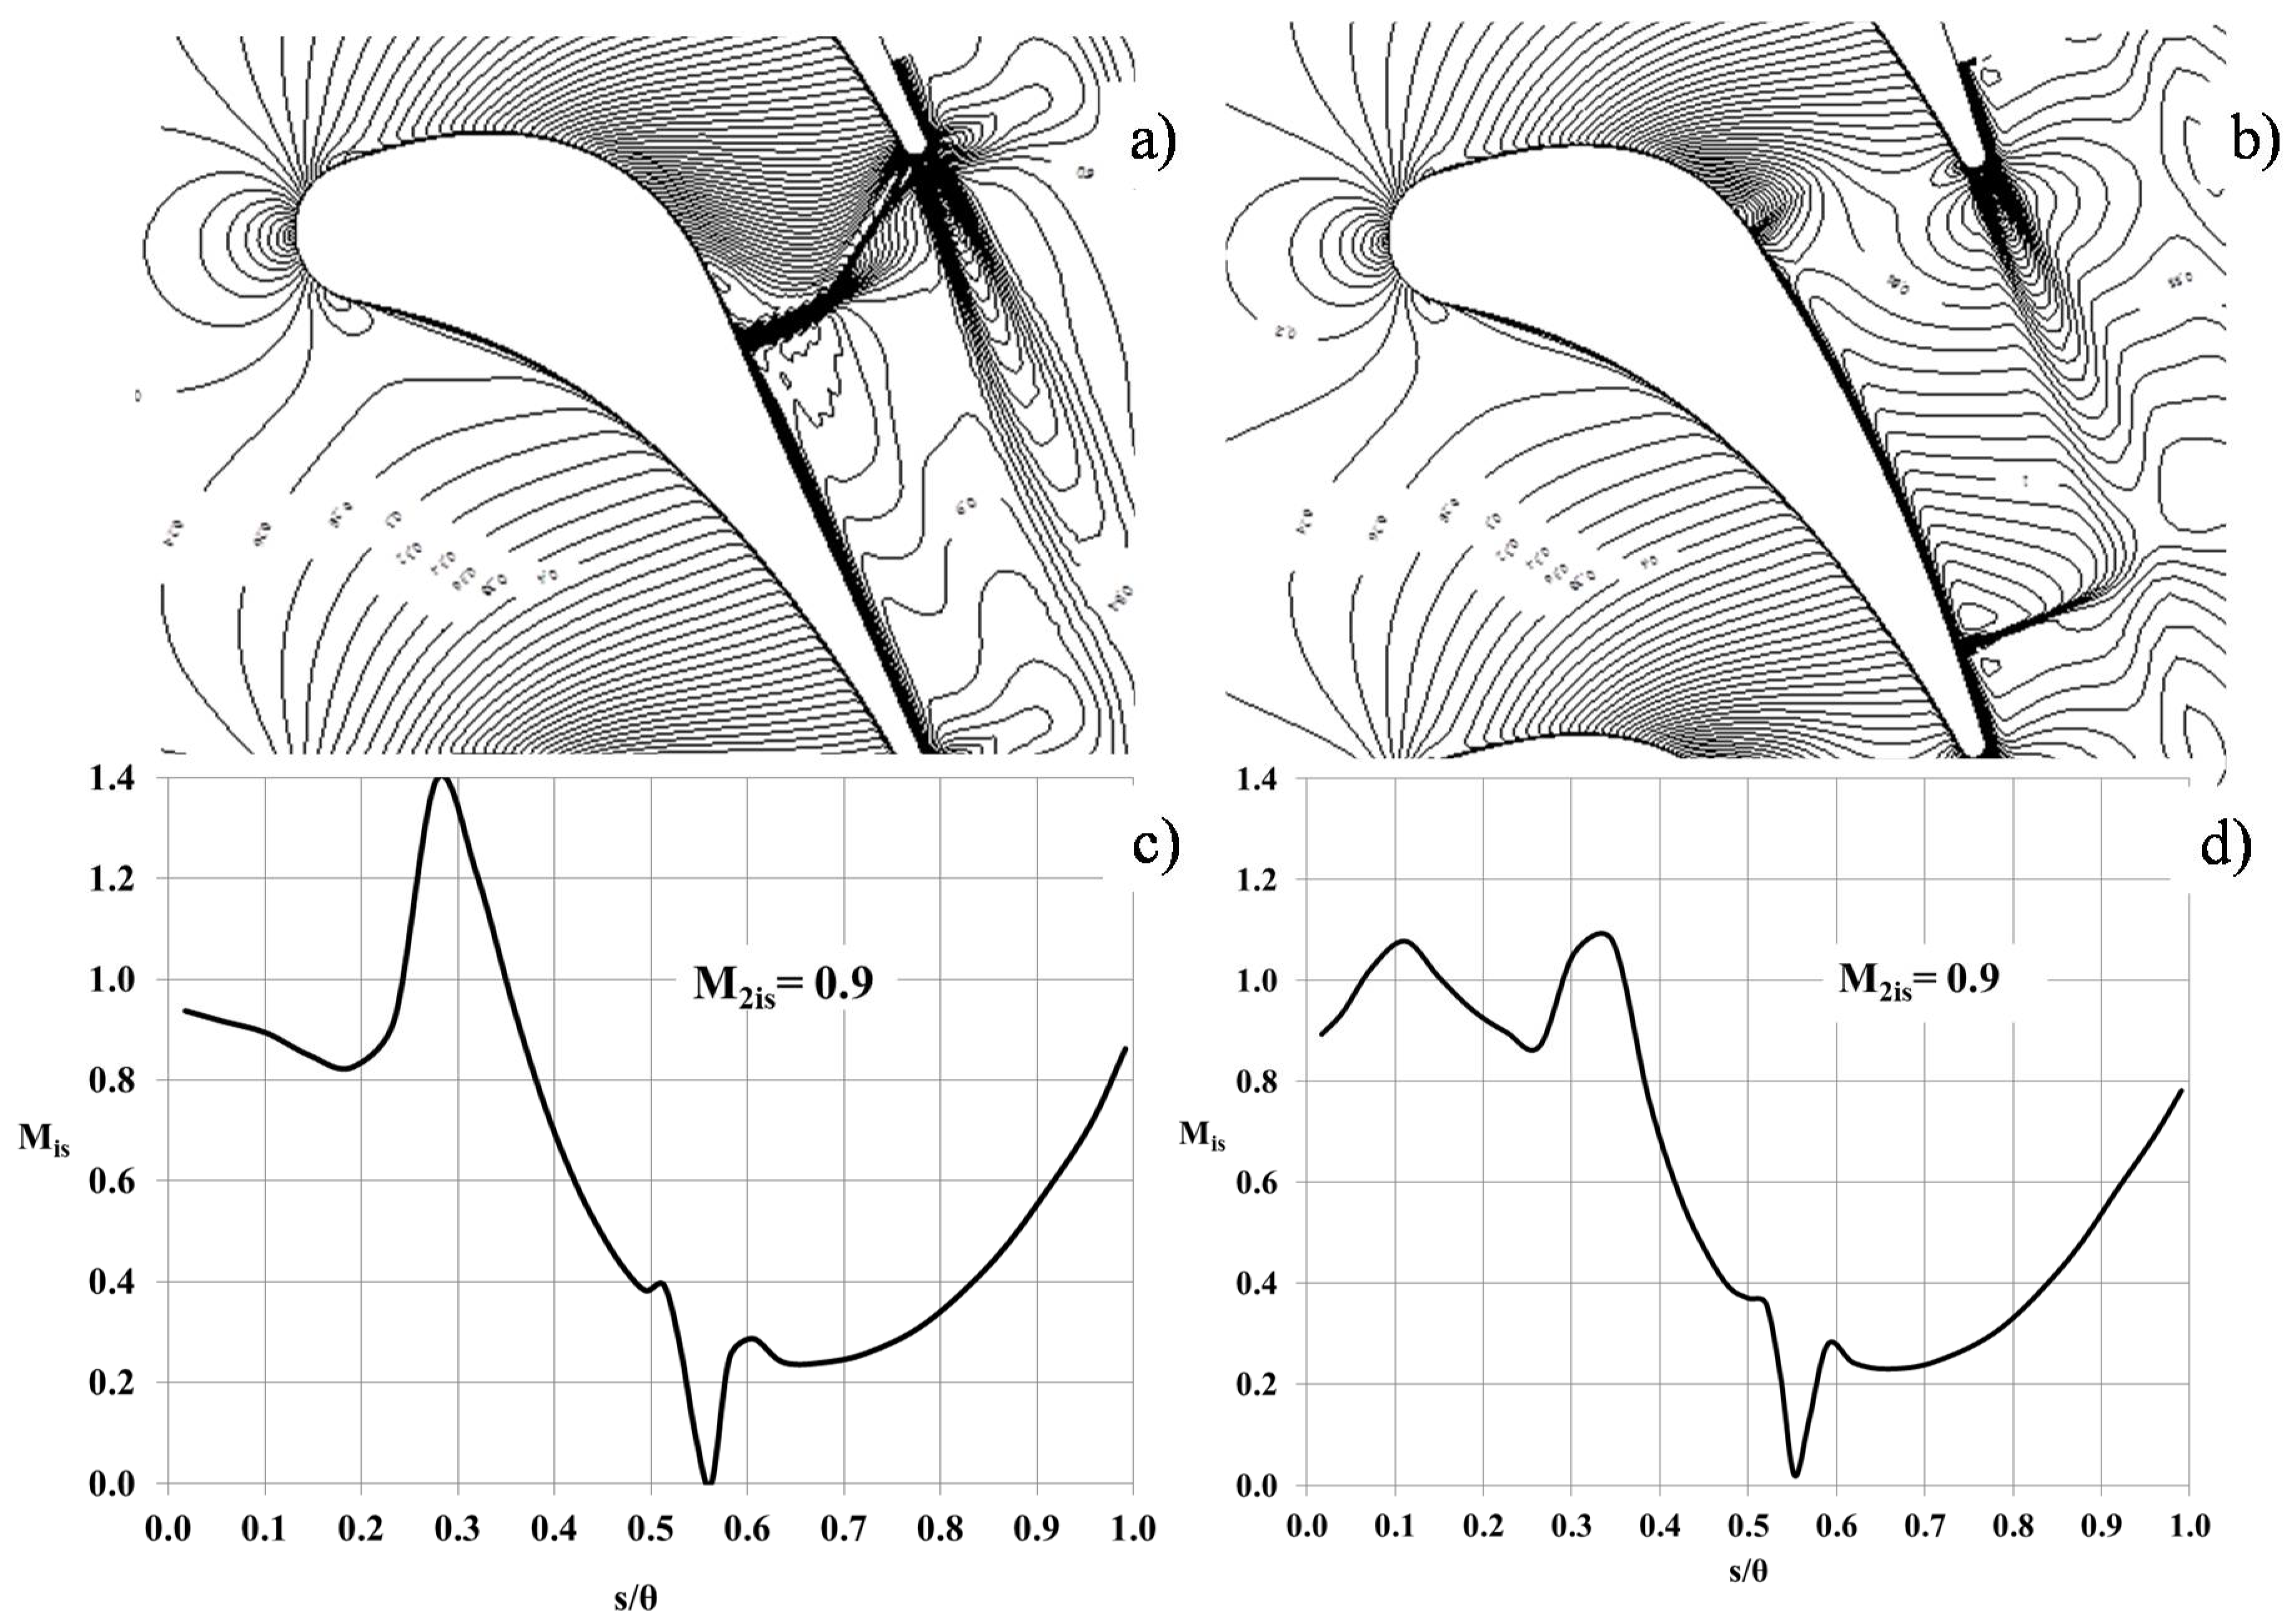
The calculated flow structure (isolines of Mach number) and the surface isentropic Mach number distributions for Cascade 1 and Cascade 4 are presented in
Figure 5. The data, which correspond to the same exit Mach number (M
2is = 0.9), illustrate the change of the flow structure with variation in the unguided turning angle. The Mach distributions in
Figure 5a,b show that with an increase of δ the throat shock strength is significantly reduced. That is also seen in
Figure 5c,d. As a result, the thickness of the boundary layer on the suction surface is reduced as well. In Cascade 1 on the suction surface (SS) the significant flow acceleration up to the throat is terminated by a strong shock. After this shock the flow starts accelerating again up to the TE, where the local Mach number becomes Mis = 1.0. This is followed by a Prandtl–Meyer expansion around the thick TE. This expansion fan on the SS near TE is seen in
Figure 5a. Thus the flow leaves the profile with a high velocity, which leads a decrease of the base pressure by up to Cpb = −0.4 and an increase in profile losses up to Loss = 0.072 in Cascade 1.
A different flow pattern is observed in Cascade 4. On the SS, after a weak second shock, the flow continues the deceleration up to TE and the pressure downstream of the TE becomes higher than the averaged static pressure downstream of Cascade 4. Therefore, the base pressure coefficient becomes Cpb > 0 and the loss reaches a minimum at M2is = 0.9. Moreover, in Cascade 1 the interaction of the shock on the pressure surface (PS) with the wake leads to a much thicker wake than in Cascade 4 (this feature can be seen in
Figure 5a,b). At the same exit Mach number, similar changes in flow structure were observed, also in the medium range of the unguided turning angle (Cascades 2 and 3), although they are less pronounced. Similar variations of flow structure are also observed at a lower transonic Mach number (M2is = 0.8). At the supersonic exit Mach number the influence of the unguided turning angle is reduced, and the flow structures in all variants are similar to those in Cascade 1.
Similar experimental and numerical results have been obtained for various cooled vanes and blades with thick trailing edges over the transonic range of exit Mach number M2is. These results motivated a change of design philosophy for cooled blade design at the exit Mach number M2is = 0.8−1.1. In particular, an aft-loaded approach with an increased value of the unguided turning angle is preferable to the traditional approach, where for blades with thin trailing edges decreased values of unguided turning angle have been recommended at the transonic range. However, in this case it is necessary to check the behavior of the friction coefficient to avoid the flow separation, especially at a low Reynolds number. The friction coefficient has to be cf > 0.
The results of the base pressure coefficient and profile loss measurements for all vane cascades listed in
Table 1 are summarized in
Figure 6. In order to make this chart easier to read, only the trend lines are presented and the measured points are not indicated.
Figure 6a shows that the base pressure coefficient is a non-monotonic function of the exit Mach number and in each variant it has a minimum. The point of minimum moves from M
2is = 0.98 in Cascade 1 (δ = 2.3°) to M
2is = 1.1 in variant 4 (δ = 15.9°). The comparison of the base pressure coefficient for different variants shows that in the transonic range (M
2is = 0.77–1.12) and with a constant value of the relative trailing edge thickness (d
2/a
2 = 0.115) the base pressure coefficient C
pb strongly depends on the unguided turning angle (i.e., it depends on the curvature of SS after the throat).
Thus, the test data show that in the transonic range (M2is = 0.77–1.0) an increase in the vane unguided turning angle causes an increase in the base pressure coefficient (it can become positive Cpb > 0) and a reduction of the profile losses by 3–4%.
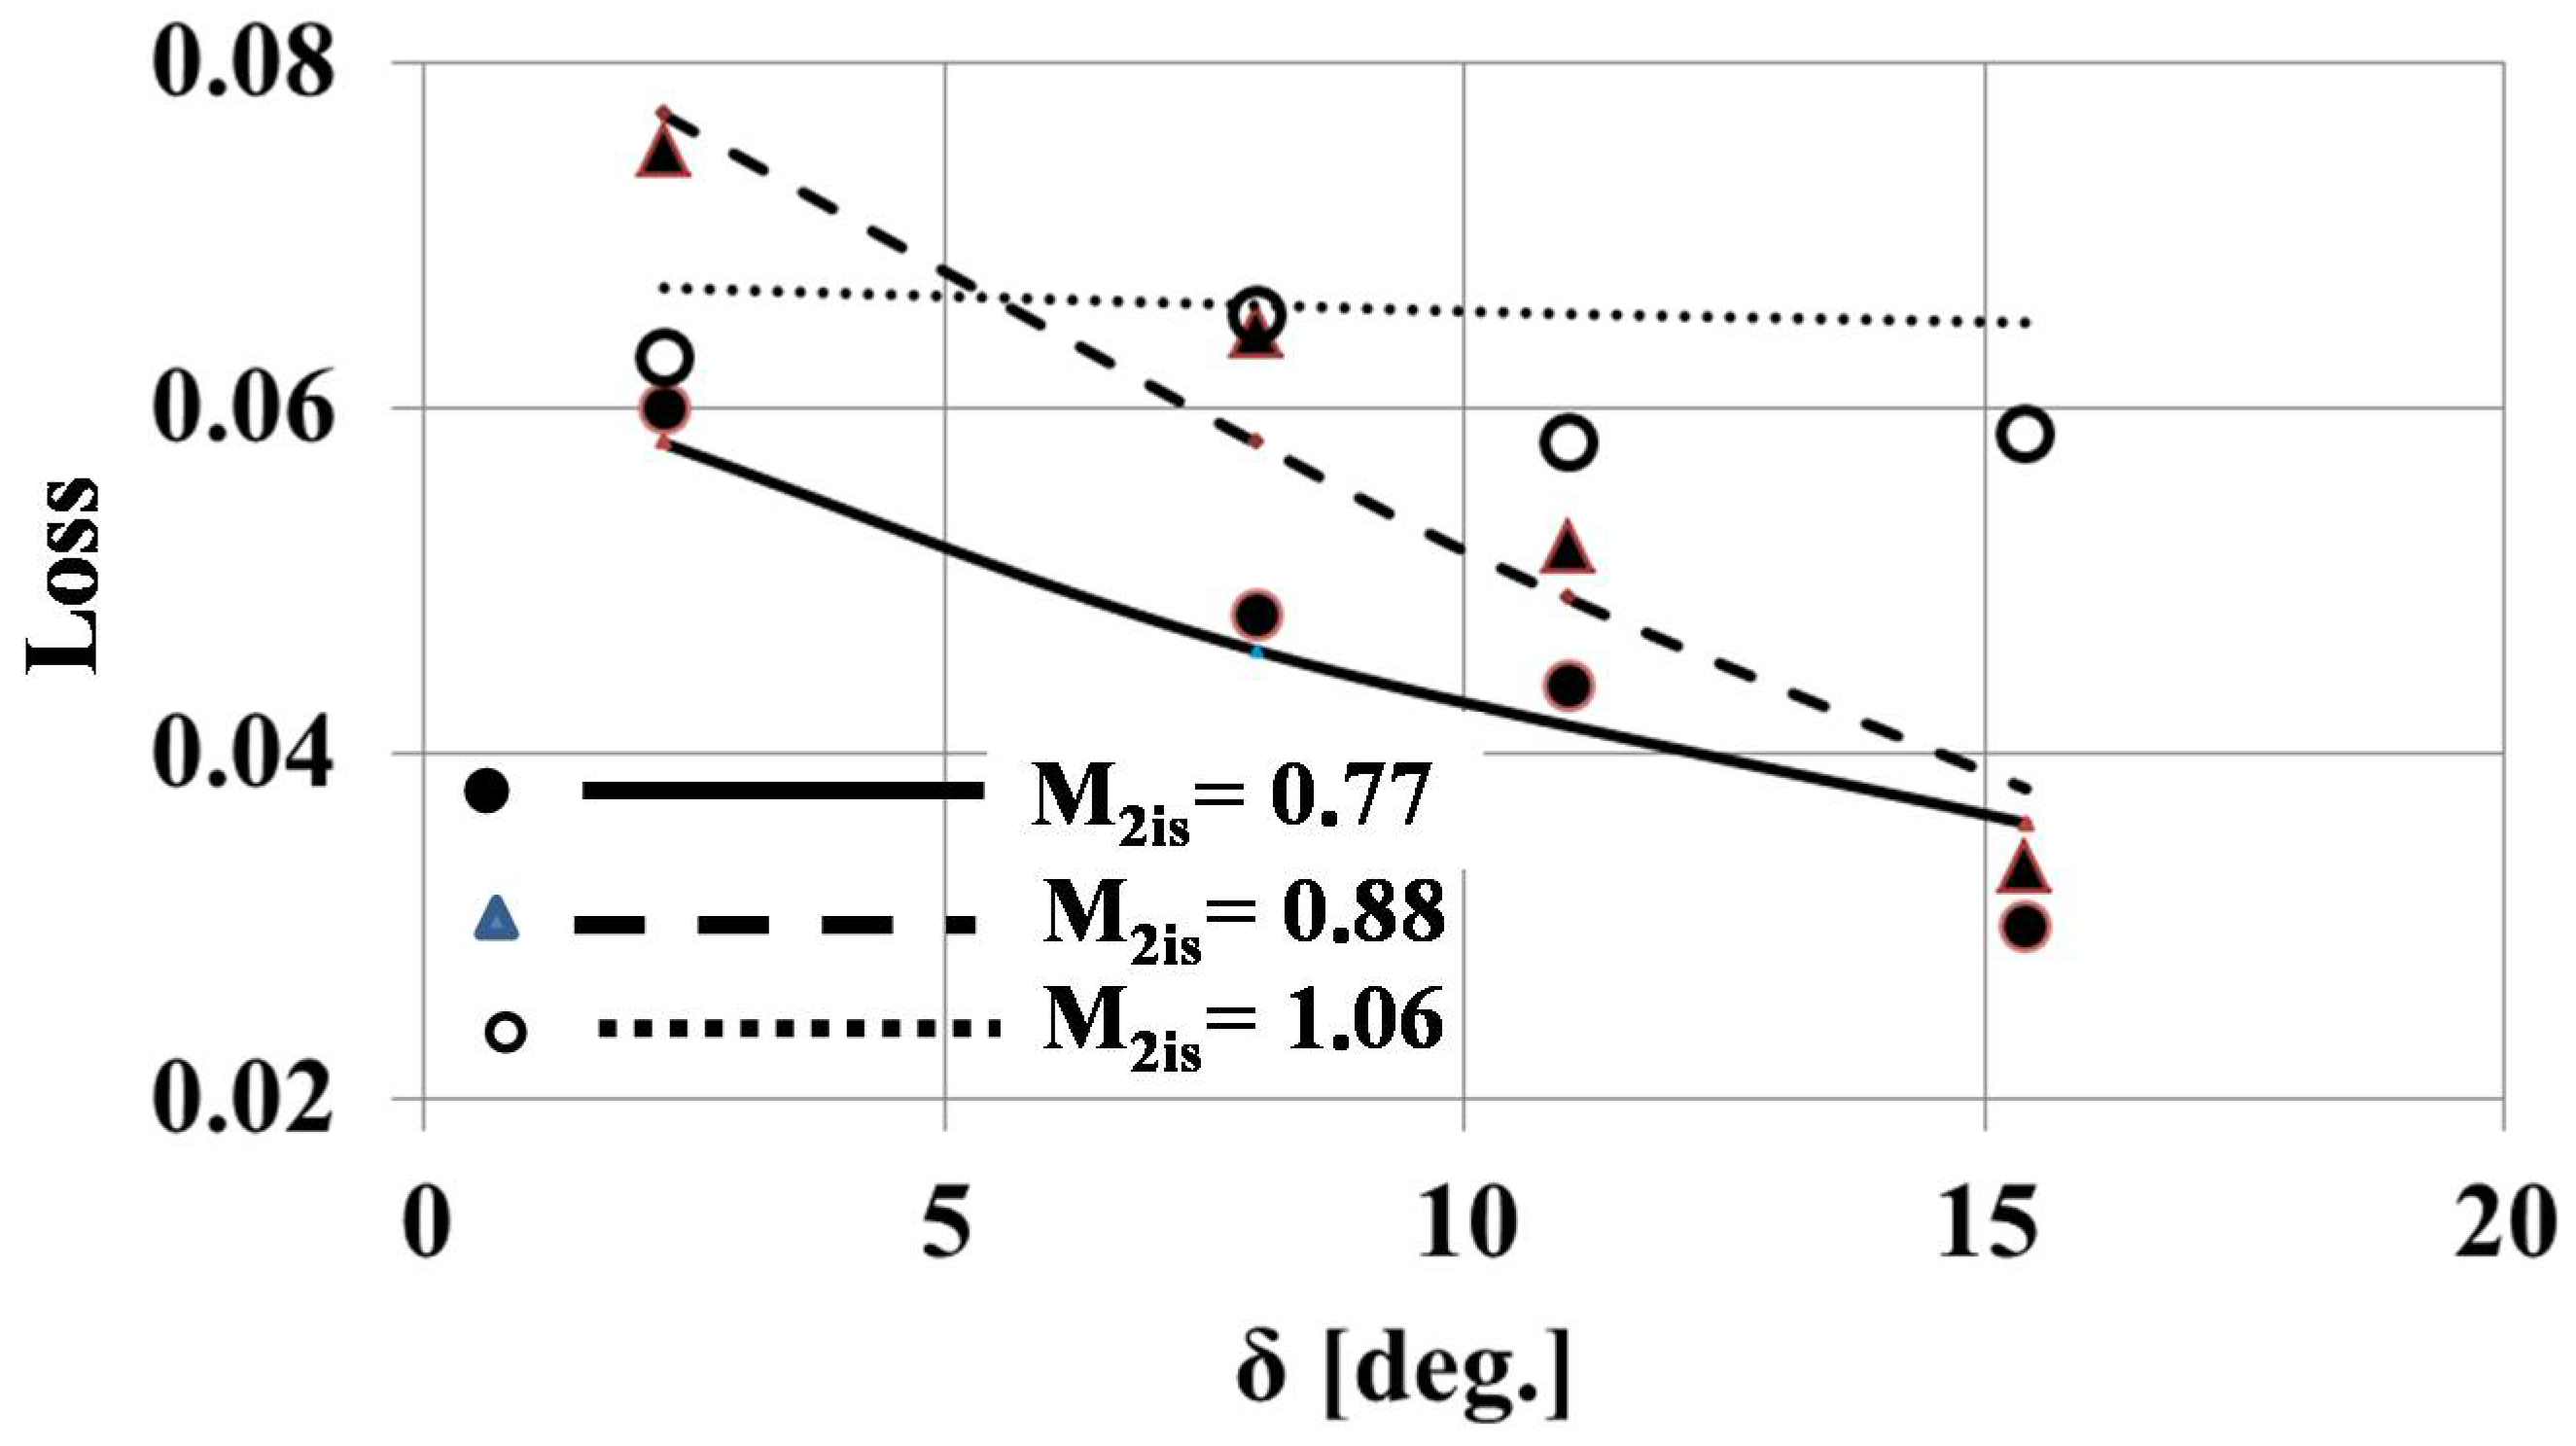
The losses in Cascades 1–4 were also numerically calculated at the exit Mach numbers equal M
2is = 0.77, 0.88, 1.06, respectively.
Figure 7 shows the comparison between measured and calculated profile loss over a range of unguided turning angles from 2° to 16°. There is a reasonable agreement between the numerical and measured data. Both the experimental and numerical data show that as the unguided turning angle increases, the profile losses decreases by 2–4% over the exit Mach number range 0.77–0.94.
4. Trailing Edge Shape
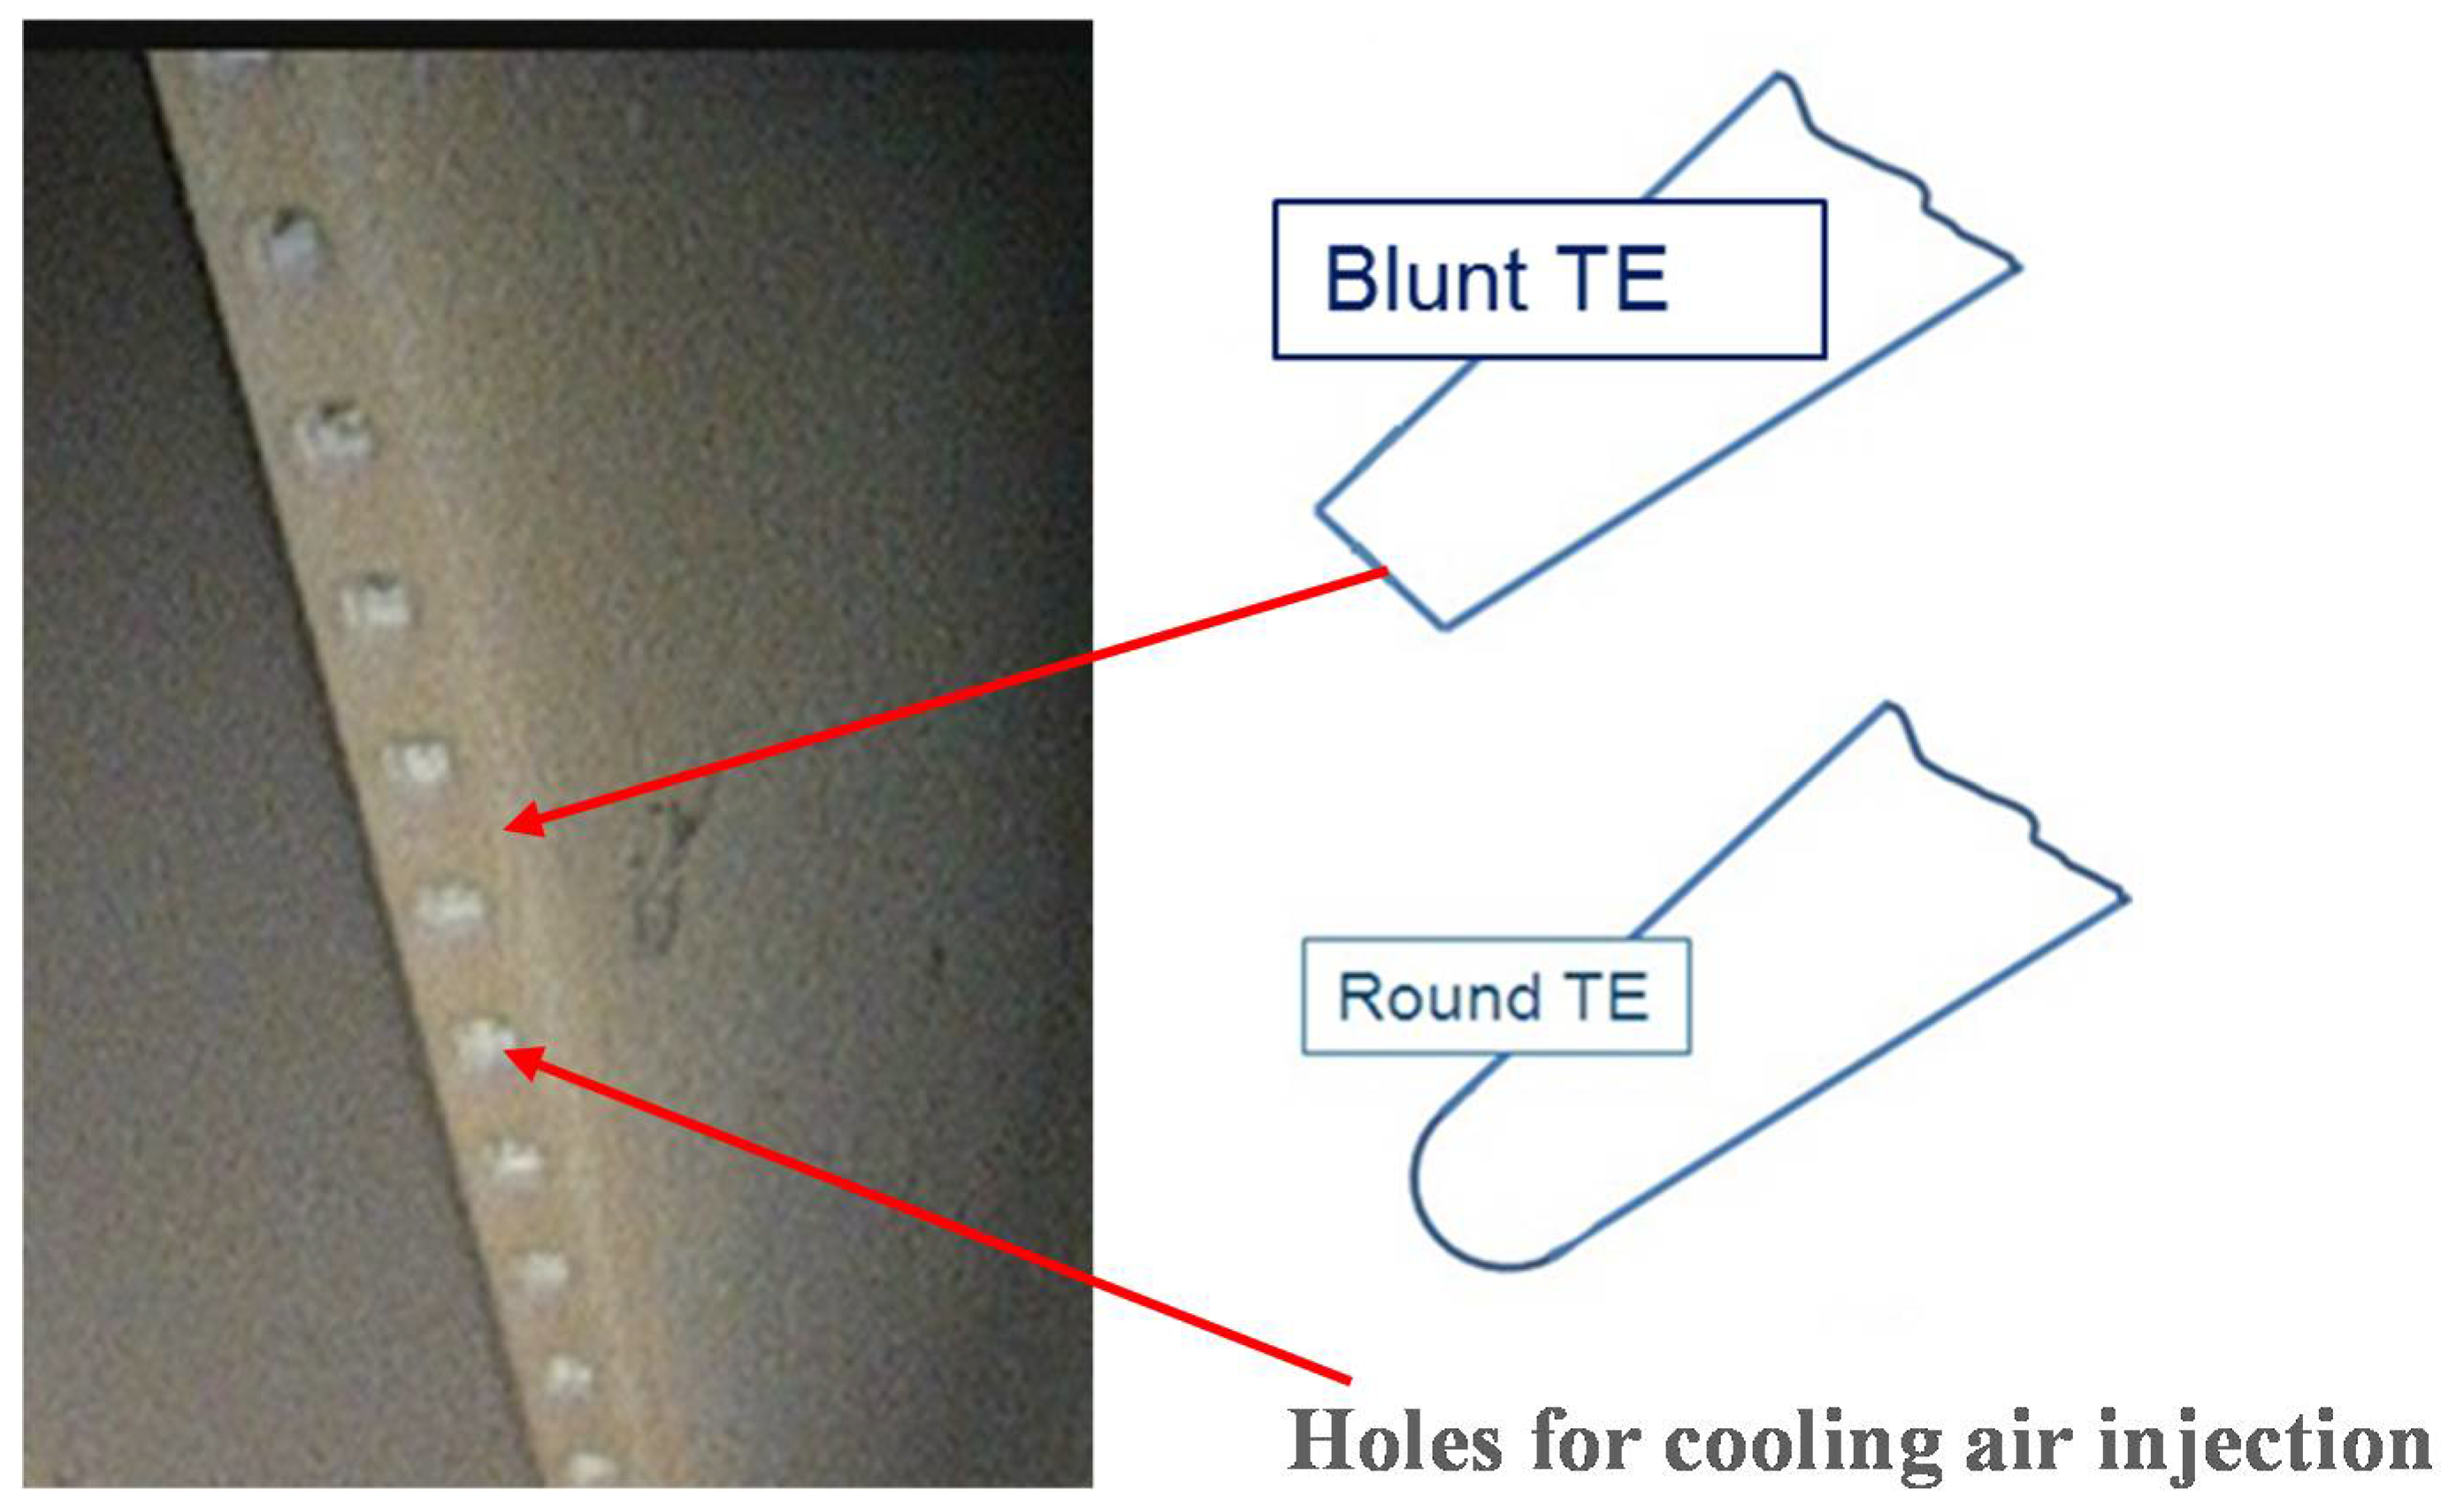
Most of the vanes and blades of state-of-the-art cooled turbines have thick trailing edges to allow injection of cooling air into the flow path. The shape of trailing edges may differ depending on the applications but two main types are used: round trailing edges and blunt trailing edges.
Figure 8 shows the blunt trailing edge of the real cooled blade.
A simple correlation for estimation of the trailing edge loss was proposed by Flugel in his monograph [
19], where k is an empirical coefficient:
Numerous experimental studies confirmed the primary importance of the trailing edge thickness, but at the same time showed that k is not constant. Different researchers tested various turbine cascades with different geometric parameters and different boundary conditions. They obtained a large scatter of coefficient k values in the range indicated in Equation (6). In current engineering practice for assessment of subsonic flows, k is often assumed to be constant and equals 0.18 or 0.2, but in transonic flows this assumption may lead to high inaccuracy.
The experimental investigation of the trailing edge shape effect on profile losses has been conducted on three plane cascades corresponding to the tip, middle, and hub sections of the transonic cooled blade. The main geometric parameters of these cascades are shown in
Table 2. Trailing edges of the tested cascades are quite thick d
2/a
2 = 0.15–0.21 and profiles have large unguided turning angles δ =13°–17°. Every experimental cascade had two set of blades, one with round TE and one with blunt TE.
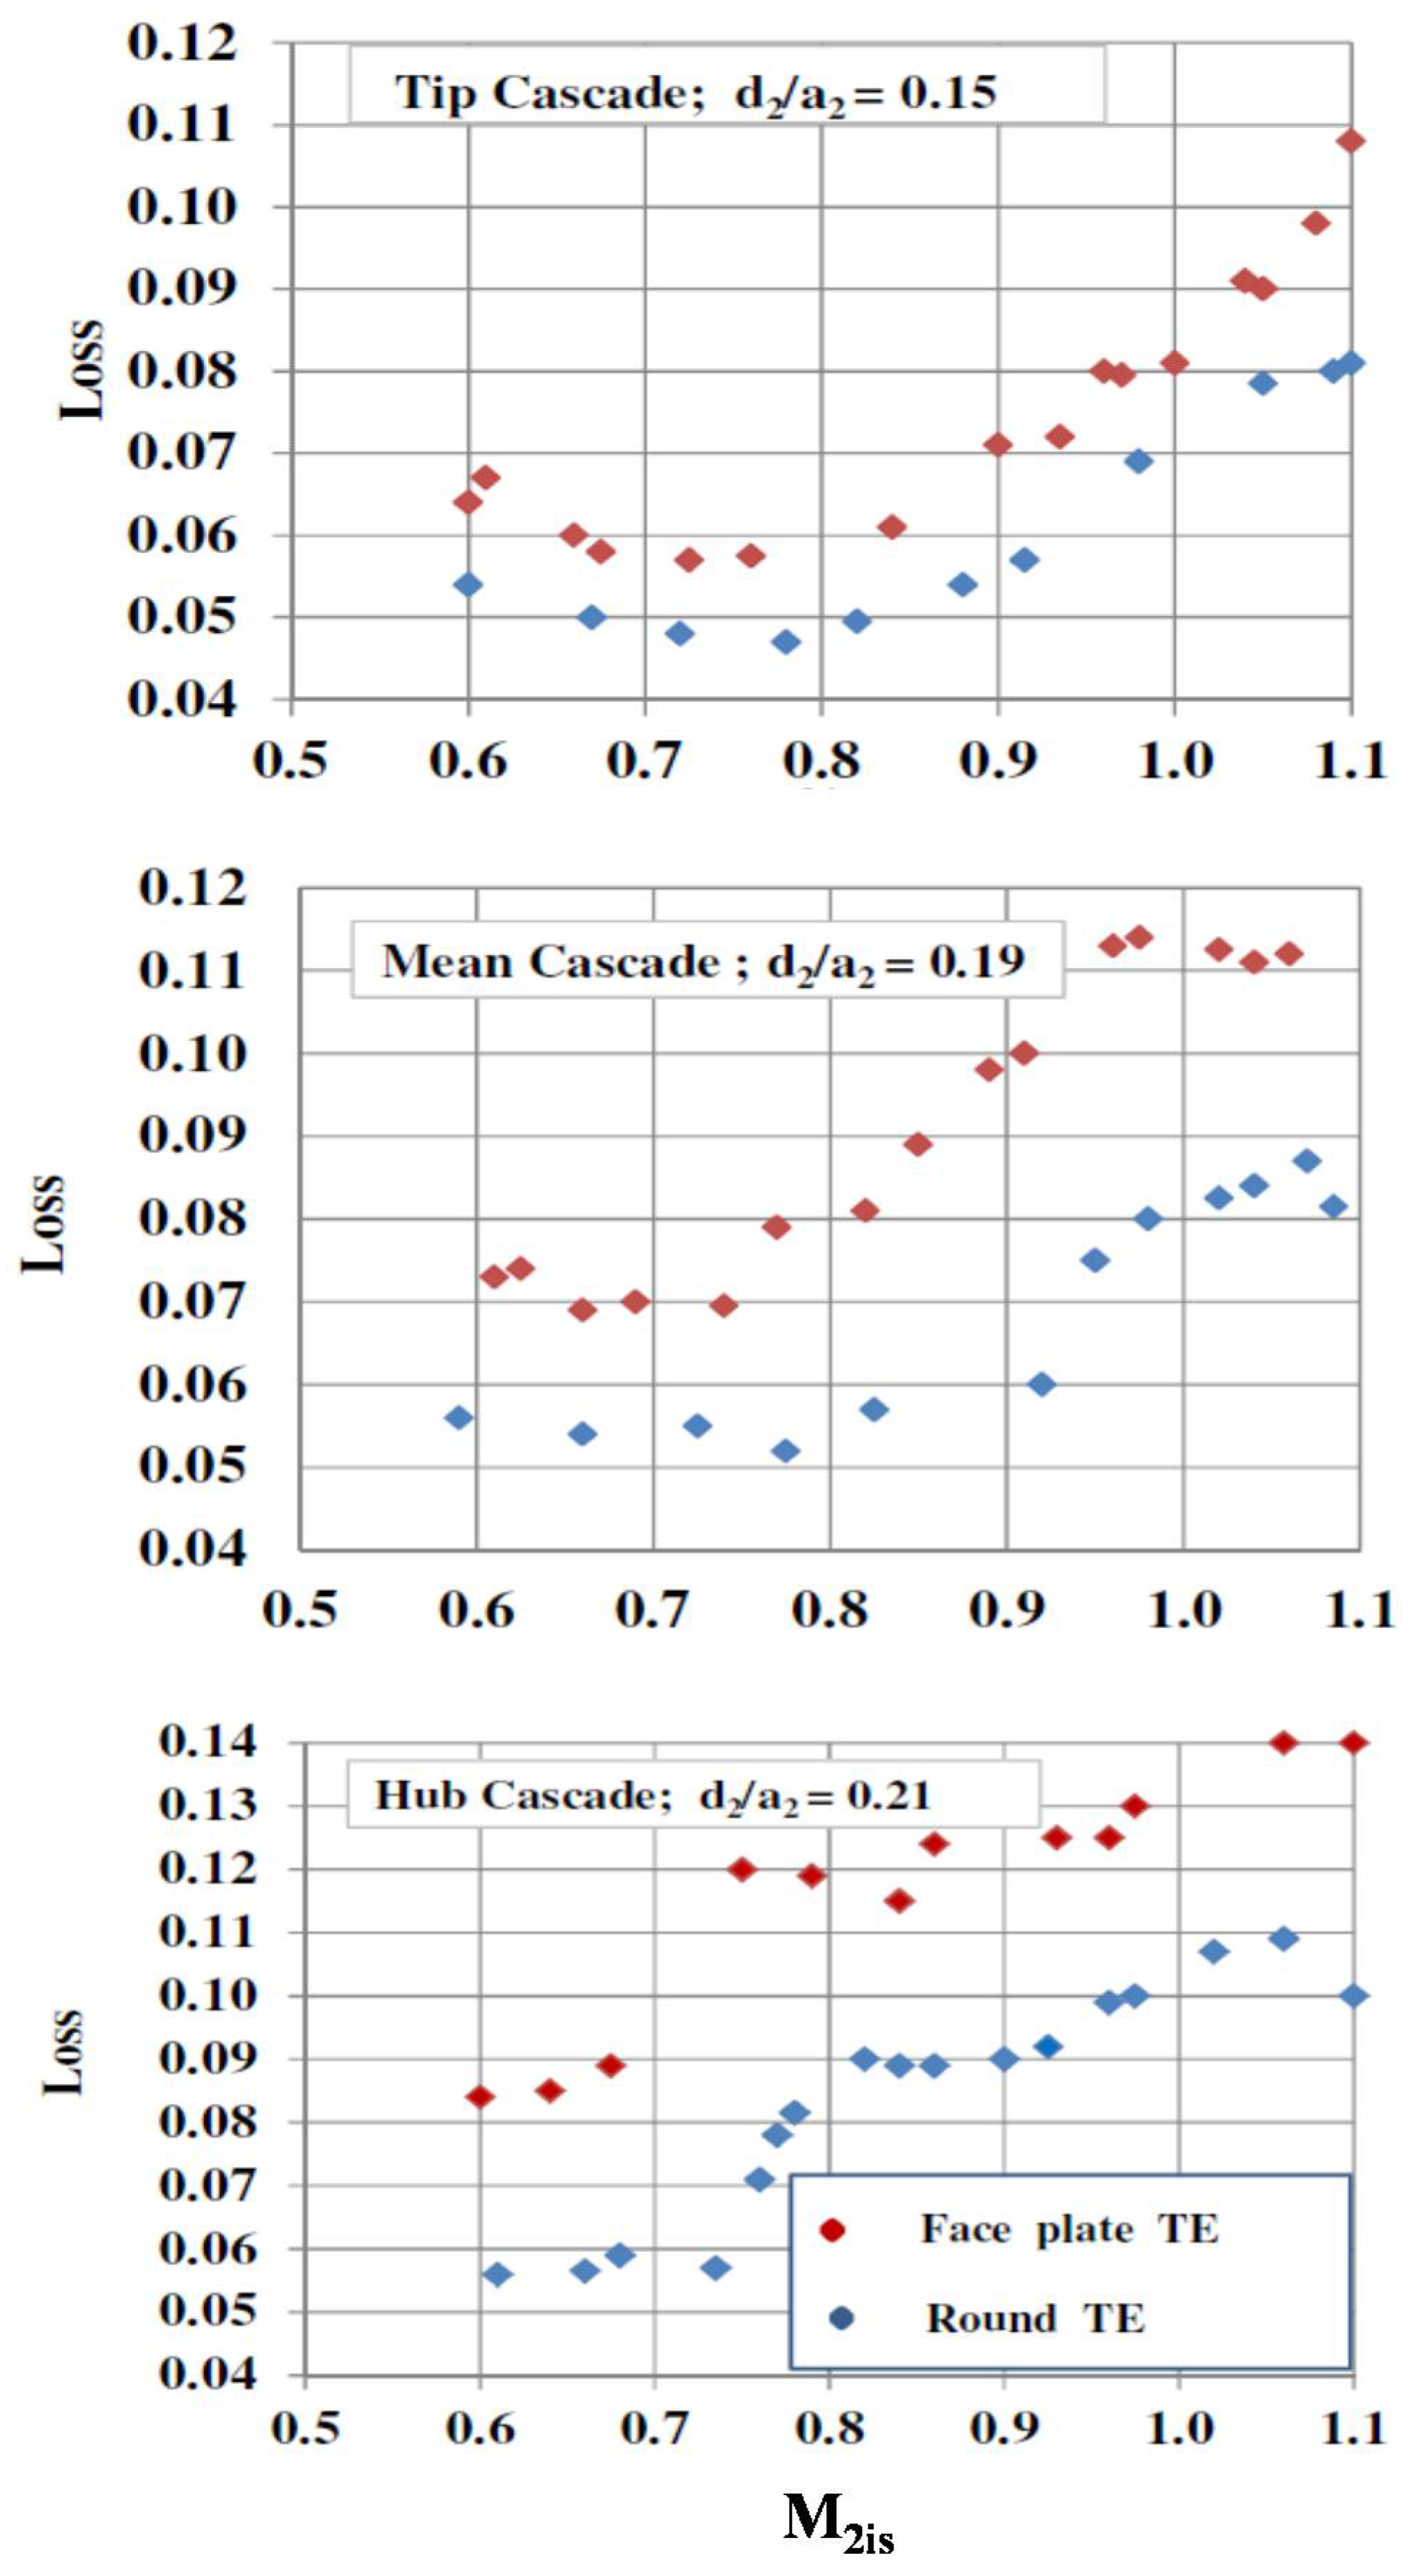
Figure 9 shows measured profile losses in Tip, Mean, and Hub cascades in the wide range of the exit Mach number M
2is = 0.57–1.12. In general, experimental investigations showed that the profile losses in cascades with round trailing edges are lower than the profile losses in cascades with the blunt trailing edges.
For the Tip cascade (
Figure 9a) the difference of the profile losses in cascade with blunt TE and with round TE is δ Loss = 0.8–1%. This difference increases in the Mean cascade to δ Loss = 1.5–2.5% and in the Hub cascade to δ Loss = 3–3.5%. The increase in the profile loss difference in these cascades is connected not only to the change of the trailing edge shape. The profile loss difference increases also due to the increase in the d
2/a
2 ratio from 0.15 to 0.21 and the decrease of the unguided turning angle from 17.5° to 12.8°.
The data presented in
Figure 9 are overall profile losses. The trailing edge loss is about one-third of the overall profile loss [
6]. Extracting this part from the overall loss one can estimate the influence of the trailing edge shape on the pure TE loss. Using the data in
Figure 9, one can come to the conclusion that the blunt trailing edge practically doubles the TE loss (i.e., coefficient k in Equation (1) should be increased by a factor of two for the blunt TE). Thus the trailing edge shape has a significant effect on the overall loss. This factor should be taken into account in the analysis of the degradation impact on the loss because not only the size but also the shape of the trailing edge will change depending on the degradation of the blades in operation.
5. Loss Reduction
The simplest technical approaches are often the most complicated ones in practice. One of the simplest ways the profile loss reduction is the trailing edge thickness decrease. However, the realization of this measure is complicated enough, especially for cooled vanes and blades with holes or slots for cooling air injection through the trailing edges. Despite the well-known alternative of injecting cooling air through slots on the pressure surface near the cutback trailing edge, cooling air injection through the thick trailing edge still remains the most popular measure. As the decrease of the trailing edge thickness of cooled vanes and blades has limited potential, it is worth investigating another way to obtain the profile loss reduction in blades with thick trailing edges. As shown in [
21], thick trailing edge in ultra-high lift blades with significant uncovered turning is not necessarily a disadvantage. Based on this observation and the experimental and numerical results discussed in previous sections, the authors performed loss optimization using the unguided turning angle as a control parameter. The vane with thick and blunt trailing edge investigated in [
25] was taken as a reference. The main geometric parameters of this vane are presented in
Table 3. Then two new variants with the same basic geometric parameters, except unguided turning angles, have been generated and compared with the original version. Based on these geometric data, the reference geometry has been regenerated using an in-house blade generator. The main geometry parameters of the recreated vane are presented in
Table 3, and the view of this variant is shown in
Figure 10.
Two additional cascades have been generated using the same basic geometric parameters but with higher unguided turning angles. The main geometry parameters of these cascades are presented in
Table 3 and a view of these geometries are shown in
Figure 11.
Cascades 1, 2, and 3 have been computed by a 2D Navier–Stokes code. Two cases with exit Mach number M
2is = 0.8 (Re = 2.3 × 10
6) and M
2is = 0.89 (Re = 2.4 × 10
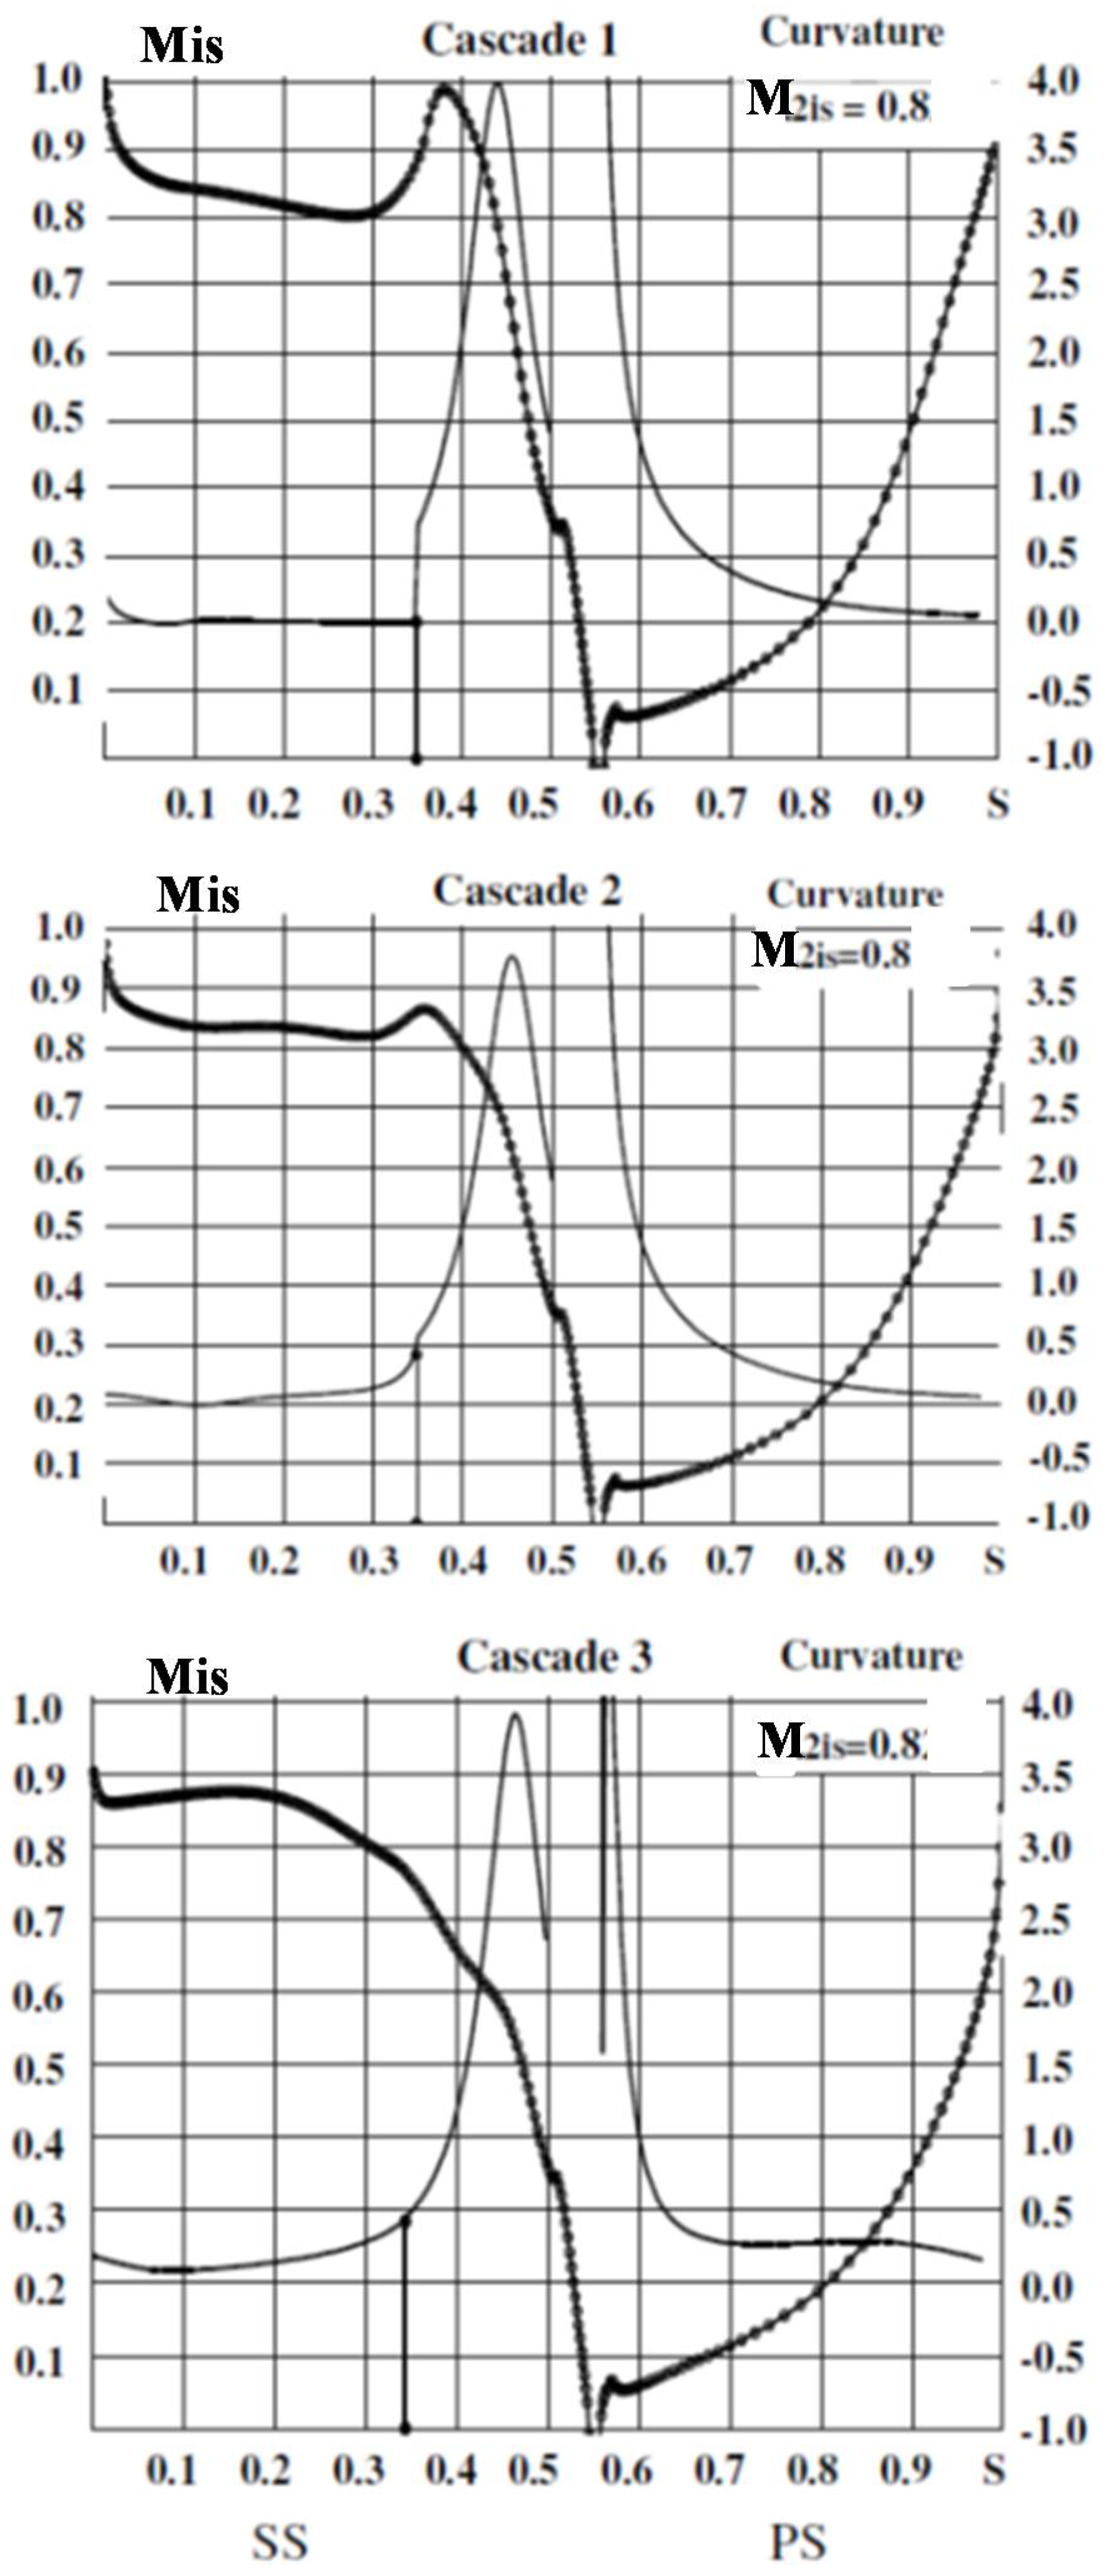
6) were considered. The isentropic blade Mach number distributions are presented in
Figure 12. The Mach number distribution for Cascade 1 in
Figure 12a corresponds to the one published in [
25]. The rapid acceleration on the front suction side is followed by a strong deceleration in the throat region before reaccelerating smoothly further downstream. At the end of the suction surface the flow accelerates sharply due to the expansion of the flow around the trailing edge. This is a typical feature for the flow leaving blade, with small unguided flow angle. Usually it leads to large negative values of the base pressure coefficient. Computed values of the base pressure coefficient and the profile losses for these cascades are presented in
Table 4. In Cascade 1 the base pressure coefficient is C
pb= −0.27 and the profile loss is Loss = 8.5% at M
2is = 0.8. The increase of the unguided turning angle to δ = 8° in Cascade 2 leads to a flattening of the deceleration zone on the suction surface. In Cascade 2 the base pressure coefficient is C
pb = −0.19 and the profile loss is Loss = 7.3% at M
2is = 0.8. A further increase of the unguided turning angle to δ = 16.2° in Cascade 3 results in a nearly optimal velocity distribution on the suction surface without any deceleration,
Figure 12c. In Cascade 3 the base pressure coefficient becomes positive C
pb = 0.062 and the profile loss decreases to Loss = 6% at M
2is = 0.8.
The same calculations were conducted at M
2is = 0.89. Computed base pressure coefficients and profile losses are summarized in
Table 4.
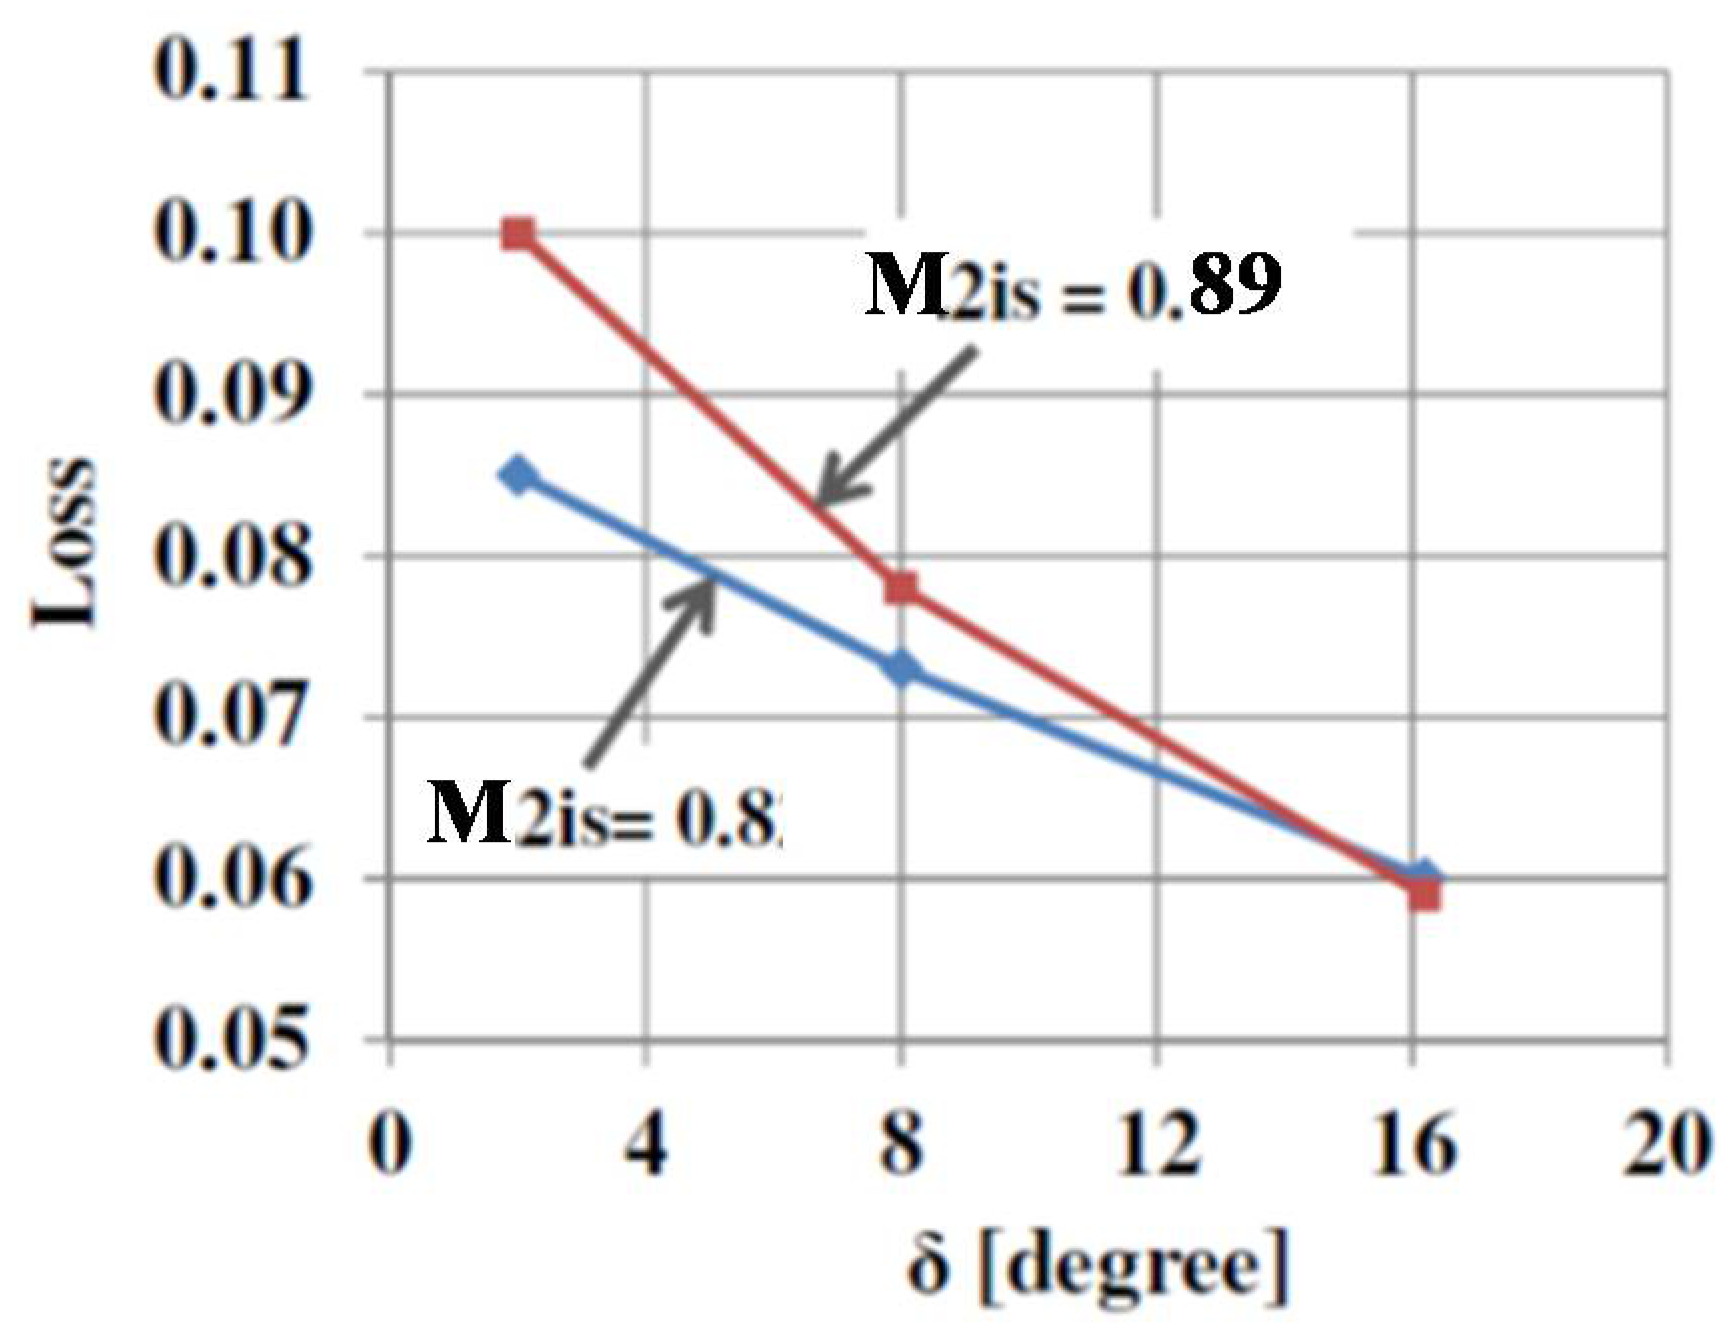
Figure 13 shows computed profile losses over the unguided turning angle δ range from 2° to 16.2° for two values of the exit Mach number, M
2is = 0.8 and M
2is = 0.89. This plot shows that the profile losses in the Vane with thick and blunt trailing edge (d
2/a
2 = 0.2) are decreased by 3.5–4% with an increase of the unguided turning angle from δ = 2° to δ = 16.2°.
6. Trailing Edge Injection
This part of the paper presents results on the effect of coolant injection. The basic geometrical data are presented in
Table 5. Note that, contrary to real engines with differences in densities due to the temperature differences between coolant and main flow, the experimental tests reported here are performed with the same medium, air, and at the same total temperature. This simplification was justified by some tests using CO
2 and N
2 as coolant flow to simulate density effects, which did not show any noticeable effect. Similar results were already reported by Sieverding [
13], and Deckers and Denton [
7], working effectively with the correct temperature ratios between coolant and main flow, concluded that the effect of coolant total temperature ratio on the base pressure and loss was very small.
Three cascades, 1, 2, and 4, are typical cooled vanes with axial inflow. These three variants have similar flow turning and unguided flow angle but different trailing edge thickness. These parameters have a strong influence on losses and flow structure behind the blade (see, e.g., [
22]). The slot size, and therefore the injection parameters, also varied in these tests. Cascade 3 is a typical cooled blade with different flow turning and a relatively low, unguided turning angle. At the same time, the trailing edge thickness belongs to the same range as in the vanes.
To evaluate the effect of injection, the delta between losses with and without injection ΔLoss was calculated:
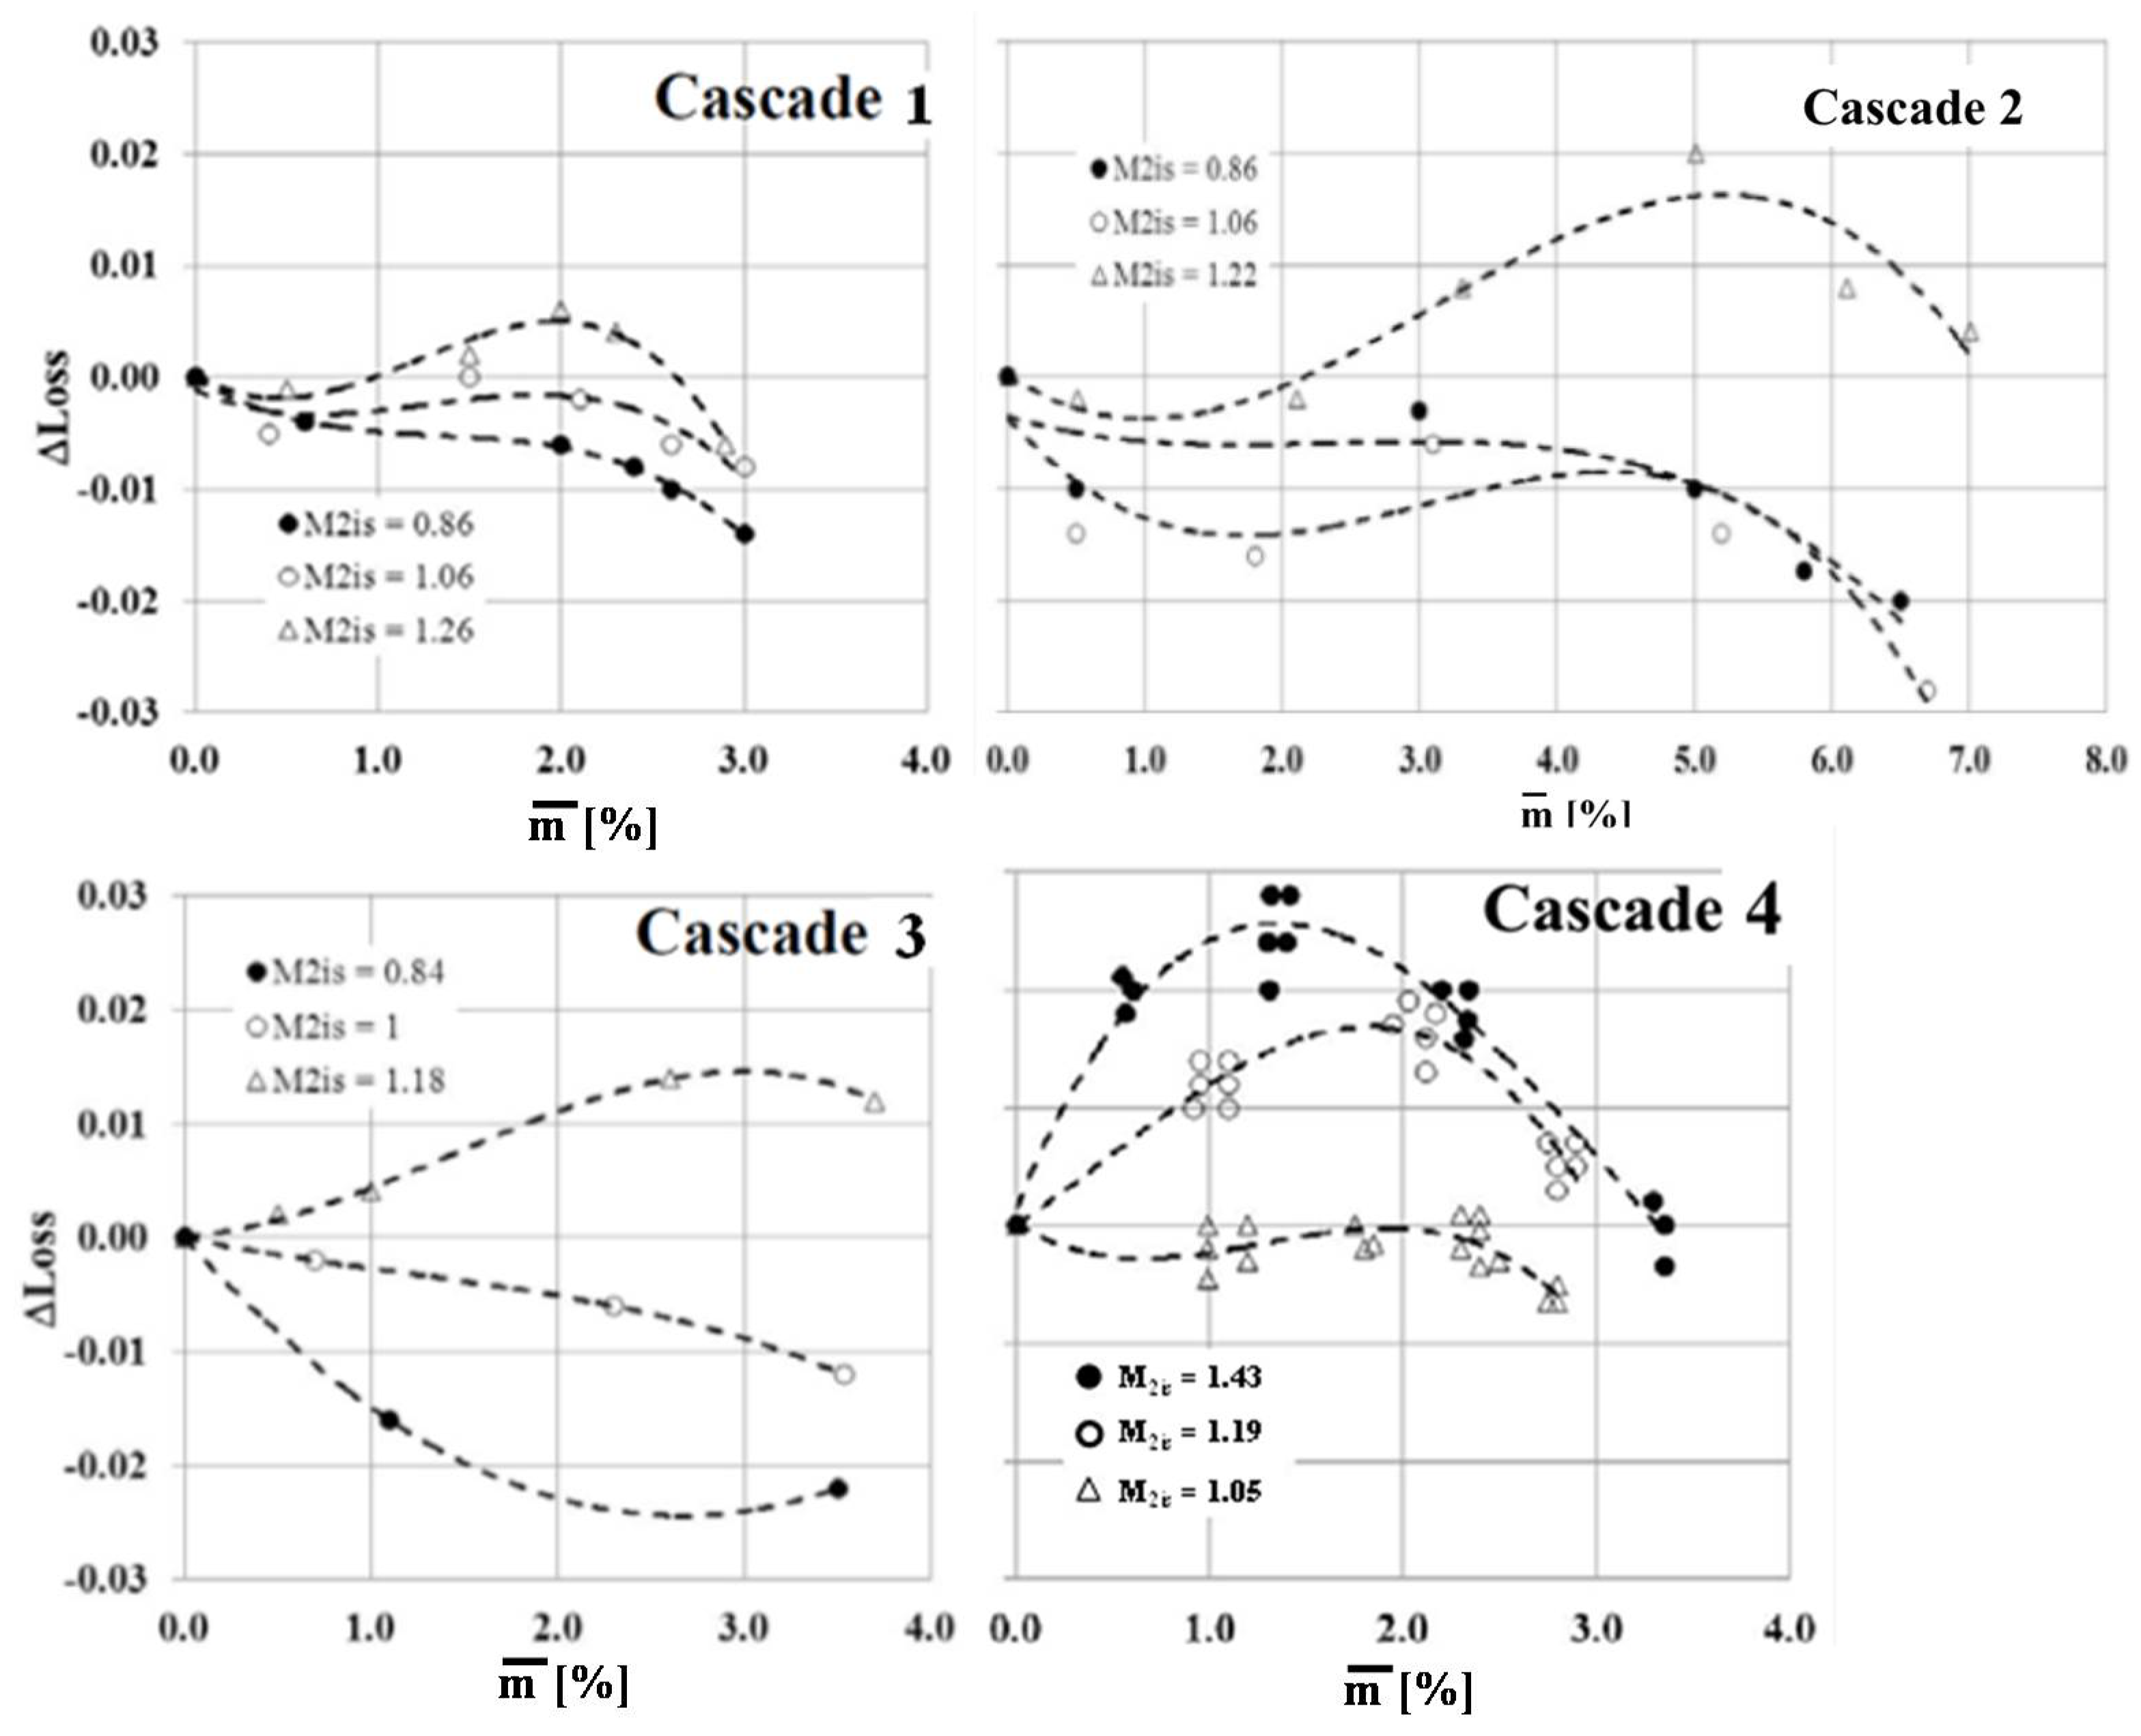
The test results for all investigated cascades are presented in
Figure 14. In Cascade 4 the injection leads to additional losses at supersonic exit Mach number, while at M
2is = 1.05 the injection leads to a small reduction of loss. The latter can be explained by the additional momentum that the injection of air with high velocity introduces to the main flow. At supersonic conditions the same amount of injected air has a lower momentum than the main flow, and therefore creates losses. In Cascades 1 and 2 the losses without injection are higher than in Cascade 4, which is related to the lower unguided turning angle and a thicker trailing edge. At the same time, the effect of injection is weaker in this case. In Cascade 2, even at M
2is = 1.22 the additional losses are close to zero because the shock losses are dominating in this case and they are less affected by the injection. In Cascade 1 there is a clear effect of loss reduction in the subsonic range of exit Mach number. Considering that the behavior of loss in blade cascade 3 has a similar trend as in vanes, one could expect the same trend for injection. The measurements confirm this expectation, and this cascade also shows a loss reduction due to injection in the subsonic range and loss increase in the supersonic range. Thus one can conclude that for cascades with a moderate unguided turning angle (δ < 15°) and TE thickness in the range d
2/a
2 < 0.2 the injection through the TE slot parallel to the main flow leads to a neutral loss impact and even a loss reduction in the subsonic range and a loss increase in the supersonic range of exit Mach numbers.
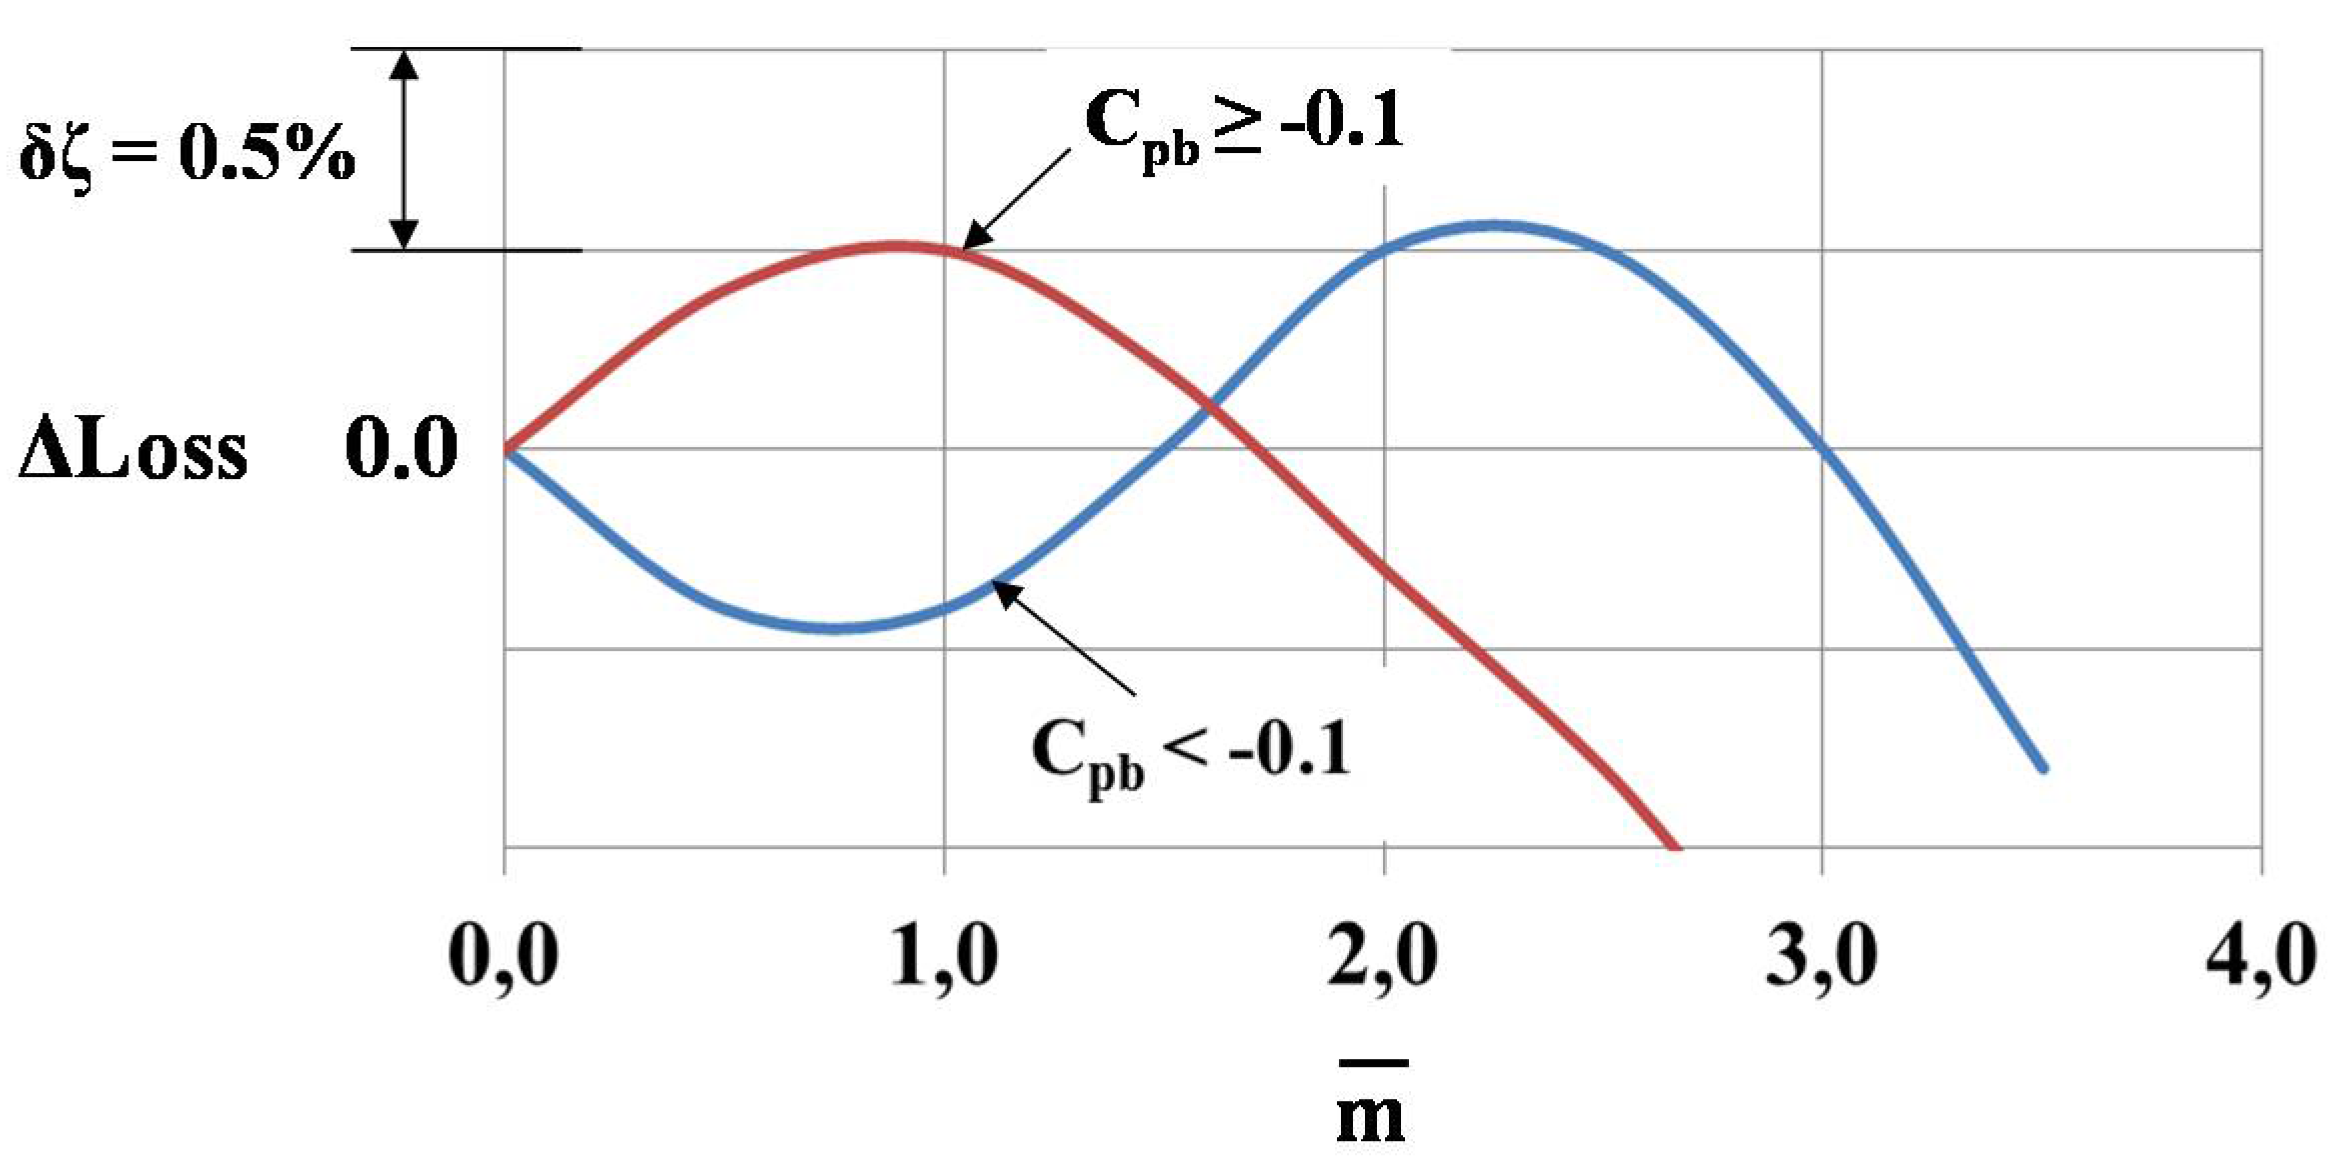
In general, all cases of changes of losses due to cooling air injection through the TE into the base flow can be split into two groups. The first group consists of cascades with a low level of the base pressure coefficient C
pb < −0.1 and large TE losses at
= 0. Usually these are vanes and blades with low value of unguided turning angles δ < 7°–10°. In the second group there are cascades with an increased level of the base pressure coefficient C
pb ≥ −0.1 and low TE losses at
= 0. These are blades with a large value of unguided turning angles δ > 10°.
Figure 15 demonstrates two possible scenarios of the change of losses versus the change of relative cooling mass flow
Blue line corresponds to blades with low level of the base pressure C
pb < −0.1. First, the cooling air injection into the wake downstream of the TE increases the base pressure and the losses decrease. Then losses start rising as the cooling air mass flow increases due to the interaction between the main flow and cooling air (mixing losses). Finally, with a further increase in cooling mass flow and a corresponding rise in momentum, losses are decreased. The brown line corresponds to blades of the second group. The cooling air injection causes an immediate increase in losses. Subsequently, the increase in cooling mass flow and momentum leads to a decrease in losses.
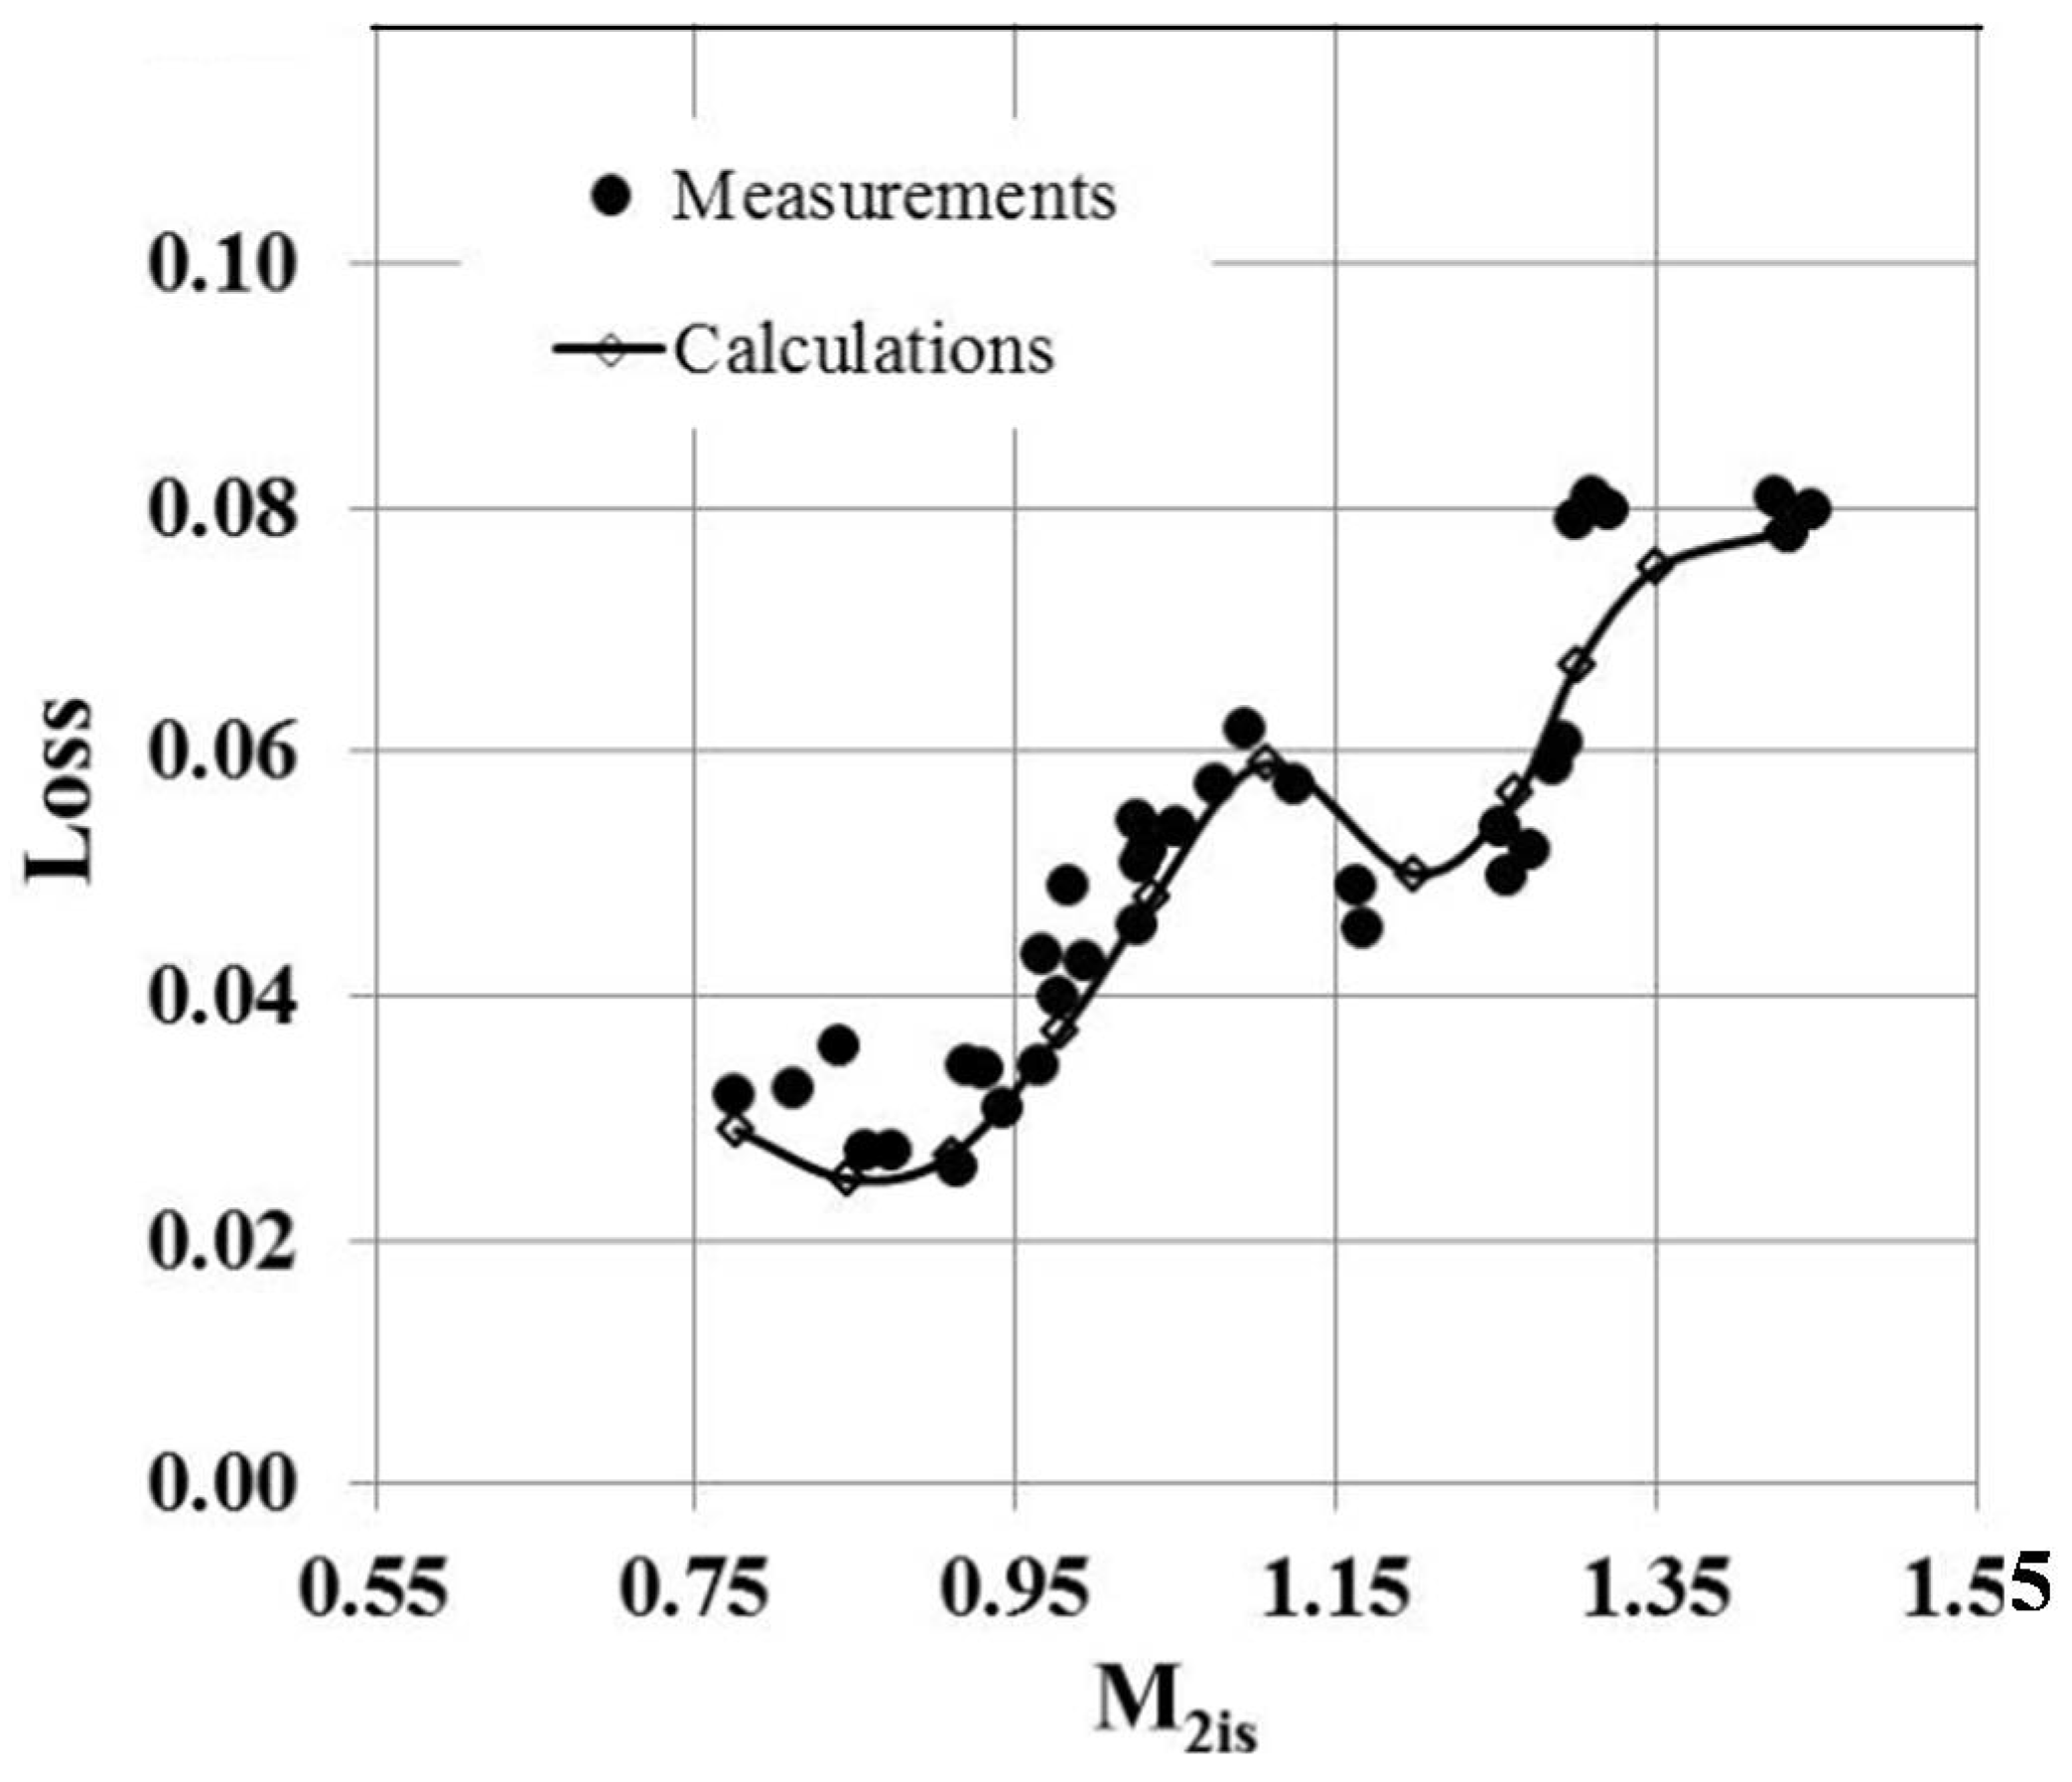
Calculations were performed for cold main flow and cooling flow conditions (isothermal conditions), where the boundary conditions correspond to the experimental conditions. The blade surface in these cases is assumed adiabatic without heat transfer. The pressure drop over the blade is maintained, and the mass flow at the outlet is increased according to the amount of injected air. The calculations without injection were performed over a wide range of exit Mach numbers. The comparison of loss calculations with measurements is presented in
Figure 16. There is a reasonable agreement of data, although calculations somewhat underestimate losses in the subsonic range and overestimate them in the supersonic range with moderate exit Mach numbers. At high supersonic Mach numbers, the losses are underestimated. It is necessary to mention that in the supersonic range the position of the shocks is sensitive to geometry variations, and some difference in calculated and measured geometry may lead to differences in losses. Nevertheless, the trends in loss behavior are captured correctly.
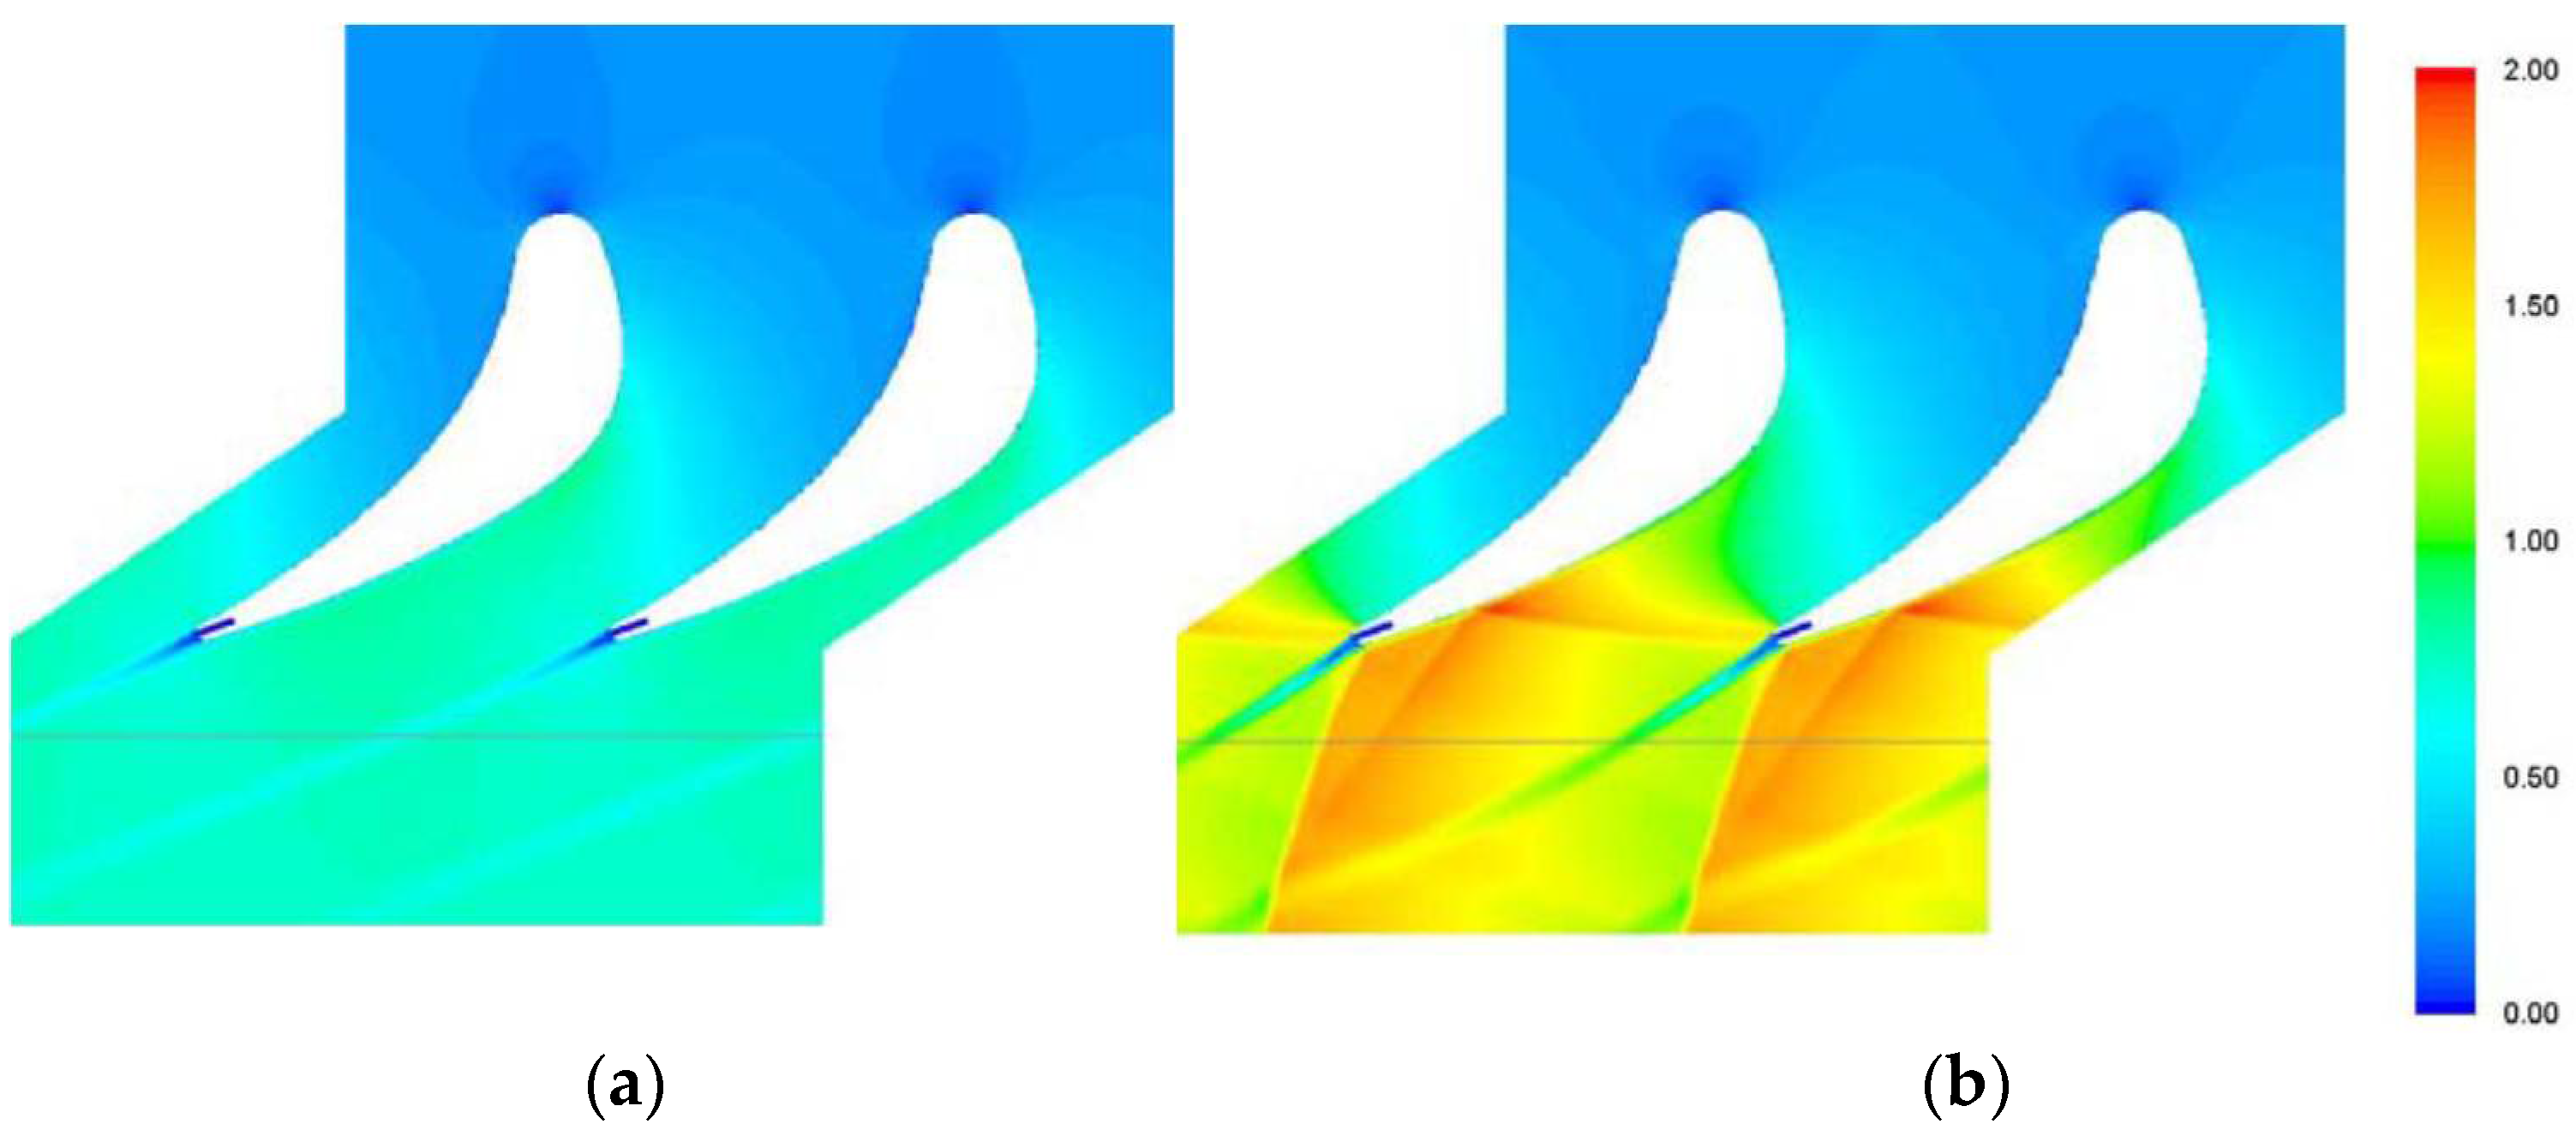
The flow structure at subsonic (M
2is = 0.78) and relatively high supersonic Mach numbers (M
2is = 1.43) are shown in
Figure 17, and this picture demonstrate that the numerical mesh used in this calculations is able to resolve the wakes and shock structures quite well. The picture for supersonic conditions also illustrates the shock boundary layer interaction on the suction surface, and the evolution of this shock explains the trend in the loss curve in the transonic range.
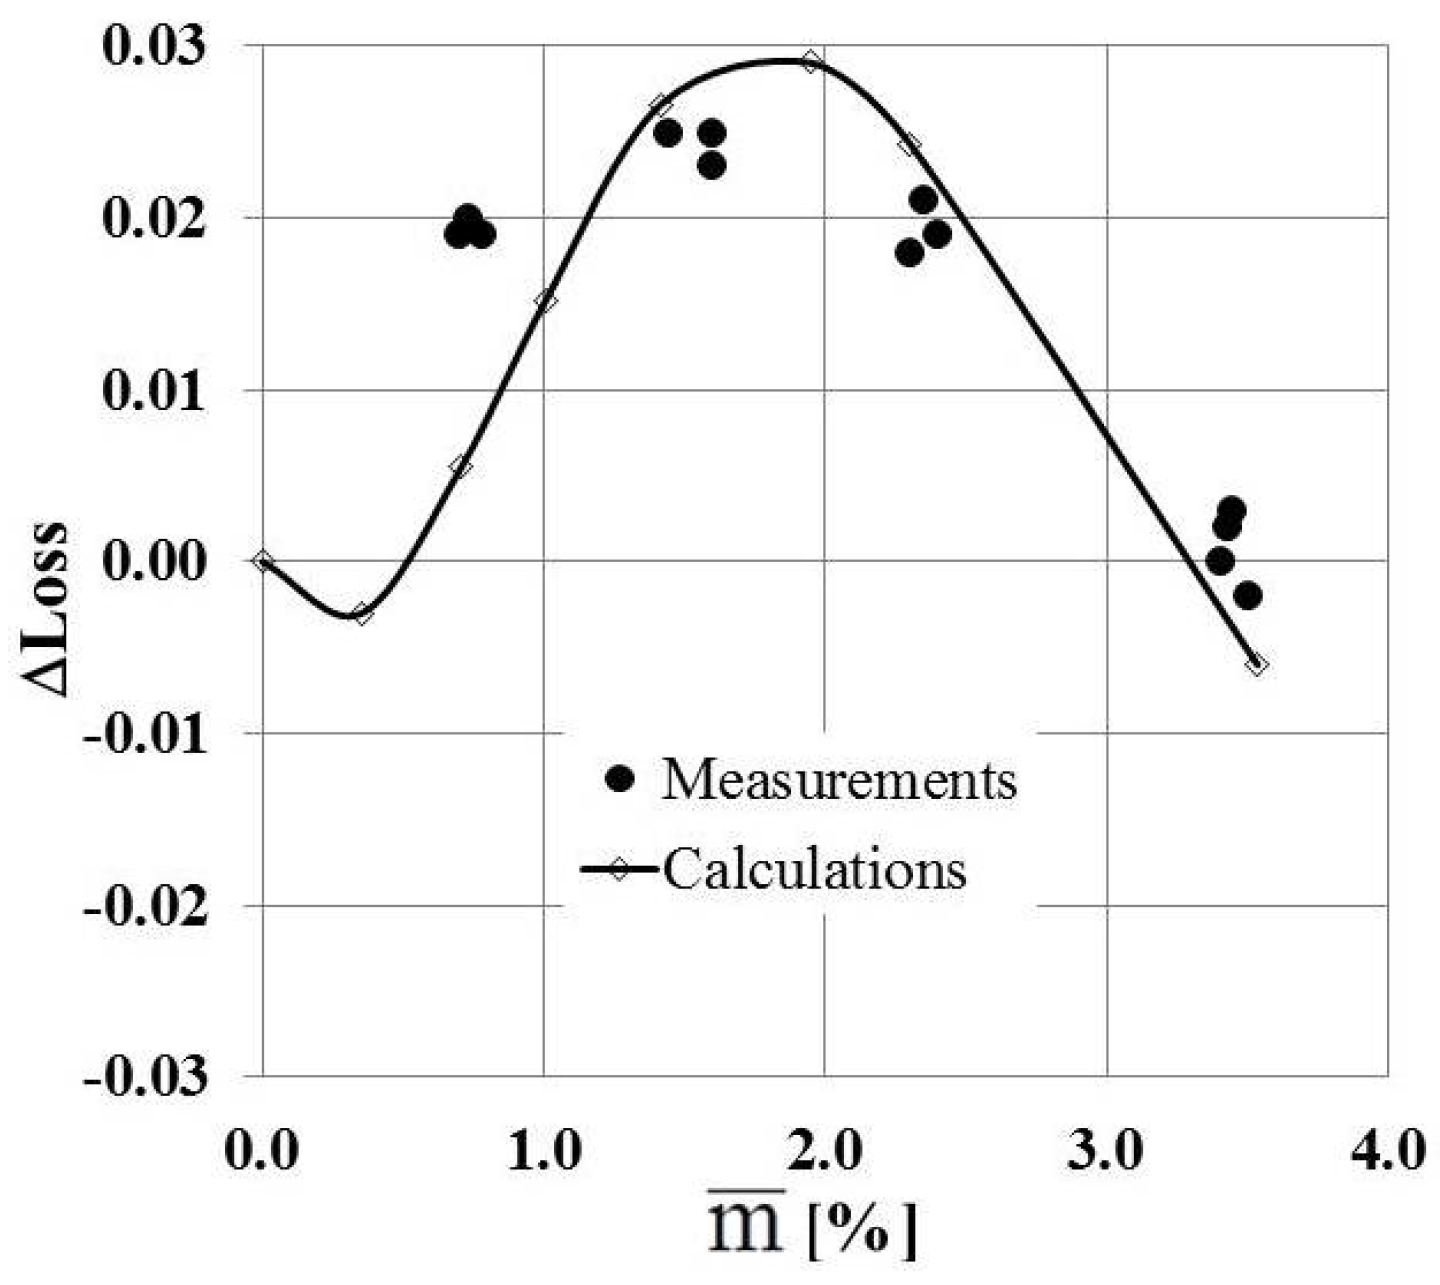
The flow simulation with trailing edge injection was performed for the case M
2is =1.43. The results of additional loss calculations in comparison with measurements are presented in
Figure 9 (the measured data are the same as those in
Figure 18). In the range of moderate rate of injection the agreement is quite good. Some deviation is observed at a low level of injection. This deviation might partially be related to discrepancies between the 2D model and injection conditions in the test rig, which are three-dimensional (3D) (i.e., different at midspan and near the endwalls). The measurements with low injection rate are also not detailed enough. Nevertheless, the calculations are able to capture the trend in loss variation over the investigated range of injection rates.
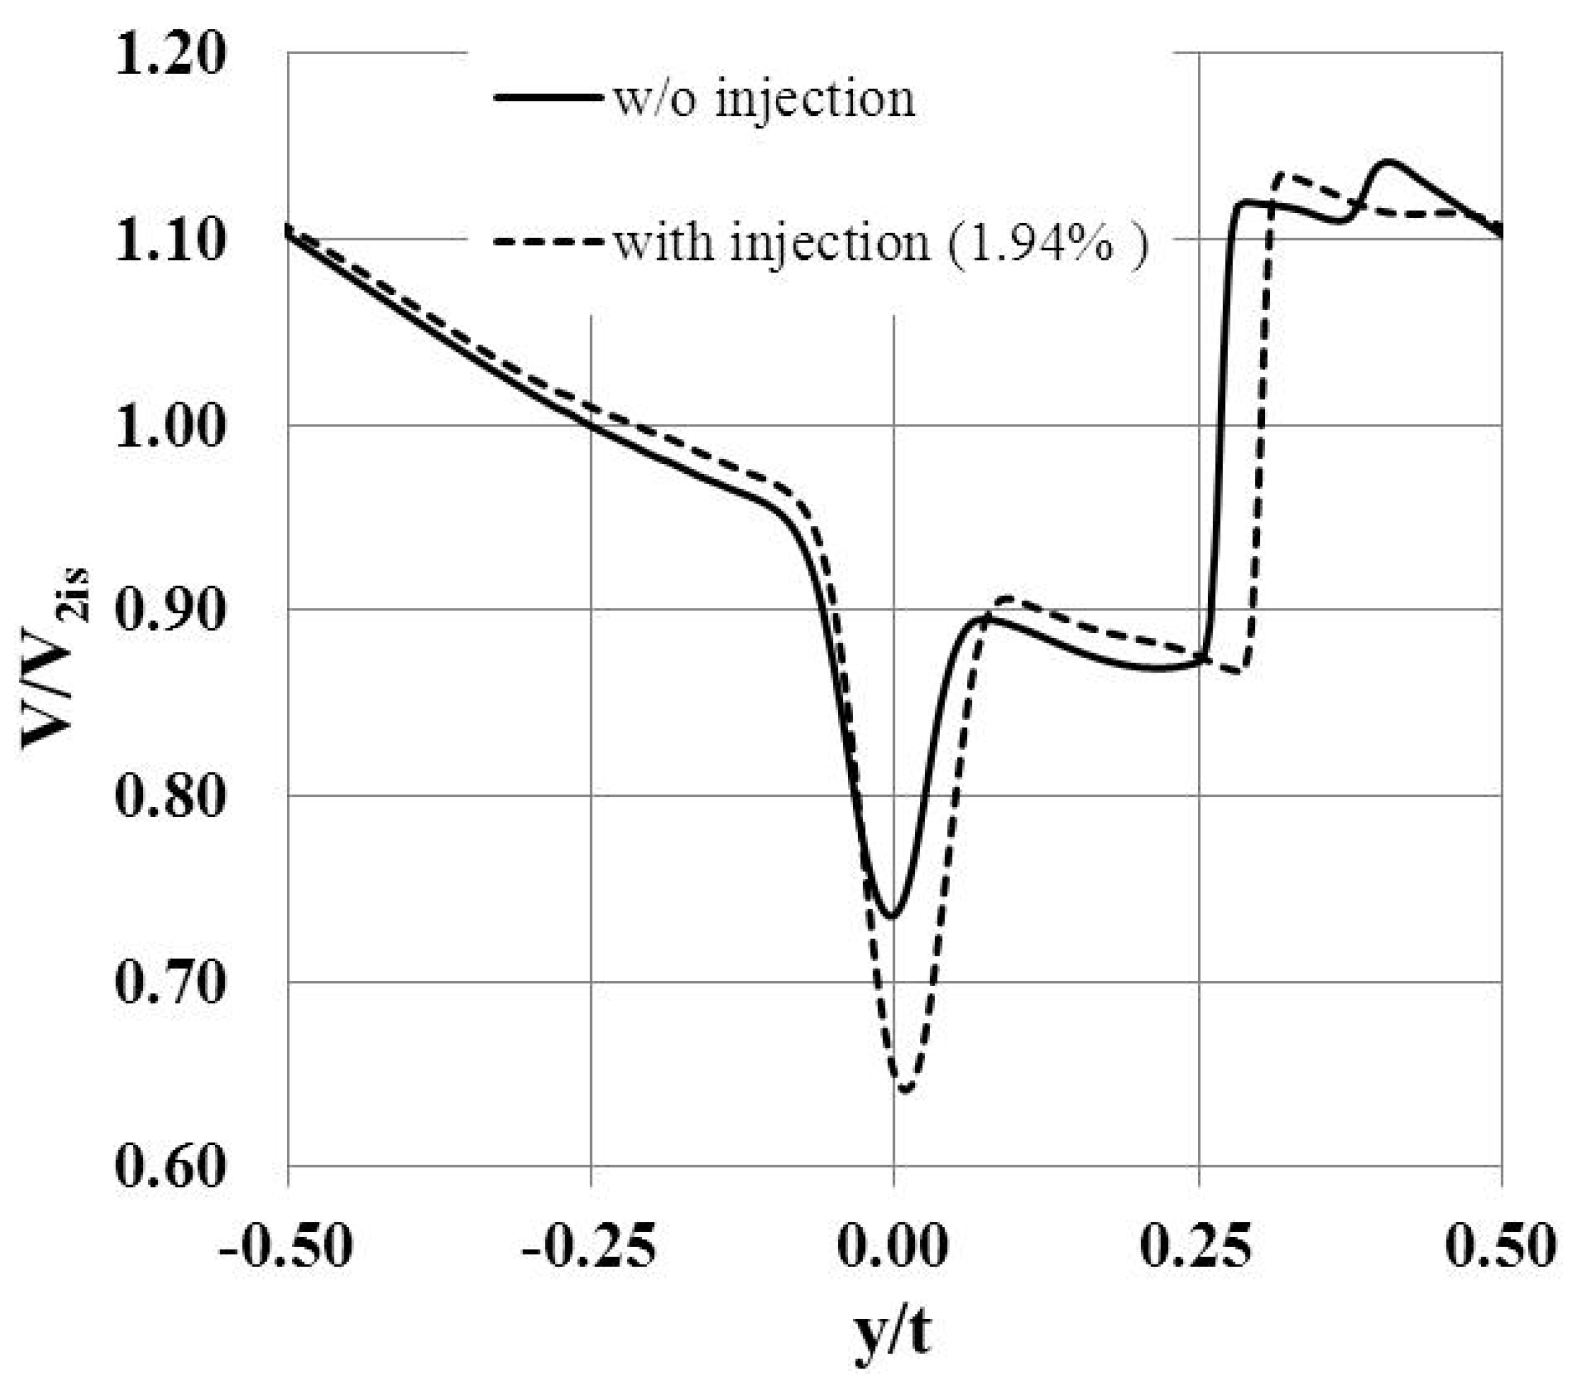
The flow velocity distribution across the wake, presented in
Figure 19, shows that the coolant injection into the wake increases the width of the wake and reduces the velocity maximum within the wake as compared to the case without coolant injection. This results in a change of losses. Moreover, the coolant injection can change both the shock position and its intensity and this can affect the loss as well.
7. Concluding Remarks
Experimental and numerical methods were used to investigate the effect of the unguided turning angle, trailing edge shape, and trailing edge injection on the profile loss of transonic high-pressure cooled turbine blades. Some sets of vane and blade plane cascades with different unguided turning angles and two kinds of TE shapes were studied. Numerical data were validated on the basis of experimental data for these cascades. In general, a good agreement between the test and the computed data was observed. The investigations showed that the unguided turning angle and shape of trailing edge have a significant effect on the base pressure coefficient and profile losses for cooled vanes and blades over the transonic operating range.
The increase in the unguided turning angle results in an increase in the base pressure coefficient from large negative values to positive values, and a decrease in the profile losses. For example, in the variant with relatively high unguided turning angle δ = 15.9°, the profile loss goes down by about 4% compared to the variant with low angle δ = 2.3° at the exit Mach number M2is = 0.88.
The effect of the trailing edge shape on the profile loss was studied on three cascades corresponding to the tip, middle, and hub sections of a transonic blade. Each cascade was represented by two sets of blades: one with round TE and one with blunt TE. Measured losses are higher in cascades with blunt TE than in cascades with round TE by 1–3% depending on the blade section.
The experimental and numerical results have been used for the optimization of the profile losses in the transonic vane with a thick and blunt trailing edge d2/a2 = 0.2. Numerical investigations showed that the increase of the unguided turning angle for the initial cascade from δ = 2.0° to δ = 16.2°, without a change in other basic geometric parameters, allowed for a significant reduction of the profile loss by about 4% at the exit Mach number M2is = 0.9.
Experimental investigations of four cascades with cooling air injection into the base flow through the trailing edge confirmed the fact that in vanes and blades with unguided turning angles δ < 7°–10° and a low level of the base pressure Cpb < −0.1 at = 0 a non-monotonic dependence of the change of losses against relative cooling air mass flow is observed. First, the cooling air injection into the wake increases the base pressure, leading to a decrease in losses. Then the losses start to increase with increasing cooling mass flow due to the interaction between main flow and cooling air (mixing losses) and finally, with a further increase in the cooling mass flow and a corresponding rise of momentum the losses decrease again. In blades with δ > 10° and an increased level of the base pressure coefficient Cpb ≥ −0.1 at = 0, the cooling air injection causes an instantaneous increase in losses and then, according to the increase in cooling mass flow momentum, losses decrease.
These investigations showed that for cascades with a moderate unguided turning angle (δ < 16°) and trailing edge thickness in the range d2/a2 < 0.2, the injection through the trailing edge slot parallel to the main flow leads to a neutral impact on loss and even a loss reduction in the subsonic range and a loss increase in the supersonic range of exit Mach numbers. The variation of loss due to injection ranges from −2 to +2%, which is significant and must be taken into account in the blade design process.
The numerical simulations of the impact on the losses are in reasonable agreement with measurements, which means that numerical tools can be used for this purpose in design practice.
Thus this study has demonstrated how to achieve a reasonable level of losses in transonic turbine blades with a significant trailing edge thickness. The options considered provide more degrees of freedom for blade designers, reduce restrictions on tolerances, improve manufacturability, and reduce costs.

