Article

Full Annulus Simulations of a Transonic Axial Compressor Stage with Distorted Inflow at Transonic and Subsonic Blade Tip Speed †

Institute of Jet Propulsion, Bundeswehr University Munich, Werner-Heisenberg-Weg 39, 85577 Neubiberg, Germany
*
Author to whom correspondence should be addressed.
This paper is an extended version of our paper published in Proceedings of the European Turbomachinery Conference ETC12 2017, Paper No. 211.
Int. J. Turbomach. Propuls. Power 2018, 3(1), 7; https://doi.org/10.3390/ijtpp3010007
Submission received: 7 December 2017 / Revised: 2 February 2018 / Accepted: 6 February 2018 / Published: 14 February 2018

Abstract

:
This article reports on systematic numerical studies on an axial compressor stage with distorted inflow. Four operating points at two speedlines were simulated with an inflow distortion generated by a 120 -sector segment with a wedge-type cross-section. With this setup, the interaction between the distorted inflow and the rotor flow was studied. The focus was put on the differences of the interaction between the distorted inflow and rotor flow as well as on the compressor behaviour at subsonic and transonic blade tip speeds, as the general mechanisms have been analysed in more detail in previous publications. The distorted flow itself is not influenced by the blade tip speed, but the interaction phenomena depend strongly on the spool speed and operating point. Additionally, the blade tip speed influences the circumferential sector of the compressor stage exit, which is affected by the distorted flow. The impact reaches from a small sector at 65% spool speed, with the peak efficiency operating point up to nearly the entire annulus at 100% spool speed, near the stall operating point.

1. Introduction

The design process of new aircraft engines depends heavily on reliable simulation environments, due to demanding and ambitious design goals as defined for instance by the Advisory Council for Aeronautics Research in Europe (ACARE) by the European Commission [1]. The requirements for aircraft concerning lower specific fuel consumption and less noise emissions are challenging. Today’s modern compressors need to provide higher pressure ratios to achieve higher thermal efficiency while the number of turbomachinery stages and the weight are reduced by the usage of lightweight materials. To obtain this goal with fewer turbomachinery stages, the remaining stages become higher loaded, which makes the compressor stages prone to deviations from their designated operating range. Flow distortions induced by the integration and the intake of the jet engine also impact the performance and surge margin of the compressor as investigated by Schnell et al. [2]. As the deviations from the designated operating range are likely to occur in flight situations like high angle of attack or strong crosswinds, the compressor stages have to withstand them without significant loss in surge margin for safety reasons. As the surge margin of compressors decreases with inlet distortions, investigations on the behaviour of compressors with distorted inflow are still necessary. Hah et al. [3] have shown the loss in surge margin in their experimental and numerical studies on the effects of an inflow distortion on an axial compressor stage. While their approach with distortion screens and modified numerical boundary conditions gives insight into the reaction of the compressor to the inflow distortion, the upstream influence of the compressor on the distorted flow cannot be investigated. Requirements for the design process of low-pressure compressors and fans are simulation tools capable of resolving strong secondary flow phenomena within turbomachines, the interaction between secondary flow phenomena and inflow distortions, and handling non-uniform inlet boundary conditions. Numerical simulations of a multistage fan were published by Yao et al. [4,5], demonstrating the capability of 3D-Navier–Stokes solvers to capture the effects of the transport mechanisms of total pressure distortions.
The investigation presented in this paper is based on the works of Lesser and Niehuis [6] and Lesser [7]. The distortion and the interaction with the flow phenomena present in the compressor at full spool speed (N100) was extensively analysed by Barthmes et al. [8] and Haug et al. [9]. In this paper, the focus is put on the behaviour of the distorted inflow and the interaction of itself with the rotor flow at full (transonic) spool speed (N100) and reduced (subsonic) spool speed (65% spool speed, N65). In order to evaluate the influence of the spool speed on the distortion and the affected distortion on the rotor flow, full annulus unsteady numerical simulations on a transonic axial compressor stage with an inflow distortion were conducted at two operating conditions at each speedline: peak efficiency (PE) and near-stall (NS).

2. Methods

2.1. Compressor

The compressor chosen for the numerical and experimental investigations was the TU Darmstadt Transonic Compressor (DTC). The DTC in its “rotor 1/stator 2” configuration is an axial transonic one-stage compressor. It contains 16 rotor blades and 29 single stator vanes. At its design spool speed of 20.000 rpm (N100), it delivers an overall total pressure ratio of 1.5. The DTC is a test vehicle especially designed for the investigation of 3D-, secondary- and stall flow phenomena. Design features similar to the turbofans of jet engines are exhibited by rotor 1; therefore, the interactions with inlet distortions are assumed to be transferable to real engines. The compressor itself is well-known in open literature, and detailed information on the compressor has been published by, e.g., Schulze [10], Bergner [11], Biela et al. [12], and Müller et al. [13].
Since the DTC test facility is not suited to the integration of a typical jet engine intake duct, a different approach had to be chosen. To mimic the flow situation present in typical intake configurations, a particular distortion generator (DG) for the feeding duct had to be designed.

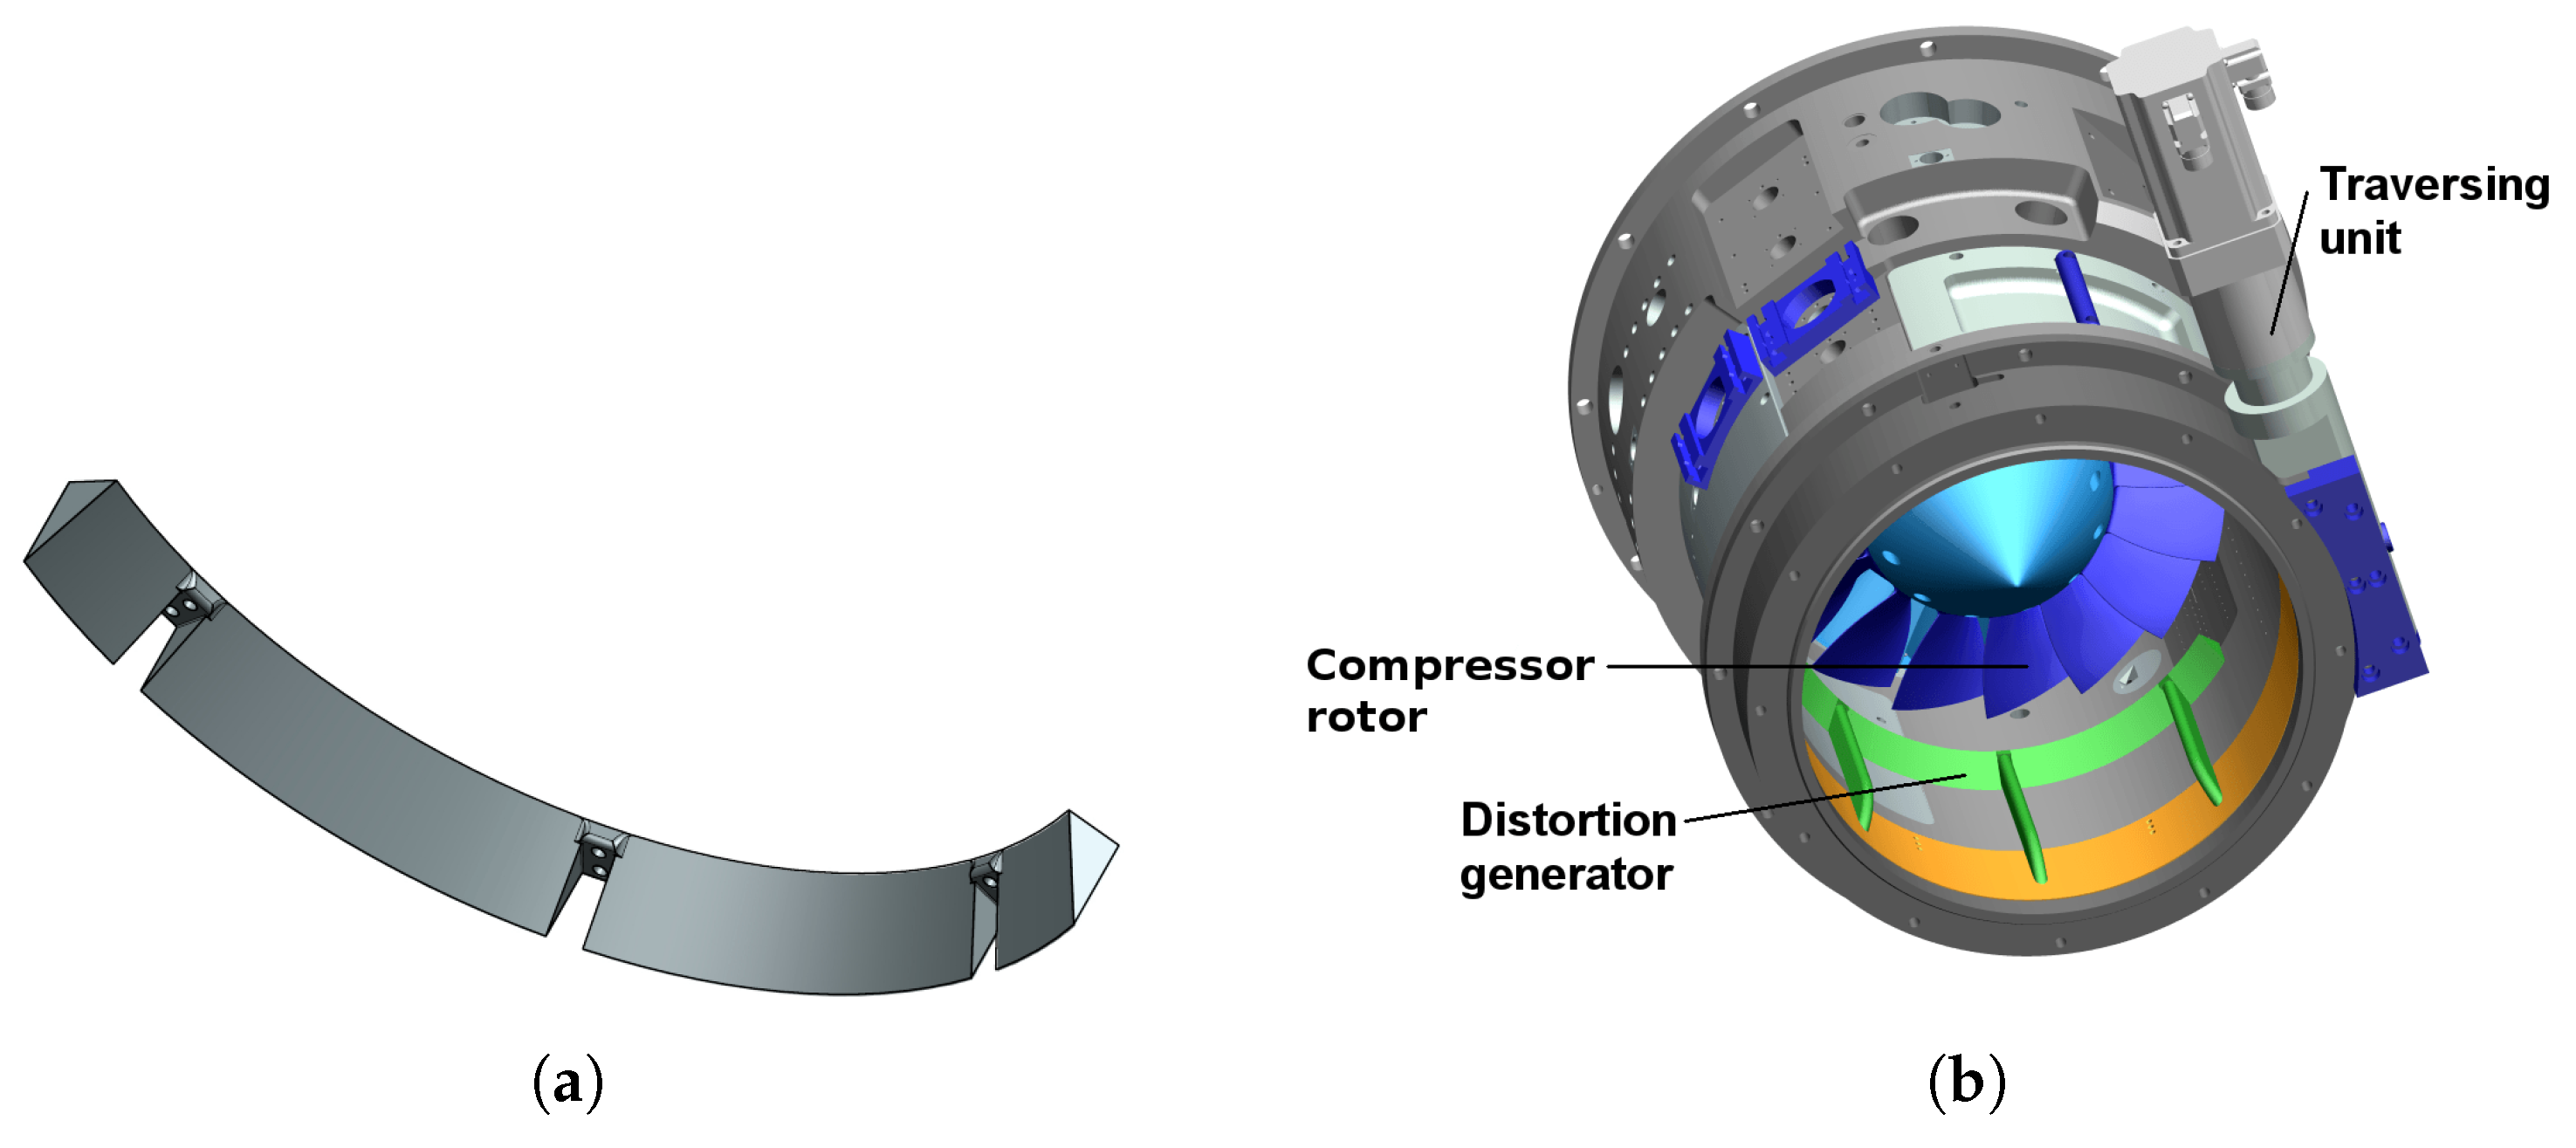
2.2. Distortion Generator

The design of the distortion generator started with a type of DG that provided unsteady cross-flow vortices of particular frequency to simulate the vortex shedding of a stalled intake duct (see Niehuis et al. [14]). Based on the results of Vunnam and Hoover [15], the second type of distortion generator should provide a flow distortion directly at the casing in order to generate a kind of distortion with stronger impact on compressor stability, since the DTC is known as a tip staller. In the case under consideration here, the distortion also had to be comparable to an inlet distortion generated by a nacelle or jet engine intake at high angle of attack or crossflow. As shown by, e.g., Colin et al. [16] and Hall and Hynes [17], this type of distortion can reach an angular extent up to 180 for the investigated distortion pattern.
Since the interaction of the compressor rotor and the distortion was to be investigated experimentally and numerically, a generic distortion by a modified numerical boundary condition as well as the typical total pressure distortion screen—which is difficult to transfer into a realistic numerical model—was not an option. Instead, the design of the distortion generator had to suit both the numerical investigation and the experimental investigations. These requirements forced the development of a new distortion generator, which resulted in a 120 segment of a circular ring with a wedge-type cross-section and a height of 10 % duct height. The distortion generator was mounted with the sharp edge towards the inflow boundary at the casing (as shown in Figure 1), comparable to a backward-facing step. The three mounting struts which are necessary to mount the distortion generator onto the traversing unit were omitted from the numerical model, because no relevant influence was expected.
With an extent over a 120 segment, the size of the distortion generator was large enough to prevent the interaction of the undistorted fluid at the entry of the distortion with the undistorted fluid from the exit of the distortion. As the critical spoiling sector according to Reid [18] was reached, a strong distortion with a D C 60 = 0.43 at PE100 and D C 60 = 0.5 at NS100 occurred, which did not mix out upstream of the rotor entry plane. Although the separated flow was reattached upstream of the rotor blade’s leading edge, there were strong interactions of the distorted inflow with the rotor flow, as intended (Wartzek et al. [19]).

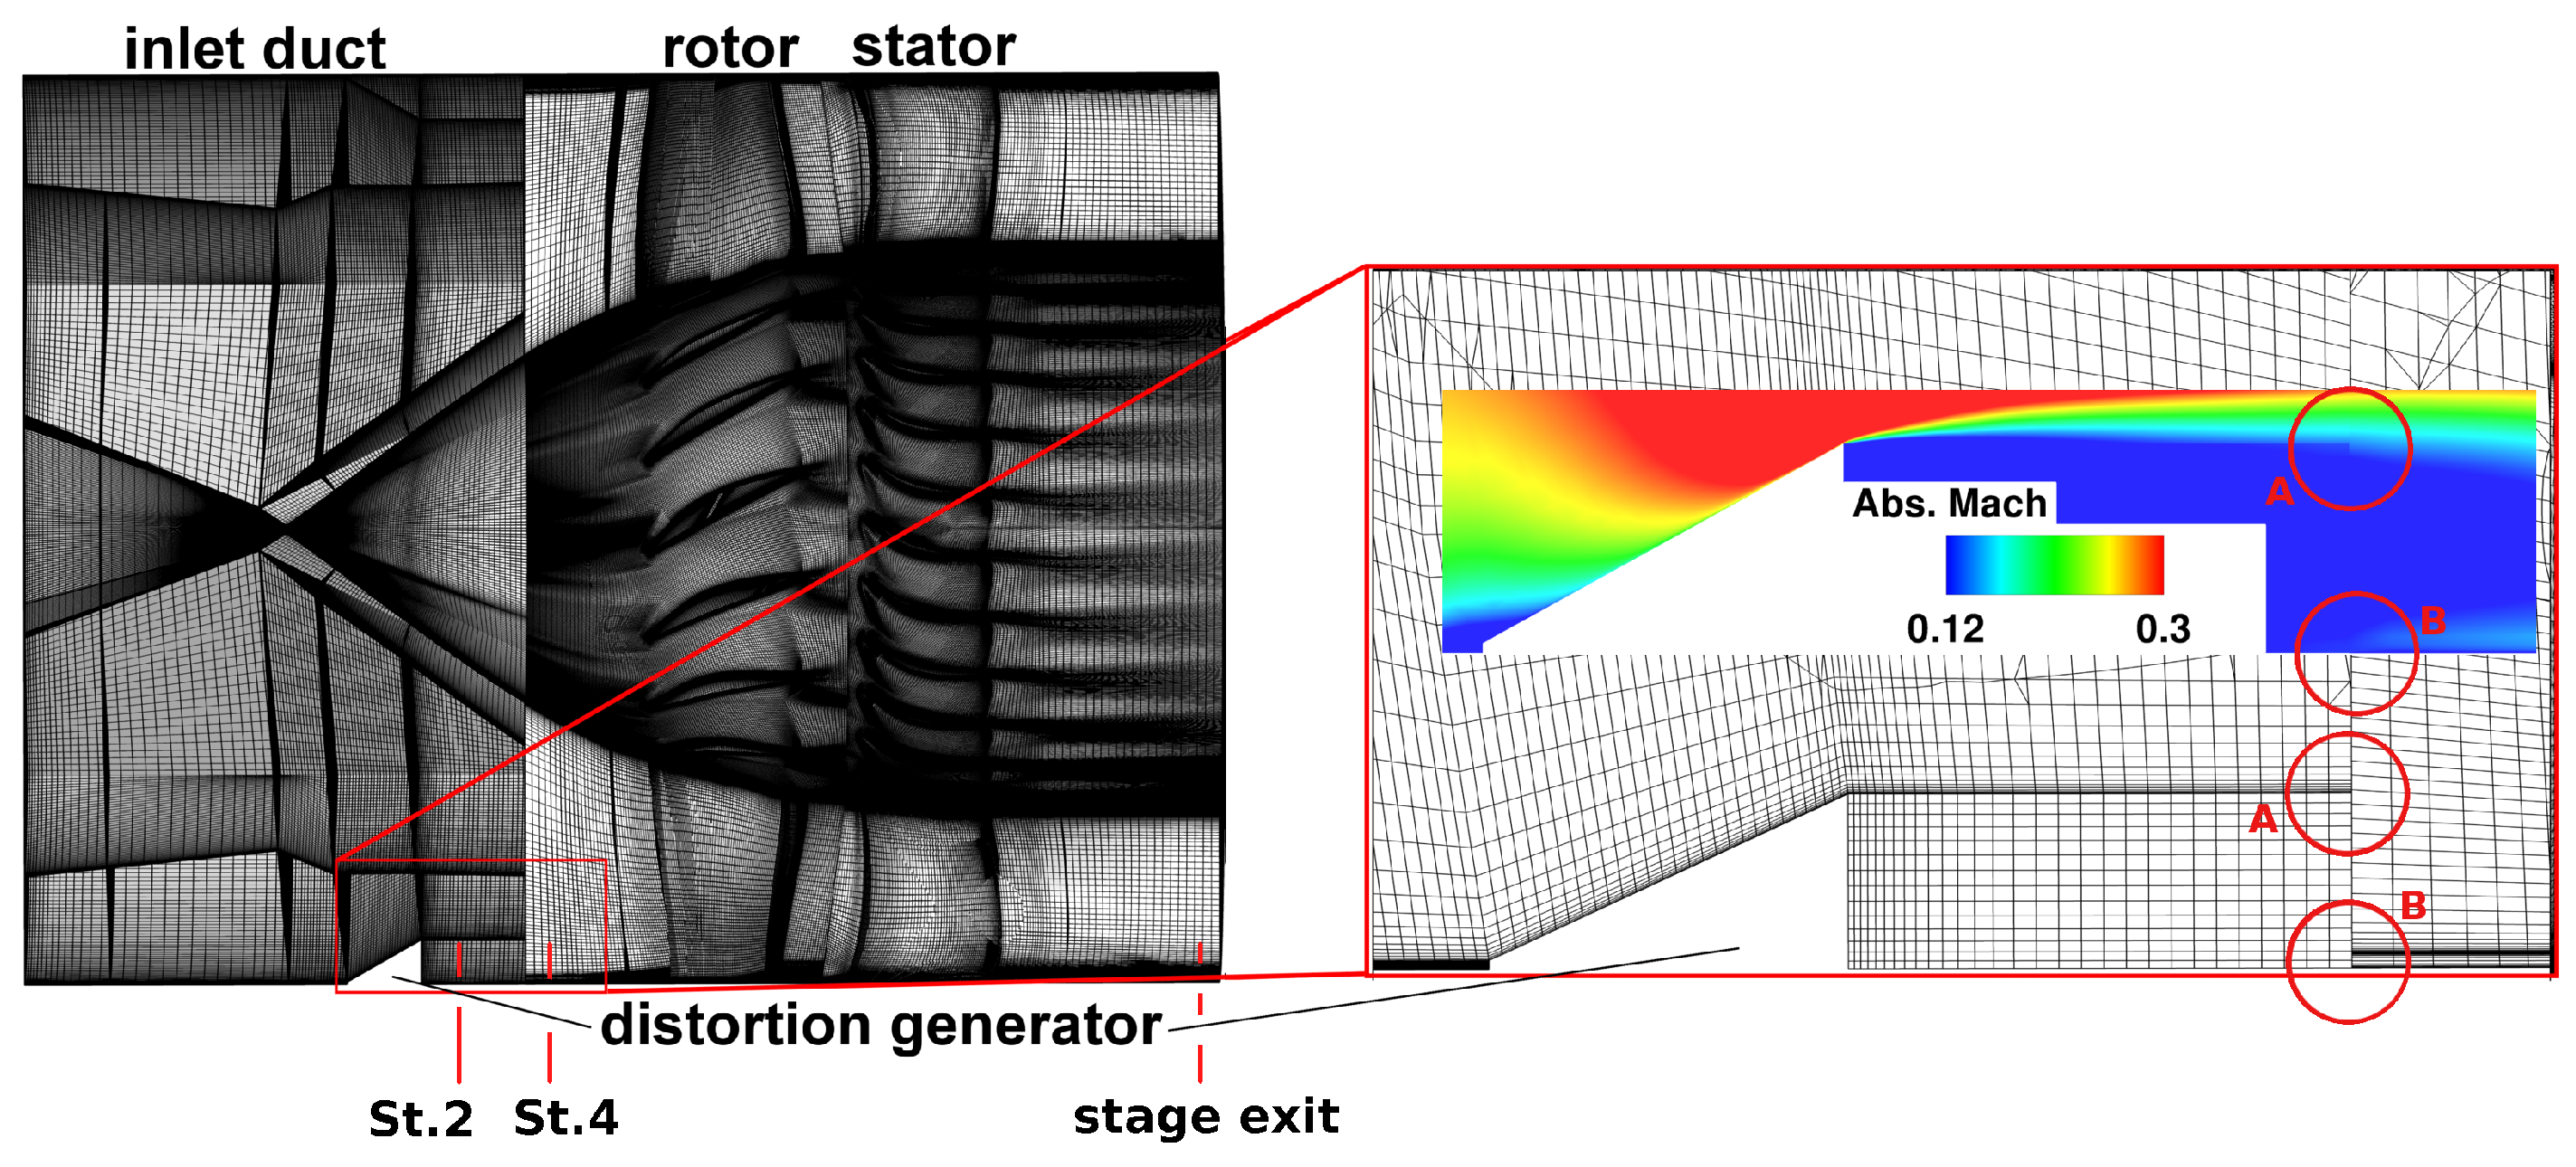
2.3. Meshing Procedures

The structured meshes within the compressor domain were generated with the DLR G3DHexa (DLR, Institute of Propulsion Technology, Cologne, Germany) meshing tool. The rotor and stator mesh consisted of an OCH topology. The meshes used for the simulations were chosen based on a comprehensive mesh independency study published by Ciorciari et al. [20]. The inlet domain with the distortion generator used a mesh generated with ANSYS ICEMCFD (ANSYS, Canonsburg, PA, USA) with a grid resolution adapted to the downstream rotor grid (as shown in Figure 2) to minimize interpolation errors and mesh-generated numerical diffusion between the two domains.
The grid mismatch between the shear layer downstream of the distortion generator in the inlet domain (Figure 2, region A) and the casing region of the rotor domain (Figure 2, region B) did not cause significant interpolation errors or strong smearing of the flow field, as shown by the Mach number plot in Figure 2. The calculations were carried out with wall functions and a y + 10 due to the high demands on computational resources for these full annulus simulations. This resulted in a mesh with 480 structured blocks with about 65 million cells.

2.4. Flow Solver

The simulations were conducted using the flow solver TRACE (DLR (Institute of Propulsion Technology), Cologne, Germany) from the TRACE environment. TRACE is specialized for turbomachinery applications and internal flows with structured grids. It solves the unsteady Reynolds-averaged Navier–Stokes equations (URANS) with an implicit finite volume approach. Second-order non-reflecting boundary conditions are used as well as different options to model rotating frames of reference. Further information on TRACE can be found in Kozulovic et al. [21] and Marciniak et al. [22].
The implementation of the well-known Wilcox k- ω turbulence model was used in the studies presented in this paper. Based on experience with several other compressor simulations (conducted with TRACE by Ciorciari et al. [20]), a similar set of numerical parameters was chosen. As boundary conditions, an axial inflow with given total pressure and total temperature was prescribed at the inlet. The turbulent intensity was set to 4% and the turbulent length scale to 1 × 10 4 m. The boundary condition at the outlet was set by a static pressure radial equilibrium at midspan. Spatial and time discretisation was set to second-order after obtaining an initial solution with first-order spatial discretisation. The simulations were conducted with 1800 time steps per revolution, and 25 subiterations with the residual dropping about 1.5 magnitudes; six to eight revolutions were needed for convergence after switching to second-order spatial discretisation. Overall, about 280,000 CPU hours were needed for each operating point. The post processing was performed using DLR POST (DLR, Institute of Propulsion Technology, Cologne, Germany), TecPlot 360ex, TecPlot Chorus (Tecplot, Bellevue, WA, USA) and several self-implemented scripts.
Validation of the numerical simulations against experimental data, taken at the TU Darmstadt with the same configuration, was performed by Barthmes et al. [8] and Wartzek et al. [19].

3. Results

In this section of the paper, the results of the conducted simulations are presented. A brief description on the distortion in general is given, after which the distorted flow upstream of the rotor entry plane is analysed. Afterwards, the interaction of the distorted inflow with the flow phenomena present in the rotor at N100 and N65 is discussed.

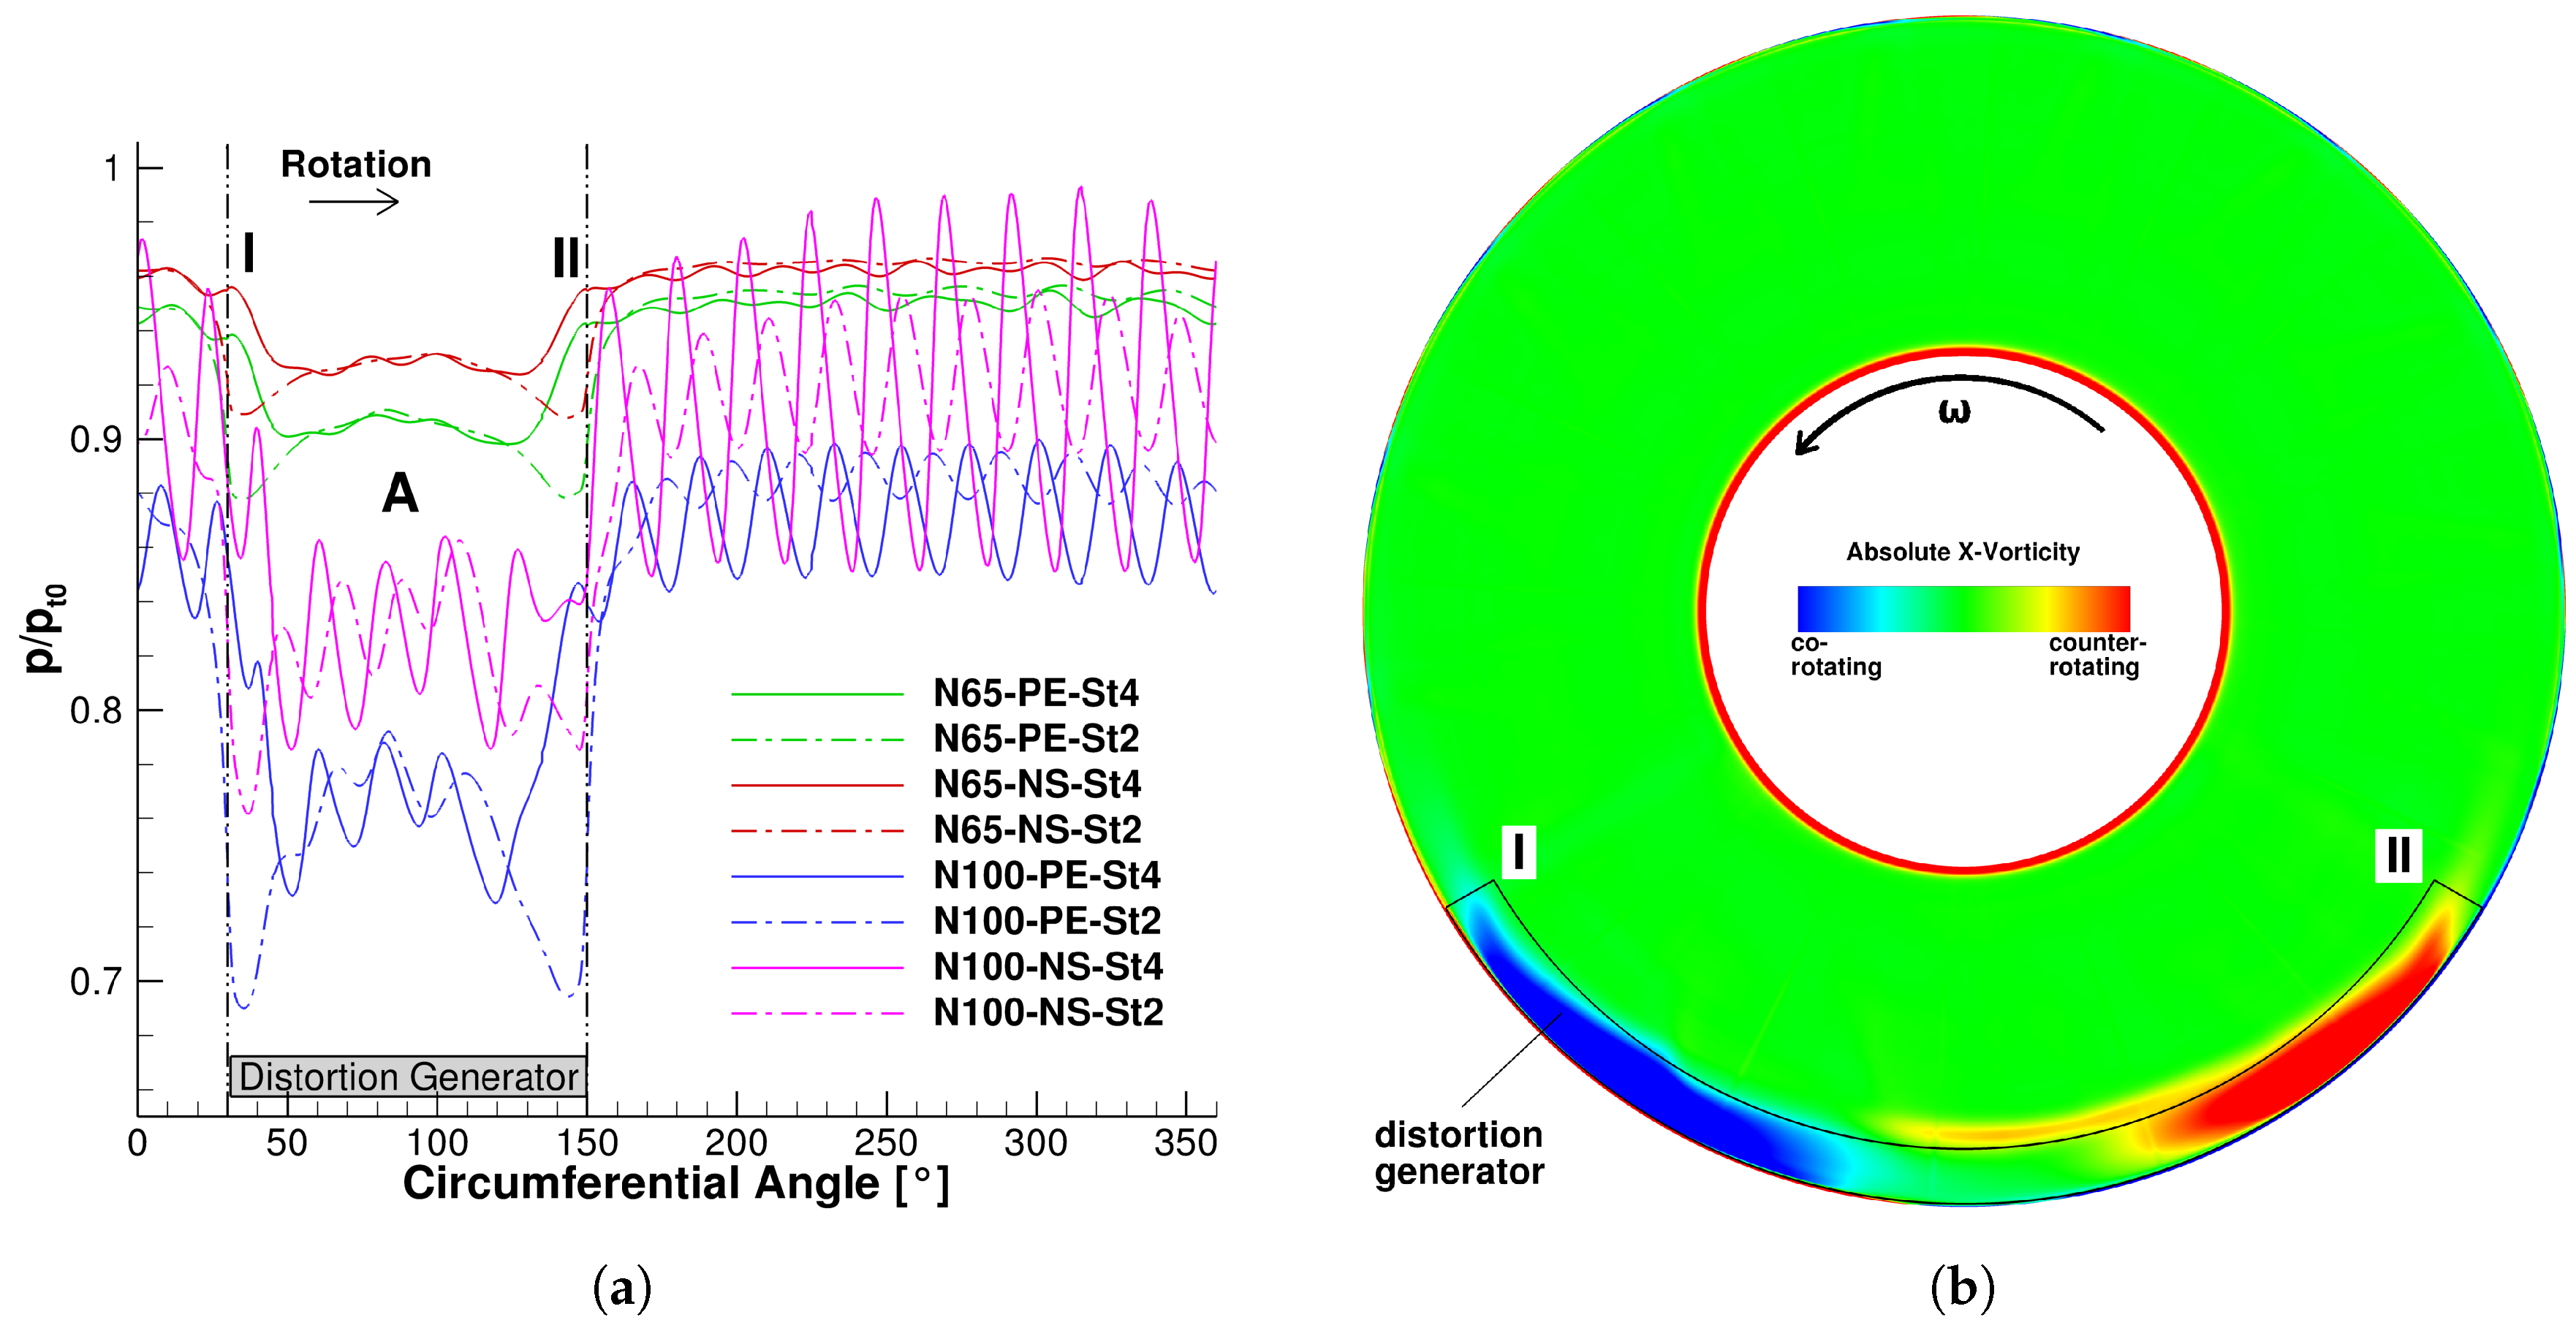
3.1. The Distortion in General

A region of recirculation with a significantly decreased static pressure was caused by the distortion generator between itself and the rotor entry plane, as plotted for an instantaneous snapshot in Figure 3a for two different stations (see Figure 2) between the distortion generator and the rotor entry plane. At N100 (pink and blue lines), the pressure spikes caused by the transonic operating condition of the rotor are superimposed with the general static pressure field around the annulus. The co- and counter-rotating swirls at the entry and the exit of the distorted sector—as depicted in Figure 3b by the x-component of the vorticity—were caused by the pressure gradient between the lower static pressure inside the distorted flow, which is marked with “A” in Figure 3a and the higher pressure inside the undistorted flow. The asymmetry of these swirls was caused by the upstream influence of the rotor on the flow field. These swirls influence the shape of the distorted flow in such a way that its circumferential extent decreased in the region between the distortion generator and the rotor entry plane. This decreasing size was recognizable when comparing the differences of the low-pressure region at two different stations between the distortion generator and the rotor entry plane (dashed-dotted line, near the DG; solid line, near the rotor entry plane) between “I” and “II” in Figure 3a. Before entering the rotor, the flow was completely reattached. At all calculated operating points, the following features were exhibited by the distortion, as also stated by Lesser and Niehuis [6] and Wartzek et al. [23]:
  • Co-rotating swirl at the entry of the distortion
  • Counter-rotating swirl at the exit of the distortion
  • Alteration and change of shape of the distortion on its way downstream through the compressor
  • Variation of incidence and blade loading
  • Mass flow redistribution
They were also described by Gunn et al. [24], who analysed another fan geometry operating with a continuous inlet stagnation pressure distortion, although their distortion was generated in a different way by a 60 sector gauze.
It was found here that neither the speedline nor the operating point on the particular speedline had a significant influence on the circumferential extent of the distorted flow upstream of the rotor entry plane. Additionally, the shape of the graph in region “A” (Figure 3a), with the spikes at the entry and exit region of the distorted flow, was comparable for all simulated operating points, despite the amount of the pressure drop inside the distortion. This behaviour of the distortion matched the assumption of the critical spoiling sector to be reached by the DG at all analysed operating conditions.

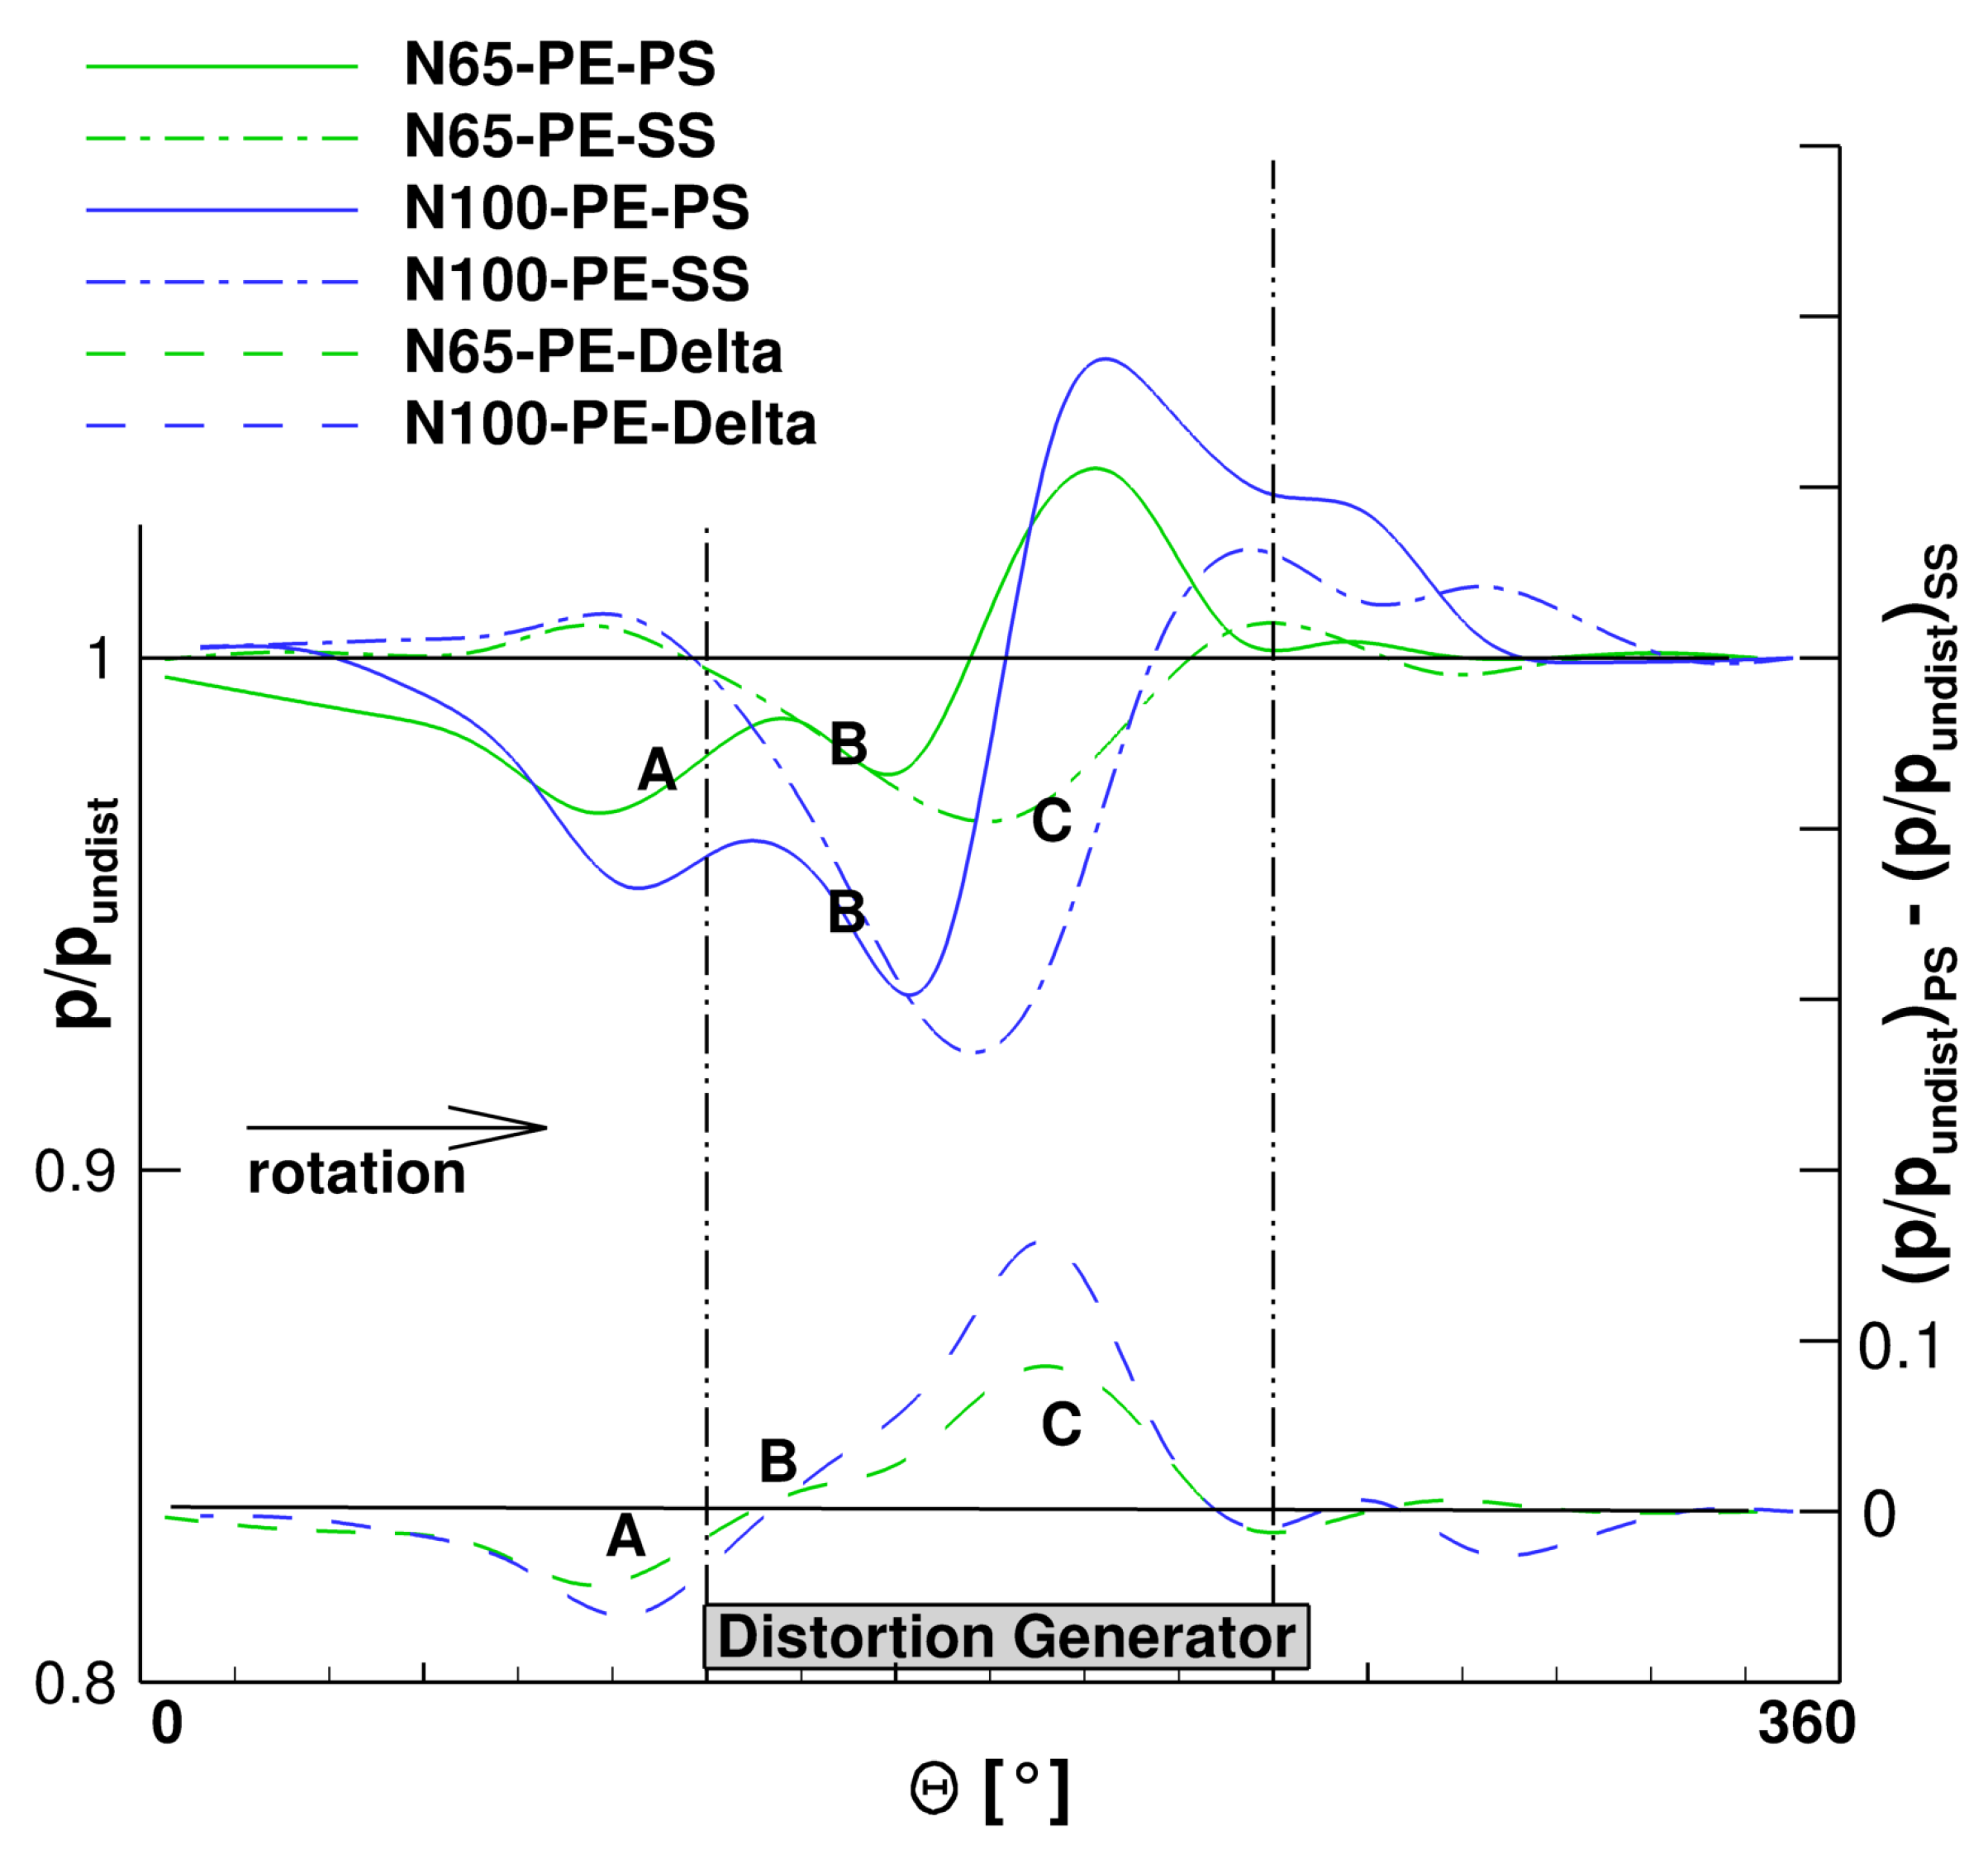
3.2. Interaction of the Distorted Flow and the Rotor

The local swirl areas influenced the flow angle at the rotor entry plane in a such way that the incidence was lowered in the entry region (I at Figure 3a and Figure 4a to Figure 4d) and raised in the exit region of the distorted flow (II). Due to these variations of the incidence around one revolution of the rotor, the aerodynamic loading on the blades varied accordingly with one revolution in a way already reported in Barthmes et al. [8]. Figure 5 visualizes the averaged static pressure from 70% to 100% span height from the leading edge to the trailing edge of the blade on the pressure side (PS, solid lines) and on the suction side (SS, dashed-dotted lines) around one rotor revolution. The static pressure was normalized with the static pressure on the respective blade side in the undistorted flow region of the same simulation.
The difference between the normalized pressure on both blade surfaces (dashed lines in the lower part of Figure 5) is an indicator of the aerodynamic loading of the blade in its outer part.
The region marked with “A” indicates a lowered blade loading compared to the undistorted region, as the pressure on the pressure side dropped prior to the pressure on the suction side. Region “B” indicates a region where the aerodynamic loading was comparable to the blade loading in the undistorted region. At the exit of the distorted flow, region “C” marks the region where the aerodynamic loading rose above the level of the the undistorted flow region. The mechanisms driving this change in aerodynamic blade loading were explained in more detail by Haug et al. [9]. As the congruence of the trend of both speedlines was fairly good, the general mechanism of the unloading and loading of the blades travelling through the distorted flow was almost independent on the rotational speed of the rotor. This also agrees with the distortion in general upstream of the rotor being independent of the speedline.
As the aerodynamic loading of the blades had an impact on the flow field, variations of it resulted in a varying flow field in the compressor stage from the rotor entry plane throughout the entire compressor stage down to the flow field at the stage exit. Figure 4a–d show the entropy distribution in the blade tip region at about 98% span for the operating points PE and NS at both speedlines. In all four cases, the lowered blade loading at the entry of the distortion (I) resulted in a reduced entropy production (A’) in the stator region. The raised entropy production originating from the area with higher blade loading (II) was also visible in the stator region (C’) of the compressor.

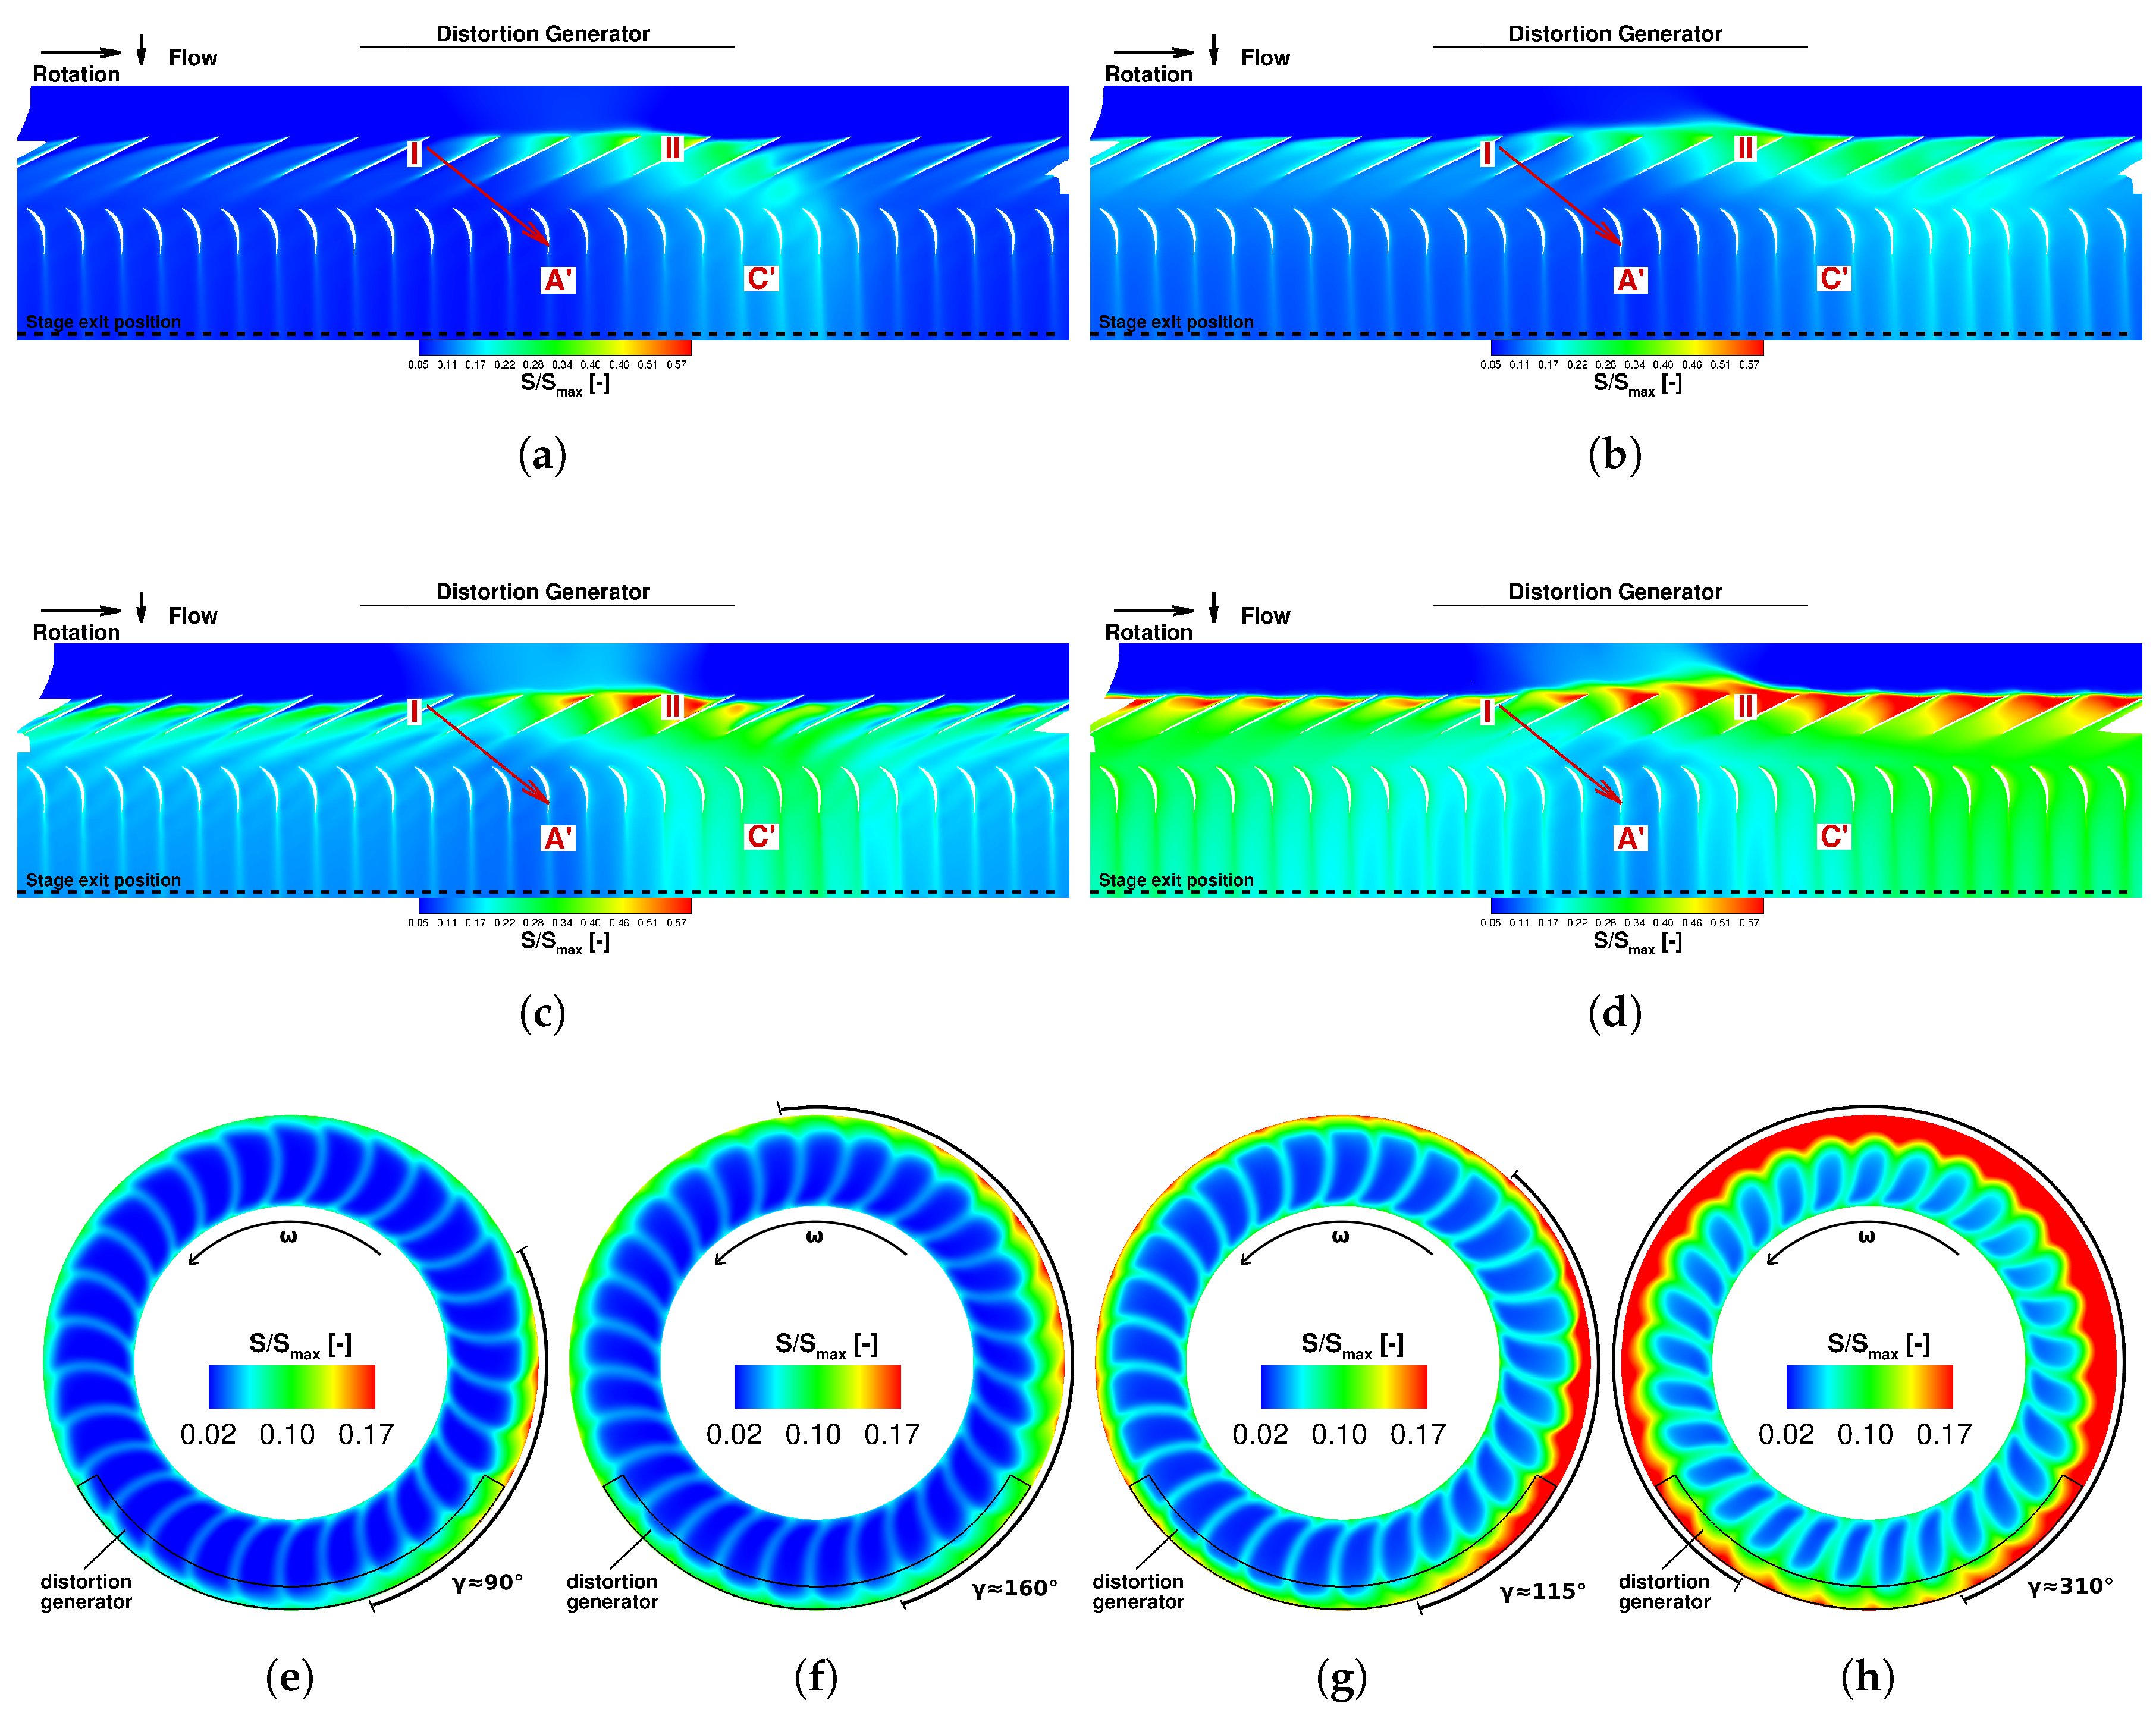
Stretching and Transportation of the Distorted Flow in the Circumferential Direction

The rotational speed of the rotor differed between the two speedlines, and the time period for which the fluid resides in the rotor—expressed by the axial velocity—varied between all operating points under consideration here. Due to these differences between all four operating points, the amount of the annulus for which the distorted fluid is transported in the circumferential direction depended on the operating point (PE and NS) and the speedline (N65 and N100). As described by Haug et al. [9], the distortion was not only transported around the annulus but also stretched in the direction of the rotor rotation around the annulus. This again depended on the rotational speed and the axial velocity of the fluid, so this stretching depended on the operating point and speedline, as well. This behaviour was also observed by Wartzek et al. [19] in the experimental test data for this setup. The peculiarity of the transportation and stretching were the factors which defined the amount of the circumference which was affected by the distortion at the stage exit. Figure 4e–h visualize these differences in the circumferential extent at all four operating points with the aid of the entropy ratio, where γ denotes the sector influenced by the distortion. The entropy ratio is defined as the local entropy related to the maximum entropy of the respective case.

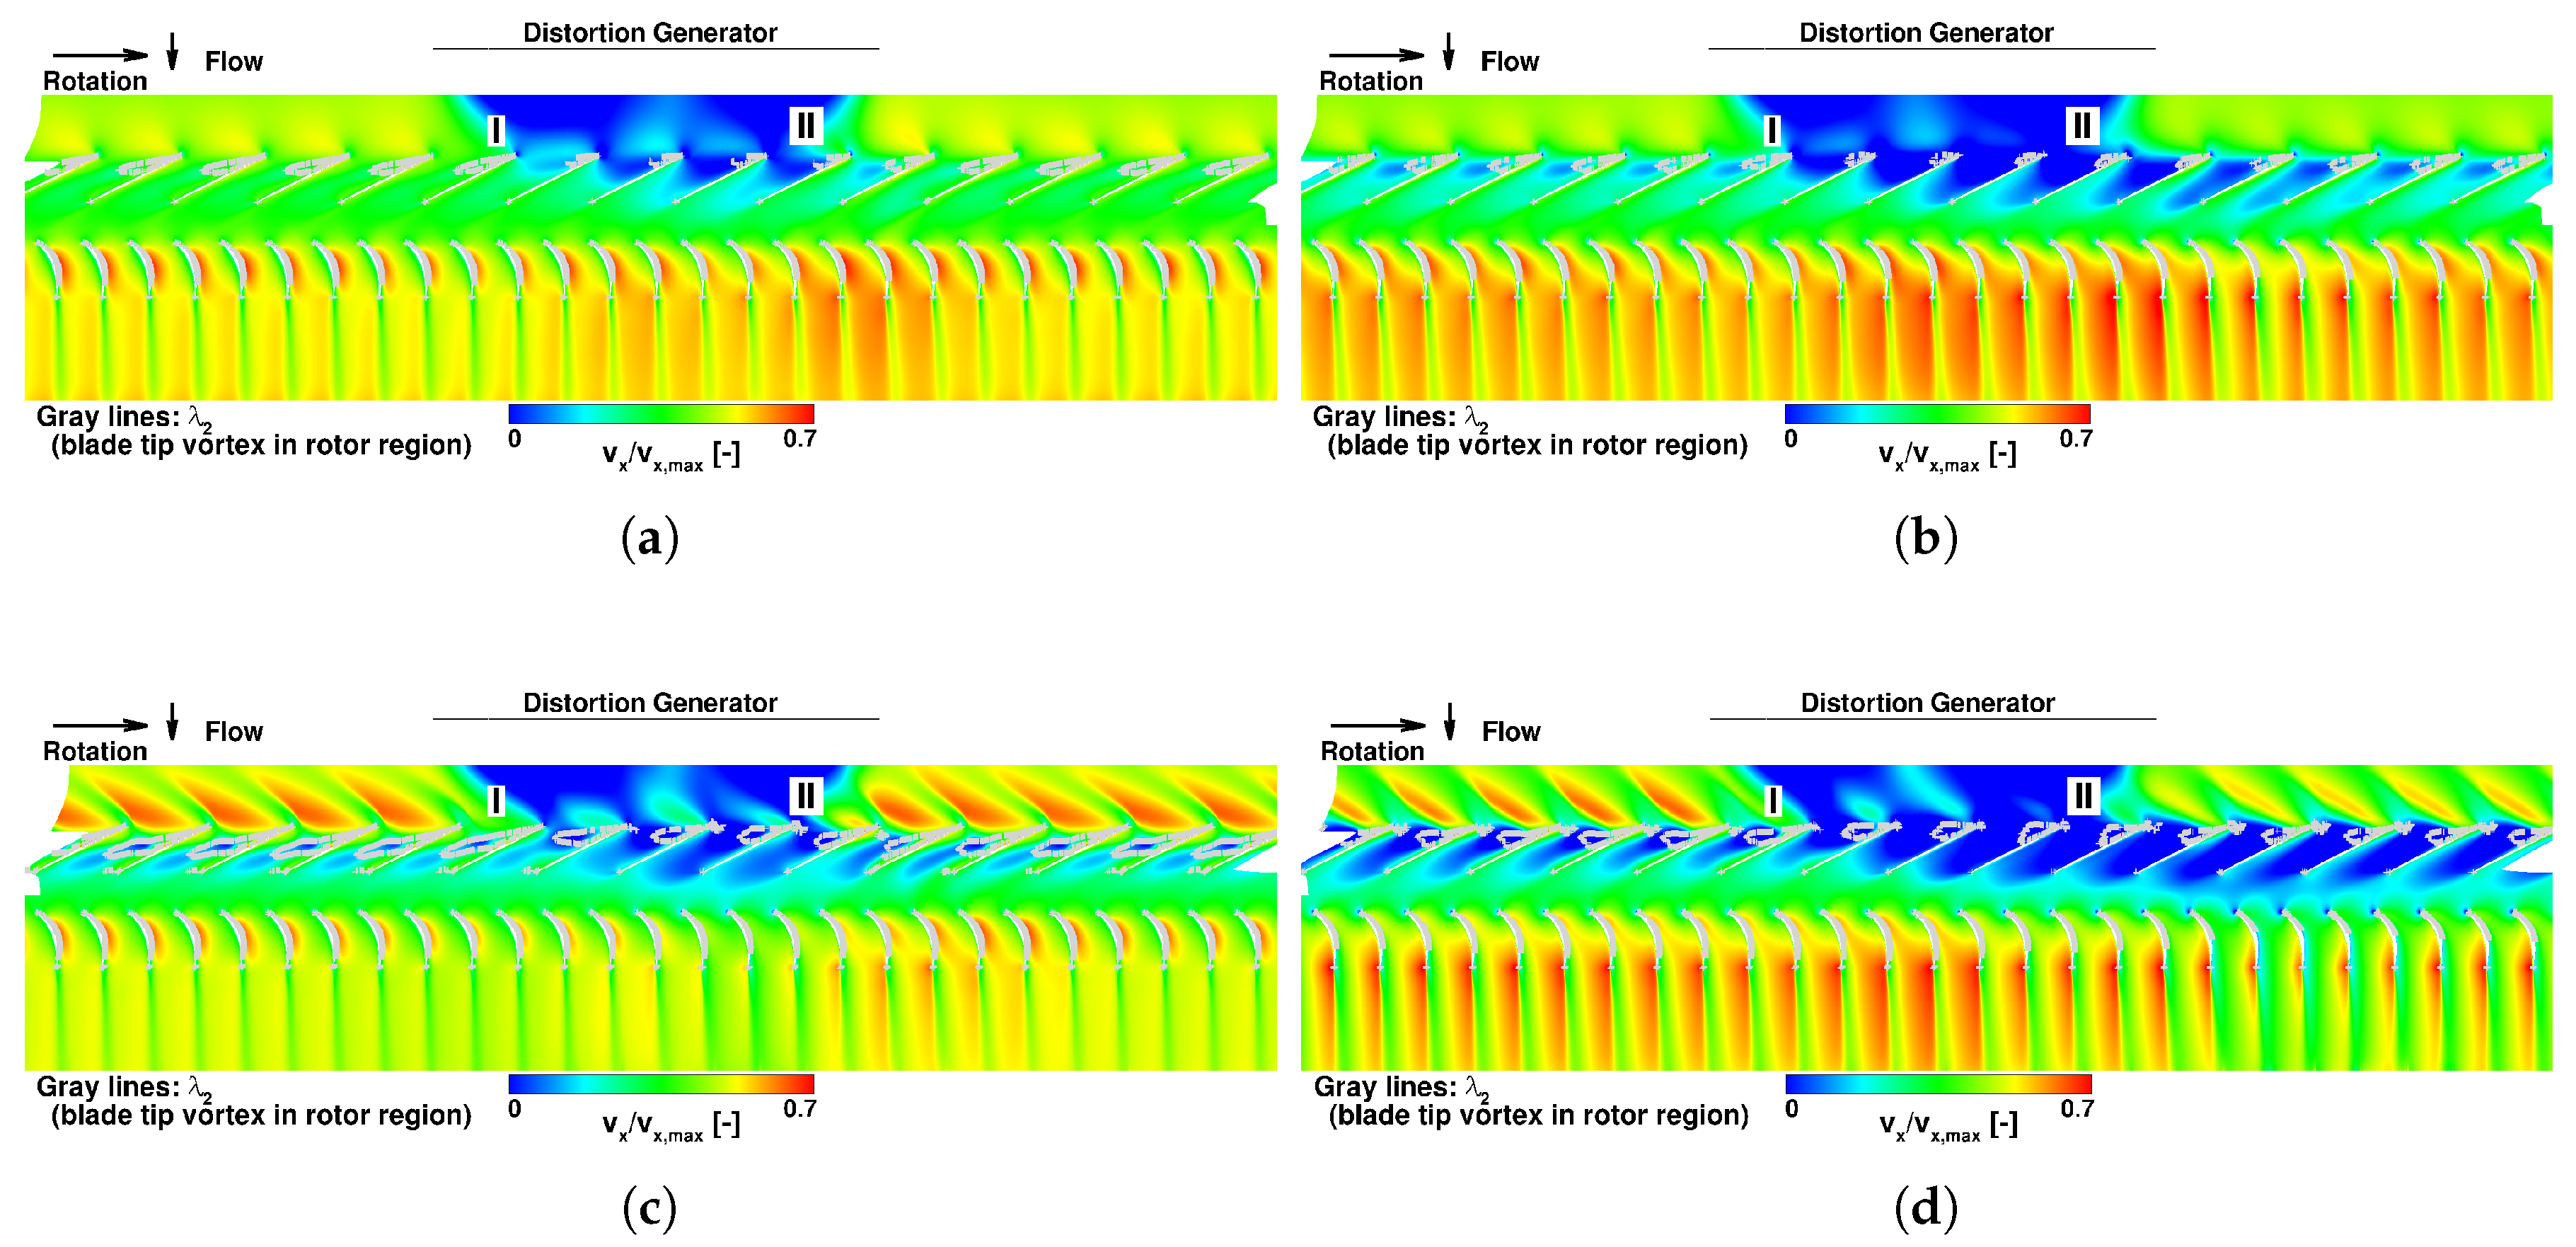
3.3. Blade Tip Vortices

As the blade tip vortices (BTVs) are driven by the pressure gradient between the two sides of the blade (PS to SS), they were affected by the variations of this pressure gradient (Figure 5). In Figure 6 a blade-to-blade plot at 98% span is shown, coloured with the ratio of the local axial velocity to the case’s maximum axial velocity. The gray lines in the rotor tip region surround the BTVs via the λ 2 -criterion, which can be used to identify these vortices. The variation of the shape of the BTVs around the annulus can easily be recognized as the difference of the axial velocity ratio, especially in the rotor tip region; both features are discussed in the following.

3.3.1. Subsonic Blade Tip Speed

At N65, the BTVs were not as pronounced as they were at N100, as the pressure difference between both blades sides was lower. At the operating points on the N65 speedline (Figure 6a,b), the BTVs were quite short and reached to about one-third of the chord length of the rotor blades. The fluid inside the BTV got energized by the surrounding fluid and flowed downstream without blocking the blade tip area. At the blades entering the distorted flow (I), the BTV decreased in size. The slower, low-energy fluid from the shortened BTV stretched over a small area at the leading edge part in the blade tip region and was then transported downstream. As soon as the blade left the distorted flow area (II), the BTV recovered to its original shape. At N65 NS, the velocity drop of the low energy fluid of the shortened BTV was stronger than at N65 PE. The size of the area at the blade tip region with low-energy fluid was larger. These differences between N65 PE and NS are identifiable by comparing the axial velocity ratio (Figure 6a,b) as well as the entropy ratio in the blade tip region (Figure 4a,b), which is an indicator for generated losses.

3.3.2. Transonic Blade Tip Speed

For the N100 speedline, the general mechanism was the same as for N65, but the BTVs were more distinctive. As N100 features transonic flow, the BTVs additionally had to withstand the pressure rise of the shockwave. While the shockwave and the BTVs were transformed by the distortion, the BTV was not able to resist the pressure rise in the core of the distorted flow and broke down (Barthmes et al. [8], Haug et al. [9]). The high entropy production at transonic blade tip speeds (Figure 4c,d; II, C’) is a result of the break down of the BTVs and the high amount of low-energy fluid (Figure 6c,d; II) which resides in the blade tip region and blocks the through flow in the passage at the blade tip region. At N100 PE, the BTV recovered soon after leaving the distorted flow sector, such that the entropy level dropped and the axial velocity inside the blade passage at the tip region rose quickly after the blades left the distorted flow sector. At N100 NS, the BTVs needed a larger part of the circumference to recover from break-down to their original shape than at N100 PE. Additionally, a larger part of the passage was blocked by the low-energy fluid from the broken-down BTVs in the blade tip region.
Due to the higher rotational speed at N100 compared to the N65 case, the fluid from the distortion was transported around the annulus for a larger circumferential distance, and thus a larger part of the downstream flow field was influenced by the distortion. As the reduced mass flow through the compressor stage was lower at the NS operating points, the axial velocity was accordingly reduced compared to PE. This resulted in a stronger influence of the rotational movement of the rotor on the flow field caused by the increased time period the fluid resided in the rotor. These differences not only affected the flow field directly downstream of the rotor, but also the flow field at the stage exit, downstream of the stator. As the distorted flow was transported over sectors of different size, depending on the operating condition, the distortion affected a sector of about 90 at N65, PE ( γ , Figure 4e) to almost the full annulus at N100, NS ( γ , Figure 4h) at the stage exit of the compressor.

3.4. Radial Flow Redistribution

Due to the distortion of the inflow, the flow was redistributed in the radial direction in the flow downstream of the DG. This radial flow redistribution increased in intensity at the rotor region affected by the interaction of the distorted flow with the rotor flow, especially the BTVs (Haug et al. [9]). As stated in the previous sections, the impact of the distortion on the flow field downstream of the rotor entry plane depended on the rotational speed as well as on the operating point on the respective speedline. This caused the radial flow redistribution to be dependent on the operating conditions as well. At N65, at the stage exit only a small sector of the circumference was affected by the distortion. In comparison to the undistorted flow, this caused the altered radial flow redistribution to be limited to this small sector, as well. As at N100, the distorted sector at the stage exit was of a larger extent, the flow redistribution in the radial direction extended over a larger sector segment. The sectors marked with γ in Figure 4e–h are a good indication of the sector at which the flow is radially redistributed at the stage exit of the compressor.

4. Conclusions

In this paper, the focus was put on the comparison of an axial compressor stage with distorted inflow generated by a distortion generator upstream of the rotor entry plane at different spool speeds. At the lower spool speed (N65), the compressor operated at subsonic conditions, while the higher spool speed (N100) was a transonic speedline. On each speedline, two operating points—PE and NS—were simulated. The flow phenomena inside the compressor and the interaction of the distorted flow and the rotor flow were compared at all four operating points.
  • While the shape of the distortion upstream of the rotor entry plane was neither influenced by the operating point nor the rotational speed of the rotor, the pressure drop inside the distorted flow sector strongly depended on the rotor rpm and showed a minor dependency on the operating point at the respective speedline.
  • The degree of interaction between the distorted inflow and the rotor flow depended on the speedline as well as on the operating point on the respective speedline. Especially, the behaviour of the blade tip vortex varied with the rotational speed of the rotor when moving through the distorted flow sector. As the interaction of the distorted flow with the BTV had a strong impact on the compressor behaviour and performance, it can be considered as a important part of the interaction of the two flow regimes. At both speedlines, the BTV changed its shape soon after the blade entered the distorted flow, but characteristics and the recovery of the original shape of the BTVs depended on the speedline and operating point:
    -
    At N65, the BTV recovered quickly after the blades left the distorted flow. Additionally, the passage was not fully blocked in the tip region by low-energy fluid of the shortened or altered BTVs.
    -
    At N100, the interaction was stronger, as the BTV additionally interacted with the shock wave. Additionally, after break-down, the BTV recovered not as fast as at N65. The differences between PE and NS were higher than at N65, as the BTV regained its original shape much faster after leaving the distorted flow region at N100 PE than at N100 NS.
  • The general trend of the variation of the blade loading showed similarities for the particular operating point on both speedlines, but the amplitude of the variations of the blade loading at one rotor revolution were higher at N100 than at N65.
  • The radial flow redistribution depended on the speedline as well as on the operating point on each speedline, as it is driven by the mechanisms which are responsible for the interaction of the distorted flow and the rotor flow.
It has been shown that the effect of a strong inflow distortion—comparable to a stalled nacelle—on the compressor stage depended strongly on the operating condition. However, the distortion upstream of the rotor entry plane was only slightly affected by the speedline and operating point. The strongest impact of the distorted inflow on the compressor behaviour was on the transonic near-stall operating point (N100, NS). While at subsonic operating conditions (N65), the sector segment influenced by the distorted flow sector reached up to a maximum of about 160 at the stage exit and the flow in the rotor blade tip region recovered quickly after leaving the distorted sector. At transonic operating conditions, the distorted flow interacted with the flow in the rotor blade tip region in a massive manner, and nearly the entire annulus was influenced by the distorted inflow at N100 NS. As a significant part of the compressor annulus was influenced strongly by the distorted inflow, this behaviour must be considered when designing new compressors with aerodynamically higher loaded stages to prevent operation beyond the stability margins at common distorted inflow conditions.

Acknowledgments

The authors thank the former member of the Institute of Jet Propulsion, Sebastian Barthmes, for his work regarding this topic of research. Also, the authors acknowledge the funding of the research unit FOR1066 by the Deutsche Forschungsgemeinschaft (DFG). The simulations have been performed at the Leibniz Supercomputing Centre (LRZ), which is acknowledged here.

Author Contributions

The presented work is the research effort of Jakob P. Haug, including numerical simulations, post-processing, analysis and paper writing. As the head of the Institute of Jet Propulsion Reinhard Niehuis was responsible for the supervision of all research activity associated to the presented work.

Conflicts of Interest

The authors declare no conflict of interest. The founding sponsors had no role in the design of the study; in the collection, analyses, or interpretation of data; in the writing of the manuscript, and in the decision to publish the results.

Abbreviations

Abbreviations
BTVblade tip vortex
DGdistortion generator
DTCDarmstadt Transonic Compressor
N6565% design spool speed
N100100% design spool speed
NSnear stall operating point
PEpeak efficiency operating point
PSpressure side (of blade)
SSsuction side (of blade)
St.station (see Figure 2)
Latin Symbols
D C 60 distortion coefficient
ppressure (Pa)
Sentropy (J/K)
Vvelocity (m/s)
Greek Symbols
Δ difference
γ angular extent of sector
λ 2 criterion for identifying vortices
ω rotational speed
Subscripts
avgaveraged value
maxmaximum value at respective case
ttotal value
undistundistorted
xin x-direction

References

  1. European Commission. Flightpath 2050—Europe’s Vision for Aviation; Publications Office of the European Union: Luxembourg, 2011. [Google Scholar]
  2. Schnell, R.; Schönweitz, D.; Theune, M.; Corroyer, J. Integration- and Intake-Induced Flow Distortions and their Impact on Aerodynamic Fan Performance. In Advances in Simulation of Wing and Nacelle Stall; Radespiel, R., Niehuis, R., Kroll, N., Behrends, K., Eds.; Notes on Numerical Fluid Mechanics and Multidisciplinary Design; Springer: Berlin/Heidelberg, Germany, 2015; Volume 131, pp. 251–269. [Google Scholar]
  3. Hah, C.; Rabe, D.; Sullivan, T.; Wadia, A. Effects of Inlet Distortion on the Flow Field in a Transonic Compressor Rotor. J. Turbomach. 1998, 120, 233–246. [Google Scholar] [CrossRef]
  4. Yao, J.; Gorrel, S.E.; Wadia, A.R. High-Fidelity Numerical Analysis of Per-Rev-Type Inlet Distortion Transfer in Multistage Fans—Part I: Simulations with Selected Blade Rows. J. Turbomach. 2010, 132, 041014. [Google Scholar] [CrossRef]
  5. Yao, J.; Gorrel, S.E.; Wadia, A.R. High-Fidelity Numerical Analysis of Per-Rev-Type Inlet Distortion Transfer in Multistage Fans—Part II: Entire Component Simulation and Investigation. J. Turbomach. 2010, 132, 11–17. [Google Scholar] [CrossRef]
  6. Lesser, A.; Niehuis, R. Transonic Axial Compressor with Total Pressure Inlet Flow Field Distortions. In Proceedings of the ASME Turbo Expo 2014: Turbine Technical Conference and Exposition, Düsseldorf, Germany, 16–20 June 2014. Paper No. GT2014-26627. [Google Scholar]
  7. Lesser, A. Numerische Untersuchung von Axialverdichtern mit Gestörter Zuströmung. Ph.D. Thesis, Universität der Bundeswehr München, Munich, Germany, 2015. [Google Scholar]
  8. Barthmes, S.; Haug, J.P.; Lesser, A.; Niehuis, R. Unsteady CFD Simulation of Transonic Axial Compressor Stages with Distorted Inflow. In Advances in Simulation of Wing and Nacelle Stall; Radespiel, R., Niehuis, R., Kroll, N., Behrends, K., Eds.; Notes on Numerical Fluid Mechanics and Multidisciplinary Design; Springer: Berlin/Heidelberg, Germany, 2015; Volume 131, pp. 303–321. [Google Scholar]
  9. Haug, J.P.; Barthmes, S.; Niehuis, R. Full Annulus Unsteady CFD Simulations on Effects of Inflow Distortions in a Transonic Axial Compressor Stage. In Proceedings of the International Gas Turbine Congress 2015, Tokyo, Japan, 15–20 November 2015; pp. 683–694. [Google Scholar]
  10. Schulze, G. Betriebsverhalten Eines Transsonischen Axialverdichters. Ph.D. Thesis, Technische Hochschule Darmstadt, Darmstadt, Germany, 1996. [Google Scholar]
  11. Bergner, J. Experimentelle Untersuchung der Strömung im Blattspitzenbereich Eines Transsonischen Axialverdichters Nahe der Stabilitätsgrenze. Ph.D. Thesis, Technische Universiät Darmstadt, Darmstadt, Germany, 2006. [Google Scholar]
  12. Biela, C.; Müller, M.W.; Schiffer, H.P.; Zscherp, C. Unsteady Pressure Measurement in a Single Stage Axial Transonic Compressor near the Stability Limit. In Proceedings of the ASME Turbo Expo 2008: Power for Land, Sea, and Air, Berlin, Germany, 9–13 June 2008. Paper No. GT2008-50245. [Google Scholar]
  13. Müller, M.W.; Biela, C.; Schiffer, H.P.; Hah, C. Interaction of Rotor and Casing Treatment Flow in an Axial Single-Stage Transonic Compressor with Circumferential Grooves. In Proceedings of the ASME Turbo Expo 2008: Power for Land, Sea, and Air, Berlin, Germany, 9–13 June 2008; pp. 2008–50135, Paper No. GT2008-50135. [Google Scholar]
  14. Niehuis, R.; Lesser, A.; Probst, A.; Radespiel, R.; Schulze, S.; Kähler, C.J.; Spiering, F.; Kroll, N.; Wartzek, F.; Schiffer, H.P. Simulation of Nacelle Stall and Engine Response. In Proceedings of the XXI International Symposium on Air Breathing Engines, Busan, Korea, 9–13 September 2013. Paper No. ISABE-2013-1402. [Google Scholar]
  15. Vunnam, K.; Hoover, R. Modeling of Inlet Distortion using a Combined Turbofan and Nacelle Inlet Model during Crosswind and Low Speed Forward Operation. In Proceedings of the ASME 2011 Turbo Expo: Turbine Technical Conference and Exposition, Vancouver, BC, Canada, 6–10 June 2011. Paper No. GT2011-46466. [Google Scholar]
  16. Colin, Y.; Aupoix, B.; Boussuge, J.; Chanez, P. Numerical Simulation of the Distortion Generated by Crosswind Inlet Flows. In Proceedings of the 18th International Symposium on Air Breathing Engines, Beijing, China, 2–7 September 2007. ISABE-2007-1210. [Google Scholar]
  17. Hall, C.; Hynes, T. Measurements of Intake Separation Hysteresis in a Model Fan and Nacelle Rig. J. Propuls. Power 2006, 22, 872–879. [Google Scholar] [CrossRef]
  18. Reid, C. The Response of Axial Flow Compressor to Intake Flow Distortions. In Proceedings of the ASME 1969 Gas Turbine Conference and Products Show, Cleveland, OH, USA, 9–13 March 1969. Paper No. 69-GT-29. [Google Scholar]
  19. Wartzek, F.; Schiffer, H.P.; Haug, J.P.; Niehuis, R.; Bitter, M.; Kähler, C.J. Investigation of Engine Distortion Interaction. In Proceedings of the ASME Turbo Expo 2016: Turbomachinery Technical Conference and Exposition, Seoul, Korea, 13–17 June 2016. Paper No. GT2016-56208. [Google Scholar]
  20. Ciorciari, R.; Lesser, A.; Blaim, F.; Niehuis, R. Numerical investigation of tip clearance effects in an axial transonic compressor. J. Therm. Sci. 2012, 21, 109–119. [Google Scholar] [CrossRef]
  21. Kozulovic, D.; Röber, T.; Kügeler, E.; Nürnberger, D. Modifications of a two-equation turbulence model for turbomachinery fluid flows. In Proceedings of the Deutscher Luft- und Raumfahrtkongress, Dresden, Germany, 20 September 2004. Paper No. DGLR-JT2004-229a. [Google Scholar]
  22. Marciniak, V.; Kügeler, E.; Funke, M. Predicting Transition on Low-Pressure Turbine Profiles. In Proceedings of the V European Conference on Computational Fluid Dynamics, Lisbon, Portugal, 14–17 June 2010. [Google Scholar]
  23. Wartzek, F.; Brandstetter, C.; Holzinger, F.; Schiffer, H.P. Response of a Transonic Compressor to a Massive Inlet Distortion. Proceedings of 1th European Conference on Turbomachinery Fluid dynamics and Thermodynamics, Madrid, Spain, 23–27 March 2015. Paper No. ETC2015-086. [Google Scholar]
  24. Gunn, E.J.; Tooze, S.E.; Hall, C.A.; Colin, Y. An Experimental Study of Loss Sources in a Fan Operating with Continuous Inlet Stagnation Pressure Distortion. J. Turbomach. 2012, 135, 051002. [Google Scholar] [CrossRef]
Figure 1. Distortion generator in detail and mounted at the test rig. (a) Distortion generator; (b) Test rig with mounted distortion generator (green).
Ijtpp 03 00007 g001
Figure 2. The structured mesh used for simulations with the TRACE flow solver.
Ijtpp 03 00007 g002
Figure 3. (a) Normalized static pressure variation around the annulus at station 2 and 4 (see Figure 2); (b) Absolute X-vorticity at station 4 (see Figure 2), N100 NS.
Ijtpp 03 00007 g003
Figure 4. Entropy distribution. (a) N65, PE, 98% span; (b) N65, NS, 98% span; (c) N100, PE, 98% span; (d) N100, NS, 98% span; (e) N65, PE, stage exit; (f) N65, NS, stage exit; (g) N100, PE, stage exit; (h) N100, NS, stage exit.
Ijtpp 03 00007 g004
Figure 5. Normalized pressure on the blades averaged over 70% to 100% rel. blade height, Pressure Delta at peak efficiency (PE). PS: pressure side; SS: suction side.
Ijtpp 03 00007 g005
Figure 6. Axial velocity and blade tip vortices ( λ 2 -criterion) at 98% span. (a) N65, PE; (b) N65, NS; (c) N100, PE; (d) N100, NS.
Ijtpp 03 00007 g006

