Article

Experimental and Numerical Investigation of Suction-Side Fences for Turbine NGVs †

1
Department of Mechanical, Energy, Management and Transportation Engineering (DIME), University of Genova, 16143 Genova, Italy
2
Morfo Design, Sesto Fiorentino, 50019 Firenze, Italy
3
Avio Aero, 10040 Torino, Italy
*
Author to whom correspondence should be addressed.
This manuscript is an extended version of paper published in the Proceedings of the 16th European Turbomachinery Conference (ETC16)—Turbomachinery, Fluid Dynamics and Thermodynamics, Hannover, Germany, 24–28 March 2025; paper No. 213.
Int. J. Turbomach. Propuls. Power 2025, 10(4), 31; https://doi.org/10.3390/ijtpp10040031
Submission received: 5 June 2025 / Revised: 20 June 2025 / Accepted: 18 July 2025 / Published: 1 October 2025

Abstract

This work presents an extensive experimental and numerical analysis, aimed at investigating the impact of shelf-like fences applied on the suction side of a turbine nozzle guide vane. The cascade is constituted of vanes characterized by long chord and low aspect ratio, which are typical features of some LPT first stages directly downstream of an HPT, hence presenting high channel diffusion, especially near the tip. In particular, the present study complements existing literature by highlighting how blade fences positioned on the suction side can reduce the penetration of the large passage vortex. This is particularly effective in applications where flow turning is limited, the blades are lightly loaded at the front, and the horseshoe vortex is weak. The benefits of the present fence design in terms of losses and flow uniformity at the cascade exit plane have been demonstrated by means of a detailed experimental campaign carried out on a large-scale linear cascade in the low-speed wind tunnel installed in the Aerodynamics and Turbomachinery Laboratory of the University of Genova. Measurements mainly focused on the characterization of the flow field upstream and downstream of straight and fenced vane cascades using a five-hole pressure probe, to evaluate the impact of the device in reducing secondary flows. Furthermore, experiments were also adopted to validate both low-fidelity (RANS) and high-fidelity (LES) simulations and revealed the capability of both simulation approaches to accurately predict losses and flow deviation. Moreover, the accuracy in high-fidelity simulations has enabled an in-depth investigation of how fences act mitigating the effects of the passage vortex along the blade channel. By comparing the flow fields of the configurations with and without fences, it is possible to highlight the mitigation of secondary flows within the channel.

1. Introduction

In modern, compact, and lightweight engines for aeronautical applications, the nozzle guide vane (NGV) is integrated within the S-duct that connects the high-pressure turbine (HPT) to the low-pressure turbine (LPT) to reduce the axial length of the engine [1]. The long-chord vanes, while imposing on the flow the swirl required by the first LPT stage, also perform both structural and service functions [2]. By guiding the flow from the HPT to the LPT with a higher aspect ratio (AR), the NGVs are characterized by heights comparable to the chord and notably divergent endwalls [3].The medium-low aspect ratio and the divergence of the diffusive meridional channel lead to the development of strong secondary flows and therefore to the generation of vortices responsible for secondary losses in the same order of magnitude of the profile losses. The complex system of secondary flows generated in turbine environments is described, e.g., in the comprehensive review of L. S. Langston [4]. The impact of secondary structures that form in modern shortened turbine design is illustrated in the work of R. Vinuesa et al. [5], where the strength of the secondary flows is analyzed varying the aspect ratio of the flow channel, and in the research work of D. Wegener et al. [6]. In the latter, the losses related to the secondary structures, investigated in a low-AR turbine guide vane by means of experimental and numerical campaigns, resulted to be approximately 50 % of the overall blade losses.
It is therefore essential to find systems able to mitigate the formation of the complex secondary vortices, and the associated losses. Different active and passive flow control devices can be adopted to reduce secondary flows. Active systems are intended to avoid a priori the generation of the secondary vortices, using engine energy [7]. Among the best known, vortex generator jets ([8,9]) inject air generating vorticity of sign opposite to the passage vortex (PV), reducing its strength, while boundary layer (BL) control systems ([10,11]) remove the low-momentum BL in specific points of the channel (e.g., in the proximity of the blade leading edge (LE)), weakening the horseshoe vortex (HSV). On the other side, passive flow control systems are devices applied on the endwall or blade surface with the aim of containing and mitigating the development of secondary vortices along the blade channel without requiring external energy input [12]. Among these, splitters are placed on the blade channel endwall, preventing the propagation of vortices from the pressure side of the blade to the suction side of the adjacent one. C. J. Clark et al. [13] investigated the effect of splitters on the mitigation of the secondary structures in low-AR NGVs and found an increase of the efficiency by 1 % . In the works of Mingardo et al. [14] and H. Yuan et al. [15], a splitter design optimization has been conducted, improving even more the cascade performance by at least 2 % . In the work of V. Dossena [16], endwall contouring is also identified as an effective technique to mitigate secondary flows. Profiled endwalls can inhibit vortex formation, suppress the migration of the passage vortex along the blade channel, and limit its development along the blade height. Another passive device for secondary flow control are fences, which are shelf-like structures applied on the surface of the blades to reduce the penetration of secondary flows along the blade span [17]. Particularly, as reported in the research work of F. Rubechini et al. [18] and M. Giovannini et al. [19], fences make the flow along the span at the exit of the blade more uniform, improving its interaction with the downstream cascade, hence increasing the overall stage performance. Over the years, different types of fences applied on the suction side (SS) [20,21] and on the pressure side (PS) [18] of LPT blades have been studied, even in their multiple configurations, which consist in applying two or more fences along the blade span [19]. It is therefore known that the fences applied on the PS of high-lift blades are able to mitigate the inception of both passage and horseshoe vortices. In their multiple configurations they are also able to further reduce the penetration of the secondary structures, containing them near the endwall.
In this study, the low aspect ratio (AR) and divergent meridional channel of the investigated vane cascade lead to the formation of a significant passage vortex, while the relatively light loading at the leading edge of the blades results in the development of a weak horseshoe vortex. The distinct secondary flow structures characteristic of this blade configuration have motivated a new optimization campaign to analyze how varying flow conditions can lead to different design solutions. The optimization process, based on CFD RANS calculations conducted within an annular stage environment, identified an optimal configuration involving a two-shelf-like fence arrangement applied on the suction side of the vane. This arrangement primarily aims at reducing the penetration of the passage vortex and minimizing flow deviation at the exit plane of the vane cascade, thereby enhancing the overall stage work output. The effectiveness of the optimized design is evaluated through both experimental and numerical campaigns at a low Technology Readiness Level (TRL) using a dedicated cascade configuration, with and without the application of suction-side fences. The comparative analysis of these configurations clearly demonstrates the advantages associated with the incorporation of suction-side fences, particularly in mitigating the passage vortex and improving aerodynamic performance.
Specifically, a large-scale linear cascade, representative of a real NGV integrated in the diverging intermediate turbine diffusive duct of a turbofan aeroengine, has been tested in the wind tunnel of the Aerodynamics and Turbomachinery Laboratory of the University of Genova [22]. The NGV has been initially tested in its straight configuration, without any secondary flow mitigation device applied. Subsequently, the 3D printed fences have been added onto the blade surface. Tests have been carried out for both configurations at two different Reynolds numbers to assess the benefits of fences at cruise and take-off/landing engine conditions. The five-hole pressure probe has been used to characterize in detail the boundary conditions (BCs) and to map the flow total pressure and vortex structures entering and exiting the straight and fenced cascades. An extensive 3D numerical investigation adopting both low-fidelity (RANS) and high-fidelity (LES) simulations has also been conducted on the two cascade configurations under cruise conditions, using experimentally acquired boundary conditions. The close agreement between RANS results and experimental data, in terms of both loss coefficients and 2D flow field distributions, demonstrated the reliability of this approach in capturing overall trends and assessing the relative benefits of different designs. This validation supports the feasibility of employing low-cost RANS calculations during the fence design phase.
Subsequently, LES were carried out to perform a more detailed analysis of the secondary flow structures within the blade channel. Particular attention has been given to accurately setting the inlet BCs, ensuring a strong correlation between experimental and numerical results. Following validation against experimental data, LES results were utilized to complete the flow field analysis within the blade passage, elucidating the mechanism by which the fences mitigate secondary flow effects and ultimately contribute to enhanced aerodynamic performance. This manuscript is an extended version of the authors’ paper [23] published in the Proceedings of the 16th European Turbomachinery Conference.

2. Fence Design

To investigate the impact of blade fences on the NGV secondary flows, a comprehensive CFD-based parametric design campaign has been carried out. Fences have been evaluated based on their ability to mitigate the complex secondary flow structures characteristic of the baseline NGV, with particular focus on the casing region where the flow field is more challenging due to the high level of diffusion of the endwall. Multiple fenced configurations were analyzed using RANS calculations with STAR-CCM+ as the flow solver, simulating a stage environment to establish an extensive database of CFD solutions. The parameterization strategy for advanced geometry management was consistent with the methodology outlined in [18]. In the realistic annular stage environment, fences are applied to both blade hub and tip, exploring a wide range of configurations. Figure 1, where some examples of configuration are shown, demonstrates the capability of the design tools to generate fences on both suction and pressure sides or around the leading edge. In the present design campaign, the parameters defining the fence geometry that were subject to optimization included both their shape in the planform plane (start and end positions, and maximum thickness) and their distribution in the spanwise plane (number of fences and start position along the span). The design space was then sampled by generating geometries with varying parameter values and assessing their performance through RANS calculations.
Subsequently, artificial neural networks (ANNs) have been trained on this CFD database to construct a response surface, adhering to the established approach typically employed in addressing parametric design challenges. The response surface has been subsequently employed to systematically explore the design space and identify the most optimal fence configuration. More specifically, stage efficiency was selected as the objective function, while ensuring the preservation of the stage operating point (mass flow rate). This approach, as reported in the literature [18], enables a direct assessment of the beneficial carry-over effect on the downstream rotor, allowing for a comprehensive evaluation of the overall performance improvements. Rather than focusing solely on the performance of the NGV where the fences are applied, which does not necessarily have to be improved, this method captures the broader impact on the entire stage.
As mentioned earlier, the optimized solution for the casing region differs from those previously reported in the literature, aligning with the specific features of this application where the secondary flow structures significantly deviate from those observed in conventional LPT blades. The current solution features a fence that originates on the PS but predominantly extends towards the SS, effectively mitigating the passage vortex.
The NGV equipped with the optimized fences has then been compared, using RANS analysis, against the baseline blade to highlight the primary effects of the fence. In line with what has been previously reported in the literature, the fence demonstrates its capability to provide a much more uniform flow downstream of the NGV, significantly reducing both under- and over-turning. Although the increased wetted surface area and the fence interaction with secondary flows result in a slight increase in NGV losses, the benefits in terms of rotor performance lead to a notable increase of overall stage efficiency, as demonstrated by the numerical simulations. To prove device capability to deliver a more uniform exit flow, the fences have been transferred to a cascade environment for validation.

3. Experimental Campaign

3.1. Experimental Setup

The experimental campaign has been performed in the blow-down, open-loop, and low-speed wind tunnel installed in the Aerodynamics and Turbomachinery Laboratory of the University of Genova (see [22] Figure 1). A centrifugal fan is positioned at the wind tunnel inlet. It has a maximum volumetric flow rate of approximately 9 m3/s and is driven by a three-phase asynchronous motor with a nominal power of 200 kW, regulated by an inverter.
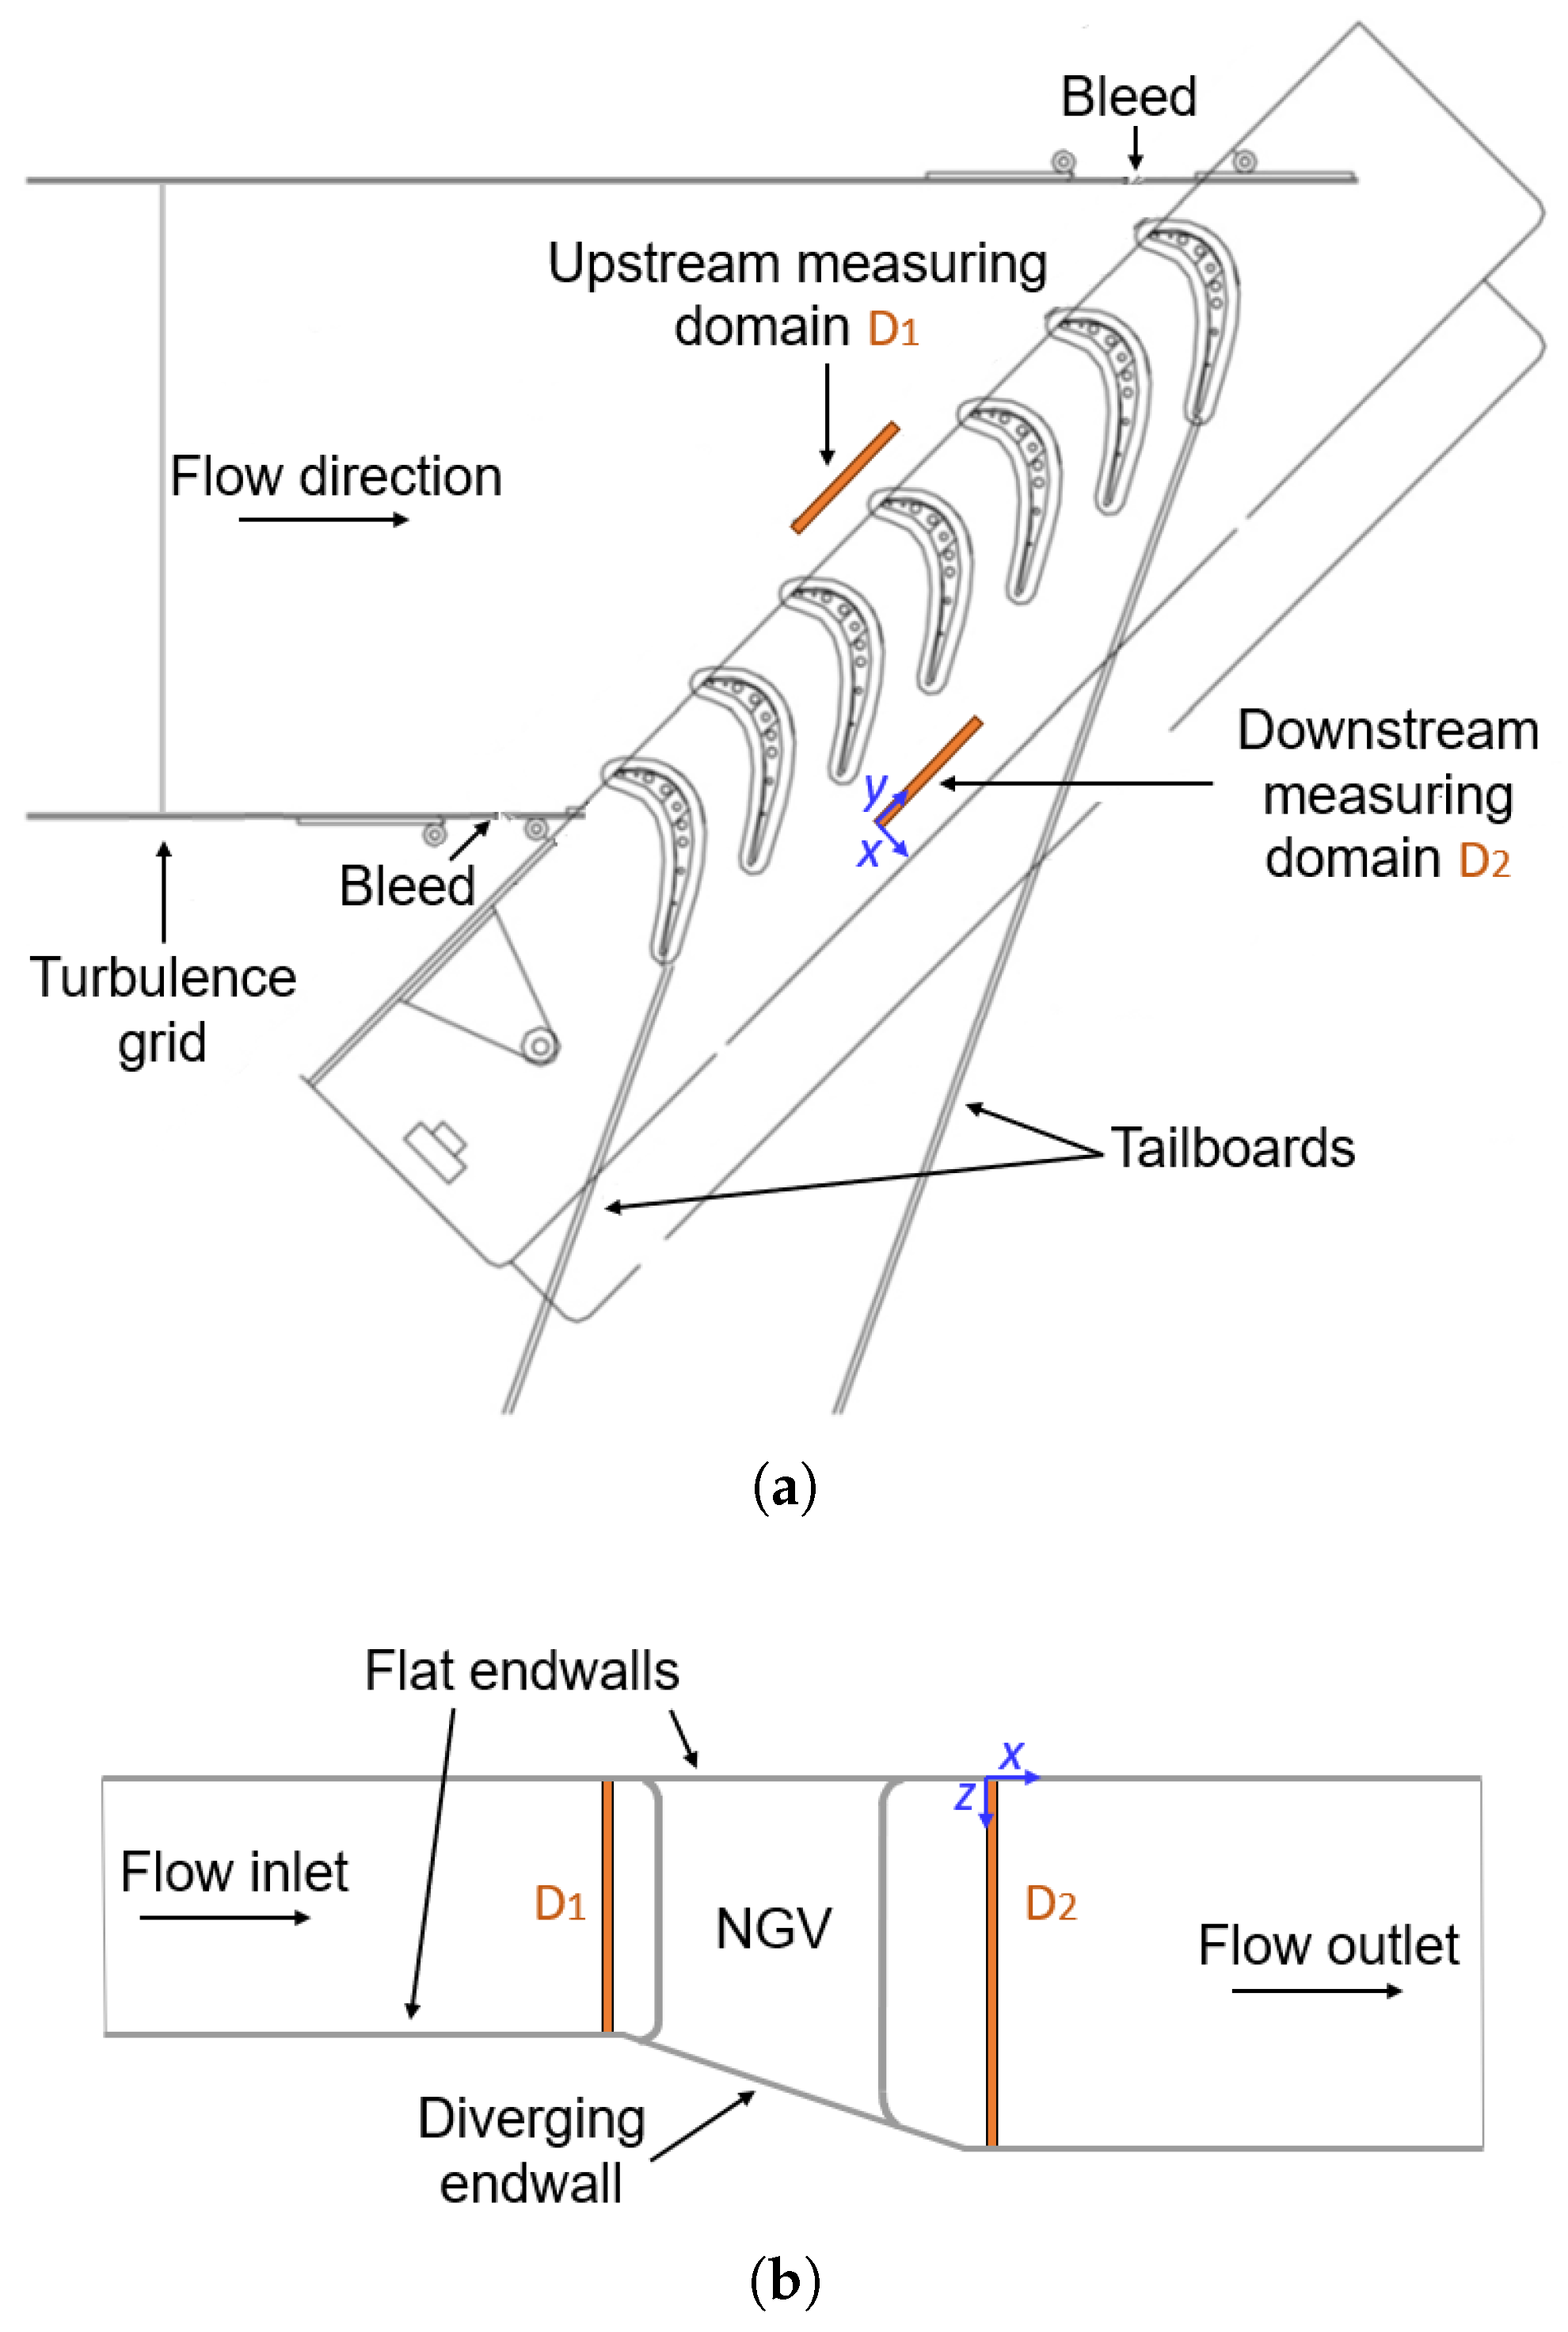
Figure 2 reports the top (a) and meridional (b) schematic views of the present test section. It features a large-scale cascade with seven blades, representative of a real NGV section for turbofan aeroengines. The vanes are characterized by a low aspect ratio, based on the averaged blade height A R = 1.0 , and a low solidity of σ = 0.85 . Furthermore, the blades exhibit a low turning profile, θ = 55 , and a Zweifel number Z w = 0.7 . The NGV cascade is installed in a diffusive meridional channel, which has an area ratio of A 2 A 1 1 = 1 and a characteristic length made non-dimensional by the inlet duct height L / H 1 = 1.8 . The opening of the duct from the HPT outlet to the LPT inlet sections is obtained through flat endwalls at the inlet channel (up to 5 % C x upstream of the LE of the blades) and a combination of flat and divergent endwalls at the outlet section (up to 30 % C x downstream of the trailing edge (TE)). This design results in a symmetric inlet channel and an asymmetric outlet, where the tips of the blades in the experimental setup are positioned at the bottom of the test section, in correspondence of the diverging endwall. Two adjustable bleeds and tailboards are installed at the sides of the test section to ensure blade periodicity, which is verified by 26 static pressure taps located at the midspan of each surface of the three central blades. Specifically, static pressure taps are equally divided between pressure and suction sides. A turbulence-generating grid is installed upstream of the cascade to generate an inlet free-stream turbulence intensity ( T u ) of about 3.5 % at the LE of the central blade, enabling a bypass transition to accurately replicate the operating conditions of a real aero-engine. Experiments have been carried out under steady incoming flow, at two Reynolds numbers based on the axial chord C x and the isentropic exit flow velocity c 2 ( R e x = 400,000 and R e x = 700,000) representative of cruise and take-off/landing engine conditions, respectively.

3.2. Measuring Technique

For the experimental campaign, a five-hole pressure probe with a head diameter of 2.5 mm has been chosen, to minimize flow distortion considering the large scale of the test section. The five-hole pressure probe has been employed upstream and downstream of the cascade, to measure the total pressure and the velocity field of the flow entering and exiting the NGV, hence evaluating the aerodynamic performance of the cascade. Specifically, five-hole pressure probe measurements have been performed in the inlet measuring domain D 1 (whose position in the blade-to-blade plane is reported in Figure 2), located at a distance of 0.13 · C x upstream of the blade LE. These measurements allowed the characterization of the 2D flow field at the cascade inlet and the detailed analysis of the upstream BL, aimed at accurately setting up inlet BCs of both low- and high-fidelity simulations. The total pressure and velocity fields of the flow exiting the cascade have been acquired along the outlet-measuring domain D 2 (Figure 2), located at a distance of 0.58 · C x downstream of the blade TE, to characterize in detail the secondary structures at the cascade outlet. Distributions in D 1 and D 2 have been sampled with a 30 × 34 measuring-point grid, traversing the probe along the pitchwise (y) and spanwise (z) directions, by means of a two-axis computer-controlled traversing mechanism. For each pressure measuring point, 5000 samples have been collected with a sampling frequency of 1 kHz, using high-accuracy SETRA differential transducers, characterized by a range of ± 620 Pa and an accuracy of ± 0.075 % of the full range. The uncertainty in the evaluation of the total pressure loss coefficient has been estimated to be approximately 2 % .
To evaluate the aerodynamic performance of the cascade, the total pressure maps of the flow acquired at the cascade inlet and outlet have been compared, computing the 2D distribution of the total pressure loss coefficient C p t , as follows:
C p t = p t , 1 p t , 2 q 2
Here, p t , 1 and p t , 2 are the total pressure distributions in D 1 and D 2 , respectively, and q 2 is the downstream isentropic dynamic pressure. The spanwise distribution of the total pressure loss coefficient C p t ¯ can then be determined by averaging the C p t in the pitchwise direction. To evaluate the cascade total pressure losses ω , the C p t map is averaged both in the pitchwise and spanwise directions. The total losses of the cascade are mainly due to profile losses ω p and secondary losses ω s [24].
ω = ω p + ω s
The profile losses have been calculated at the height of about z / H = 0.35 as follows:
ω p = p t , 1 ¯ z / H = 0.35 p t , 2 ¯ z / H = 0.35 q 2
due to the asymmetry of the channel at the cascade outlet, which does not make the flow two-dimensional at midspan. It is indeed at z / H = 0.35 that the flow appears to be unaffected by secondary flows.
The five-hole pressure probe also allows the secondary structures to be analyzed in terms of velocity vector maps.

3.3. Fence Application

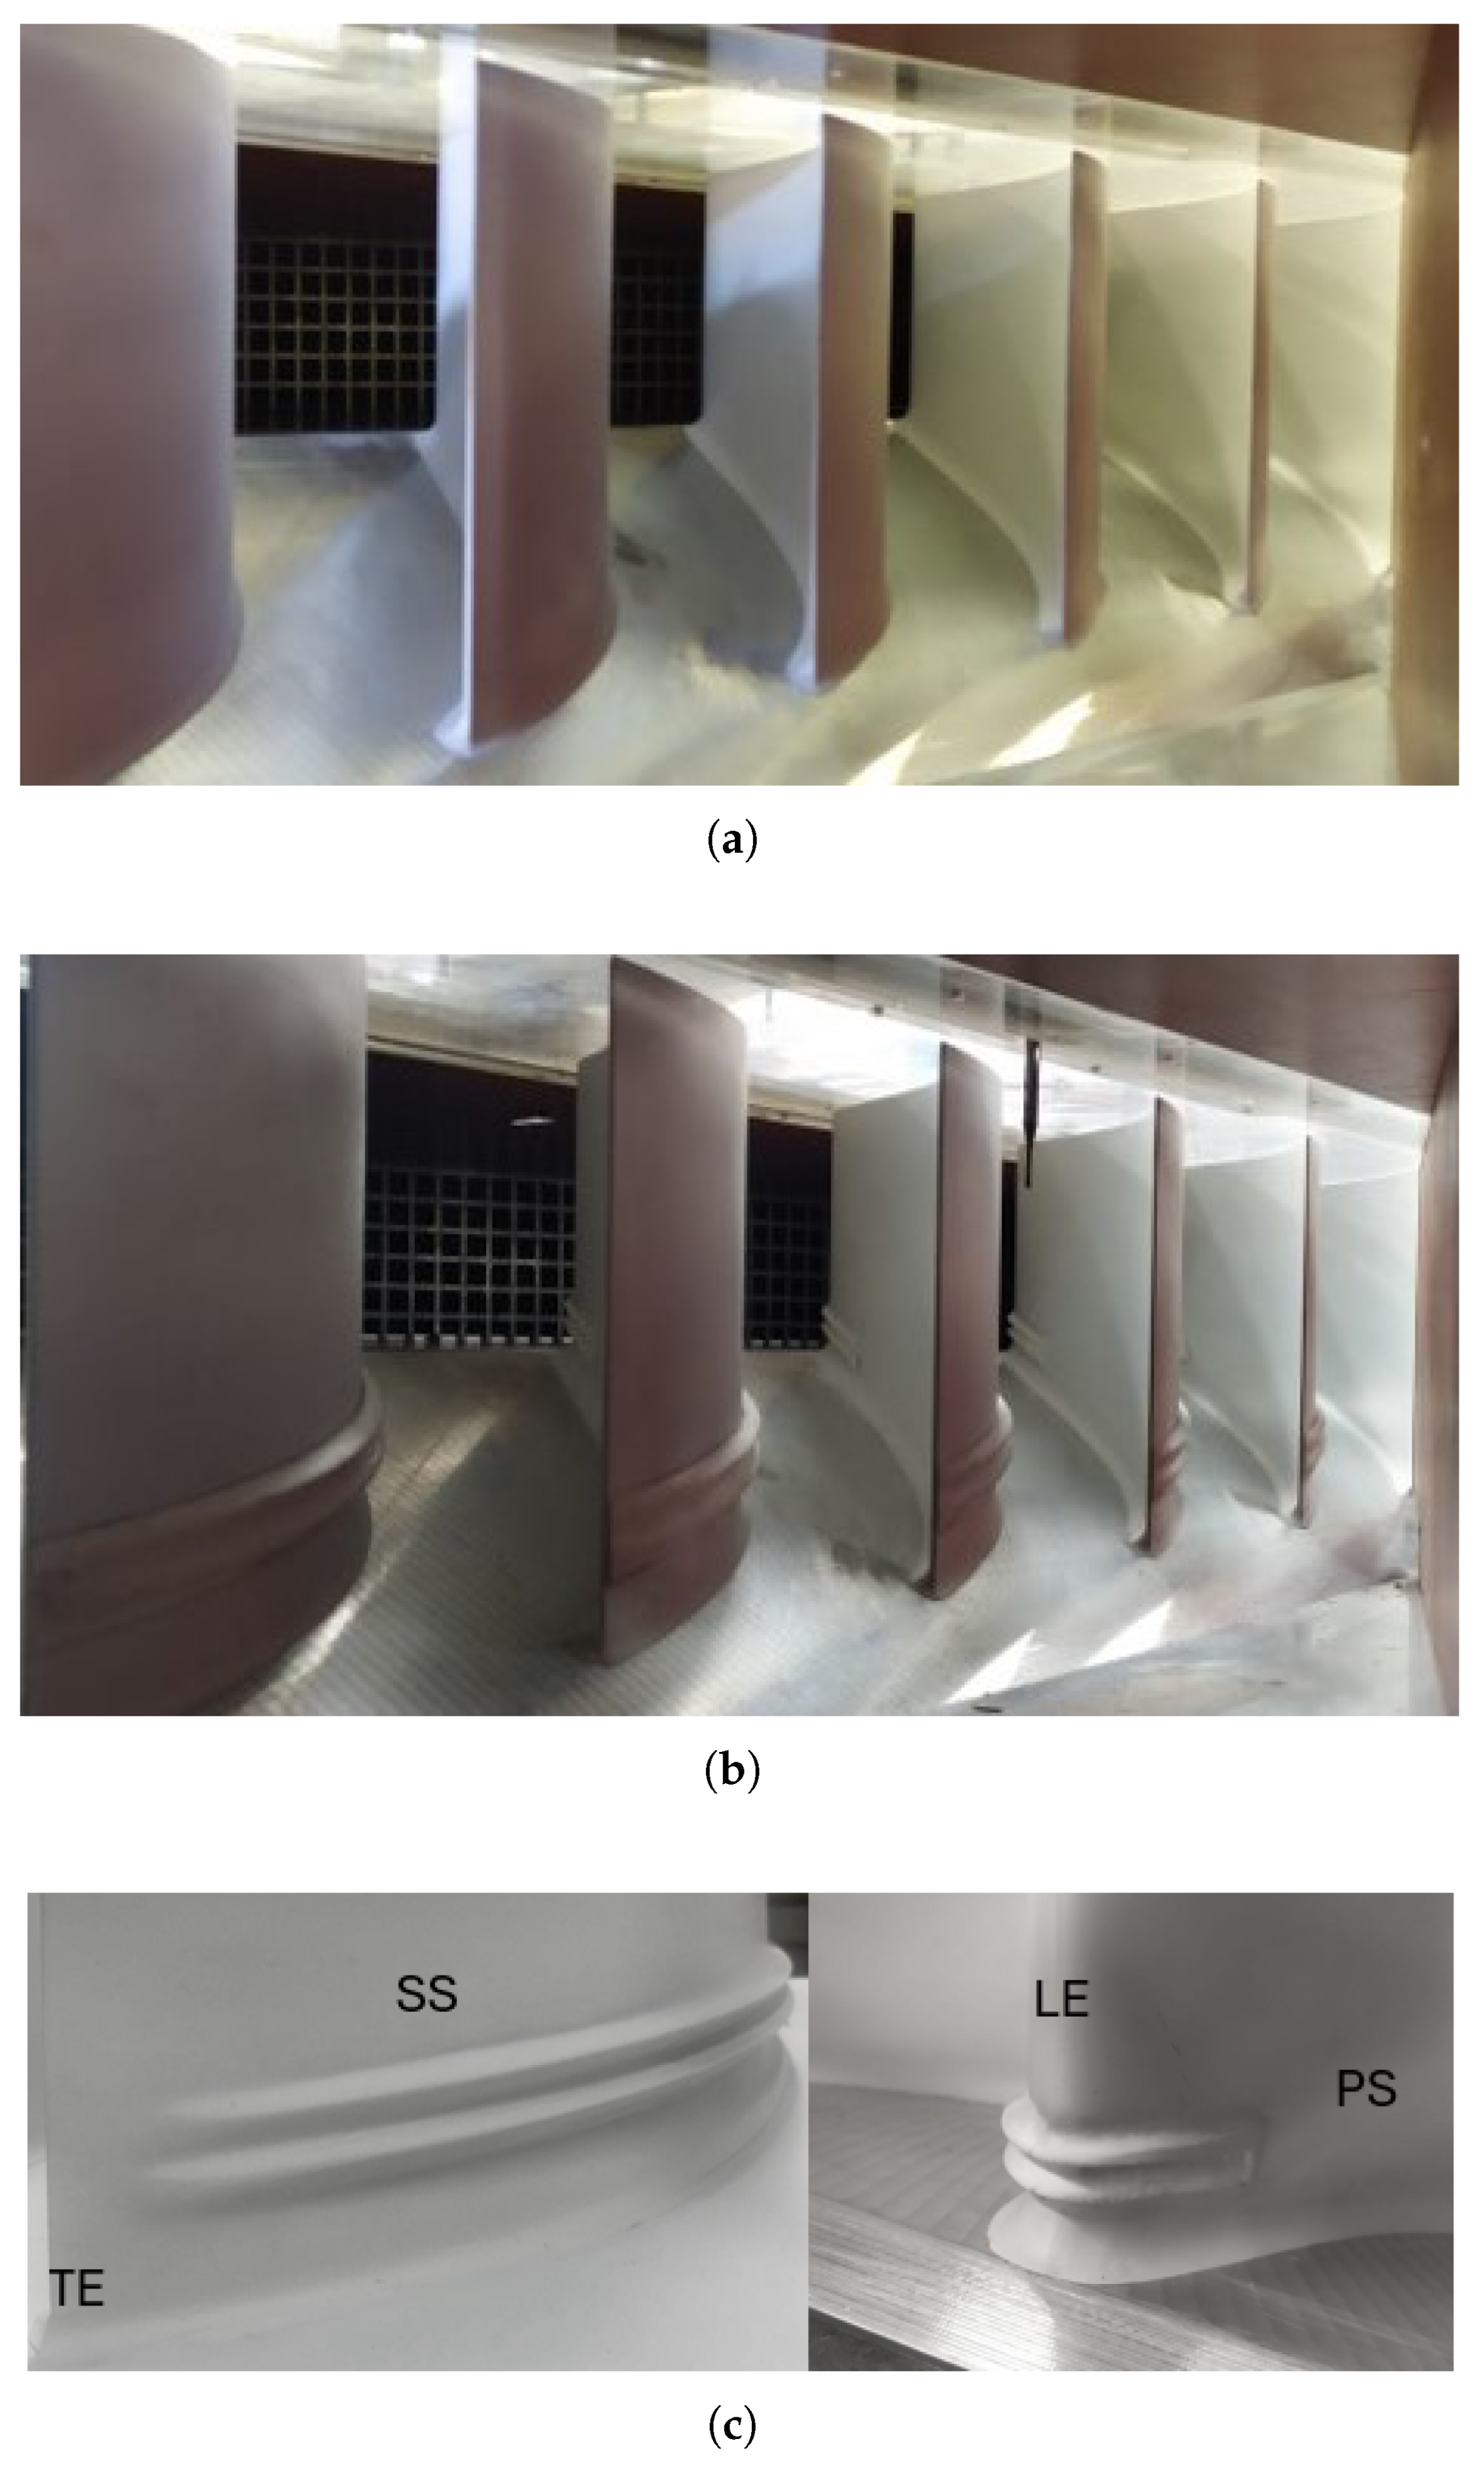
The experimental campaign started with the straight cascade, i.e., blades without fences applied. Then, a two-fence arrangement was manufactured adopting a 3D printing technology and it was attached to the existing cascade, near the diverging endwall, representative of the real engine case (in the experimental facility it is positioned at the bottom of the blade channel for technical reasons). The application of this device, created as an add-on to the straight cascade, allows the experimental setup not to be altered, improving accuracy in the comparison of the results obtained from the two cascade configurations. Figure 3 shows the experimental test section in the two configurations: the straight cascade (a) and the fenced one (b), and a zoomed-in view of the fences installed on the cascade, showcasing their design (c). As previously mentioned, the tested solution involves fences primarily located on the SS. More specifically, as shown in Figure 3, fences start on the PS at approximately 0.3 · C x from the LE, then curve around it and extend along the entire SS, following the divergence of the meridional channel. Fences reach their maximum thickness (defined as the cross-sectional dimension perpendicular to the blade surface) at 0.65 · C x , tapering smoothly towards the blade trailing edge. Along the blade span, fences are positioned between 75 % and 95 % of the span, with the maximum cross-sectional thickness occurring at around 90 % for the lower shelf structure and 80 % for the upper one. The inter-shelf region is located at approximately 85 % of the blade height.

4. Numerical Campaign

CFD has been extensively employed in the development of the present device, significantly contributing to both design and optimization phases, as well as to the validation and analysis of its performance. In particular, building on the previous experiences presented in [18], RANS simulations were used as an effective tool for designing fences, as they were shown to be capable of accurately predicting fence effect in counteracting secondary flows. Additionally, CFD has been adopted in the post-test phase on the experimental validation rig. In this case, both RANS and LES analyses have been performed, and their results will be presented hereafter. The RANS simulations were primarily aimed at verifying the accuracy of low-fidelity approaches and assessing their applicability during the design phase. Regarding LES, after an initial validation against experiments, these simulations have been used to gain a deeper physical understanding of the impact of fences on the flow.

Numerical Setup

The flow within the cascade is governed by the incompressible Navier–Stokes equations, due to the low Mach number conditions (the exit Mach number for R e x = 400,000 is approximately 0.08). The finite volume software STAR-CCM+ was used to carry out LES calculations. The equations were discretized using a segregated flow approach, with second-order accuracy in both space and time, while adopting the WALE subgrid-scale model [25]. The inlet of the numerical domain sits one axial chord upstream of the LE, while the outlet is located 1.5 axial chords downstream of the trailing edge. Periodic conditions are imposed in the pitchwise direction, while no-slip conditions are imposed on the endwalls and on the surface of the blade. At the inlet, velocity profiles are prescribed, and free-stream turbulence is generated using the Synthetic Eddy Method (SEM) [26]. The inlet boundary conditions, including velocity profiles, turbulence intensity, and length scales, are carefully chosen to replicate the conditions measured at plane D 1 ensuring that LES closely reproduces the experimental condition as described in [27]. The numerical campaign has been focused only on the low-Reynolds condition ( R e x = 400,000). This is done in order to reduce both the overall simulation time and the number of cells used to discretize the numerical domain, particularly for the LES. Moreover, the experiments will shown that the effect of the fences on the flow field is similar for both Reynolds numbers.
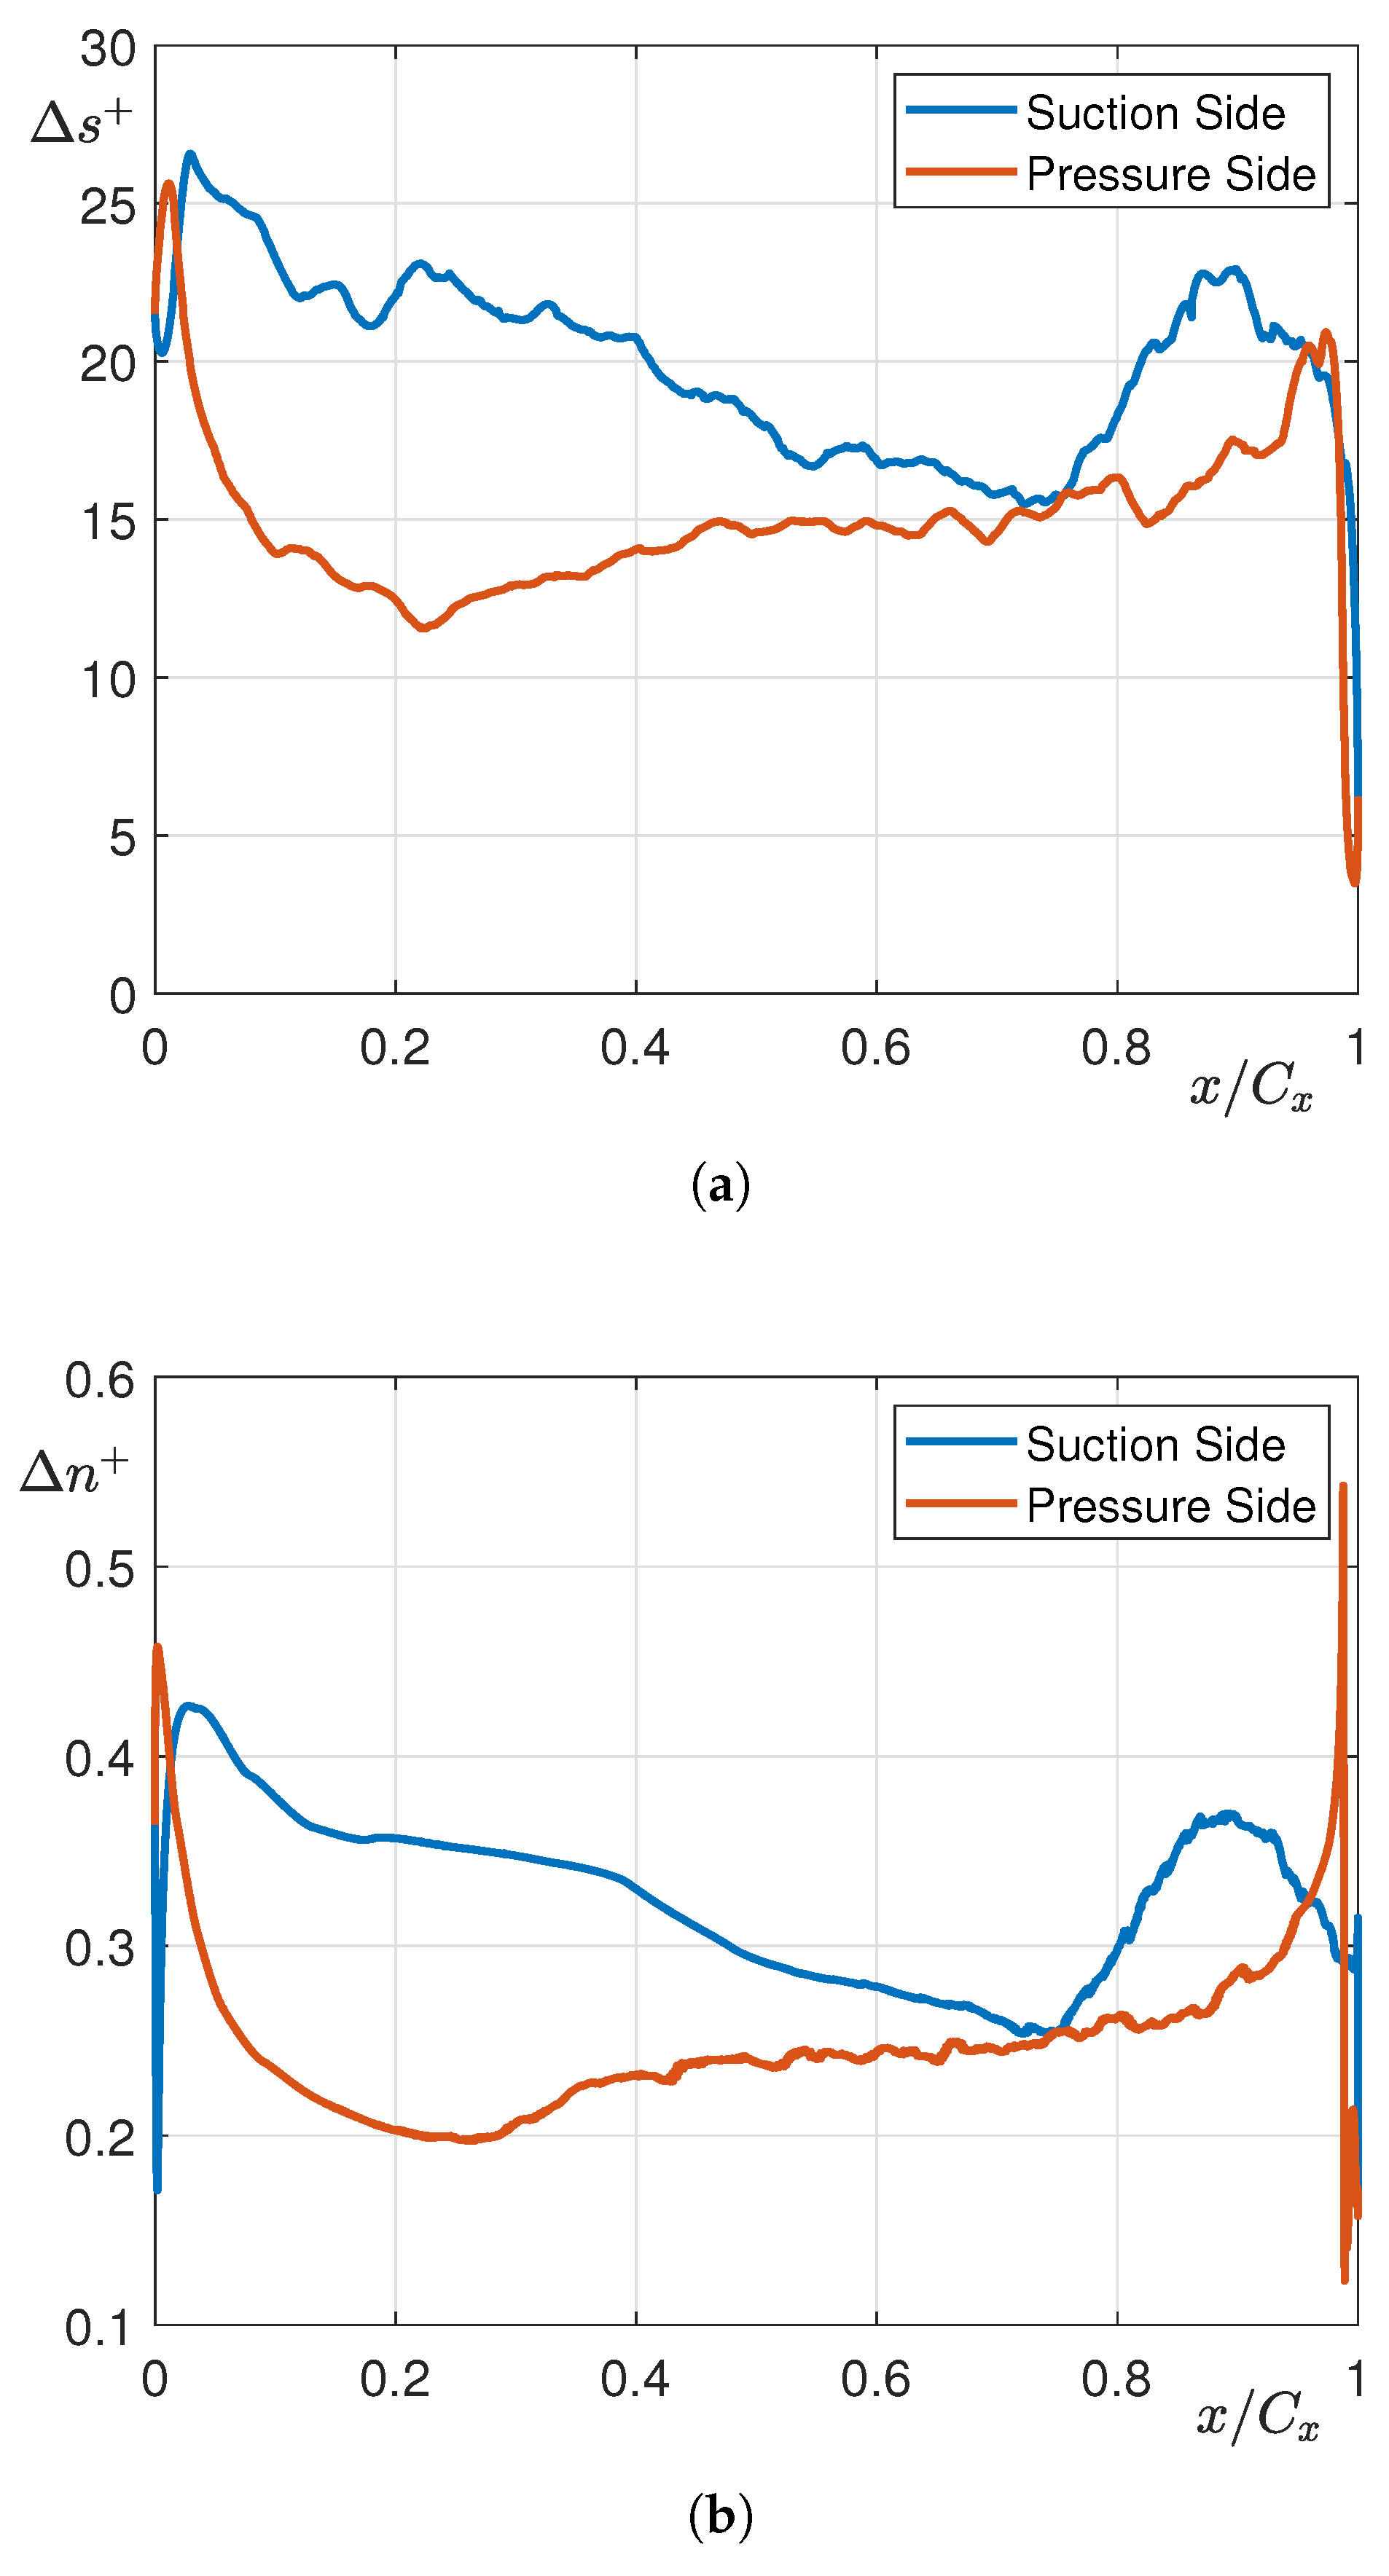
For grid generation, polyhedral cells have been employed in the free stream region, while prism cells have been used near wall boundaries. On the blade surface, the cell sizes have been selected to achieve a mesh resolution along the blade curvilinear abscissa Δ s + and the blade span Δ z + of approximately 15–25, while along the direction normal to the blade surface, Δ n + is smaller than 0.5 , as shown in Figure 4a,b, respectively. All these reported parameters are made non-dimensional by the inner unit turbulence length. In the free stream, the cell size was approximately ten times the local Kolmogorov length scale, which was determined based on prior RANS calculations. The final grid consists of approximately 140 million cells. The simulations have been run ensuring that a Courant number close to unity is achieved around the blade.
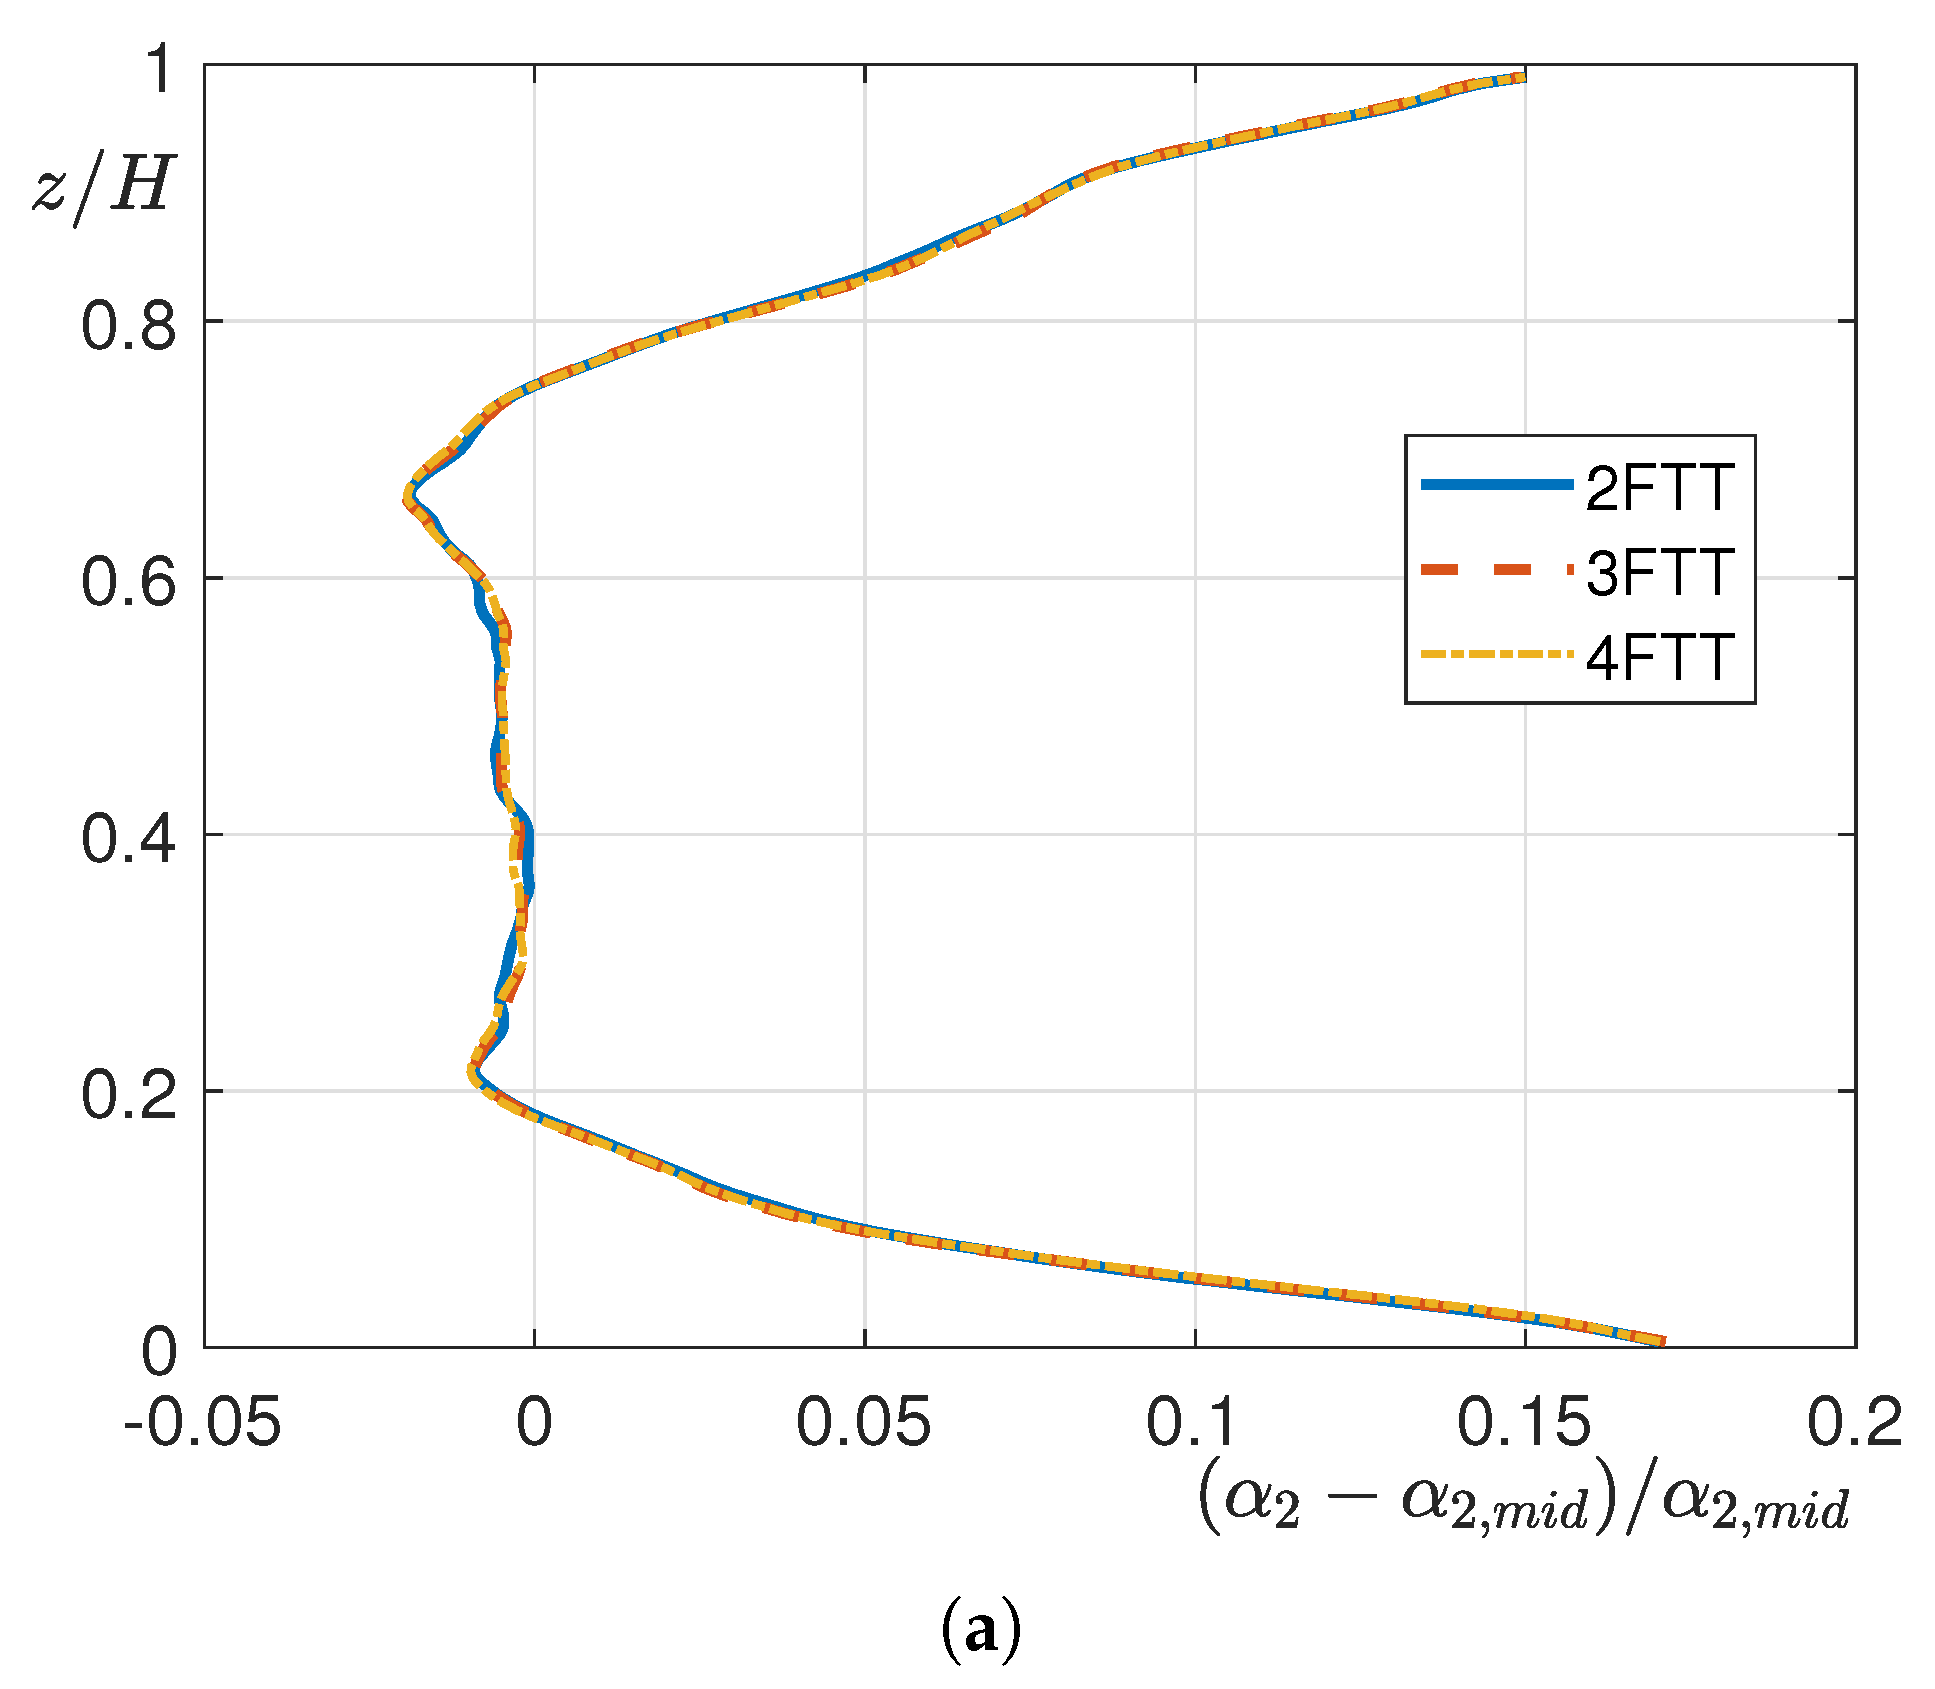
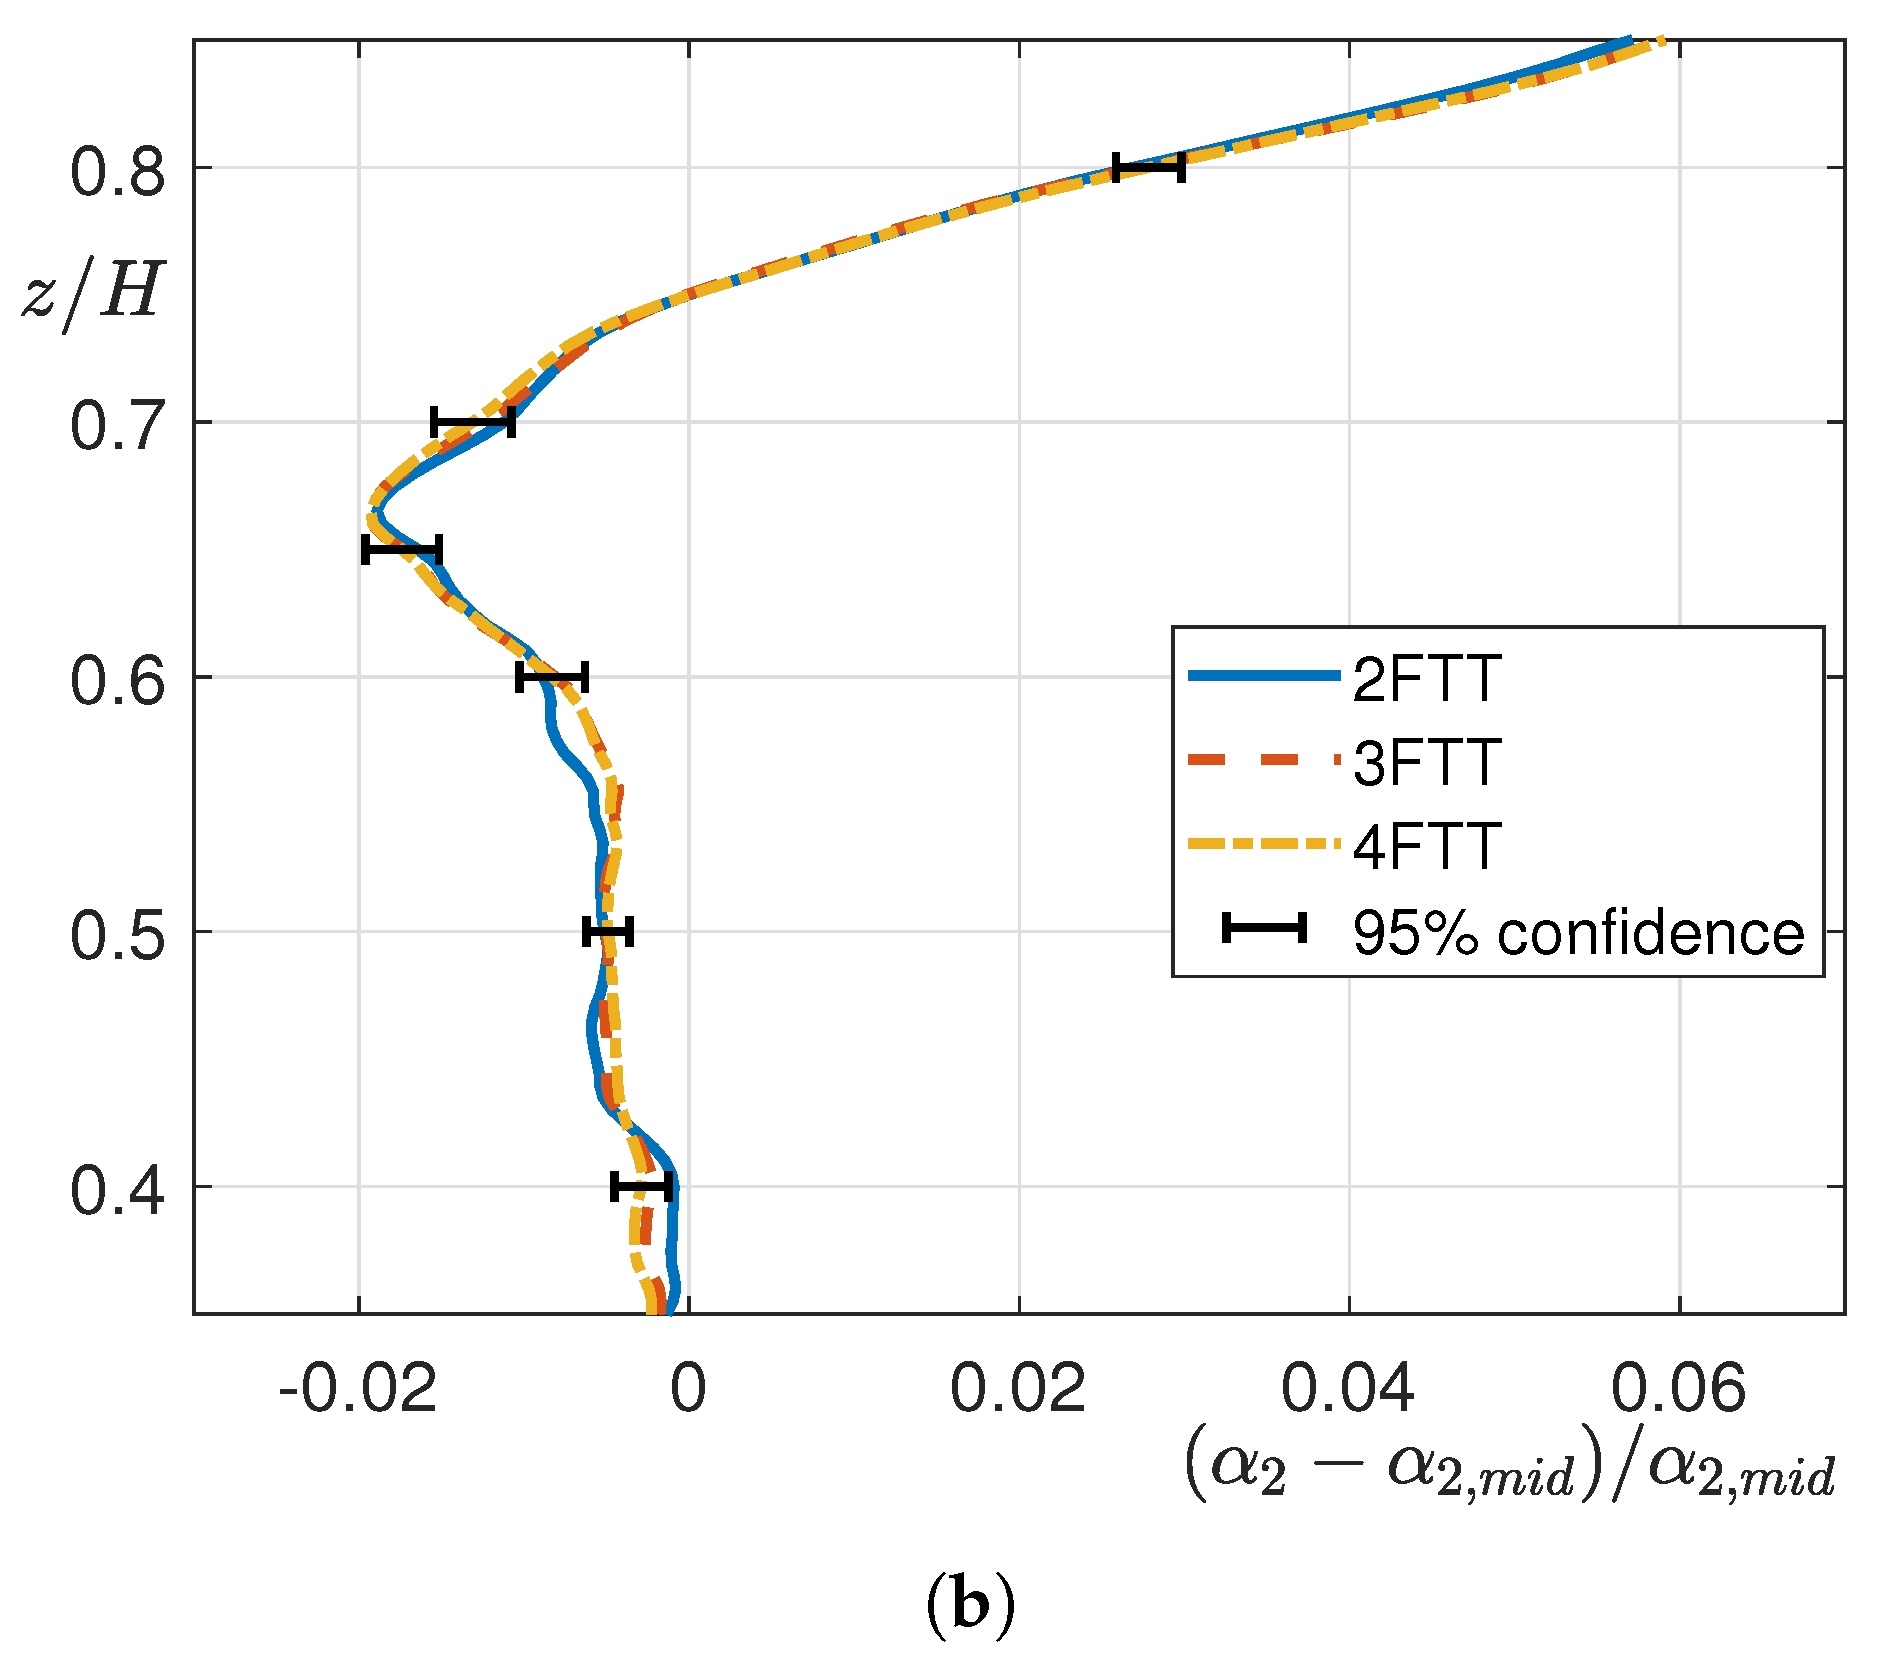
The LES has been initialized with RANS results. An initial transient phase, equivalent to four flow-through times (FTT), has been run to allow the flow to fully develop and eliminate any transitory effects that could influence the final results. Following this phase, the primary flow quantities have been averaged over an additional four flow-through times, ensuring adequate convergence. As a demonstration of this, in Figure 5a and especially in its zoom provided in Figure 5b, the normalized exit yaw angle computed with different average times (2FTT, 3FTT, and 4FTT)—together with an estimate on the convergence error computed as suggested by M. Bergmann et al. [28]—can be appreciated.

5. Results

Experimental investigations have been carried out on straight and fenced cascades to analyze the effects induced on secondary structures by the application of fences on blade suction-side. To this purpose, after analyzing boundary layers at the cascade inlet and blade loadings for both configurations, the performance of the two cascades have been studied, focusing on secondary flows and total pressure losses. Then, the experimentally measured BCs have been used to properly set up numerical simulation BCs. After a comparison between RANS and experimental results to validate the use of these low-cost simulations in the fence design phase, Large Eddy Simulations have been carried out to provide a deeper view of the flow within the channel.

5.1. Inlet Boundary Layer and Aerodynamic Loading Distributions

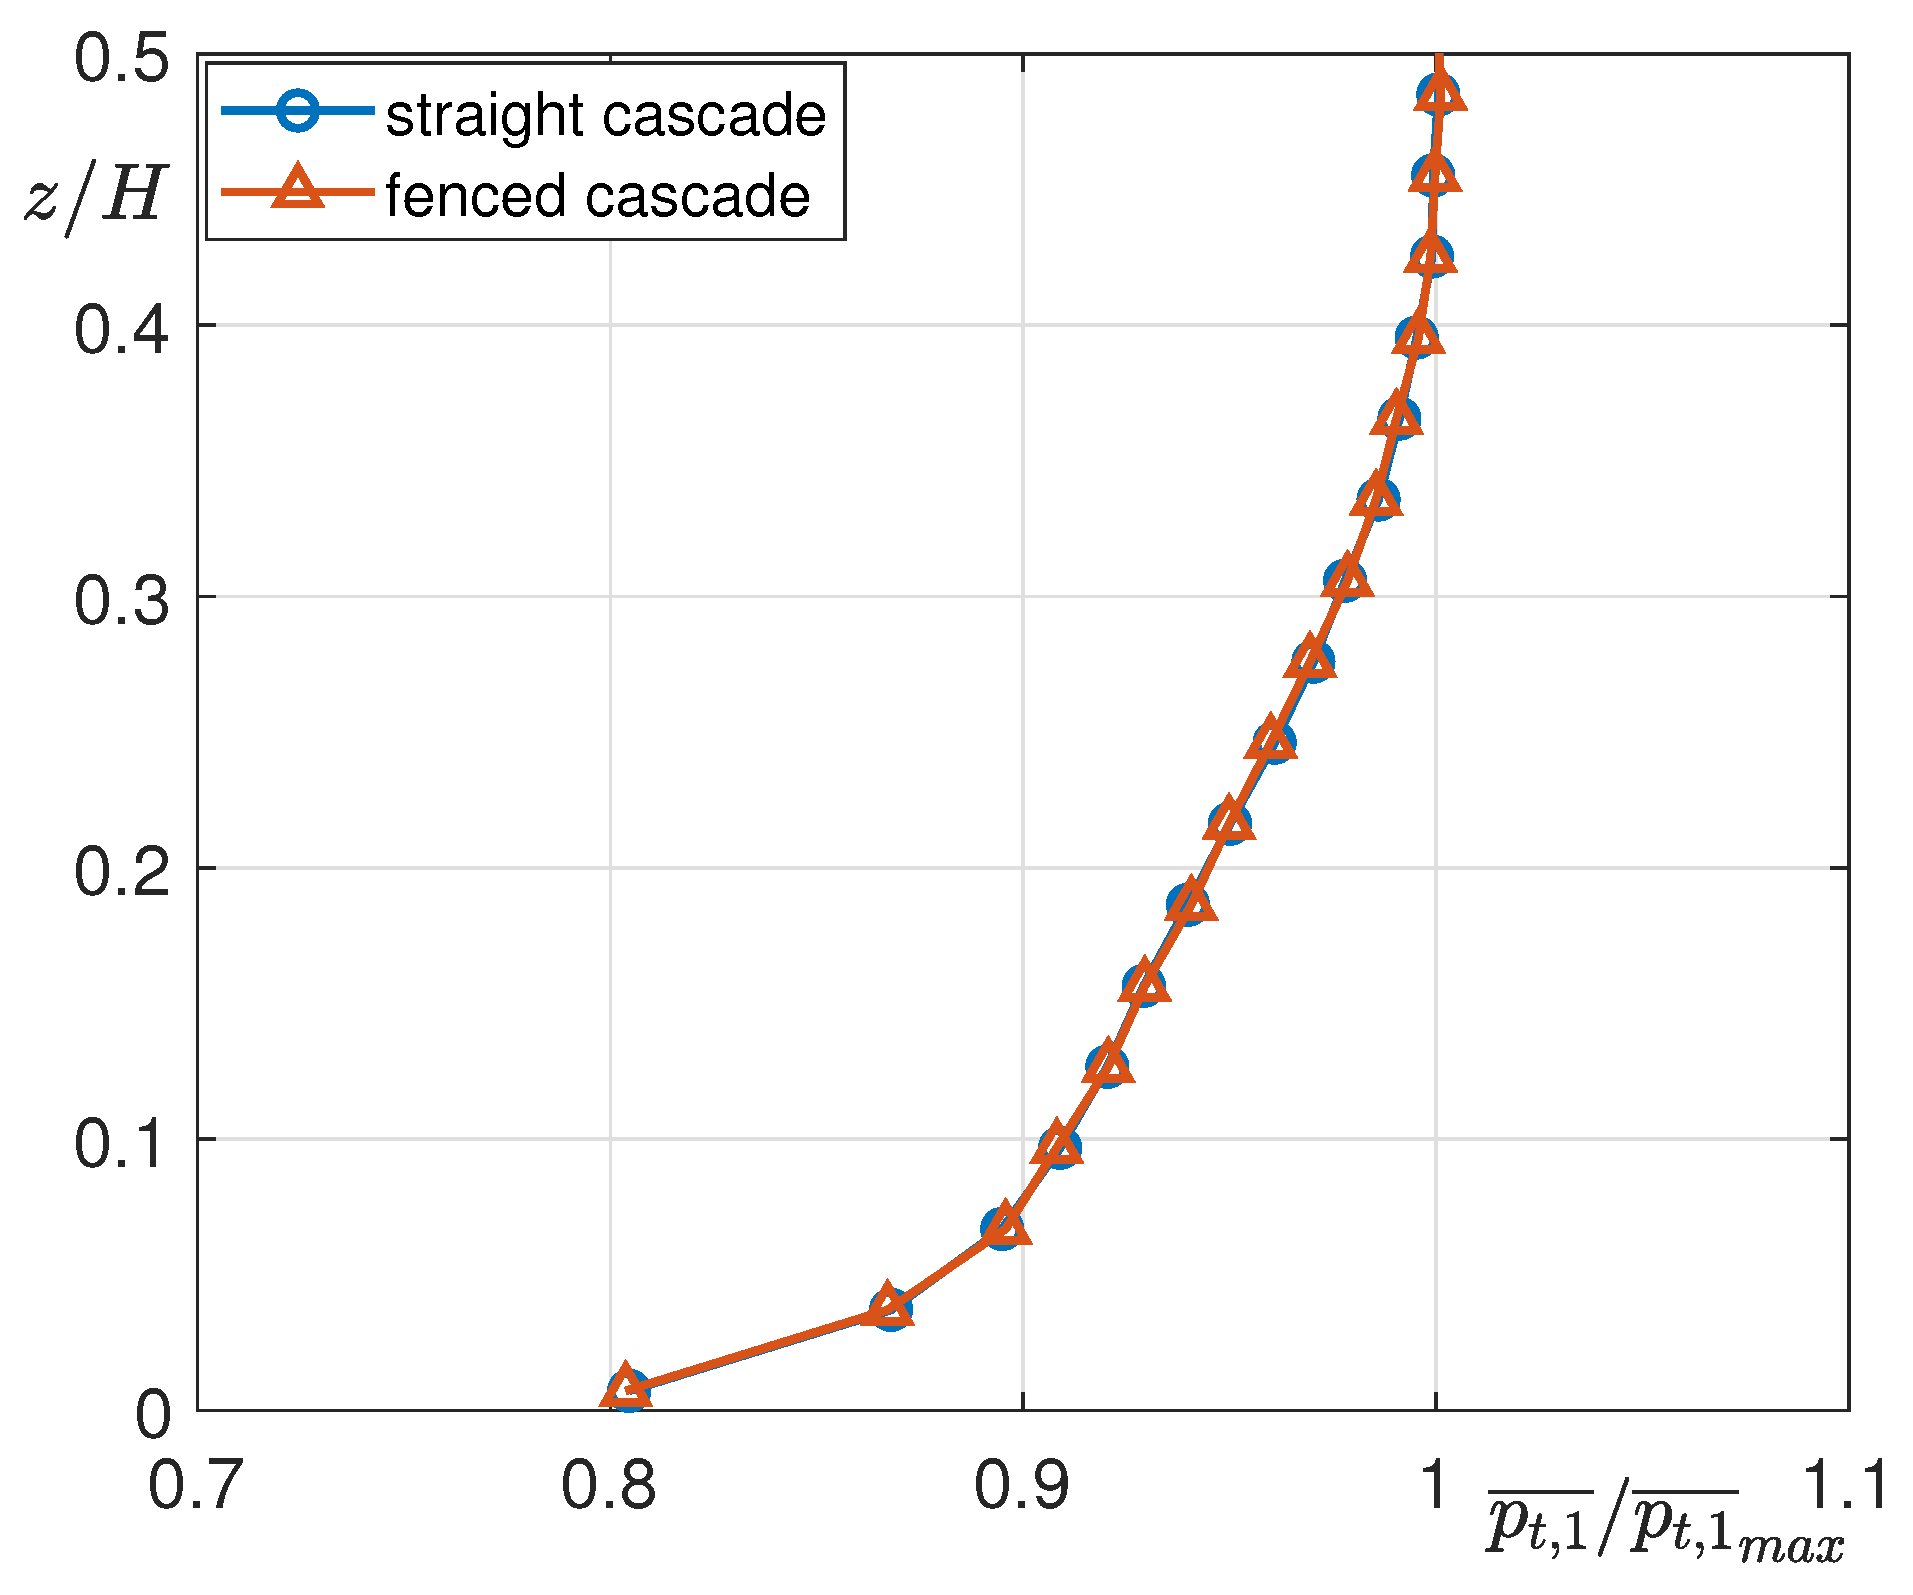
Since secondary flows are particularly influenced by the inlet BL [29], the 2D field of the flow entering both straight and fenced cascades has been first of all characterized traversing the five-hole pressure probe in D 1 . Pitchwise-averaged distributions of total pressure measured upstream of the cascades and made non-dimensional by their maximum value ( p t , 1 ¯ / p t , 1 ¯ m a x ) are shown in Figure 6. Only half a span is shown in the diagram because of the profile and channel symmetry at the cascade inlet. The two distributions associated with straight and fenced cascades are overlapped, meaning that the boundary conditions have been preserved before and after the fence installation, hence resulting in a high level of confidence in the comparison between the two cascades. Moreover, particular attention has been given to the characterization of the inlet turbulence, both in terms of turbulence intensity decay at midspan and spanwise distributions. As recently demonstrated by the same authors in [27] on the same test case, the detailed characterization of the boundary layer entering the cascade is crucial for accurately setting up the inlet boundary conditions of both low-fidelity and high-fidelity 3D simulations.
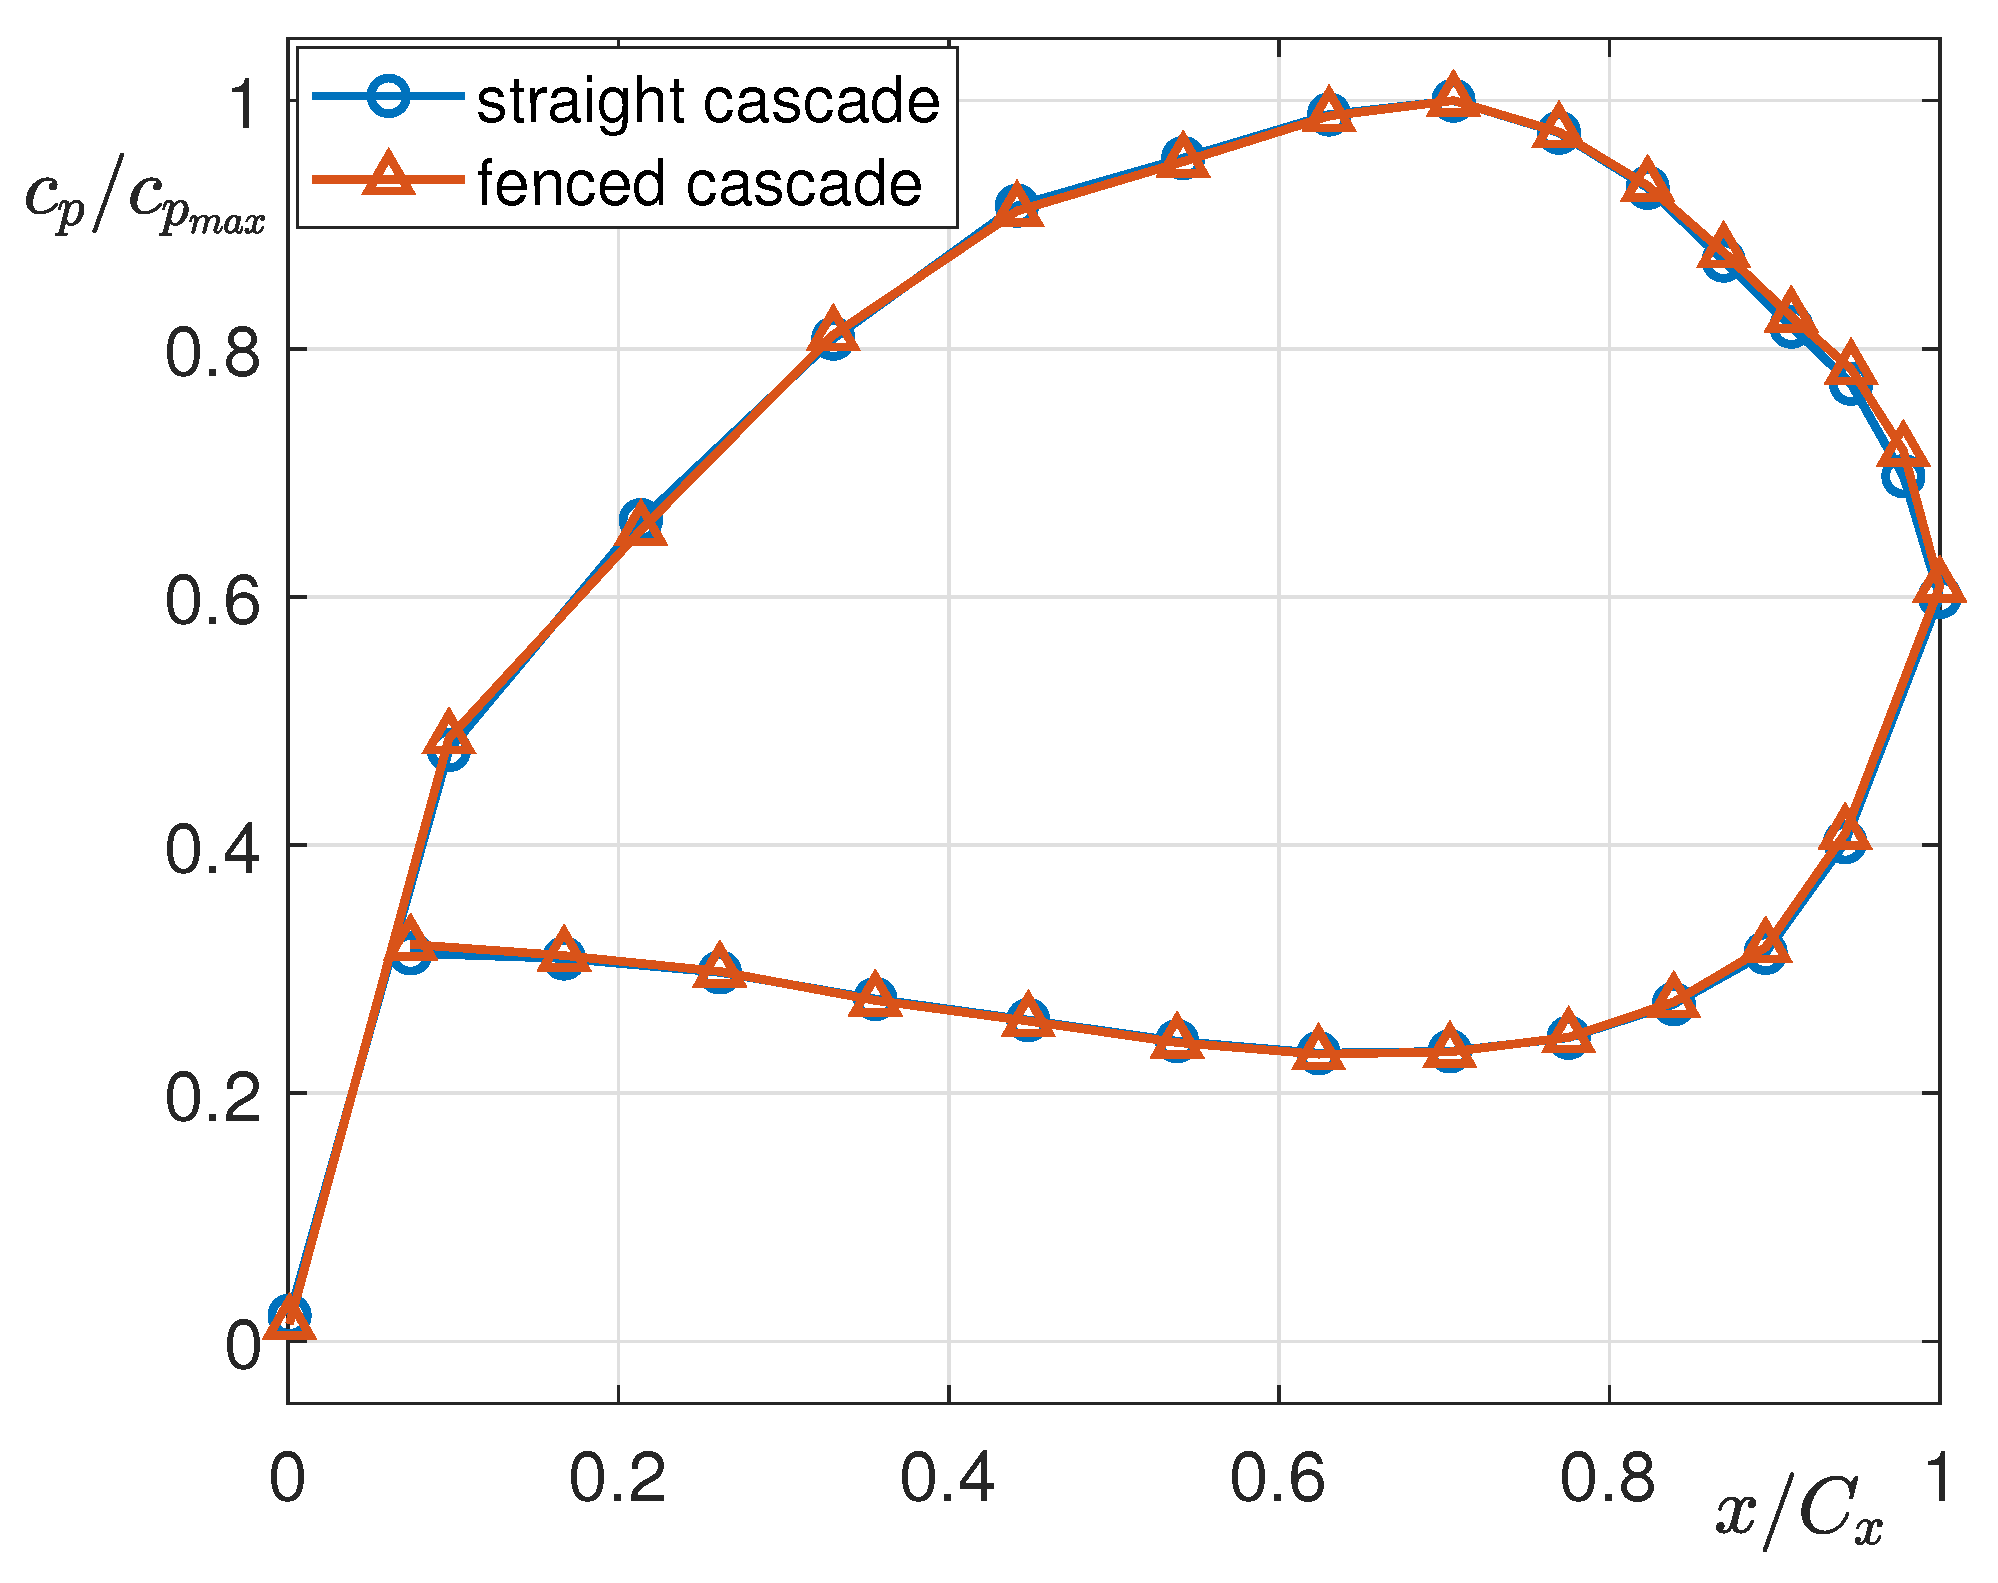
To further verify that the setup has remained unchanged before and after the installation of fences, blade loadings measured for the two configurations have also been compared. Figure 7 shows the c p distributions of straight and fenced cascades, made non-dimensional by the maximum value of the straight case. The blade loadings have been acquired at midspan, where the influence of secondary flows is negligible, as better discussed in the following. The overlap between the two blade loadings demonstrates that there are no variations in the flow at midspan due to the installation of fences.

5.2. Experimental Analysis of Secondary Flows

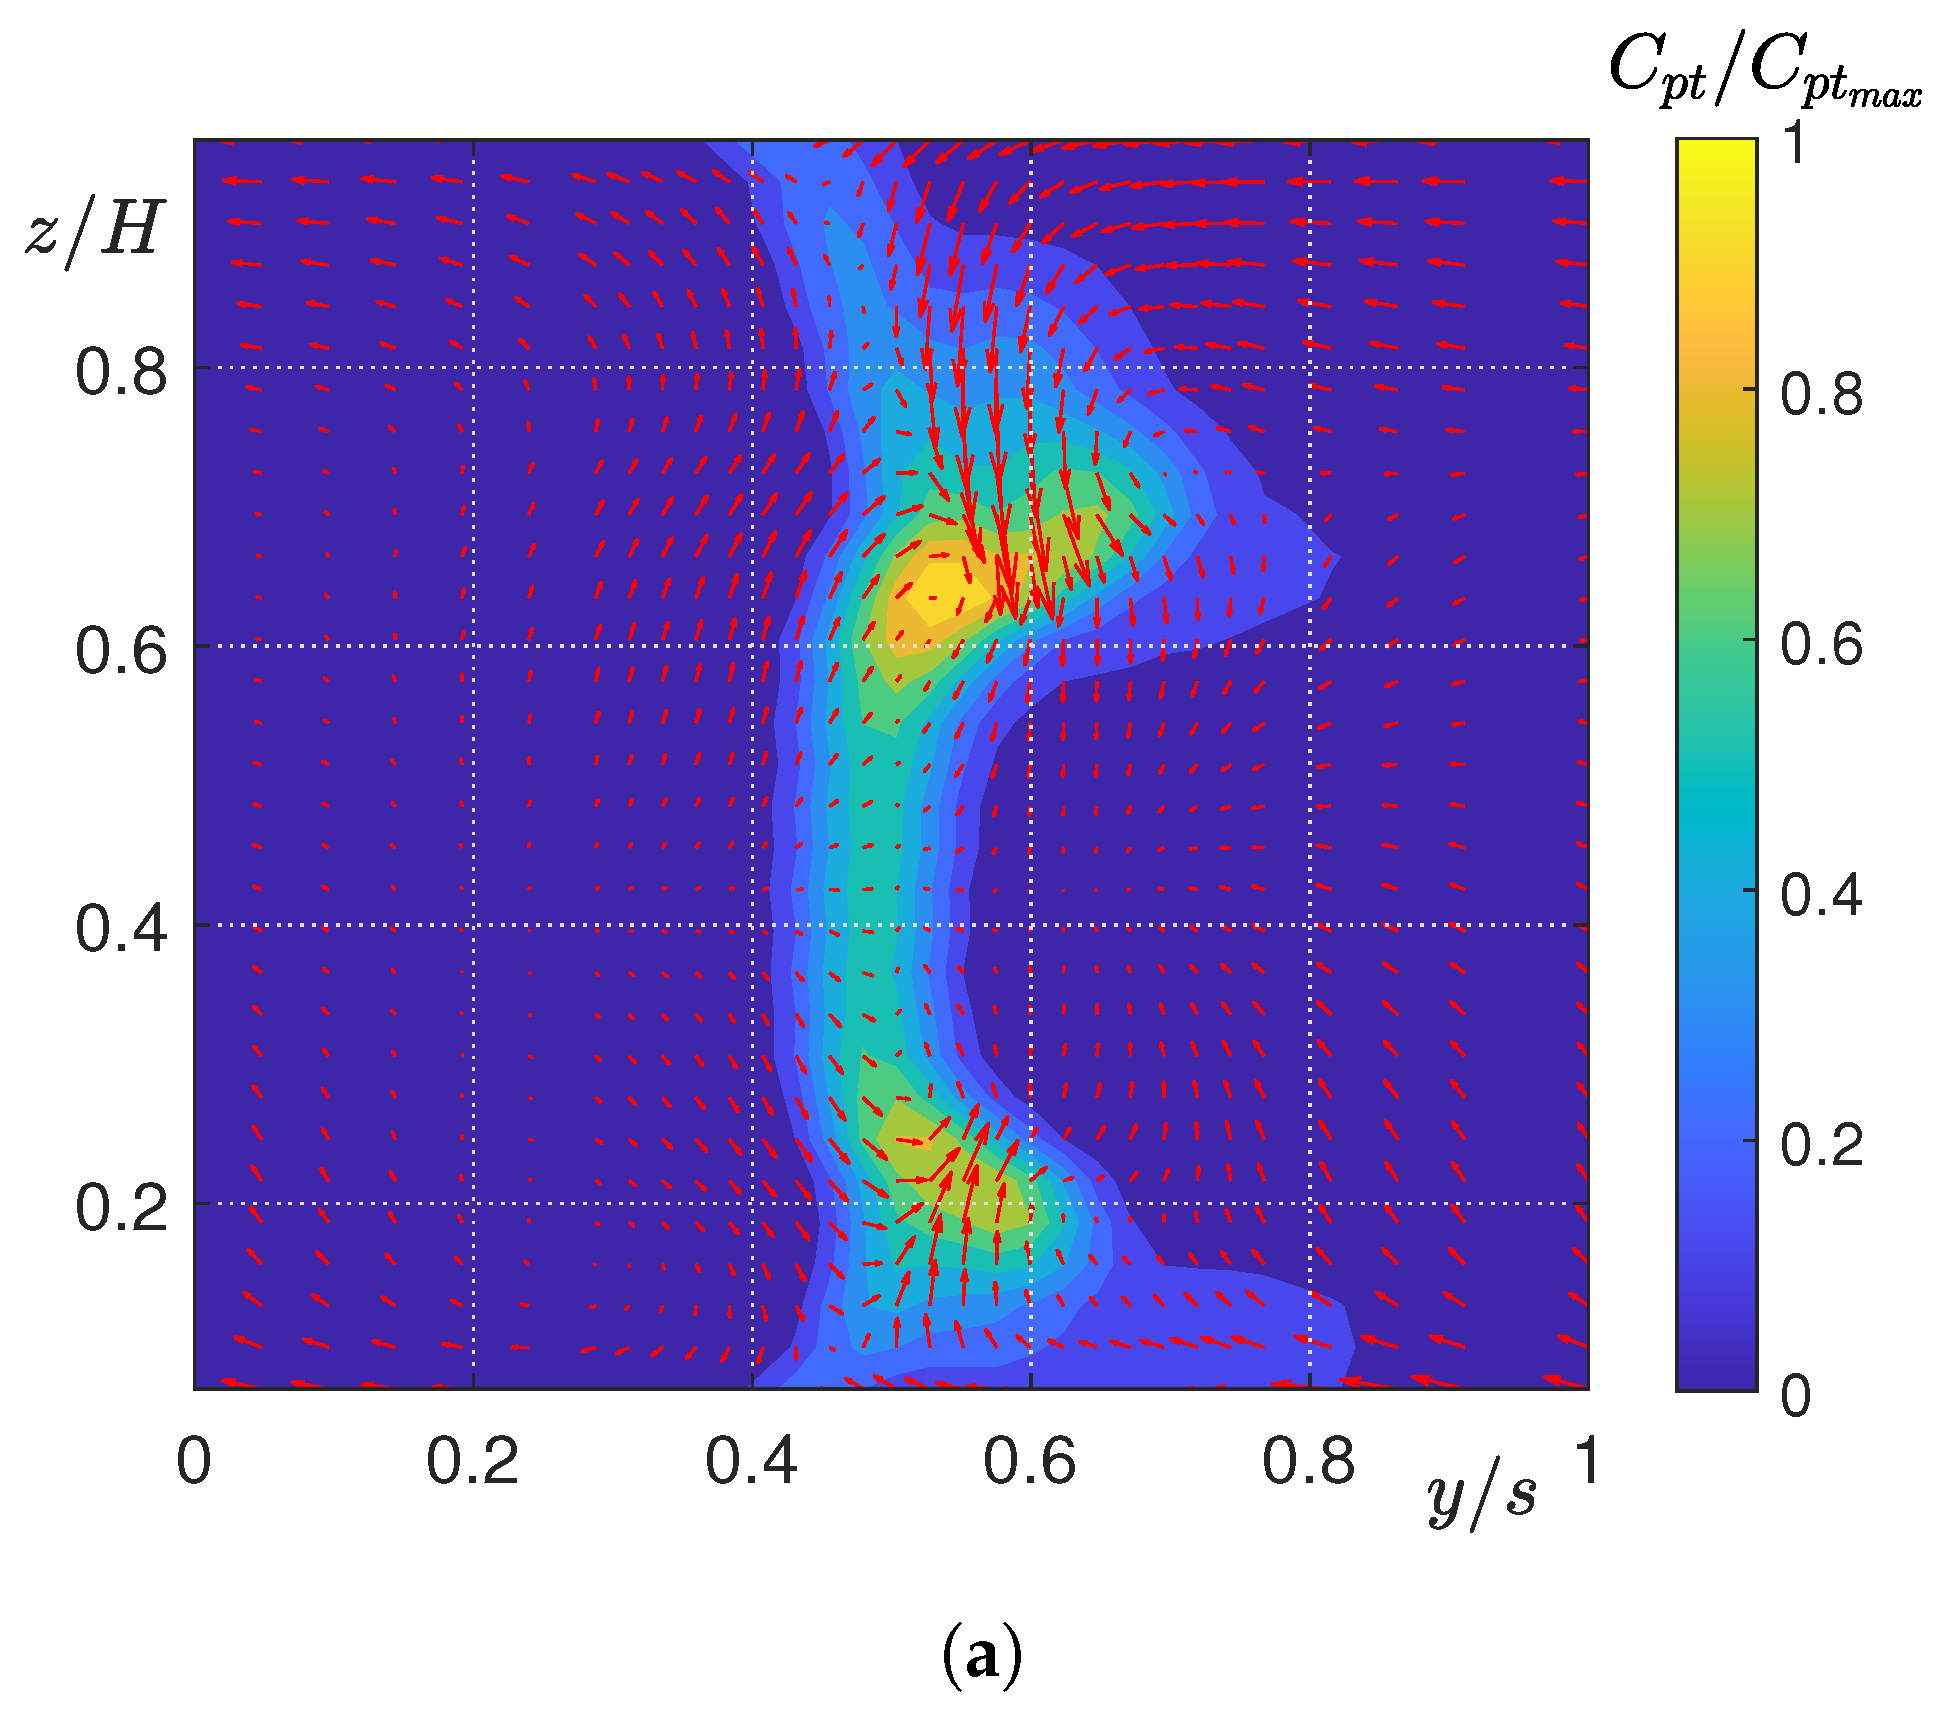
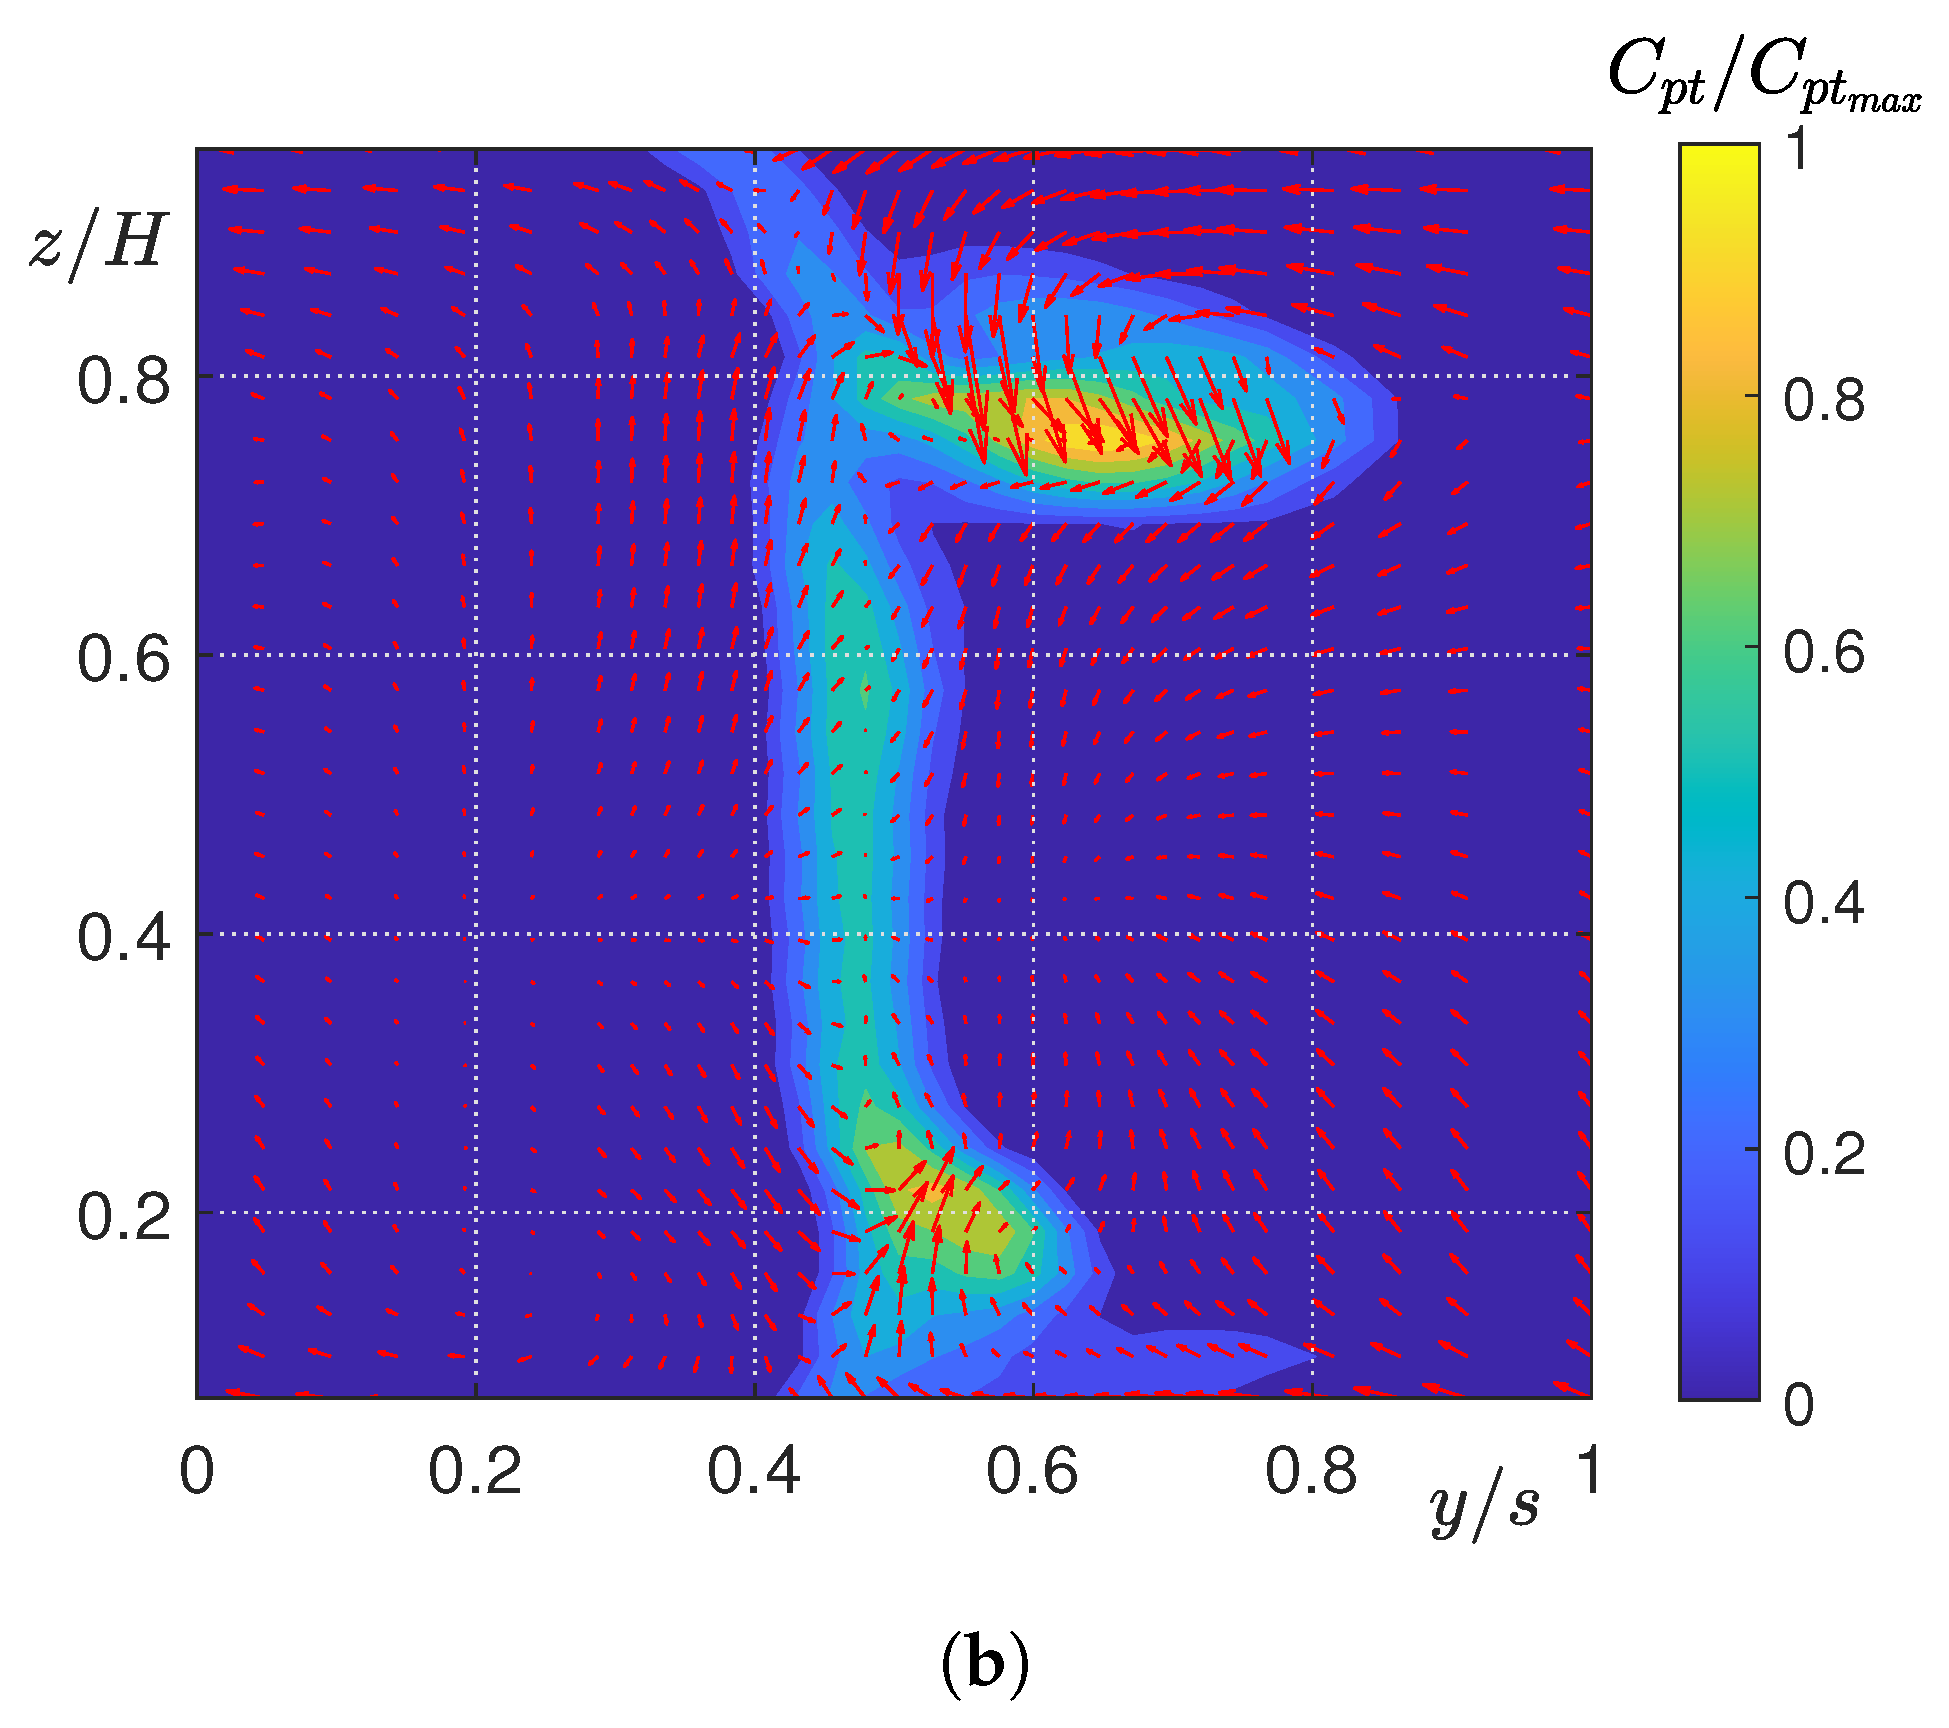
The five-hole pressure probe has been adopted to measure total pressure and velocity distributions at the cascade inlet and outlet sections, with the aim of evaluating the total pressure coefficient and characterizing in detail the secondary flow structures. The results are shown flipped upside-down to reflect the real engine configuration, where the divergent endwall is at the blade tip. Figure 8 shows the contour plots of the total pressure coefficient C p t at the cascade outlet, made non-dimensional by the maximum value obtained from the straight configuration ( C p t m a x ), for both straight (Figure 8a) and fenced (Figure 8b) cascades at the cruise condition ( R e x = 400,000). The secondary velocity vectors have been superimposed to the C p t color plots to highlight the secondary structures.
In Figure 8a, two loss cores can be observed in correspondence of the blade suction side, centered at z / H = 0.18 and z / H = 0.65. They correspond to two counter-rotating passage vortices. From the velocity vector map, the bottom vortex exhibits a clockwise rotation, while the top one shows an anti-clockwise rotation. The passage vortex that develops near the blade tip, close to the divergent endwall, is larger and stronger than the PV at the flat endwall, due to the asymmetry of the meridional duct at the cascade outlet. Furthermore, due to channel divergence and low aspect ratio of the blades, the secondary structures are so extended that only a small portion of the flow can be considered unaffected by secondary flows and only influenced by the wake formation on the blade surfaces. This is confirmed by the strong three-dimensionality of the flow measured downstream of the cascade.
Analyzing the distribution of the total pressure loss coefficient downstream of the fenced cascade (Figure 8b), the effect of fences applied on the suction side of the blades near the divergent endwall (at the tip) can be observed. The contour plot highlights that the large passage vortex at the blade tip is still present and approximately of the same intensity. However, it is more confined to the upper endwall, although more extended in the pitchwise direction. This is due to the shelf-like structure of the fences, which confine the passage vortex against the wall, reducing its penetration along the span and allowing a larger portion of the blade height to be free from the influence of secondary flows. This reduction of secondary flow penetration suggests that the flow exiting the fenced cascade may be more uniform compared to the one exiting the straight cascade, leading to a carry-over effect, which is likely to increase the downstream rotor efficiency, consequently improving the overall stage performance. On the other side, it can be noted that the secondary structure at the flat endwall does not change between the two cascade configurations, remaining unaffected by the installation of fences on the blades.
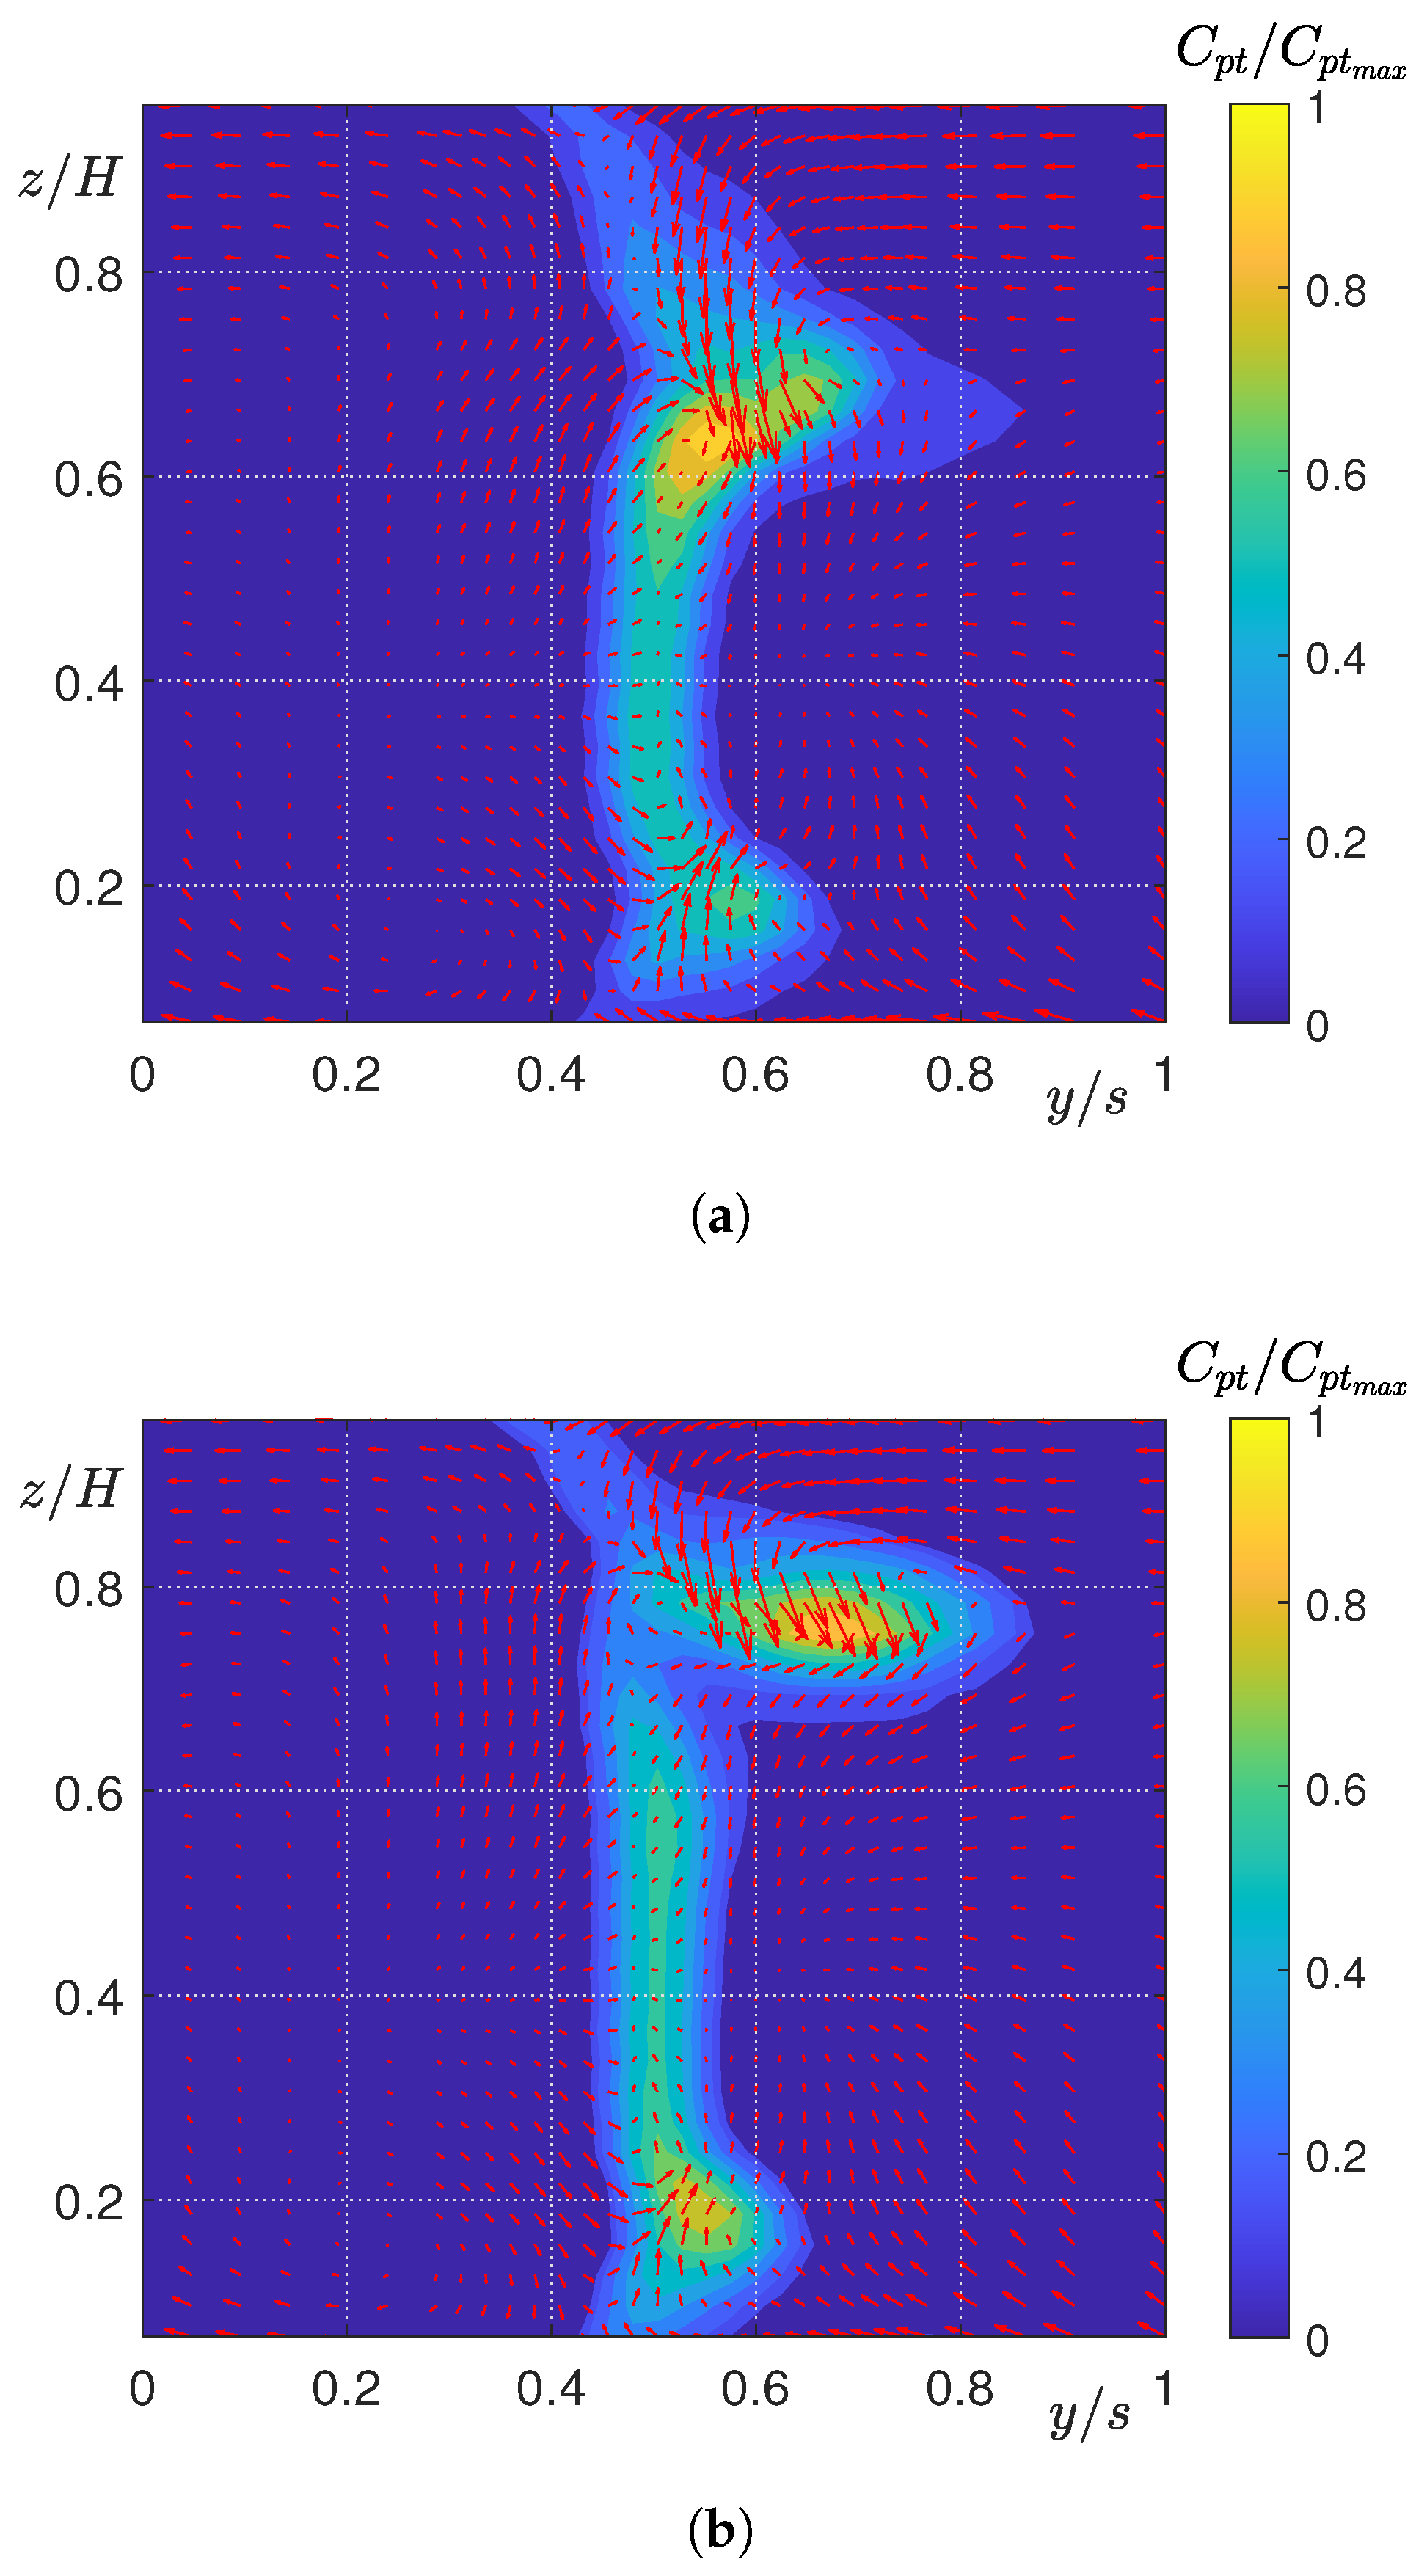
In Figure 9, the maps of total pressure loss coefficient for straight (Figure 9a) and fenced (Figure 9b) cascades at the take-off/landing condition ( R e x = 700,000) are shown. Also in this case, they are normalized by the maximum C p t value obtained from the straight configuration at R e x = 400,000, allowing a better comparison between the two flow conditions. It can be observed that the position of the hub and tip passage vortices does not seem to be affected by the Reynolds number for both cascade configurations (Figure 8 and Figure 9). Conversely, a slight reduction in the size and intensity of C p t in both wake and passage vortices can be seen as the Reynolds number increases.
To quantitatively estimate the effect of the fences on the mitigation of secondary flows and the influence of Reynolds number on the formation of vortex structures, the total pressure loss coefficient maps were pitchwise averaged. Figure 10 shows the spanwise distributions of C p t ¯ , made non-dimensional by the maximum value of C p t ¯ obtained in the straight configuration at R e x = 400,000, for the two cascade configurations and the two Reynolds numbers tested. Observing the distribution for the straight cascade, it can be seen that the two C p t ¯ peaks, located at z / H = 0.18 and z / H = 0.65 , correspond to the cores of the two passage vortices previously discussed, with the one at blade tip having significantly higher intensity (on average, about twice) than the other. Additionally, they are so extended that only at z / H = 0.35 there is a region of minimum loss, free from the influence of secondary flows, that allows the computation of the profile loss coefficient, ω p . Regarding the spanwise distribution of C p t ¯ in the fenced cascade case, it can be observed that the peak related to the passage vortex at the divergent endwall is higher than in the straight case. Indeed, although no relevant differences are visible in the maximum value of the C p t maps shown in Figure 8 and Figure 9 between the two configurations, the larger extension along the pitchwise direction of the loss core when fences are applied leads to higher pitchwise-averaged values of the total pressure loss coefficient. Moreover, the core of this secondary vortex in the fenced cascade is more shifted towards the divergent endwall. The loss peak in the spanwise distribution of C p t ¯ is located at z / H = 0.75, confirming the positive effect of fences in reducing the penetration of secondary structures along the blade height. On the other side, the secondary vortex developing at the blade shroud is not altered by the installation of fences, as can be seen from the overlapping of the C p t ¯ values at the hub. Additionally, the spanwise distribution of C p t ¯ shows another loss peak at z / H = 0.62, likely associated with the development of the boundary layer and the formation of vortex structures above the fence surfaces, combined with the passage vortex developing within the blade channel.
Concerning the influence of the Reynolds number, it can be observed that losses associated with secondary flows, particularly related to the vortex structure developed at the diverging endwall, are significantly lower as the Reynolds number increases, as it can be seen from its peak reduction at z / H = 0.75. This occurs for both straight and fenced cascades.
The comparison in terms of losses between the two cascade configurations at the two Reynolds numbers is reported in Table 1. Here, the profile ( ω p ), secondary ( ω s ), and total ( ω ) loss coefficients computed for each condition are normalized by the total losses of the straight cascade case at R e x = 400,000, for confidentiality reasons. As it can be seen from the ω s values, fences applied on the suction side do not reduce the secondary losses. Indeed, total losses increase by 5 % , while profile losses remain unchanged when fences are installed on the blade. Moreover, it can be noted that, as expected, as the Reynolds number increases, profile and secondary losses are reduced for both configurations, regardless of the presence of fences on the blade surface.
However, the beneficial effects of fences can be observed by considering the carry-over effect on the following row. Indeed, the larger uniformity of the flow exiting the cascade could improve the performance of the downstream blades in the turbine stage.
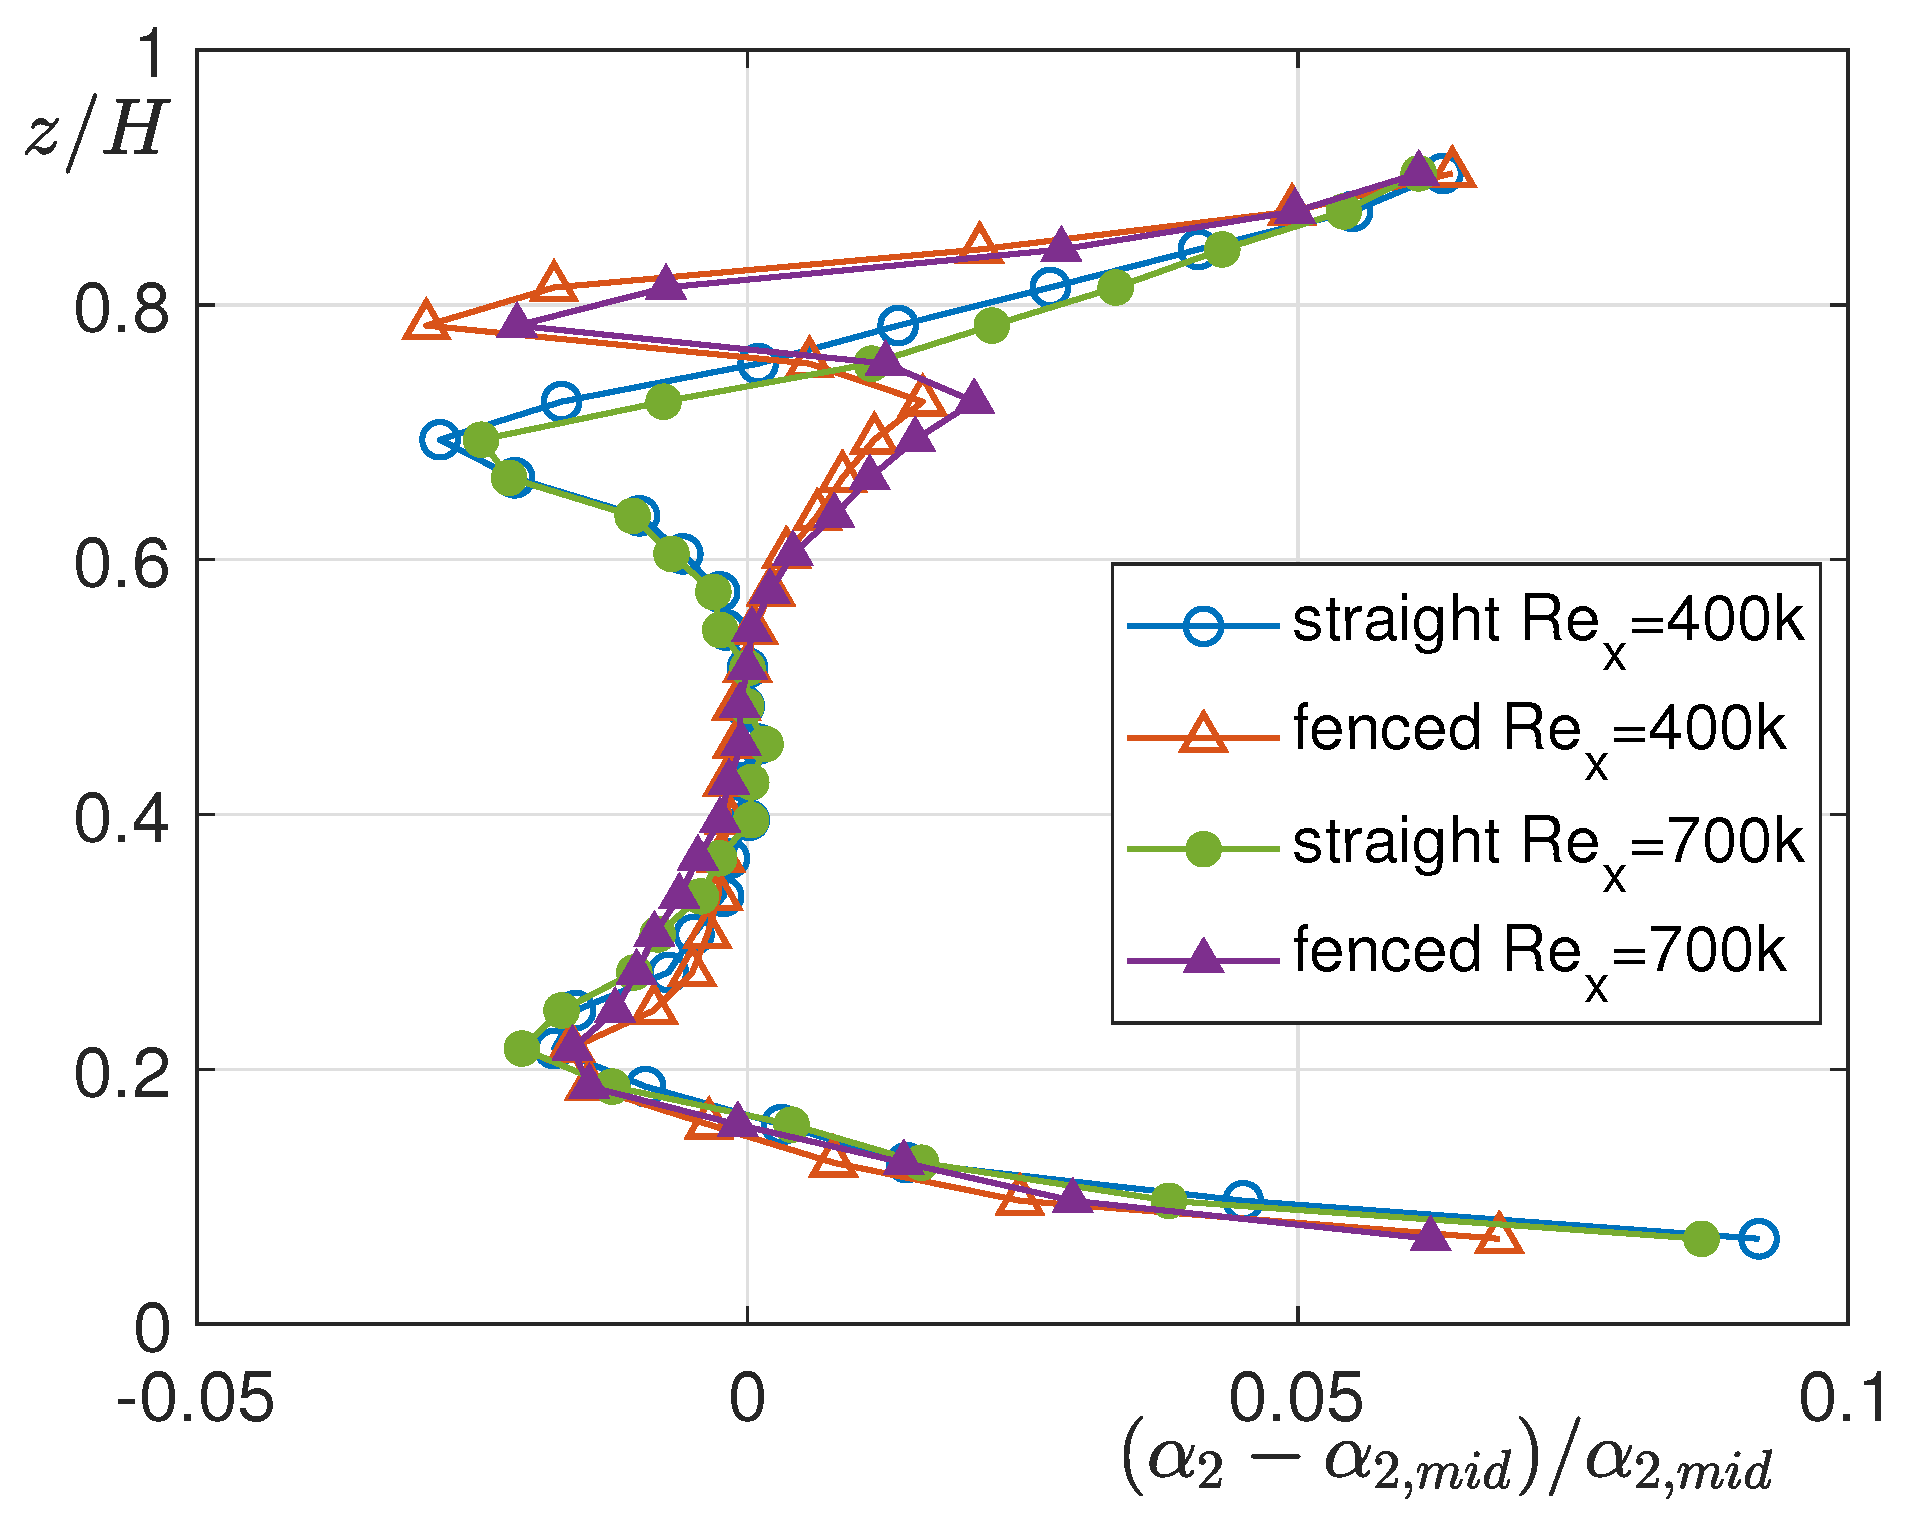
The distributions of flow angle α 2 at the cascade outlet may allow an estimation of the flow distortion at the exit of the cascade due to secondary flows. Figure 11 shows the distributions of the difference between the local flow angle and the flow angle at midspan ( α 2 , m i d ), normalized by α 2 , m i d measured at the exit of both straight and fenced cascades for both Reynolds numbers. Different regions of under- and over-turning can be distinguished, caused by the secondary vortices. As expected, the largest flow angle distortion is due to the large passage vortex originating from the divergent endwall, in the upper part of the channel. It can be observed that this maximum distortion is confined to regions closer to the top endwall when fences are installed on the blade. This results in a larger portion of the blade height characterized by small deviations from α 2 , m i d . In particular, in the fenced case, the deviations are due to an over-turning induced by fences to contrast the under-turning. This confirms previous observations and aligns with existing literature [18], which indicates that fences lead to a more uniform flow at the cascade exit, by reducing the penetration of secondary flows along the blade height.

5.3. Numerical Results

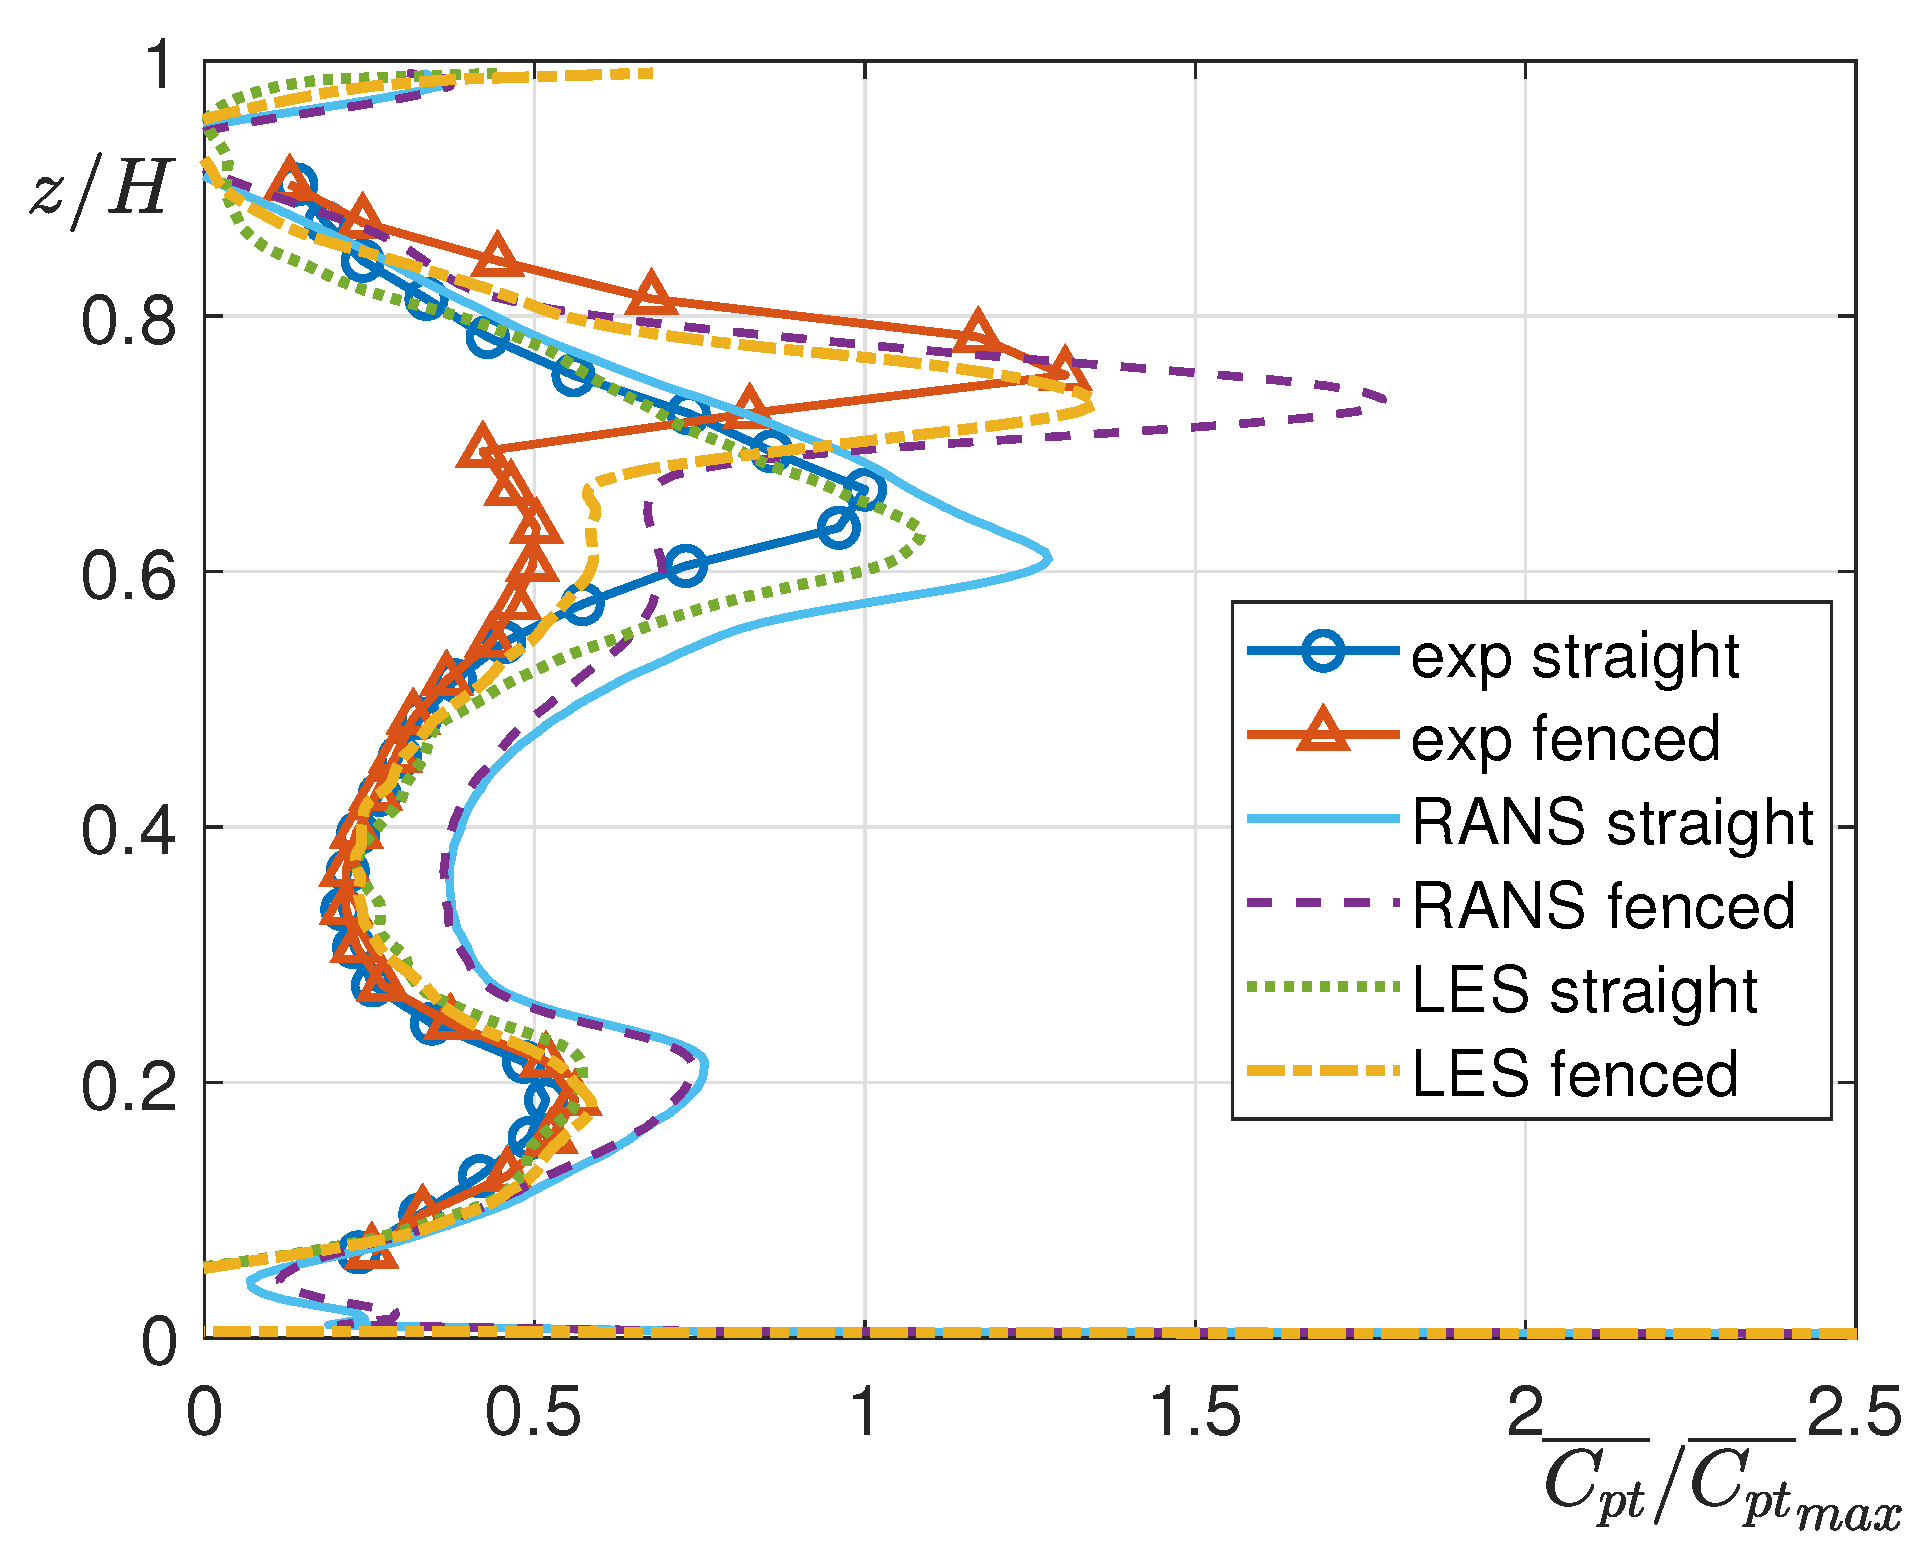
The flow conditions at R e x = 400,000 have been investigated using both RANS and LES approaches and compared with experimental results. Figure 12 and Figure 13 show a comparison between low- and high-fidelity simulations and the experimental results, in terms of losses and yaw angle, respectively. As an initial step, the loss distribution predicted by RANS and LES has been evaluated against experimental data for the straight blade configuration. The spanwise distribution of C p t ¯ from the LES showed strong agreement with the experimental data, with only minor discrepancies near the casing and in the prediction of secondary flow penetration at the tip. The overall trend of losses as a function of span has also been well captured by RANS. However, except in the region close to the casing, RANS tends to overpredict losses.
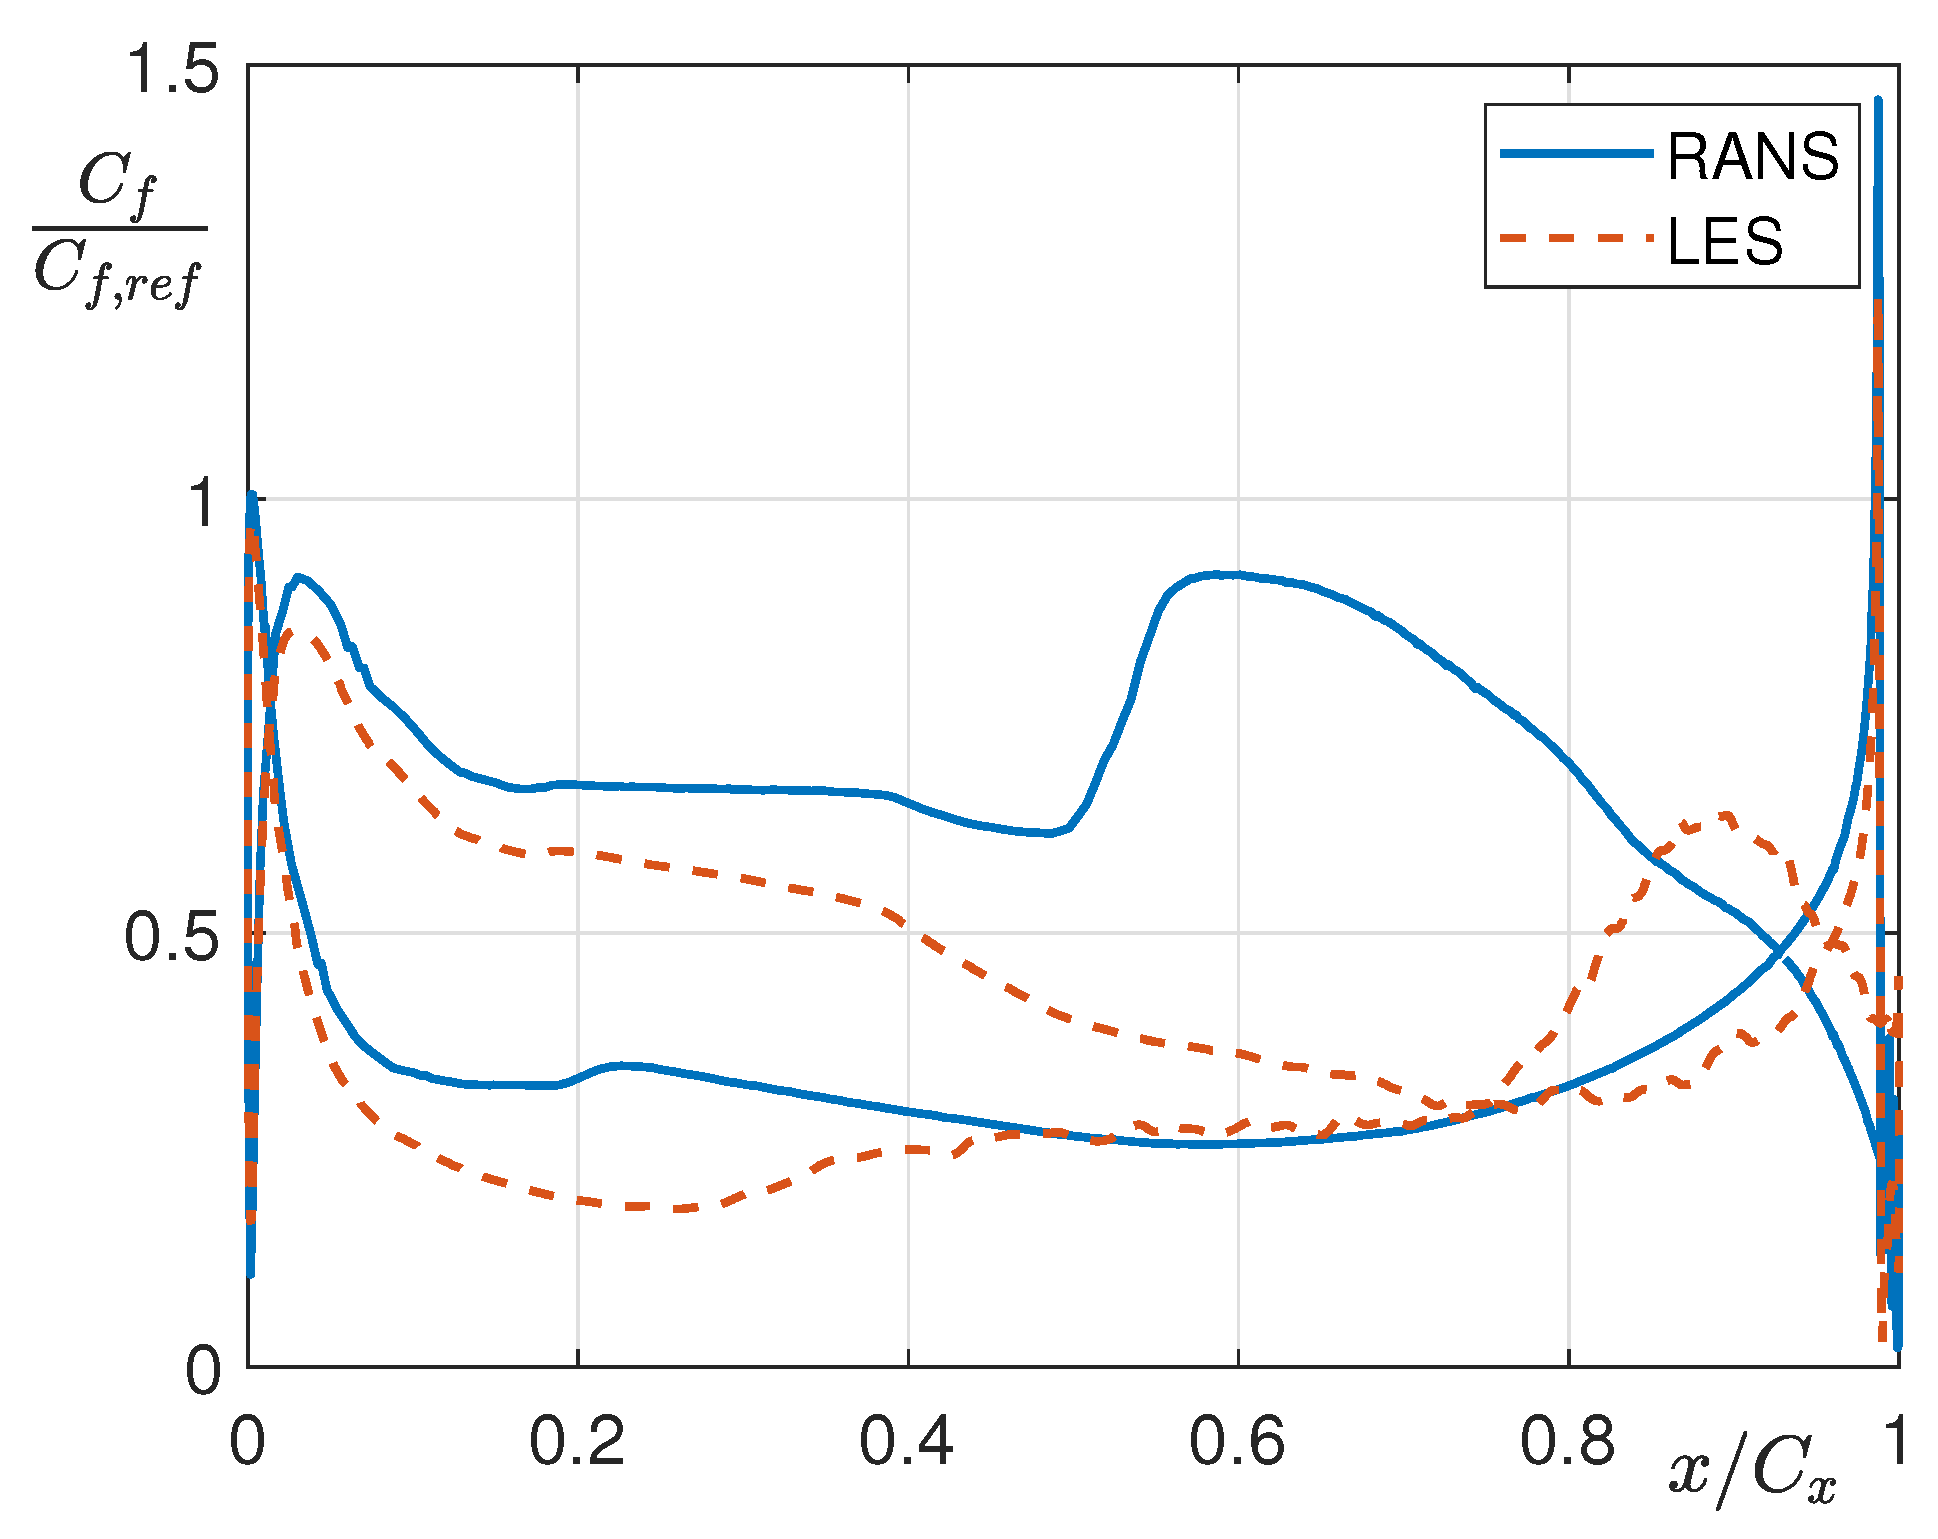
In particular, at midspan, the higher values of C p t ¯ are attributed to an overestimation of shear stress on the blade, indicating discrepancies in the transition prediction. To investigate this aspect, the distribution of the skin friction coefficient C f is presented in Figure 14, where RANS and LES are compared at midspan. As shown in the figure, RANS predicts that the transition occurs around 50 % of the suction side, while in the LES, the flow remains laminar until approximately 80 % of the chord length. The agreement with the experimental data in terms of losses suggests that the high-fidelity LES well captures the correct behavior of the suction-side boundary layer (overall losses differ from the experimental one for less than 3 % ). In contrast, the transition model in RANS tends to anticipate the transition, resulting in higher predicted losses (with an overall difference larger than 10 % ).
Similar observations in the comparison of pressure loss distribution between high and low fidelity simulations and experiments can be drawn also for the fenced blade. The LES shows a very good agreement with little discrepancies at the secondary flow peak, while the RANS leads to an overprediction. In any case, both calculations are substantially able to predict the effect of the fences on secondary losses, as they correctly compute a higher loss peak in the fenced configuration compared to the smooth blade case, while also predicting a more confined loss region closer to the endwall.
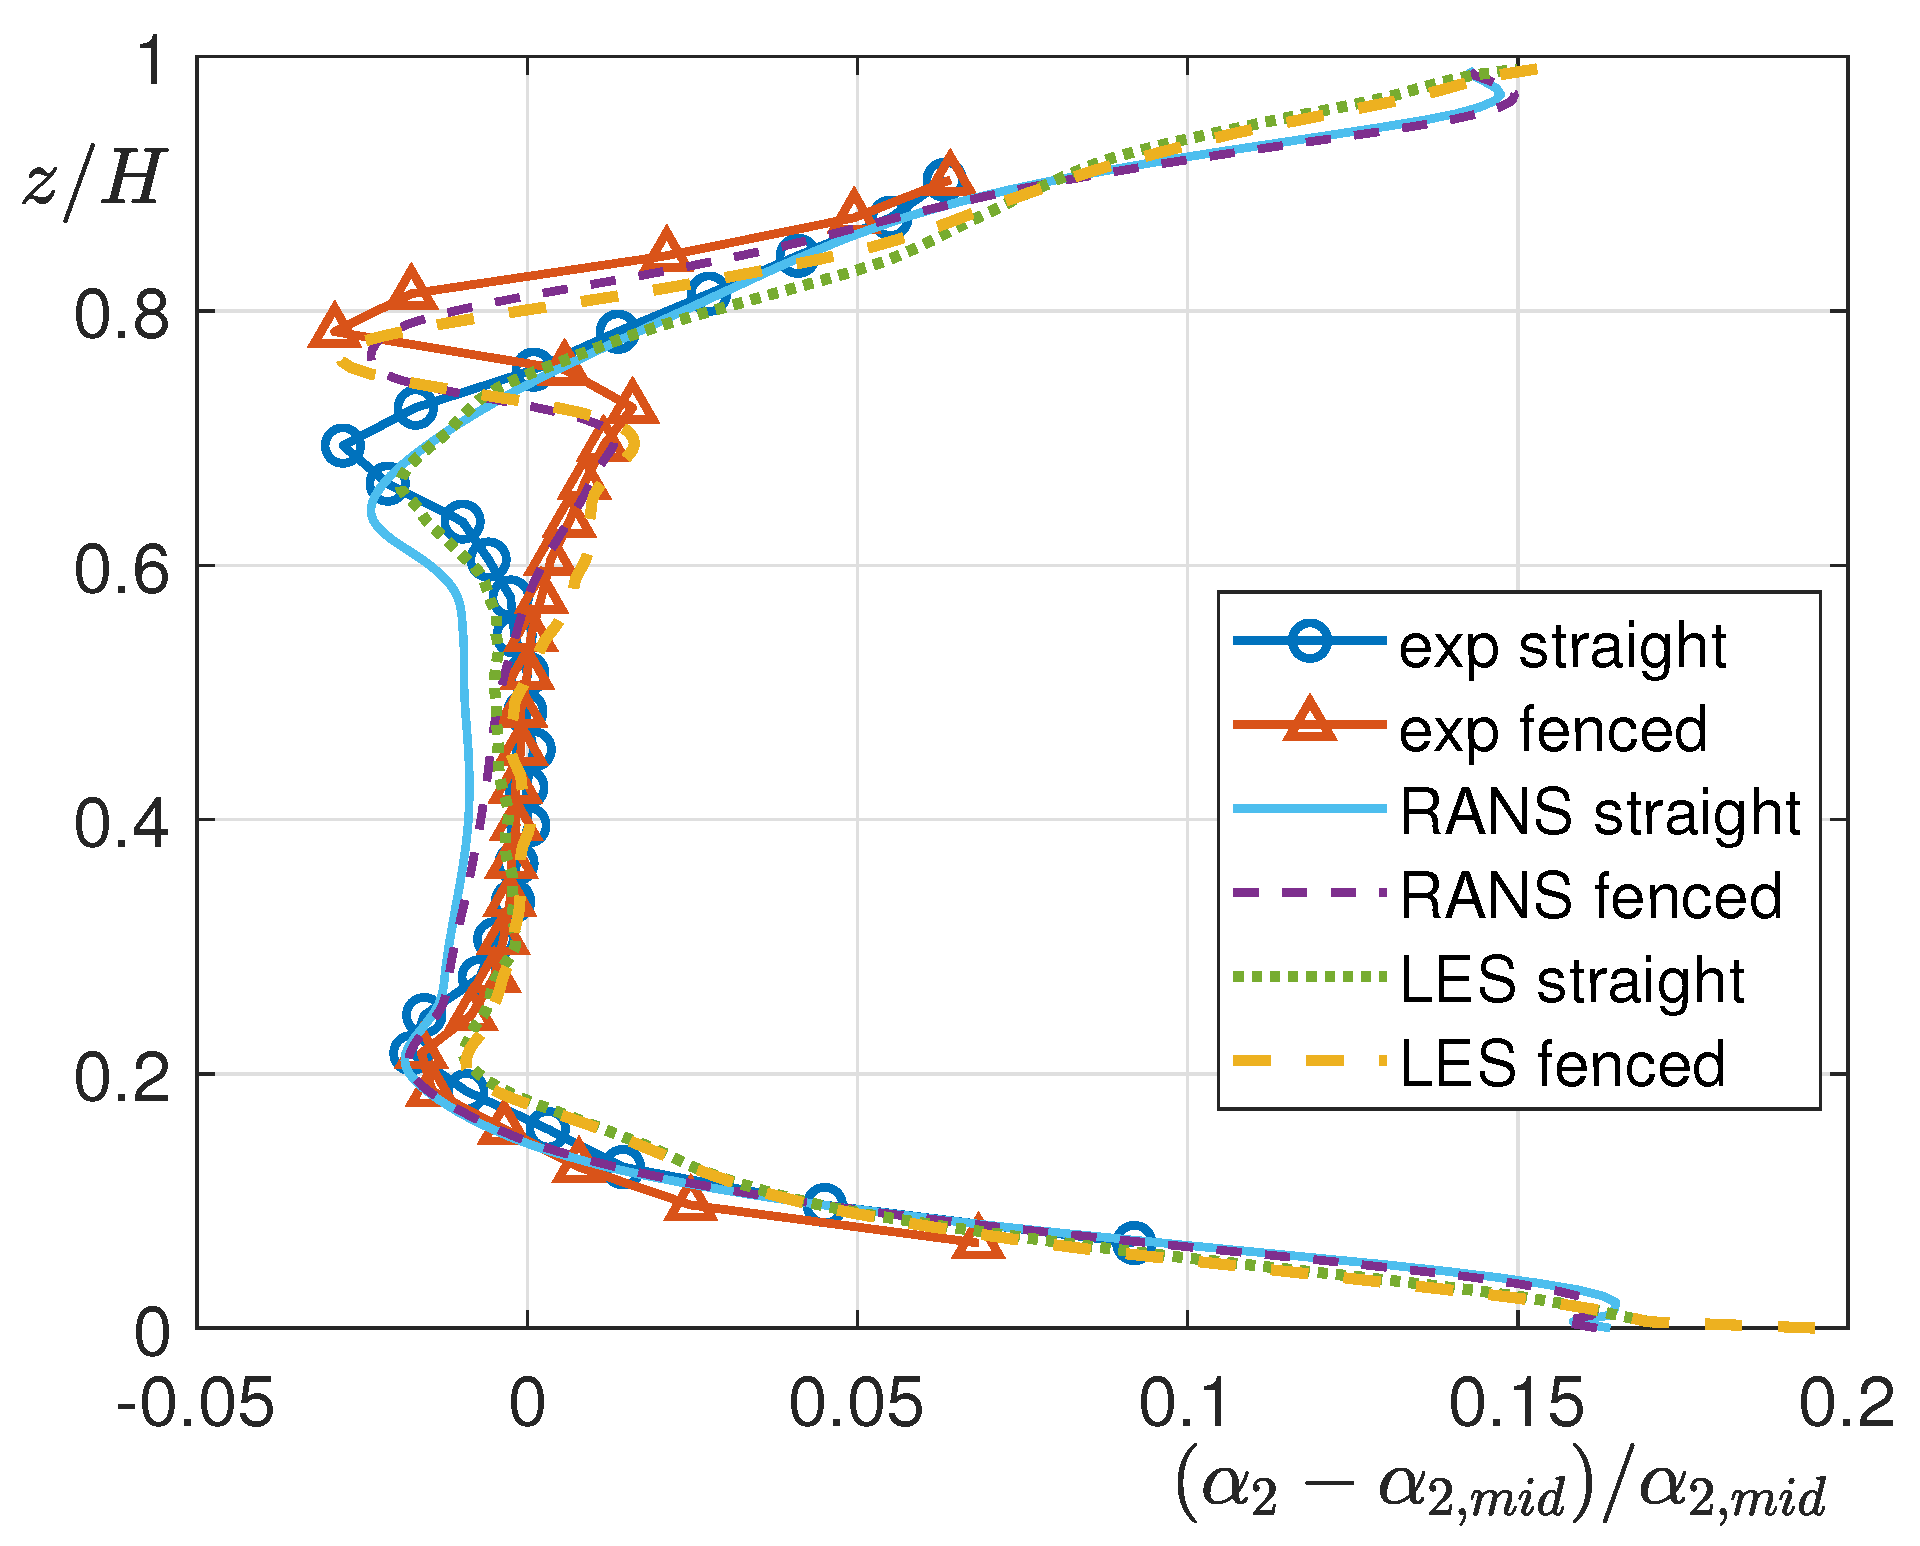
Concerning the yaw angle α 2 (Figure 13), LES and RANS simulations show similar results. For the straight blade configuration, only minor differences are observed in the secondary flow penetration and in the angle values at midspan. Compared to experimental data, both simulations slightly underpredict the under-turning, while the over-turning is somewhat overpredicted. The effect of the fence installation in confining the passage vortex is well captured by both high- and low-fidelity simulations. Notably, the α 2 values from both RANS and LES show strong agreement with experimental data, particularly in accurately predicting the under-turning.
The streamlines shown in Figure 15 for the straight blade case can help to understand how the flow field appears. The classic effect of the passage vortex is clearly highlighted near the casing, where the streamlines become almost tangential, and on the suction side of the blade, where a distinct deviation is observed (see Figure 15a). Moreover, focusing on the blade LE, it can be noticed that the horseshoe vortex is practically negligible (Figure 15b).
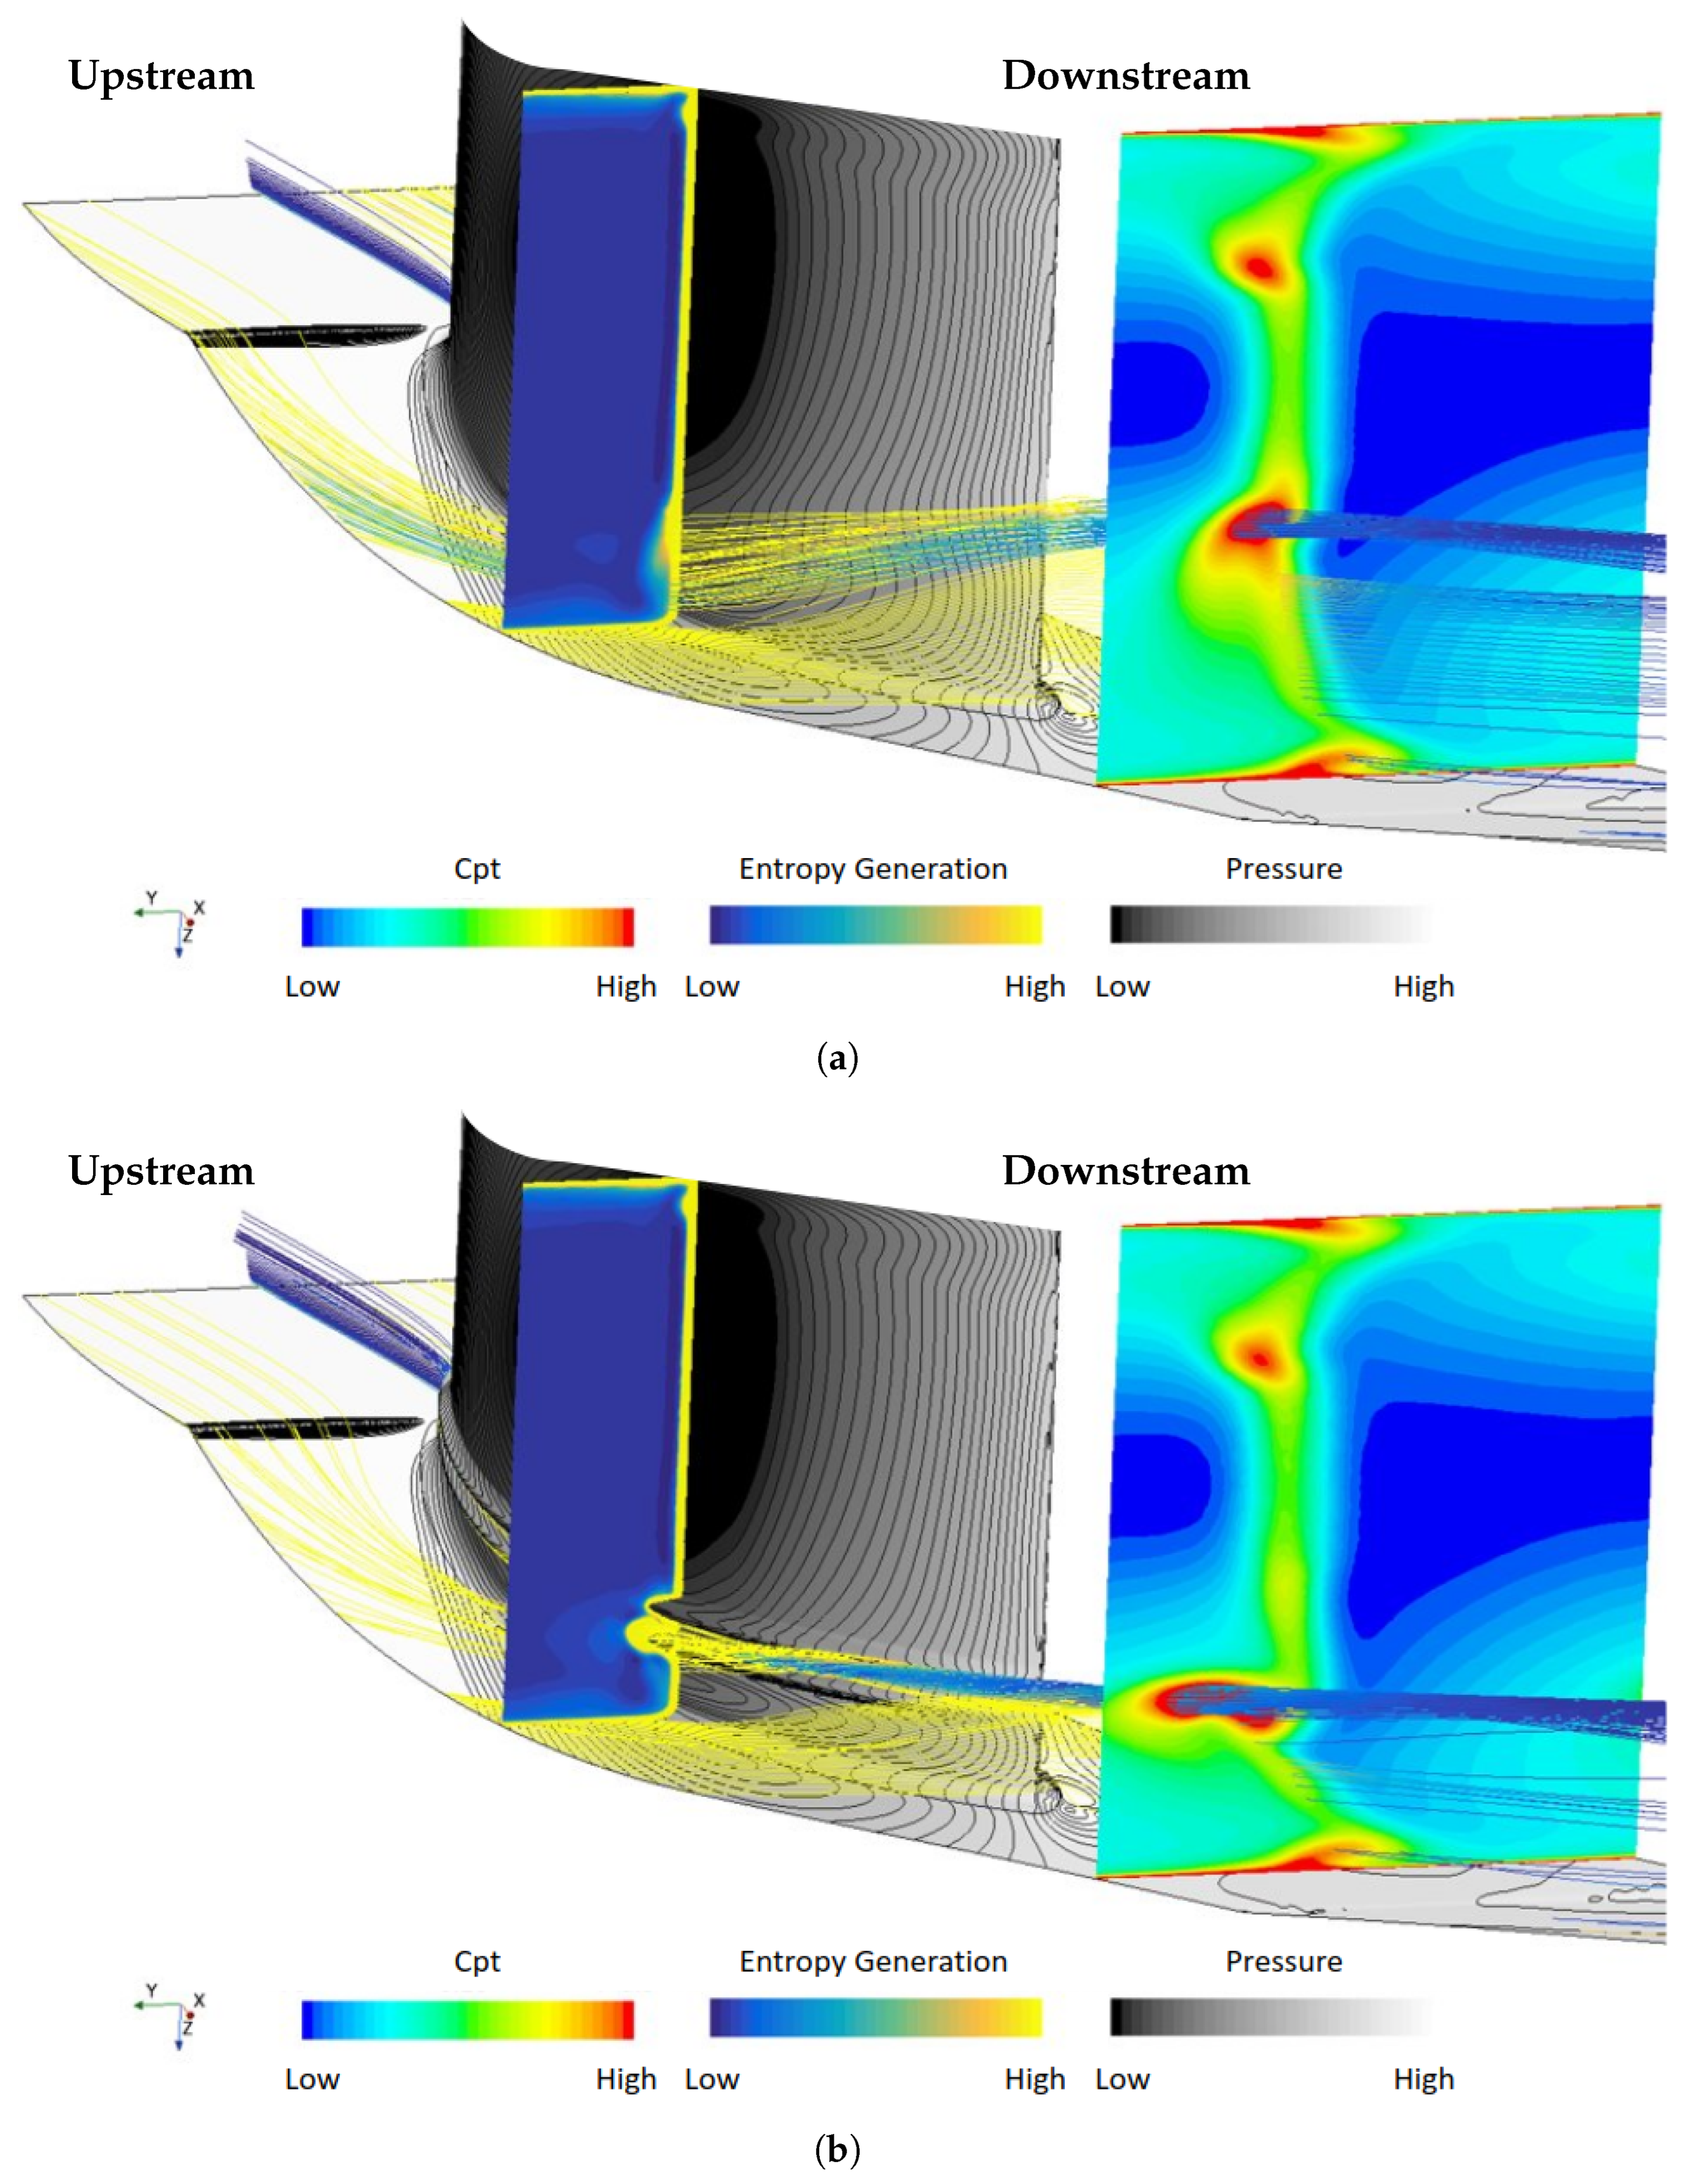
On the other hand, looking at the rear part of the cascade, the effect of the passage vortex and the associated loss increase is clearly visible (Figure 15c). The specific configuration of the meridional channel, characterized by high diffusion near the casing surface, combined with the presence of large fillets between the endwall and the blade, as well as the elevated values of the Eckerle and Awad parameter [30], contributes to limit the strength and development of the classical horseshoe vortex which is typically observed in other applications. This distinct configuration of secondary flows and the relative significance of the primary vortices (passage vs. horseshoe) plays a crucial role in defining the optimal fence design. In cases where a significant horseshoe vortex is present, the optimal geometry is primarily designed to inhibit its initiation and the growth of the pressure-side leg interacting with the passage vortex [18]. However, in the present case, where the passage vortex intensifies towards the aft section of the passage, fences applied on the SS have proven more effective in reducing the downwash on the SS surface and in containing the flow distortions for the successive row. Figure 16, based on LES results, illustrates how the installation of fences alters the development of secondary flows.
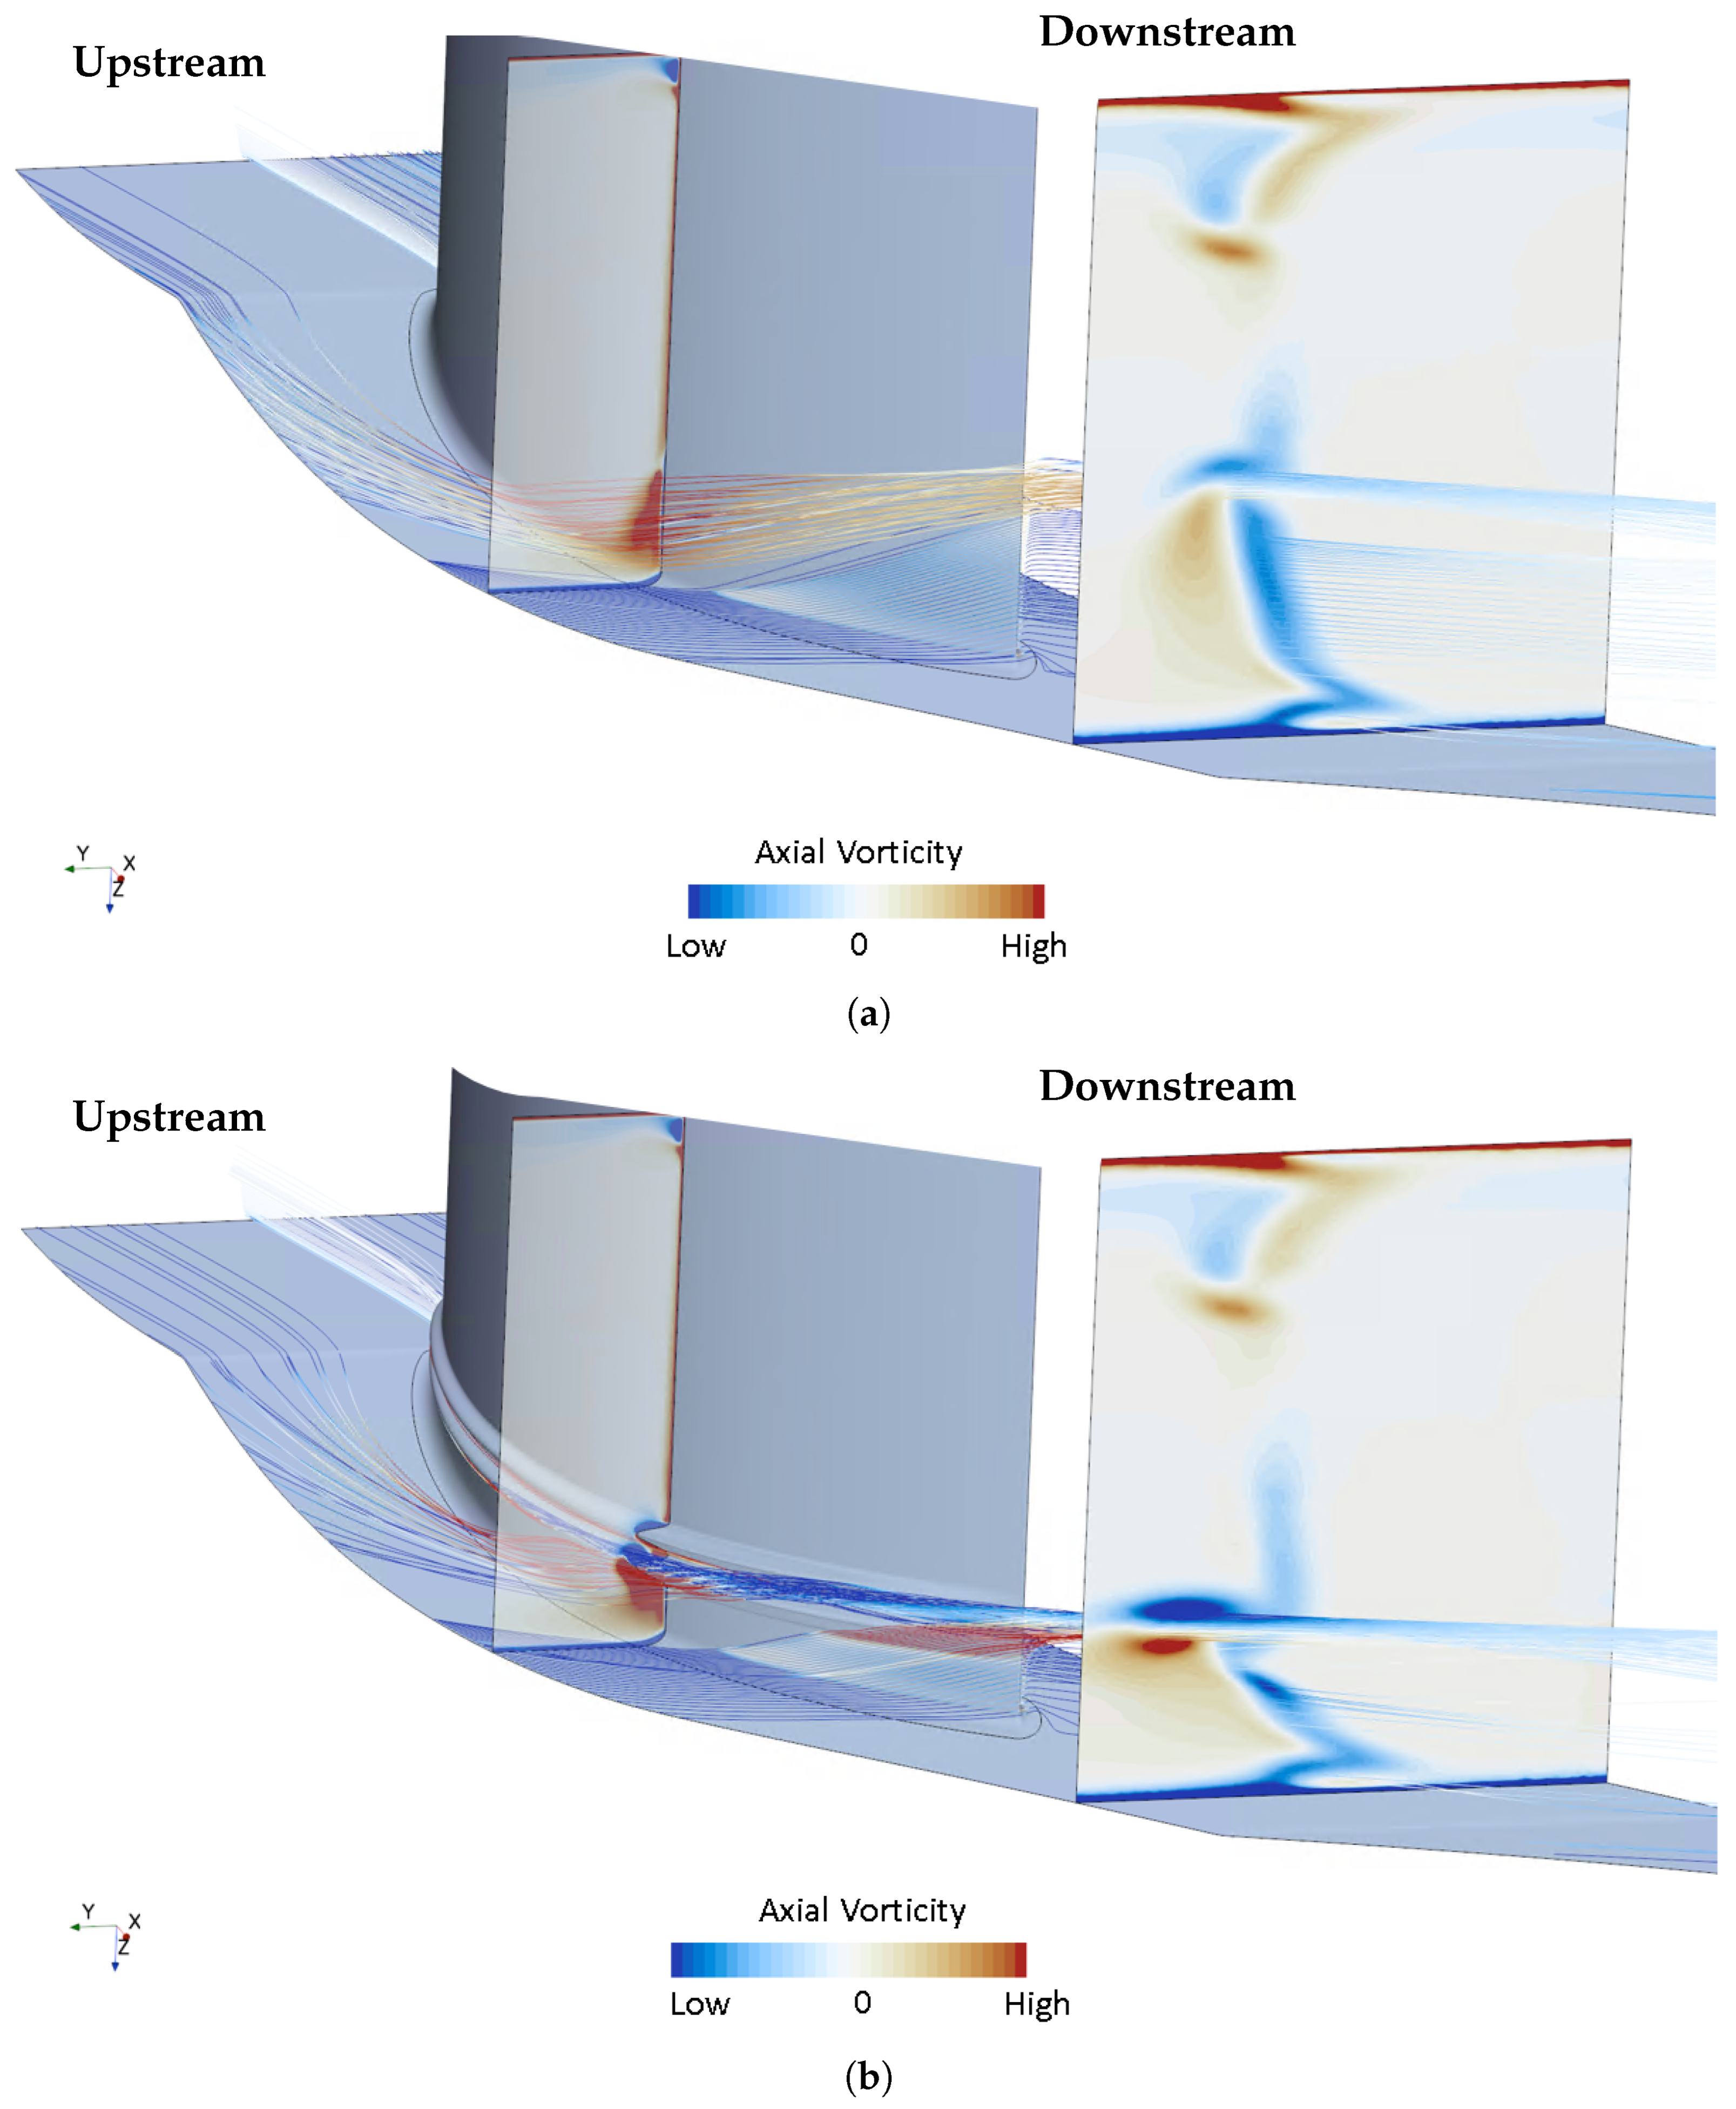
For both configurations, the figures show total pressure losses on plane D2. The surface of the casing and blade displays the static pressure contour, while the contour on the plane section at mid-vane highlights local entropy generation. Additionally, the streamlines associated with the secondary flow are colored according to the local entropy generation computed following the procedure reported in Russo et al. [31], providing further insight into the flow dynamics and losses induced by the secondary structures. In Figure 16a, the migration of streamlines from the endwall towards the center of the channel, guided by the pressure field, is clearly evident. This behavior of the secondary flows is closely associated with regions of higher losses. The installation of fences on the suction side of the blade effectively limits the migration of streamlines, resulting in a more uniform flow downstream. However, in the areas where the secondary flows interact with the fences, increased entropy production occurs, contributing to a stronger peak in total pressure losses for the fenced blade compared to the clean blade, as shown in Figure 12. The effect of the fences on the axial vorticity field Ω x is illustrated in Figure 17. In the straight case, the migration of streamlines from the casing toward the center of the channel is associated with an increase in axial vorticity. A similar trend is observed in the fenced case; however, once the streamlines are channeled by the fence, they acquire opposite vorticity, resulting in a stronger region of negative vorticity in plane D2. On the side of the fence facing the casing, a region of positive vorticity develops, eventually forming the distinct positive vorticity region seen in plane D2, a feature absent in the straight case.
To conclude, the comparison between numerical and experimental results not only validated the computational tools employed but also confirmed the expected performance of the device. Both simulations and experiments demonstrated that the fences effectively reduce the distortion caused by secondary flows at the cascade exit, hence creating favorable conditions for the improved performance of downstream blade rows. Additionally, the analysis has provided valuable insights into the mechanisms responsible for mitigating secondary flow distortions, as well as the slight increase in losses observed in the fenced configuration. These findings are fully consistent with the results obtained in the stage environment, where the introduction of fences leads to an overall increase in stage efficiency of about 0.2 % , despite a small rise in NGV losses. Indeed, the numerical simulations conducted in a representative annular stage environment show that fences effectively mitigate flow non-uniformities at the NGV outlet (in line with the literature [18]), resulting in a less distorted inflow to the rotor and ultimately improving its efficiency. Although the detailed results of these calculations cannot be disclosed due to confidentiality constraints, their alignment with the experimental observations reinforces confidence in the beneficial effect of fences on overall engine performance.

6. Conclusions

In the present study, a novel fence design developed through a CFD-based optimization process aimed at mitigating secondary flows in an NGV cascade has been analyzed in-depth by both experimental and numerical investigations using low- and high-fidelity simulations. The cascade configuration, characterized by low aspect ratio, divergent meridional channel, and a reduced loading in proximity of the leading-edge of the profile promotes the formation of a strong passage vortex and a weak horseshoe vortex. Both experimental and numerical campaigns focused on comparing straight and fenced NGV cascades. The results showed that shelf-like fences, applied on the suction side of the NGV, significantly reduce the penetration of secondary flows along the blade passage, leading to improved flow uniformity at the cascade exit, despite a slight increase in NGV losses. The experimental results have also been adopted to validate numerical ones. Both RANS and LES successfully captured the trend of total pressure losses not only in the case of straight NGV, but also in the case with fences installed. However, from the C p t comparison, RANS resulted in losses being overestimated, while LES was shown to also be capable of providing an accurate estimate of losses, with differences from experimental results everywhere lower than 3%. On the other side, the angle distribution was well predicted by both RANS and LES. Moreover, LES enabled not only a thorough analysis of the flow development within the cascade, by the inspection of the streamlines, but also the evaluation of the losses within the whole stage, which resulted in a reduction of about 0.2% for the fenced cascade compared to the straight one. Thus, it can be concluded that fences applied on the blade suction side are capable of reducing secondary flow penetration with a consequent positive effect on both flow uniformity and overall stage losses.

Author Contributions

Conceptualization, V.B., D.P., F.S., L.D.V., and M.G. (Matteo Giovannini); methodology, V.B., D.P., F.S., L.D.V., and M.G. (Matteo Giovannini); software, V.B., D.P., L.D.V., and G.C.; validation, V.B., D.P., L.D.V., and G.C.; formal analysis, V.B., D.P., F.S., L.D.V., and M.G. (Matteo Giovannini); investigation, V.B., D.P., and L.D.V.; data curation, V.B., D.P., F.S., L.D.V., and M.G. (Matteo Giovannini); writing—original draft preparation, V.B., D.P., F.S., L.D.V., and M.G. (Matteo Giovannini); writing—review and editing, V.B., D.P., F.S., L.D.V., M.G. (Matteo Giovannini), M.G. (Monica Gily), and A.N.; visualization, V.B., D.P., F.S., L.D.V., M.G. (Matteo Giovannini), M.G. (Monica Gily), and A.N.; supervision, F.S., M.G. (Matteo Giovannini), M.G. (Monica Gily), and A.N.; project administration, F.S., M.G. (Matteo Giovannini), M.G. (Monica Gily), and A.N. All authors have read and agreed to the published version of the manuscript.

Funding

This research received no external funding.

Data Availability Statement

Restrictions apply to the availability of these data. Data were obtained from the collaboration between Unige, Morfo and Avio Aero and are available from the authors with the permission of all the parties.

Conflicts of Interest

Authors Luca De Vincentiis, Matteo Giovannini, and Gabriele Cattoli were employed by the company Morfo Design SRL. Authors Monica Gily and Andrea Notaristefano were employed by the company Avio Aero. The remaining authors declare that the research was conducted in the absence of any commercial or financial relationships that could be construed as a potential conflict of interest.

Abbreviations

AR                         Aspect Ratio
BCBoundary Condition
BLBoundary Layer
CFDComputational Fluid Dynamics
FTTFlow-Through Time
HPTHigh Pressure Turbine
HSVHorseshoe Vortex
IPTIntermediate Pressure Turbine
LELeading Edge
LESLarge Eddy Simulation
LPTLow Pressure Turbine
NGVNozzle Guide Vane
PSPressure Side
PVPassage Vortex
RANSReynolds-Averaged Navier–Stokes
SKESecondary Kinetic Energy
SSSuction Side
TETrailing Edge
TRLTechnology Readiness Level
2DTwo-Dimensional
3DThree-Dimensional

Nomenclature

AChannel area
cIsentropic flow velocity
CBlade chord
C p Blade loading = p t , 1 ¯ ¯ p ( x / C x ) q 2
C p t Total pressure loss coefficient = p t , 1 p t , 2 q 2
C p t m a x Maximum total pressure loss coefficient of the reference case (straight cascade
and R e x = 400,000 )
D 1 Inlet measuring domain
D 2 Outlet measuring domain
HBlade height
pPressure
q 2 Downstream isentropic dynamic pressure = ρ c 2 2 2
R e x                          Reynolds number = ρ C x c 2 μ
sBlade pitch
T u Free-stream turbulence intensity
uFlow velocity
yPitchwise direction
zSpanwise direction
Z w Zweifel number = 2 s C x · cos 2 ( α 2 ) · ( tan ( α 2 ) tan ( α 1 ) )
Greek symbols
α Yaw angle
α 2 , m i d Exit yaw angle at blade midspan of the reference case (straight
cascade and R e x = 400,000 )
β Pitch angle
Δ n + Mesh resolution along the blade surface normal direction
Δ s + Mesh resolution along the curvilinear abscissa
Δ z + Mesh resolution along the blade span
μ Dynamic viscosity
ρ Fluid density
σ Cascade solidity = C x s
Ω x Vorticity = × u x
θ Turning
ω Total loss coefficient
ω p Profile loss coefficient
ω s Secondary loss coefficient
Subscripts
m i d At midspan
tTotal
xAxial
1Inlet
2Outlet
Superscripts
· ¯ Pitchwise average
· ¯ ¯ Pitchwise and spanwise average

References

  1. Göttlich, E. Research on the aerodynamics of intermediate turbine diffusers. Prog. Aerosp. Sci. 2011, 47, 249–279. [Google Scholar] [CrossRef]
  2. Norris, G.; Dominy, R.G.; Smith, A.D. Strut Influences Within a Diffusing Annular S-Shaped Duct; American Society of Mechanical Engineers: New York, NY, USA, 1998. [Google Scholar]
  3. Simon, P.; Andreas, P.; Albéniz, G.D.; Lucas, M.; Adrian, L.P.; Franz, H.; Andreas, M. The impact of inlet flow angle on turbine vane frame aerodynamic performance. In Proceedings of the ASME Turbo Expo: Power for Land, Sea, and Air, Rotterdam, The Netherlands, 13–17 June 2022; American Society of Mechanical Engineers: New York, NY, USA, 2022; Volume 86113. Paper No. V10CT33A001. [Google Scholar]
  4. Langston, L.S. Secondary flows in axial turbines—A review. Ann. N. Y. Acad. Sci. 2001, 934, 11–26. [Google Scholar] [CrossRef] [PubMed]
  5. Vinuesa, R.; Schlatter, P.; Nagib, H.M. Secondary flow in turbulent ducts with increasing aspect ratio. Phys. Rev. Fluids 2018, 3, 054606. [Google Scholar] [CrossRef]
  6. Wegener, D.; Quest, J.; Hoffmann, W. Secondary Flow in a Turbine Guide Vane with Low Aspect Ratio. Secondary Flows in Turbomachines. 1990; AGARD, SessionII-9-1. Available online: https://apps.dtic.mil/sti/tr/pdf/ADA220901.pdf (accessed on 20 June 2025).
  7. Bons, J.; Benton, S.; Bernardini, C.; Bloxham, M. Active flow control for low-pressure turbines. AIAA J. 2018, 56, 2687–2698. [Google Scholar] [CrossRef]
  8. Sullerey, R.K.; Pradeep, A.M. Secondary flow control using vortex generator jets. J. Fluids Eng. 2004, 126, 650–657. [Google Scholar] [CrossRef]
  9. Khan, Z.U.; Johnston, J.P. On vortex generating jets. Int. J. Heat Fluid Flow 2000, 21, 506–511. [Google Scholar] [CrossRef]
  10. Romero, S.; Gross, A. Numerical investigation of active flow control of low-pressure turbine endwall flow. J. Propuls. Power 2019, 35, 883–895. [Google Scholar] [CrossRef]
  11. Qu, X.; Li, L.; Zhang, Y.; Lu, X.; Zhu, J.; Zhang, Y. Controlling secondary flow in high-lift low-pressure turbine using boundary-layer slot suction. Chin. J. Aeronaut. 2024, 37, 21–33. [Google Scholar] [CrossRef]
  12. Volino, R.J. Passive flow control on low-pressure turbine airfoils. J. Turbomach. 2003, 125, 754–764. [Google Scholar] [CrossRef]
  13. Clark, C.J.; Pullan, G.; Curtis, E.; Goenaga, F. Secondary flow control in low aspect ratio vanes using splitters. J. Turbomach. 2017, 139, 091003. [Google Scholar] [CrossRef]
  14. Mingardo, G.; Kusano, K.; Pini, M.; Lettieri, C.; Kawata, Y. Secondary flow mitigation in turbine vanes using endwall fence optimization. In Proceedings of the Montreal 2018 Global Power and Propulsion Forum, Montreal, QC, Canada, 7–9 May 2018. GPPS-NA-2018-0058. [Google Scholar]
  15. Yuan, H.; Wu, Y.; Zhou, S.; Wang, M.; Lu, X.; Zhang, Y. Nonuniform height endwall fence optimization of a low-pressure turbine cascade. Int. J. Mech. Sci. 2023, 250, 108301. [Google Scholar] [CrossRef]
  16. Dossena, V.; Perdichizzi, A.; Savini, M. The Influence of Endwall Contouring on the Performance of a Turbine Nozzle Guide Vane; American Society of Mechanical Engineers: New York, NY, USA, 1999; Paper No. 99-GT-72; Volume 78620, p. V001T01A022. [Google Scholar]
  17. Kawai, T. Effect of combined boundary layer fences on turbine secondary flow and losses. JSME Int. J. Ser. B Fluids Therm. Eng. 1994, 37, 377–384. [Google Scholar] [CrossRef]
  18. Rubechini, F.; Giovannini, M.; Arnone, A.; Simoni, D.; Bertini, F. Reducing secondary flow losses in low-pressure turbines with blade fences: Part I—Design in an engine-like environment. In ASME Turbo Expo; American Society of Mechanical Engineers: New York, NY, USA, 2019; p. V02BT40A020. [Google Scholar] [CrossRef]
  19. Giovannini, M.; Rubechini, F.; Amato, G.; Arnone, A.; Simoni, D.; Yepmo, V.; Satta, F.; Bertini, F. Reducing secondary flow losses in low-pressure turbines with blade fences: Part II—Experimental validation on linear cascades. In Turbo Expo: Power for Land, Sea, and Air; American Society of Mechanical Engineers: New York, NY, USA, 2019; Volume 58561, p. V02BT40A021. [Google Scholar]
  20. Prümper, H. Application of boundary layer fences in turbomachinery. VDI-Berichte 1972, 311, 311–331. [Google Scholar]
  21. Kawai, T.; Adachi, T. Effects of blade boundary layer fences on secondary flow and losses in a turbine cascade. Nippon Kikai Gakkai Ronbunshu B Hen 1988, 54, 2484–2491. [Google Scholar] [CrossRef]
  22. Infantino, D.; Satta, F.; Simoni, D.; Ubaldi, M.; Zunino, P.; Bertini, F. Phase-locked investigation of secondary flows perturbed by passing wakes in a high-lift LPT turbine cascade. In ASME Turbo Expo; American Society of Mechanical Engineers: New York, NY, USA, 2015; p. V02CT44A008. [Google Scholar] [CrossRef]
  23. Bologna, V.; Petronio, D.; Satta, F.; De Vincentiis, L.; Giovannini, M.; Cattoli, G.; Gily, M.; Notaristefano, A. Experimental and Numerical Investigation of Suction-Side Fences for Turbine NGVs. In Proceedings of the 16th European Turbomachinery Conference, Hannover, Germany, 24–28 March 2025. Paper No. ETC2025-213. [Google Scholar]
  24. Satta, F.; Simoni, D.; Ubaldi, M.; Zunino, P.; Bertini, F. Profile and secondary flow losses in a high-lift LPT blade cascade at different Reynolds numbers under steady and unsteady inflow conditions. J. Therm. Sci. 2012, 21, 483–491. [Google Scholar] [CrossRef]
  25. Nicoud, F.; Ducros, F. Subgrid-scale stress modelling based on the square of the velocity gradient tensor. Flow Turbul. Combust. 1999, 62, 183–200. [Google Scholar] [CrossRef]
  26. Jarrin, N.; Benhamadouche, S.; Laurence, D.; Prosser, R. A synthetic-eddy-method for generating inflow conditions for large-eddy simulations. Int. J. Heat Fluid Flow 2006, 27, 585–593. [Google Scholar] [CrossRef]
  27. Bologna, V.; Paliotta, P.; Petronio, D.; Satta, F.; Simoni, D.; Giovannini, M.; Paccati, S.; De Vincentiis, L.; Gily, M. Detailed characterization of turbulence intensity and dissipation as boundary condition for 3D RANS simulations. In ASME Turbo Expo; American Society of Mechanical Engineers: New York, NY, USA, 2024; p. V12CT32A044. [Google Scholar] [CrossRef]
  28. Bergmann, M.; Morsbach, C.; Ashcroft, G.; Kügeler, E. Statistical error estimation methods for engineering-relevant quantities from scale-resolving simulations. J. Turbomach. 2021, 144, 031005. [Google Scholar] [CrossRef]
  29. Giovannini, M.; Rubechini, F.; Marconcini, M.; Simoni, D.; Yepmo, V.; Bertini, F. Secondary flows in low-pressure turbines cascades: Numerical and experimental investigation of the impact of the inner part of the boundary layer. J. Turbomach. 2018, 140, 111002. [Google Scholar] [CrossRef]
  30. Eckerle, W.A.; Awad, J.K. Effect of freestream velocity on the three-dimensional separated flow region in front of a cylinder. J. Fluids Eng. 1991, 113, 37–44. [Google Scholar] [CrossRef]
  31. Russo, M.; Carlucci, A.; Dellacasagr, M.; Petronio, D.; Lengani, D.; Simoni, D.; Bellucci, J.; Giovannini, M.; Granata, A.A.; Gily, M.; et al. Optimization of low-pressure turbine blade by means of fine inspection of loss production mechanisms. In ASME Turbo Expo; American Society of Mechanical Engineers: New York, NY, USA, 2024; p. V12DT36A023. [Google Scholar] [CrossRef]
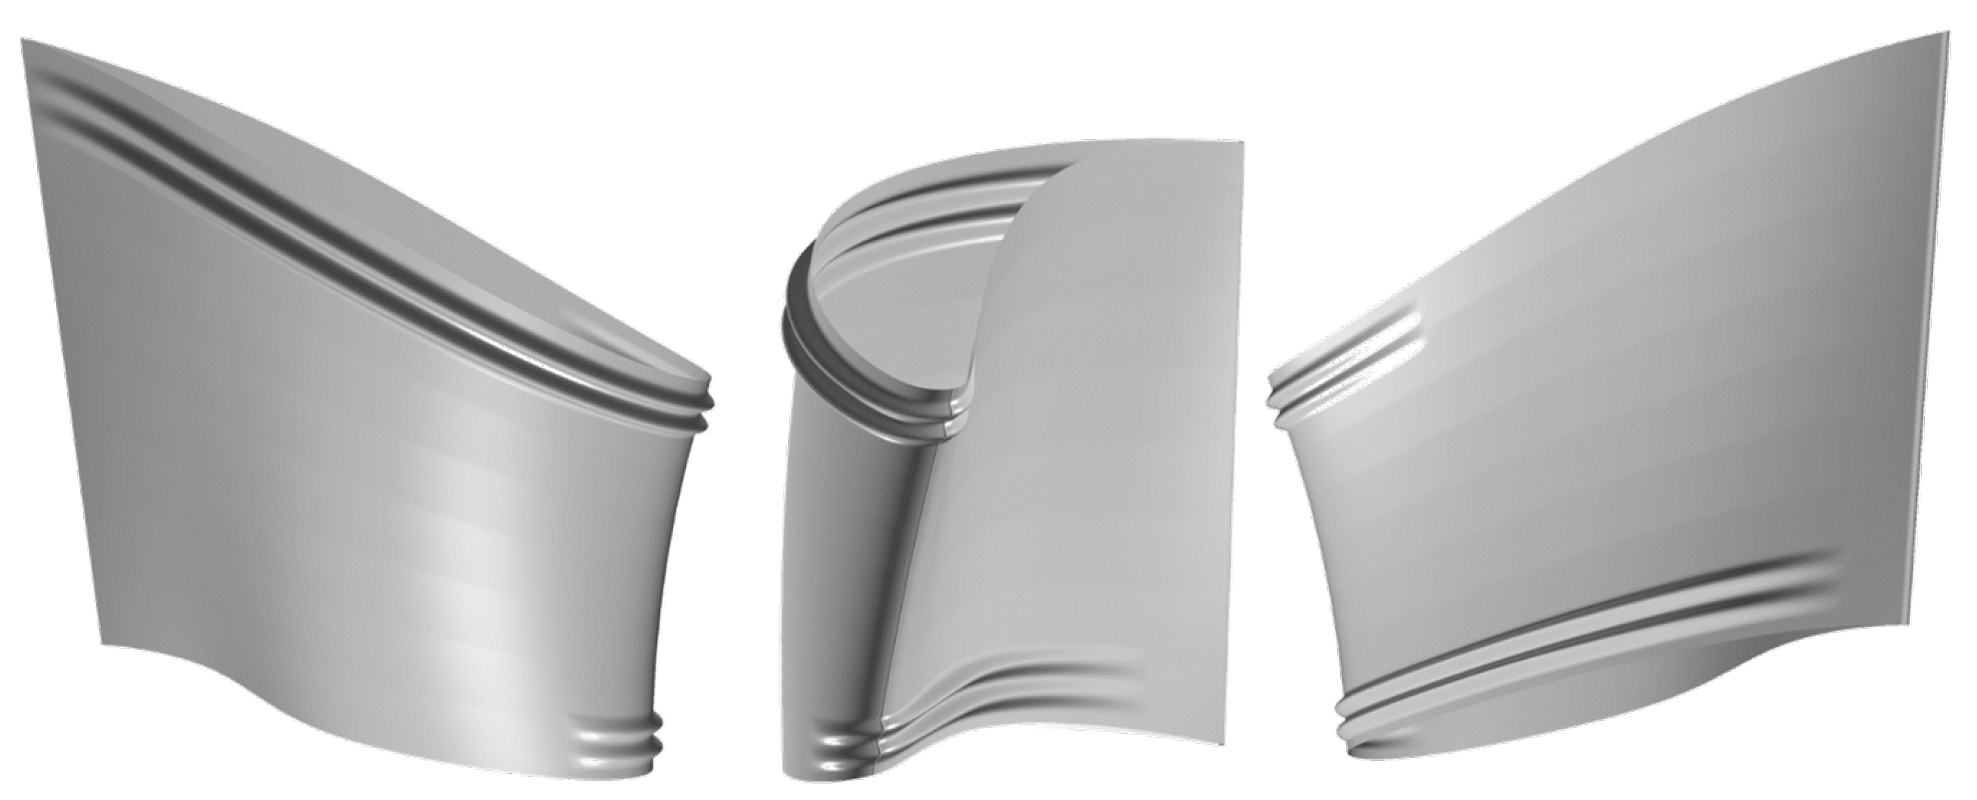
Figure 1. Example of blade fences in a 3D annular NGV.
Ijtpp 10 00031 g001
Figure 2. Sketch of the (a) top and (b) meridional views of the experimental setup.
Ijtpp 10 00031 g002
Figure 3. Photos of the (a) straight and (b) fenced cascades, and a close-up view of the fences (c).
Ijtpp 10 00031 g003
Figure 4. Non-dimensional mesh resolution along the blade surface at midspan. (a) Streamwise direction. (b) Wall-normal direction.
Ijtpp 10 00031 g004
Figure 5. (a) Normalized exit flow angle computed for different average times and estimation of convergence error. Sub-figure (b) provides a zoomed-in view to better highlight the distributions.
Ijtpp 10 00031 g005aIjtpp 10 00031 g005b
Figure 6. Spanwise distributions of the pitchwise-averaged inlet total pressure for straight and fenced cascades.
Ijtpp 10 00031 g006
Figure 7. Blade loadings of straight and fenced cascades.
Ijtpp 10 00031 g007
Figure 8. Distributions of the total pressure coefficient C p t for straight (a) and fenced (b) cascades at R e x = 400,000.
Ijtpp 10 00031 g008aIjtpp 10 00031 g008b
Figure 9. Distributions of the total pressure coefficient C p t for (a) straight and (b) fenced cascades at R e x = 700,000.
Ijtpp 10 00031 g009
Figure 10. Spanwise distributions of the pitchwise-averaged total pressure coefficient C p t ¯ for straight and fenced configurations at the two Reynolds numbers tested.
Ijtpp 10 00031 g010
Figure 11. Spanwise distributions of the normalized yaw angle at the cascade outlet α 2 for straight and fenced configurations at the two Reynolds numbers tested.
Ijtpp 10 00031 g011
Figure 12. Experimental and numerical spanwise distributions of the normalized total pressure coefficient C p t ¯ for straight and fenced cascade configurations.
Ijtpp 10 00031 g012
Figure 13. Experimental and numerical spanwise distributions of the normalized yaw angle at the cascade outlet α 2 for straight and fenced cascade configurations.
Ijtpp 10 00031 g013
Figure 14. Skin friction coefficient at blade midspan for the straight geometry: comparison between RANS and LES results.
Ijtpp 10 00031 g014
Figure 15. (a) Streamlines and contour of pressure on blade suction side and endwall. (b) Streamlines close to blade LE and on endwall and blade surfaces. (c) C p t contour on plane D2.
Ijtpp 10 00031 g015
Figure 16. Contour of pressure on endwall and blade suction side. Contour of C p t on plane D2. Contour of local entropy generation on plane at x / C x = 0.6 . Streamlines are colored with local entropy generation: (a) Straight blade; (b) Fenced blade.
Ijtpp 10 00031 g016
Figure 17. Contour of axial vorticity on plane D2 and on plane at x / C x = 0.6 with streamlines colored with axial vorticity. (a) Straight blade. (b) Fenced blade.
Ijtpp 10 00031 g017
Table 1. Profile ( ω p ), secondary ( ω s ), and total ( ω ) loss coefficients for straight and fenced cascades at the two Reynolds numbers tested.
R e x 400,000700,000
Cascadestraightfencedstraightfenced
ω p   [ % ] 49494545
ω s   [ % ] 51564651
ω   [ % ] 1001059196
Disclaimer/Publisher’s Note: The statements, opinions and data contained in all publications are solely those of the individual author(s) and contributor(s) and not of MDPI and/or the editor(s). MDPI and/or the editor(s) disclaim responsibility for any injury to people or property resulting from any ideas, methods, instructions or products referred to in the content.