1. Introduction
In the field of aerodynamics and turbomachinery, understanding the various types of instabilities that occur in fans and compressors is crucial. Flutter [
1] and non-synchronous vibration (NSV) [
2], rotating stall [
3], and forced response [
4] are of particular importance. These phenomena significantly limit the operating range of such machines and thus must be thoroughly understood to ensure safe and efficient operation. In experiments with isolated components, safety-critical conditions are investigated, requiring exact surveillance of vibration amplitudes. The present study focuses on the challenge associated with the quantification of vibration amplitudes and compares different measurement systems used for the investigation of the open-test case fan ECL5 [
5].
The typical procedure for aeroelastic experiments comprises material qualification, instrumentation calibration on rotating as well as online and post-processing of measurement data. Best practices are established in industry and academia [
6,
7,
8]. The ideal procedure is as follows:
In an initial step, materials and fabrication processes are qualified, followed by HCF (high cycle fatigue) testing to determine the operational limits [
9,
10]. For carbon-fibre composites, this process typically involves subjecting a representative test piece to a high number of oscillations at varying amplitudes, followed by a subsequent stiffness analysis. For the studied case the operational limit is defined when there is a 5% loss in eigenfrequency after
oscillations.
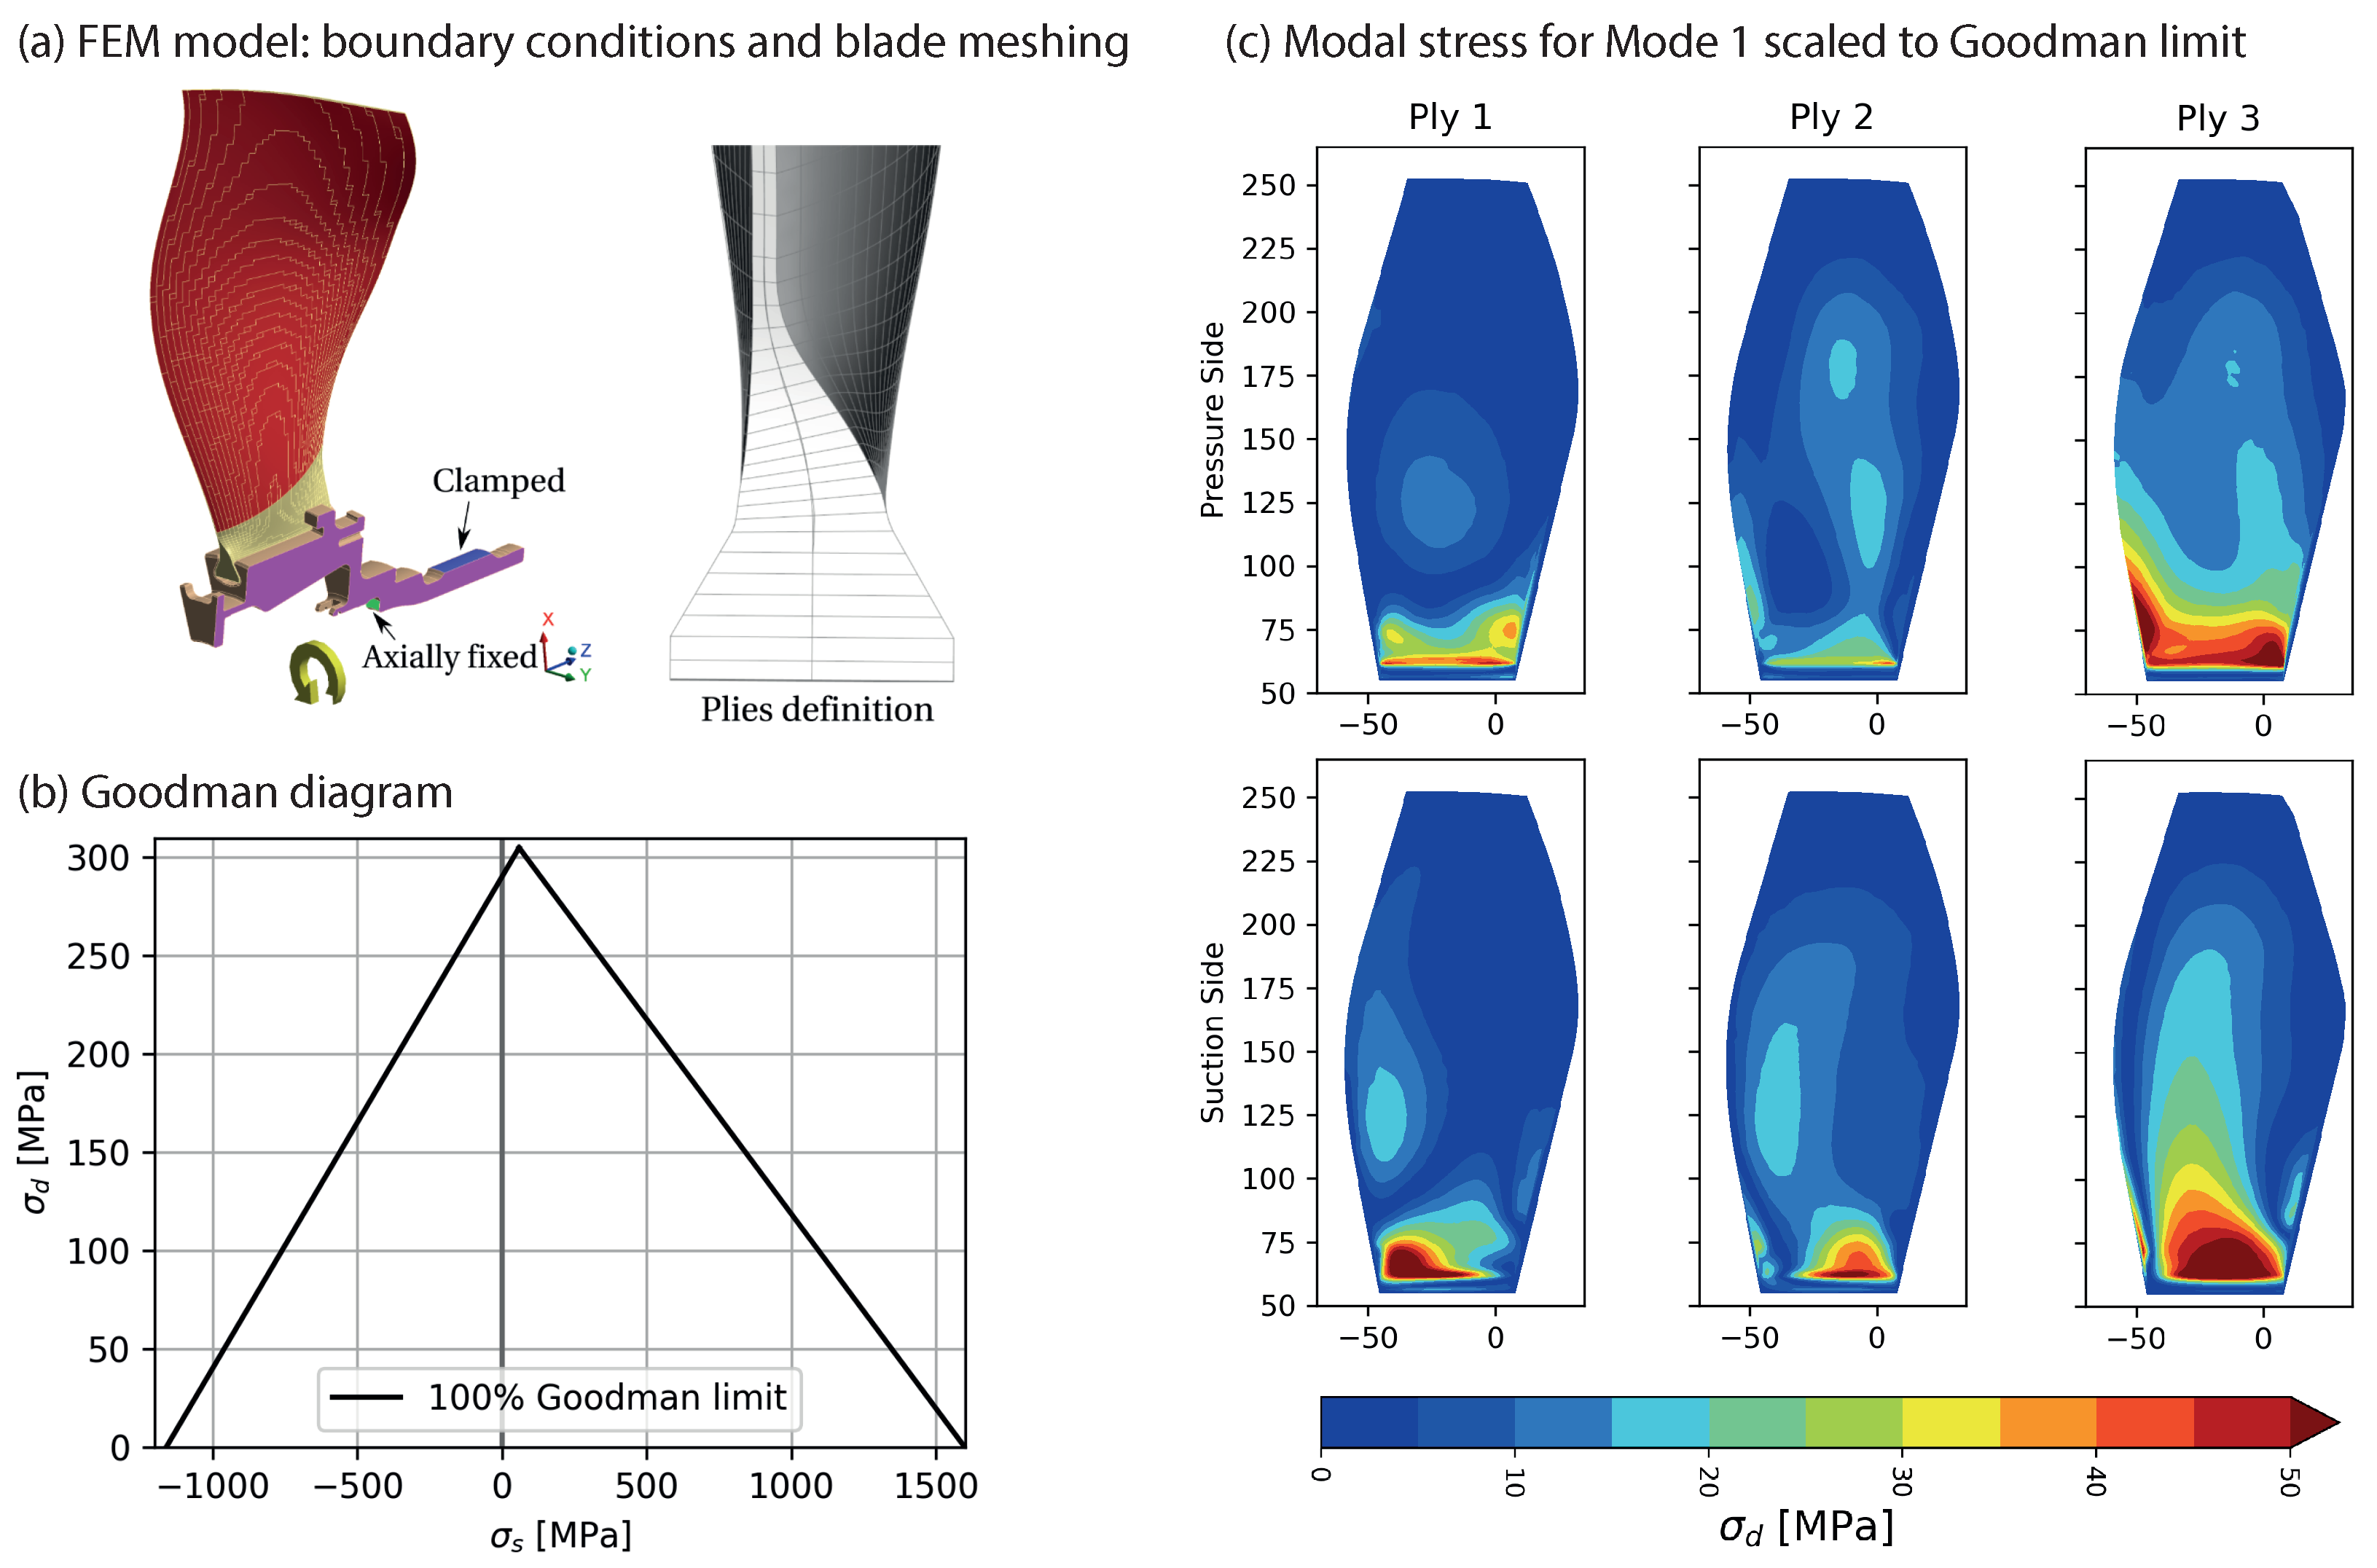
Finite element method (FEM) simulations of the test case are conducted to determine mode shapes and frequencies, depending on the assembly pattern (Nodal Diameter ). Based on these simulations the relationship between modal deflection, strain and stress is derived, yielding Goodman scope limits for different rotation speeds and optimal instrumentation positions.
The test case is instrumented with a focus on a high resolution of the assumed critical vibration modes. All instrumentation is calibrated and evaluation procedures validated for relevant test conditions.
During the experiment, online surveillance of time-resolving instrumentation is conducted and results compared to allowable HCF amplitudes (scope limits) considering safety factors. During post-processing, detailed decomposition into assembly modes, mistuning analysis, and determination of aerodamping is conducted.
While the above procedure seems straightforward and reasonable, the reality of aeroelastic testing deviates. The two main issues are a general lack of instrumentation due to accessibility or cost as well as inaccurate calibration. Both points are typically more important than issues related to the resolution of modern acquisition systems. In the worst-case scenario, costly experiments may be performed with inadequate structural instrumentation because aeroelastic considerations were not prioritized until a vibration issue arose.
As will be shown in this paper, which is an extension of our conference paper [
11], it is possible to obtain highly resolved and accurate data with different systems, if thorough procedures are considered. Through comprehensive analysis using complementary systems, additional information on aeroelastic mechanisms can be derived, as will be shown in the example of a non-synchronous vibration phenomenon that is relevant for different architectures.
The vibration analysis systems included (1) strain gauges via telemetry on all blades, (2) tip timing, using axially and circumferentially distributed capacitive sensors in the fan casing, and (3) a high-speed camera mounted upstream on the machine axis to measure circumferential tip deflection. The instrumentation is completed by time resolving pressure measurements in the casing to determine aerodynamic characteristics.
All components were calibrated and synchronized, and the results represent the first comparative analysis on an open-test-case, available to the community.
2. Test Case
The investigated open-test-case fan stage (ECL5) was designed by the Turbomachinery Department of Centrale Lyon and is representative of a modern low-speed engine; it has 16 carbon-fibre rotor blades and 31 aluminum OGVs. Details of the design process are provided by [
5].
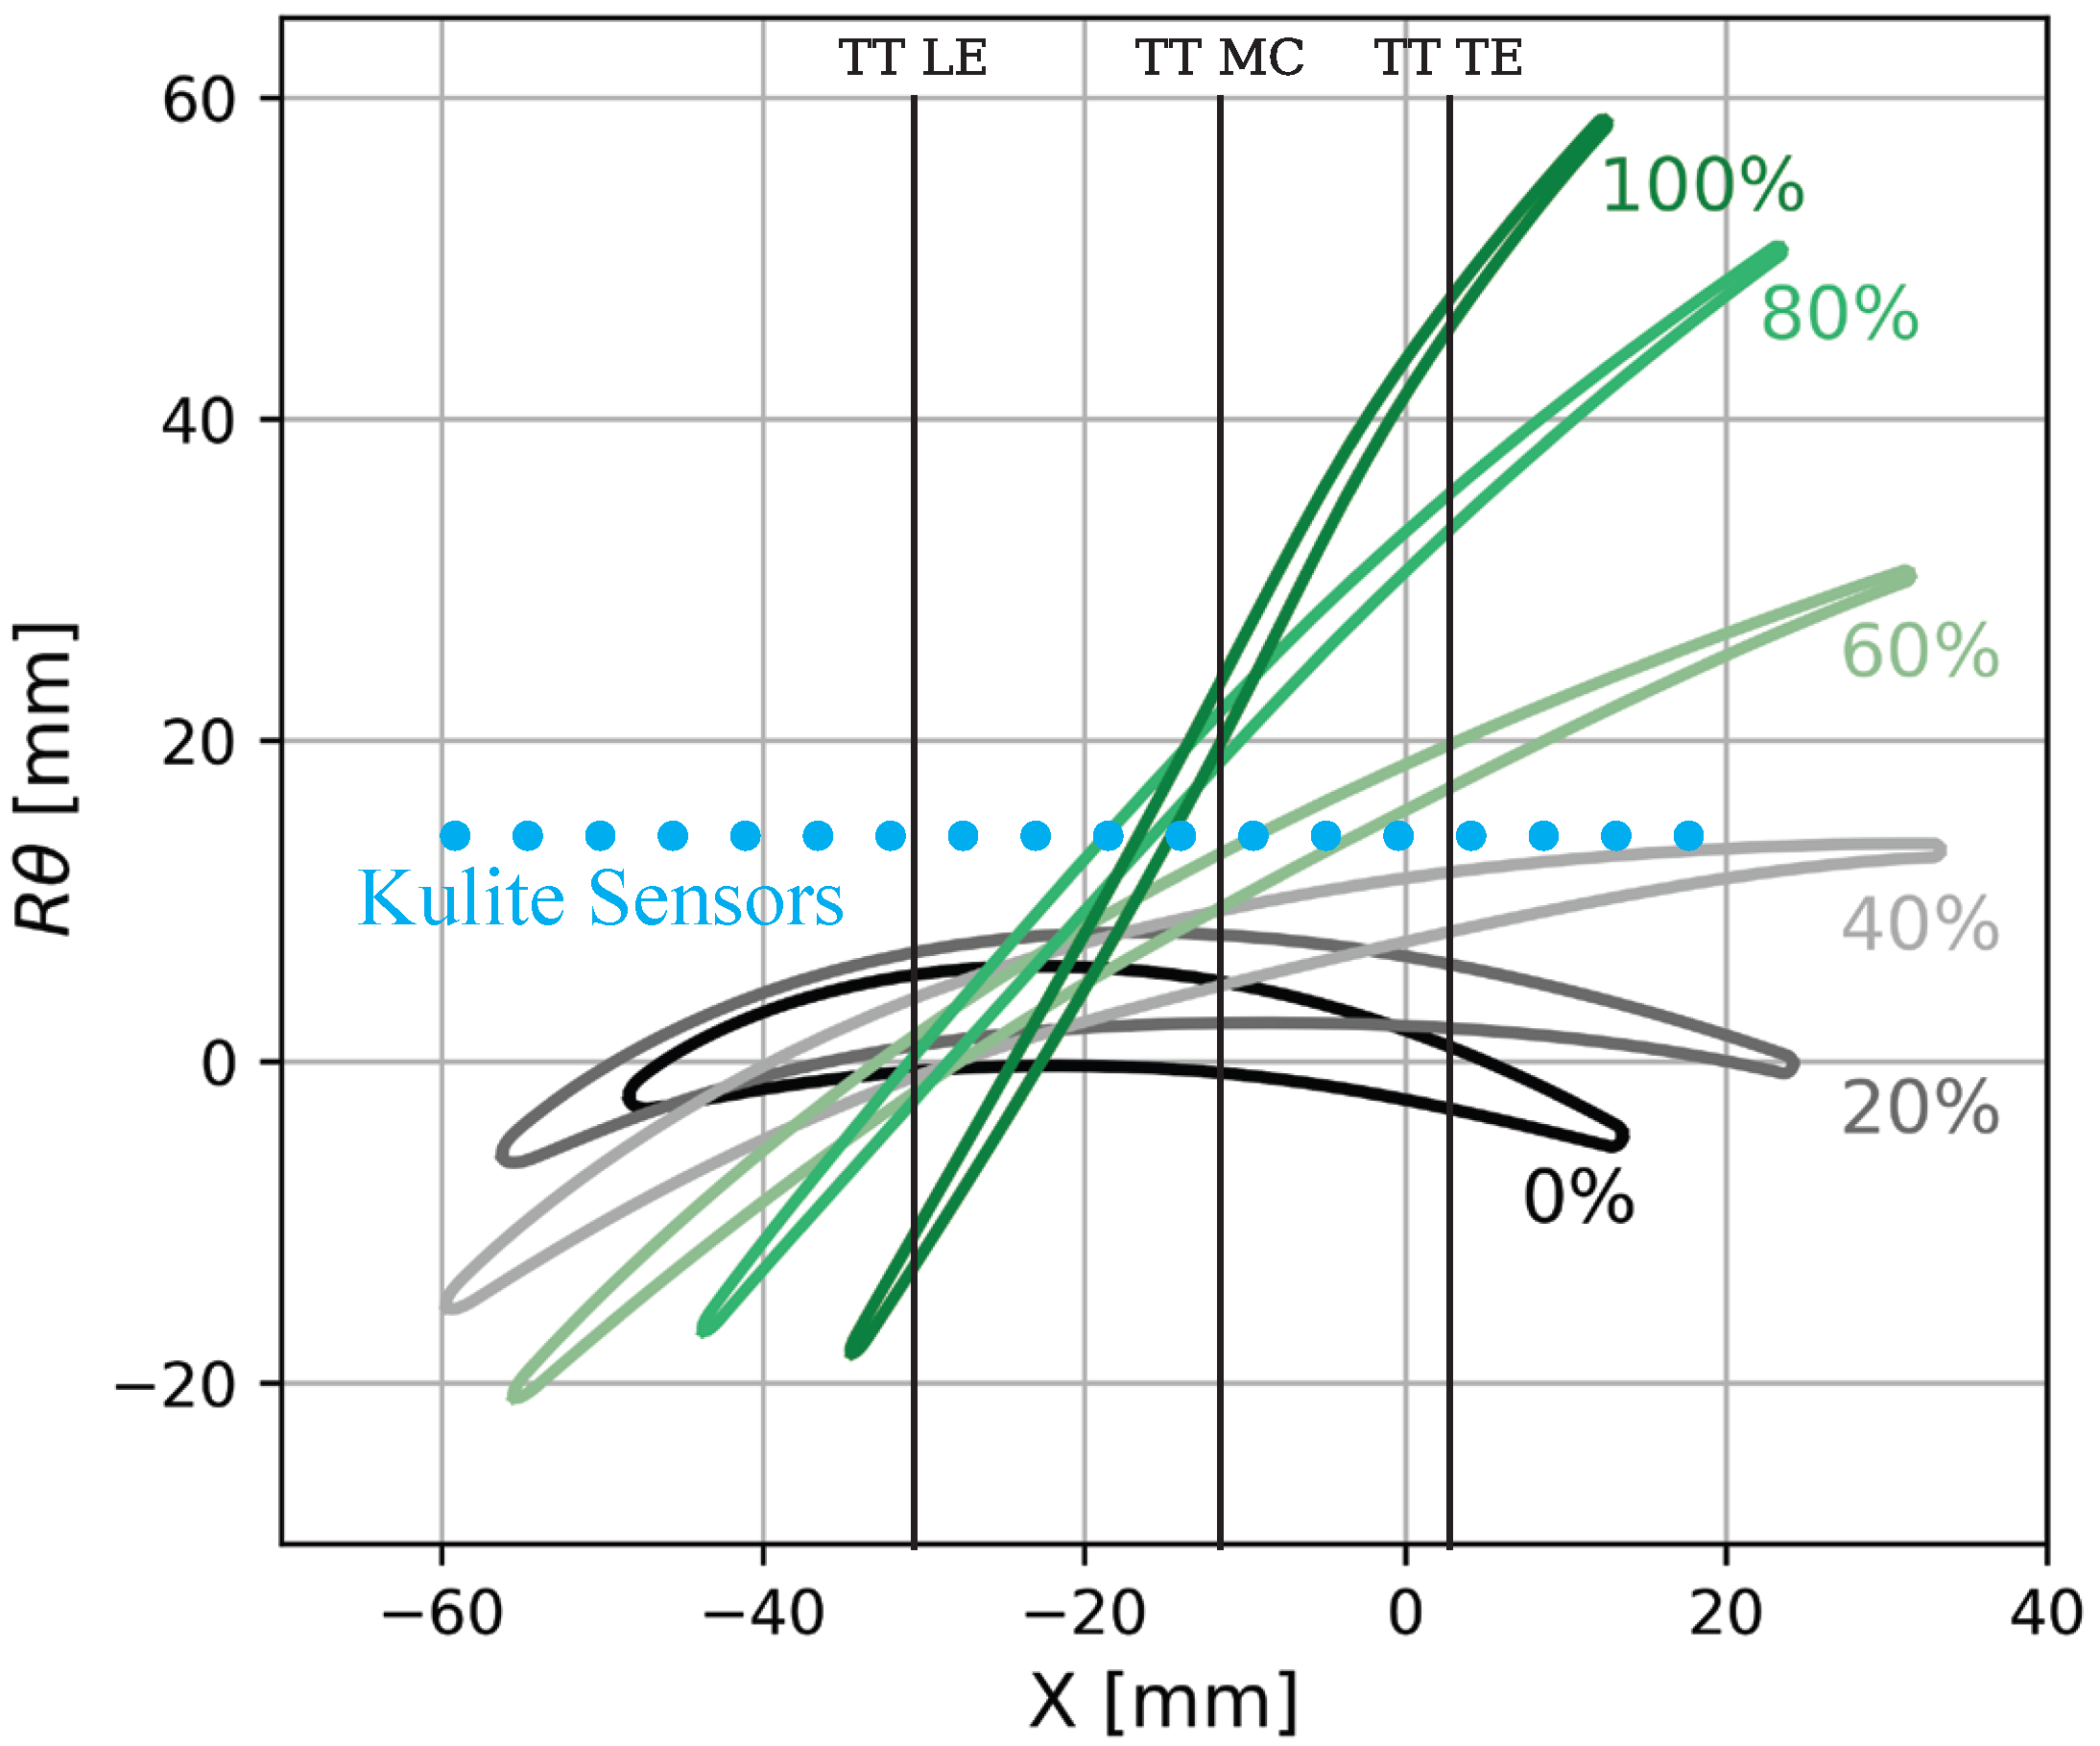
Figure 1 shows the fan blade profiles at different passage heights, highlighting the transonic design at the rotor tip. The aerodynamic design point targets a standard mass flow rate of 36.0 kg/s at 11,000 rpm with a relative tip Mach number of 1. Under these design conditions, the fan stage achieves a total pressure ratio of 1.35 and an isentropic efficiency of 92%.
A total of 48 blades were manufactured and inspected using a 3D scanner. Blade specific eigenmodes were identified with ping tests. This post-fabrication process determined their individual static moment, mass, and length, enabling a selection to build different rotor configurations. Three rotors were assembled and experimentally tested within the European project CATANA, as presented in
Table 1.
The reference configuration (CATREF) was designed with the goal of building a structurally tuned rotor. The aerodynamic performance and aeroelastic stability are reported in [
12,
13]. To quantify the sensitivity of the aeroelastic stability limit to intentional structural mistuning, a mistuning pattern among the available blades was determined using a reduced-order model developed by [
14], resulting in the mistuned configuration (CATMIS). A third rotor configuration based on CATMIS, with increased tip clearance on three distinct blades (CATSRT), was assembled and tested to investigate the influence of individual blade tip clearance. The selection pattern of the CATMIS assembly and the experimental investigation of both rotors are provided by [
15]. The present paper focuses on the results of the structurally mistuned rotor CATMIS.
The stage was experimentally tested at the Phare-2 test facility at Ecole Centrale de Lyon, which is operated by an electric motor with a maximum power of 3 MW [
12].
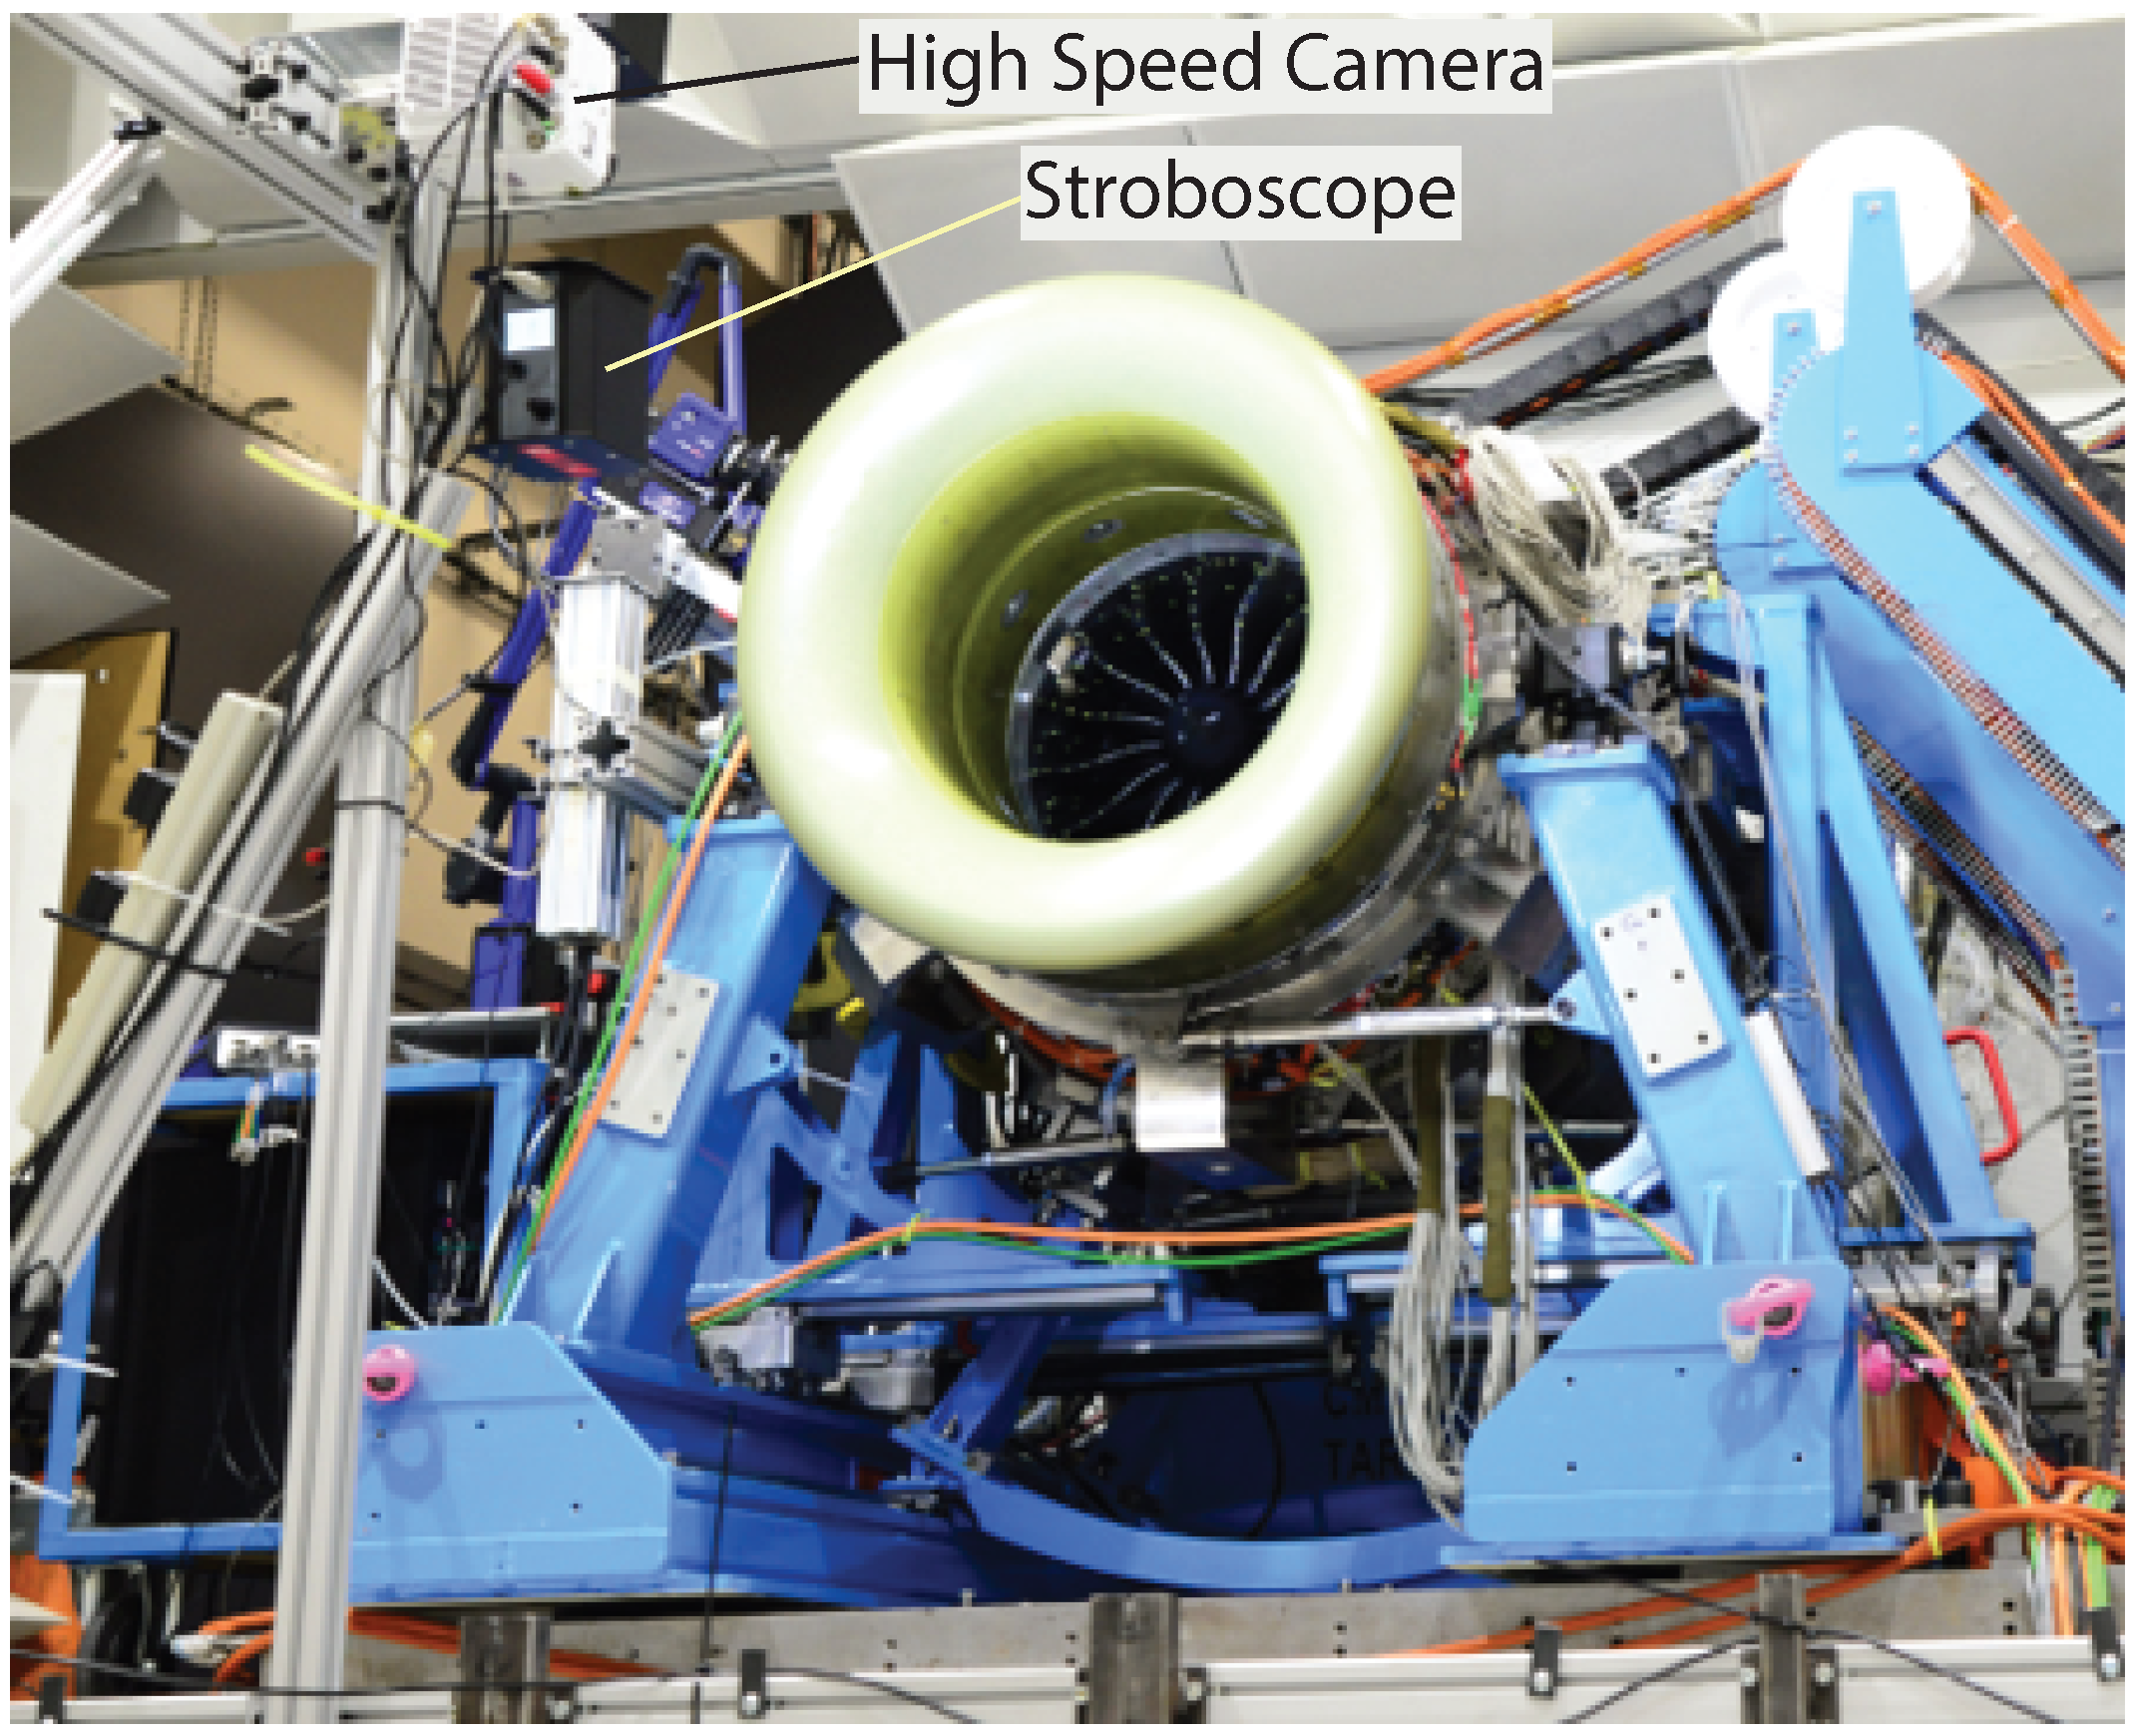
Figure 2 shows the test rig in the anechoic chamber. A comprehensive description of the instrumentation used is provided by [
16]. The operating range at transonic speedlines between 100% and 105% was limited by the onset of rotating stall at a lower mass flow rate. At all subsonic speedlines, the emergence of non-synchronous vibration (NSV) was observed with the reduction in mass flow rate. At all speedlines, experiments were aborted when strain gauge values reached 50% of the Goodman scope limit.
4. Instrumentation Design
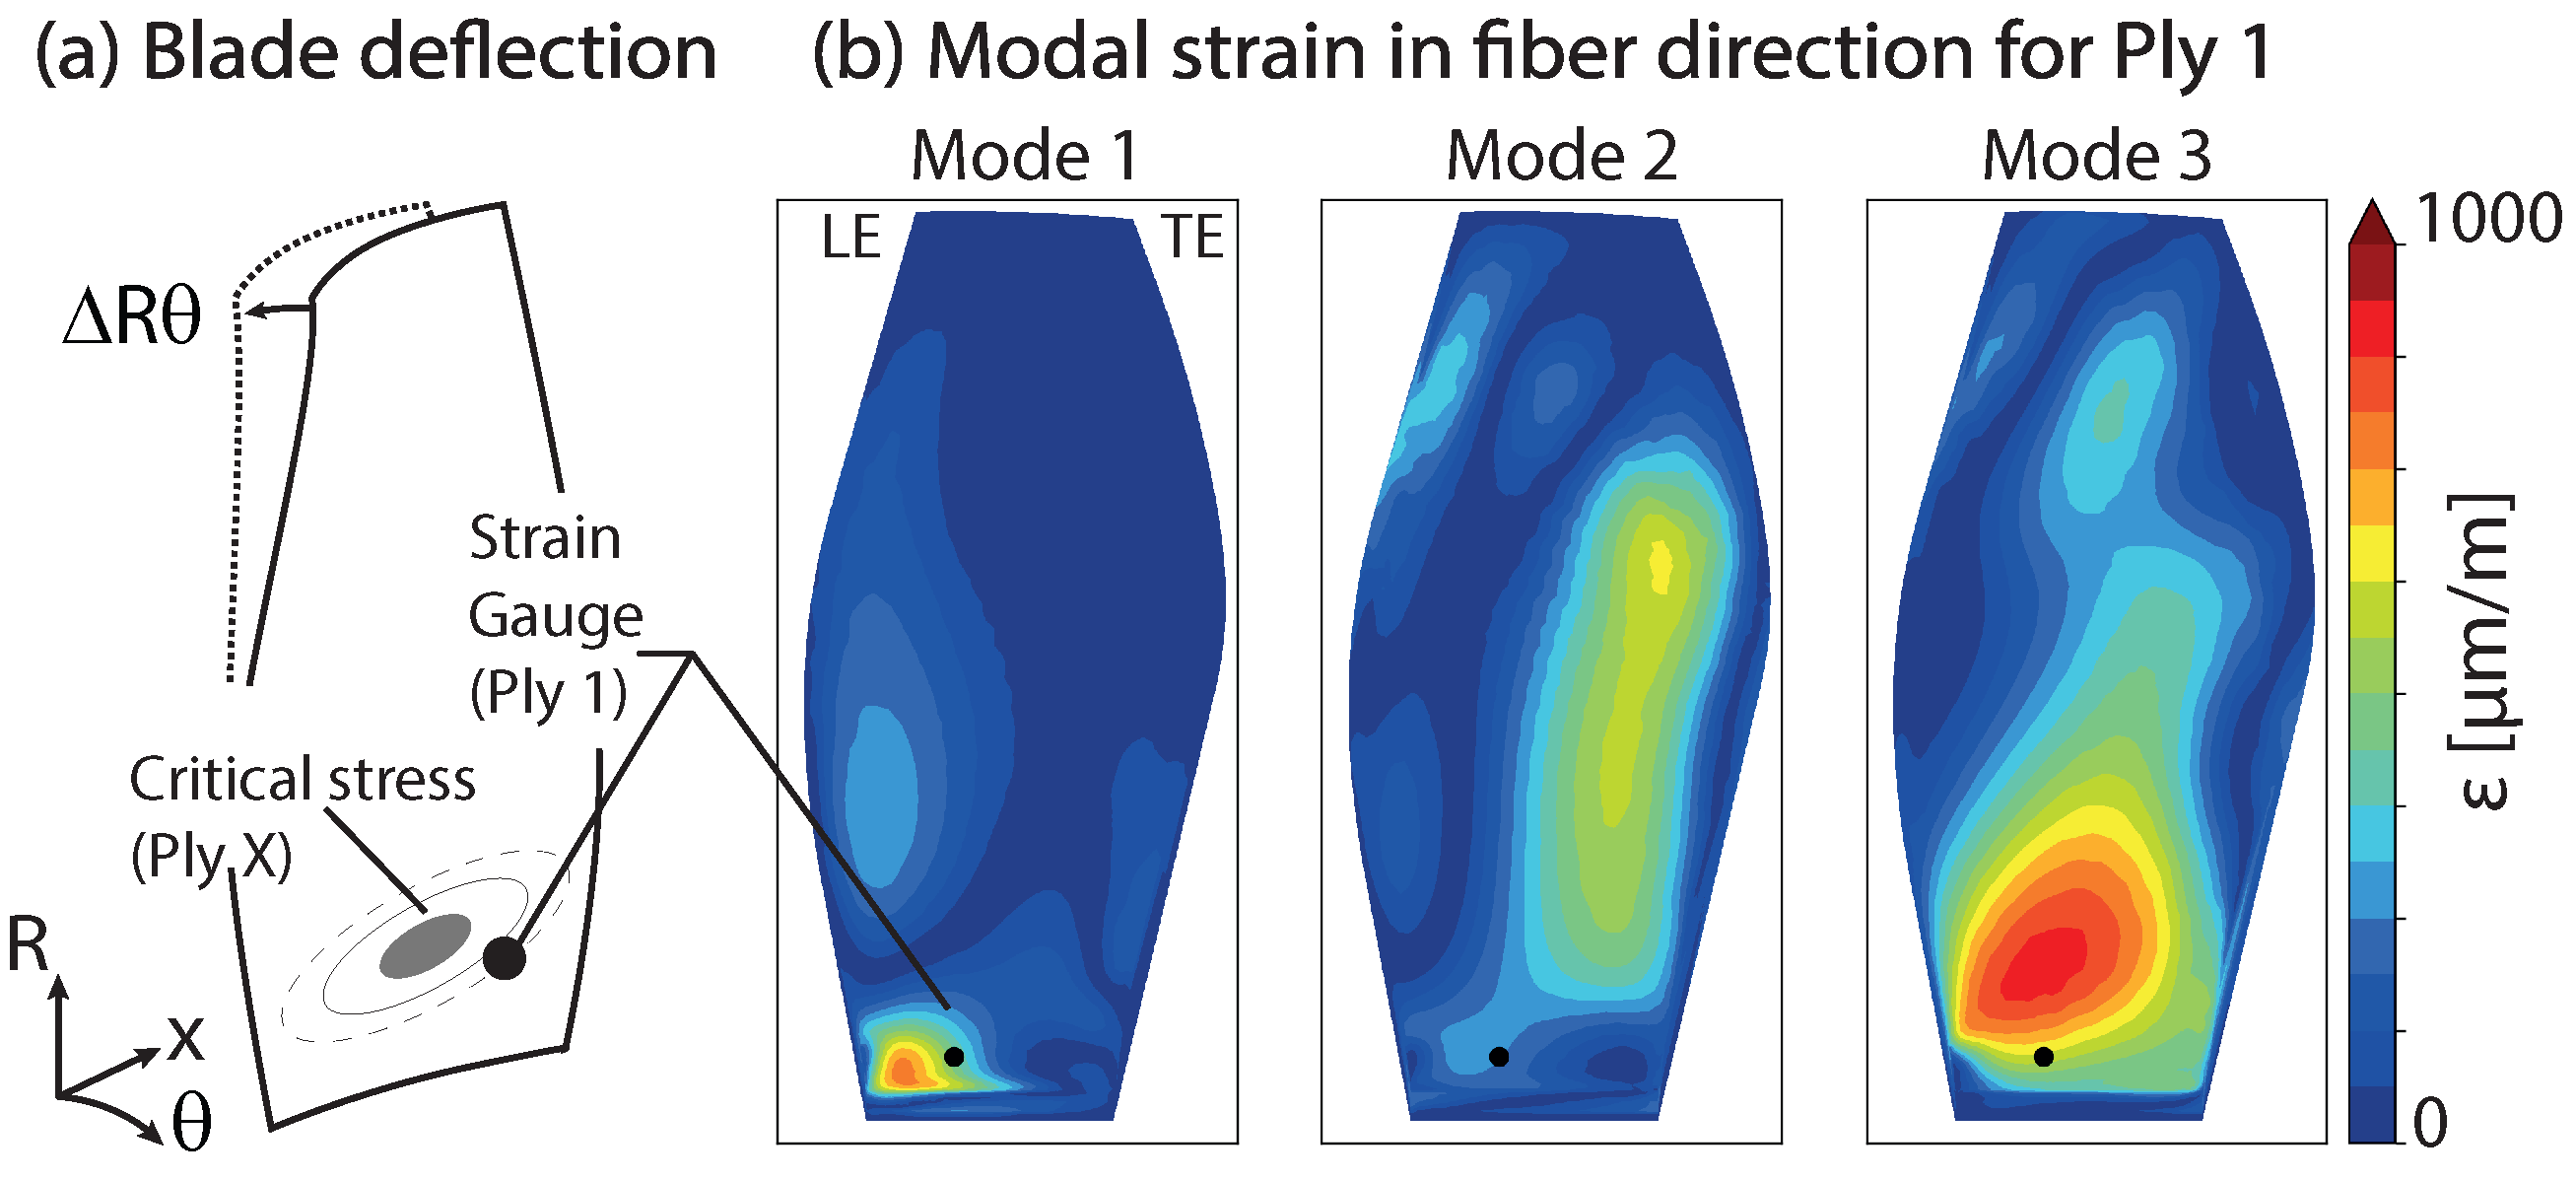
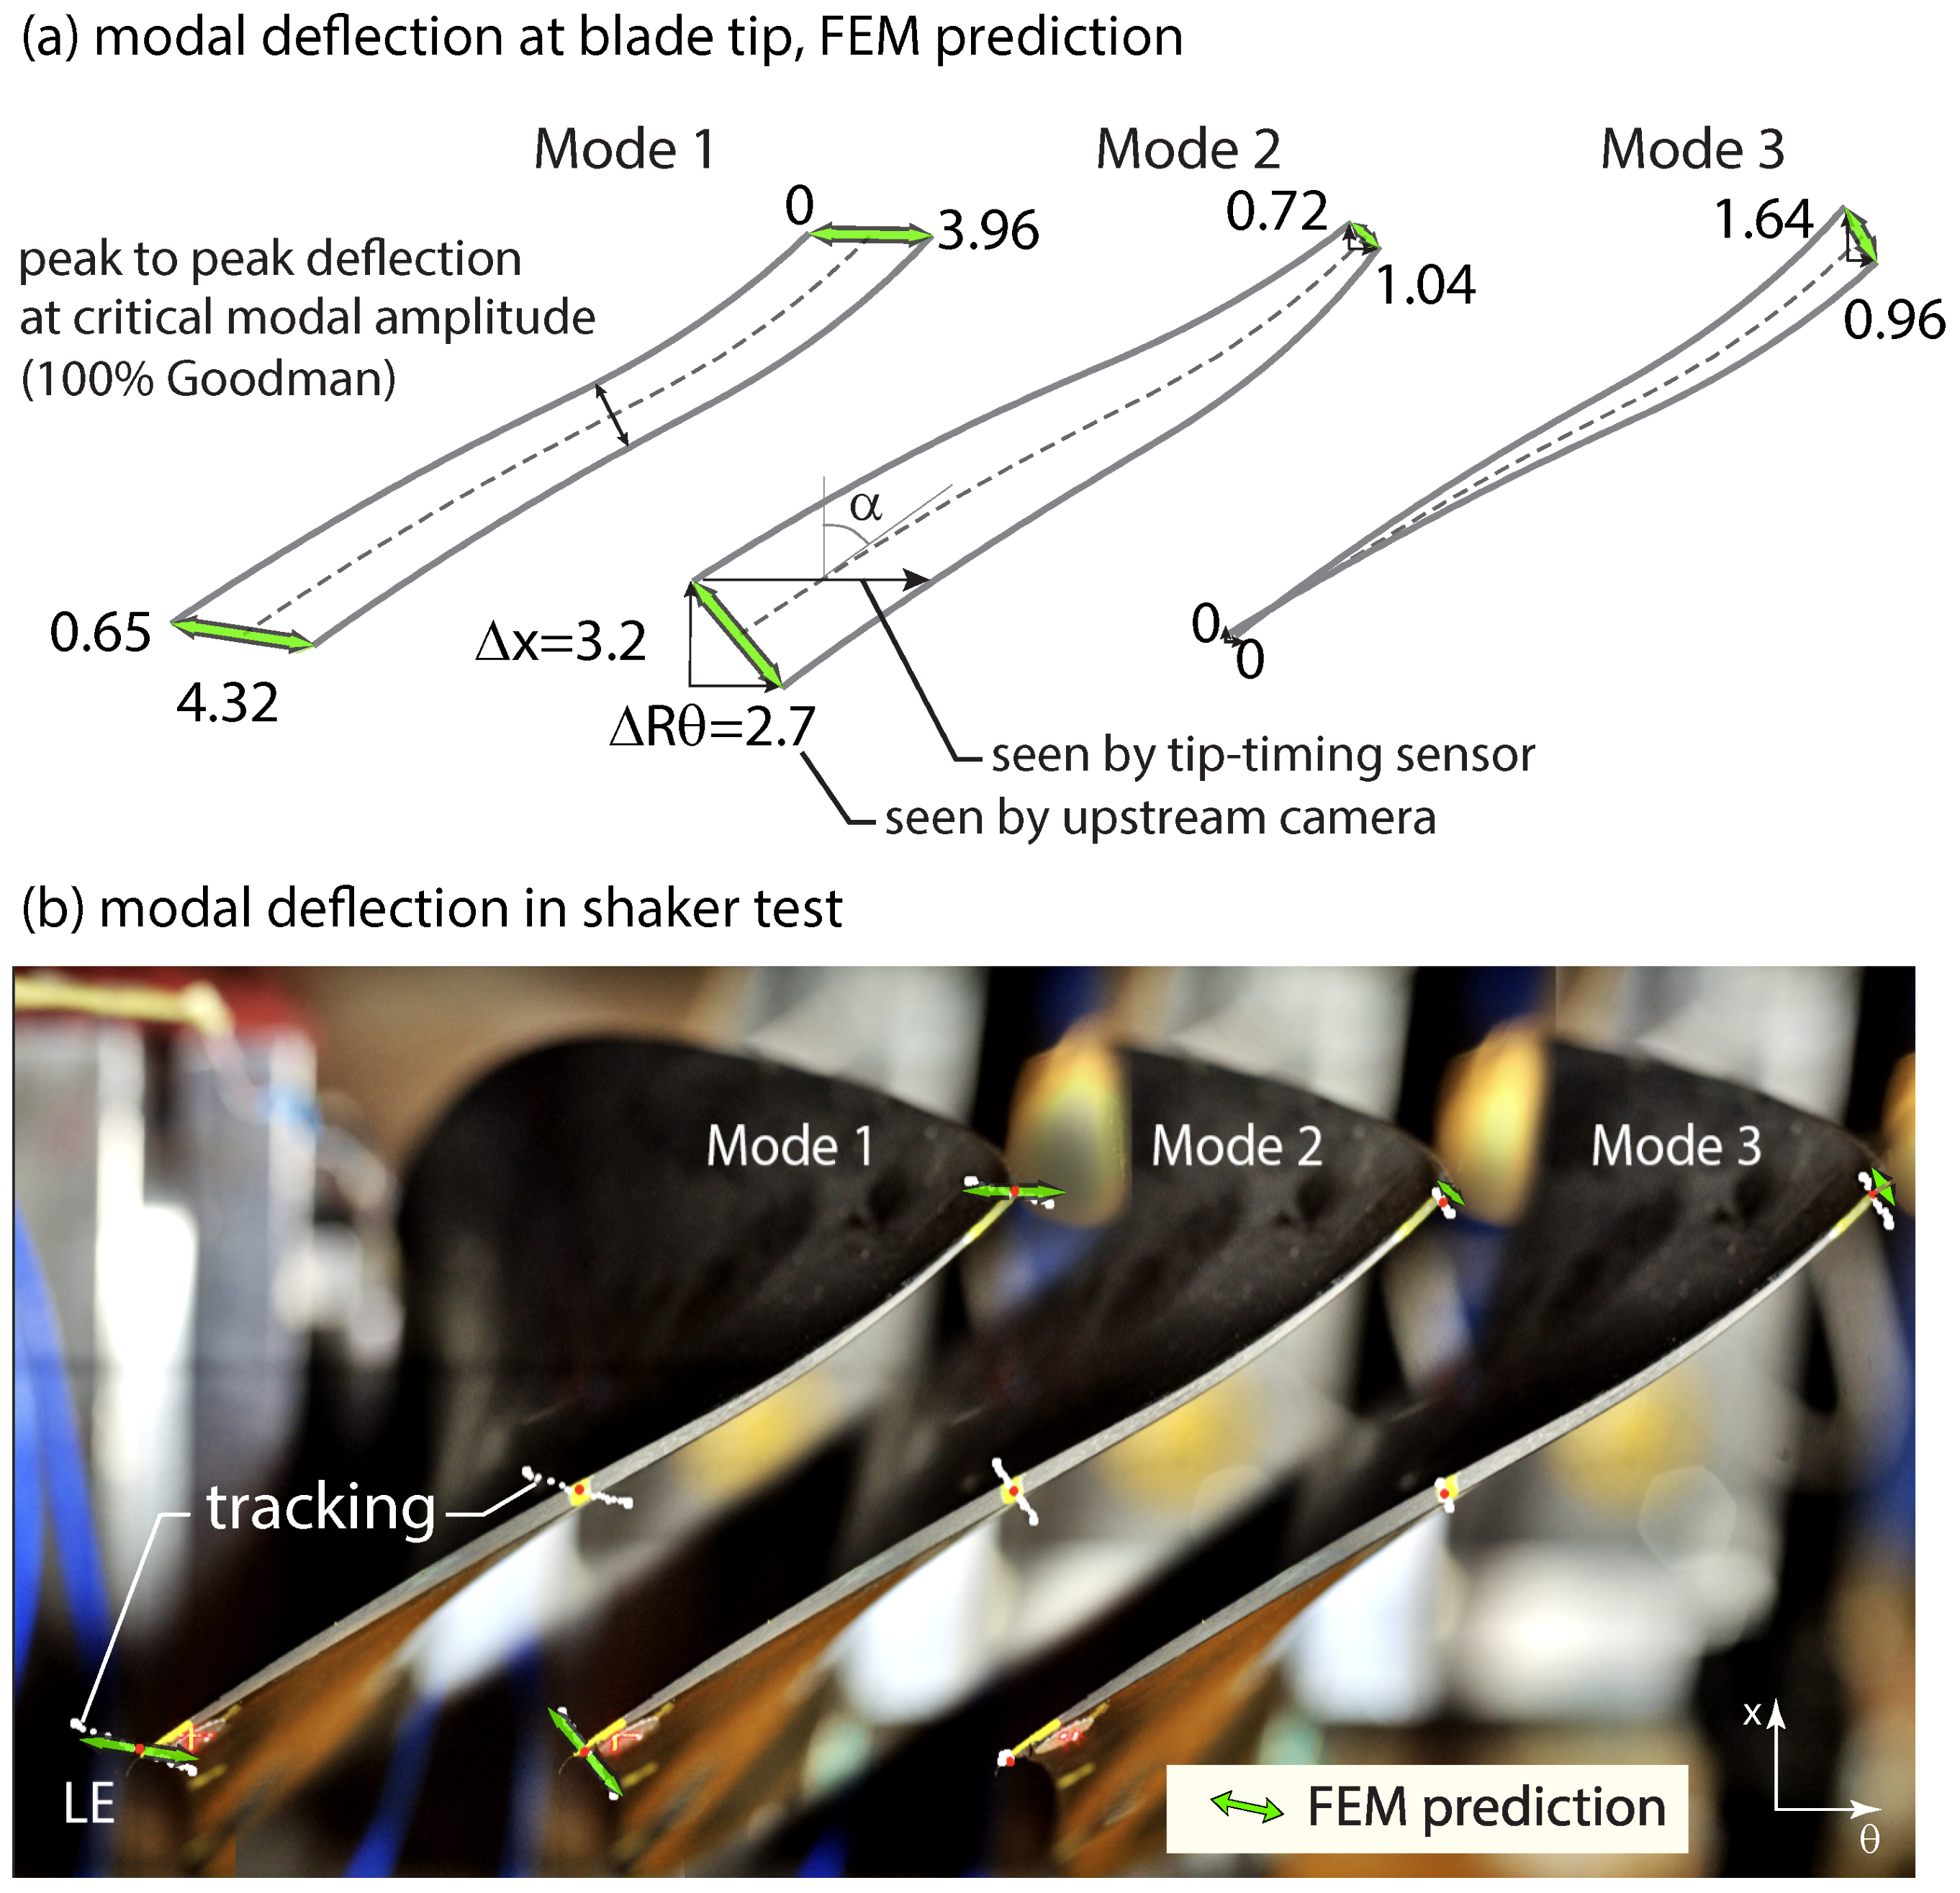
Figure 5a illustrates the geometric dependencies for modal deflections. Depending on the mode, the deflection components in the axial (
) and circumferential (
) directions differ significantly. The
Figure 4a and
Figure 5a demonstrate the potential results for the available measurement systems:
The strain gauge measures the strain at a specific surface location;
The upstream camera captures the circumferential displacement (provided that the camera distance is sufficiently large);
The tip timing system measures the blade tip’s arrival time at specific axial positions.
The sketch for Mode 2 highlights that the stagger angle must be considered for the tip-timing measurement if the axial displacement is significant. This consideration does not apply to the camera measurement, which relies on fixed markers on the blade surface, thus eliminating the influence of axial displacement.
Hence, all applied measurement techniques to derive individual blade vibrations capture different quantities (strain, circumferential displacement and time of arrival). The common assumption is that the FEM simulation correctly transfers modal deformation amplitude to stress in the critical fibre of the blade. However, the individual systems present inherent characteristics that are elaborated in the following.
To validate the FEM simulation, shaker tests with all individual blades have been conducted. The blades were mounted in a massive steel block that was excited across a wide frequency range using a shaker module. With a laser interferometer the surface response was acquired.
Table 3 presents the FEM predicted eigenfrequencies and the average eigenfrequencies from ping-test results, individual blade eigenfrequencies from ping-test setup are given in [
15]. For all three modes, the FEM predicted eigenfrequency was higher than the measured frequency. These deviations are within the range of expected model accuracy and industrial practices.
Prediction of the mode shapes was tested through mapping of the tip deflection during the shaker tests.
Figure 5b shows tracking of the leading edge, mid-chord and trailing edge markers from high-speed camera results for the three first blade eigenmodes, represented by white dots and amplified by a factor of 5 for better visualization. The green arrows shows the deflection predicted by FEM calculation at the leading and trailing edges. The actual amplitude achieved on the shaker test is ≈40% of Goodman scope limit for the individual modes.
Figure 5a,b illustrate that the general mode shape is well predicted, a mostly flexural Mode 1, Mode 2 with significant torsion and a node towards the trailing edge, Mode 3 purely torsional at the tip with a node at the leading edge. The FEM deflection is represented as green arrows, showing a non-negligible deviation of the modal velocity vector for Mode 1 and Mode 2, where the experiment shows a more pronounced axial component, deviating the inclination by up to 13° from FEM.
4.1. Strain Gauges via Telemetry
A telemetry system is available at the facility with 24 strain gauge channels. The objective was to achieve surveillance of each individual blade at an identical sensor position. To avoid aerodynamic disturbances, the selection of the strain gauge position was limited to the area underneath the inter-blade platforms. Based on FEM simulations, two positions have been selected, one on the suction side (1), already discussed before, and one on the pressure side (2).
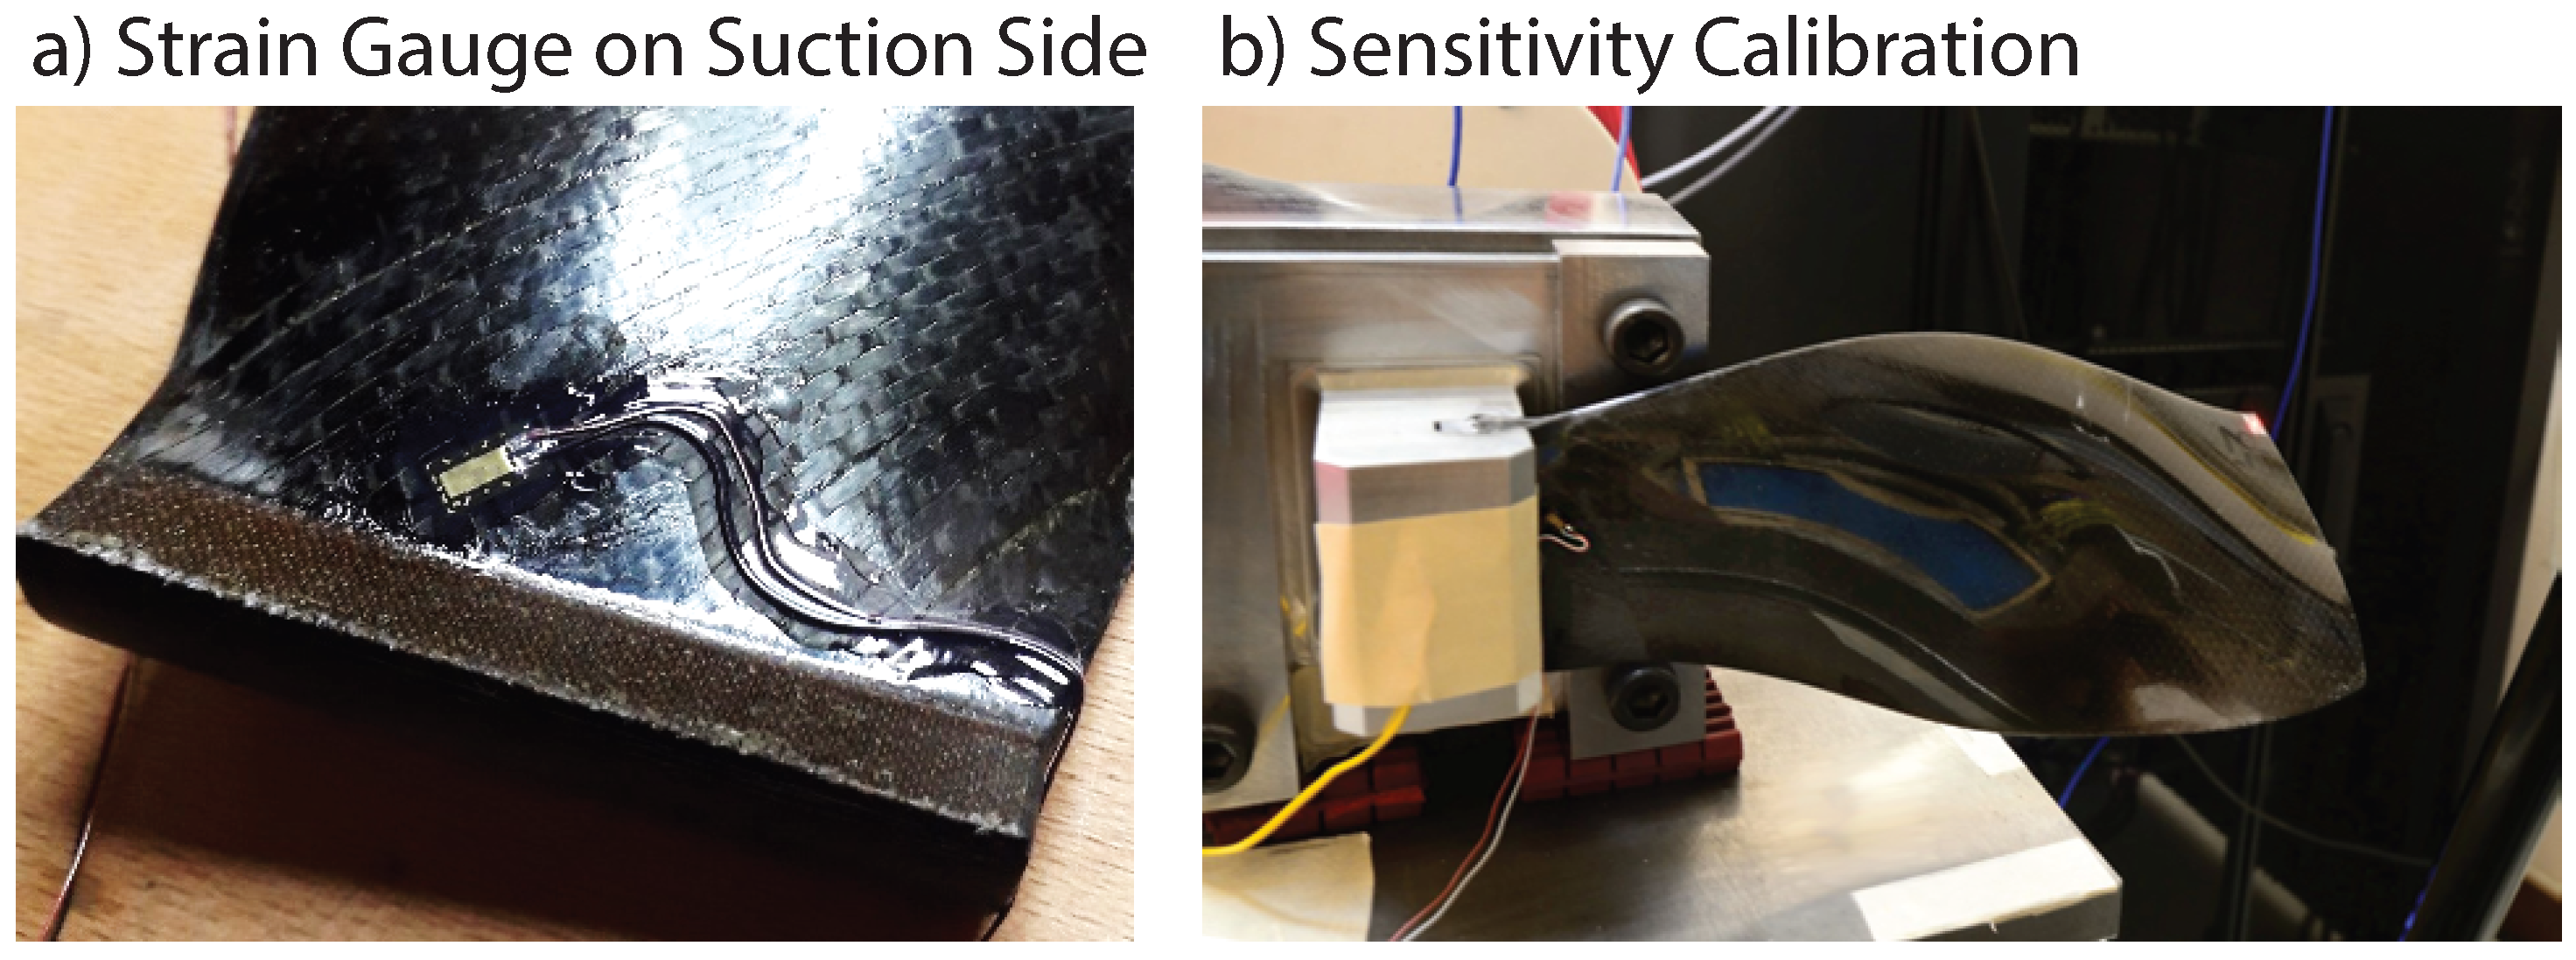
Figure 6 illustrates the respective position, on the suction surface aligned with the main fibre direction at the blade surface. Position (1) has a relative sensitivity (local strain at gauge position as a fraction of critical strain in most sensitive ply) of 40%, 15%, and 10% for modes 1 through 3. For position (2) on the pressure surface the relative sensitivities are 20%, 30% and 50% respectively. Using this combination, at least 30% relative sensitivity could be reached for each blade mode. The suction side position was instrumented on each blade of the fan, the pressure side position on eight out of sixteen blades, distributed non-homogeneously to optimize nodal-diameter decomposition. Using a commercial telemetry system the 24 strain gauges are conditioned in the rotating frame and transmitted to a stationary receiver. Subsequently the data is continuously sampled at 51kHz. The strain gauges of type C5K-06-125LK-350-33F were applied according to industrial procedures as shown in
Figure 6a.
Due to experimental constraints the sensor sensitivity was calibrated on the shaker
Figure 6b after the rotating experiment. Here, a non-negligible variation in sensitivity was observed as shown in
Figure 7. In campaigns not shown in this study, a spread of ±15% was not uncommon, however the fan CATMIS presented two blades (BladeNr 10 and 12) with significant deviations (BladeNr 10: 65%). Scans of sensor locations revealed a positioning error well below 0.5 mm, and the loss of sensitivity is hence attributed to improper bonding of the gauge to the surface. As the system was used as a primary indicator to determine operational stability, this circumstance is critical and in future campaigns, all strain gauges will be characterized beforehand. The graph presented in
Figure 7 is similar for all modes within a range of ±5%, and what is shown here is an average.
4.2. Capacitive Tip Timing
A highly attractive solution for vibration measurement involves the application of contactless sensors mounted in casing to measure the passage of individual rotor blade tips. Several commercial systems, based on either capacitive or optical sensors, are available. The main advantage of these systems is their easy integration into a stationary casing, eliminating the need for any rotating component. Additionally, these systems can be adapted to various rotor or blade configurations. When properly calibrated, industrial partners report high reliability even under safety-critical conditions. A further advantage of the used system is the simultaneous derivation of local tip clearance and blade stagger angle.
However, the calibration process for these systems is more elaborate compared to strain gauge systems. The system only measures the arrival time of the blade tip at respective sensor positions, necessitating that the sensor positioning is well adapted to the mode shapes of interest. For the first three eigenmodes of the CATANA configuration shown in
Figure 5b, this requirement is particularly evident for Mode 3, which presents a vibration node at the leading edge and can only be measured towards the trailing edge. Mode 3 also exhibits much lower deflection at the trailing edge at critical stress levels compared to Mode 1. Each sensor position has been optimized using the mode shapes at the blade tip from FEM results. Since the system takes the mode shapes at the tip into account, this enables to derive the occurring blade stress from the measured tip deflection.
This leads to two main complications for the system: the required accuracy of blade passing detection and the sampling of assembly modes. Manufacturers have invested significant efforts to achieve high temporal accuracy, which will not be discussed here. For the CATANA test campaign, the tip timing system has been provided by MTU, together with the post-processing methods [
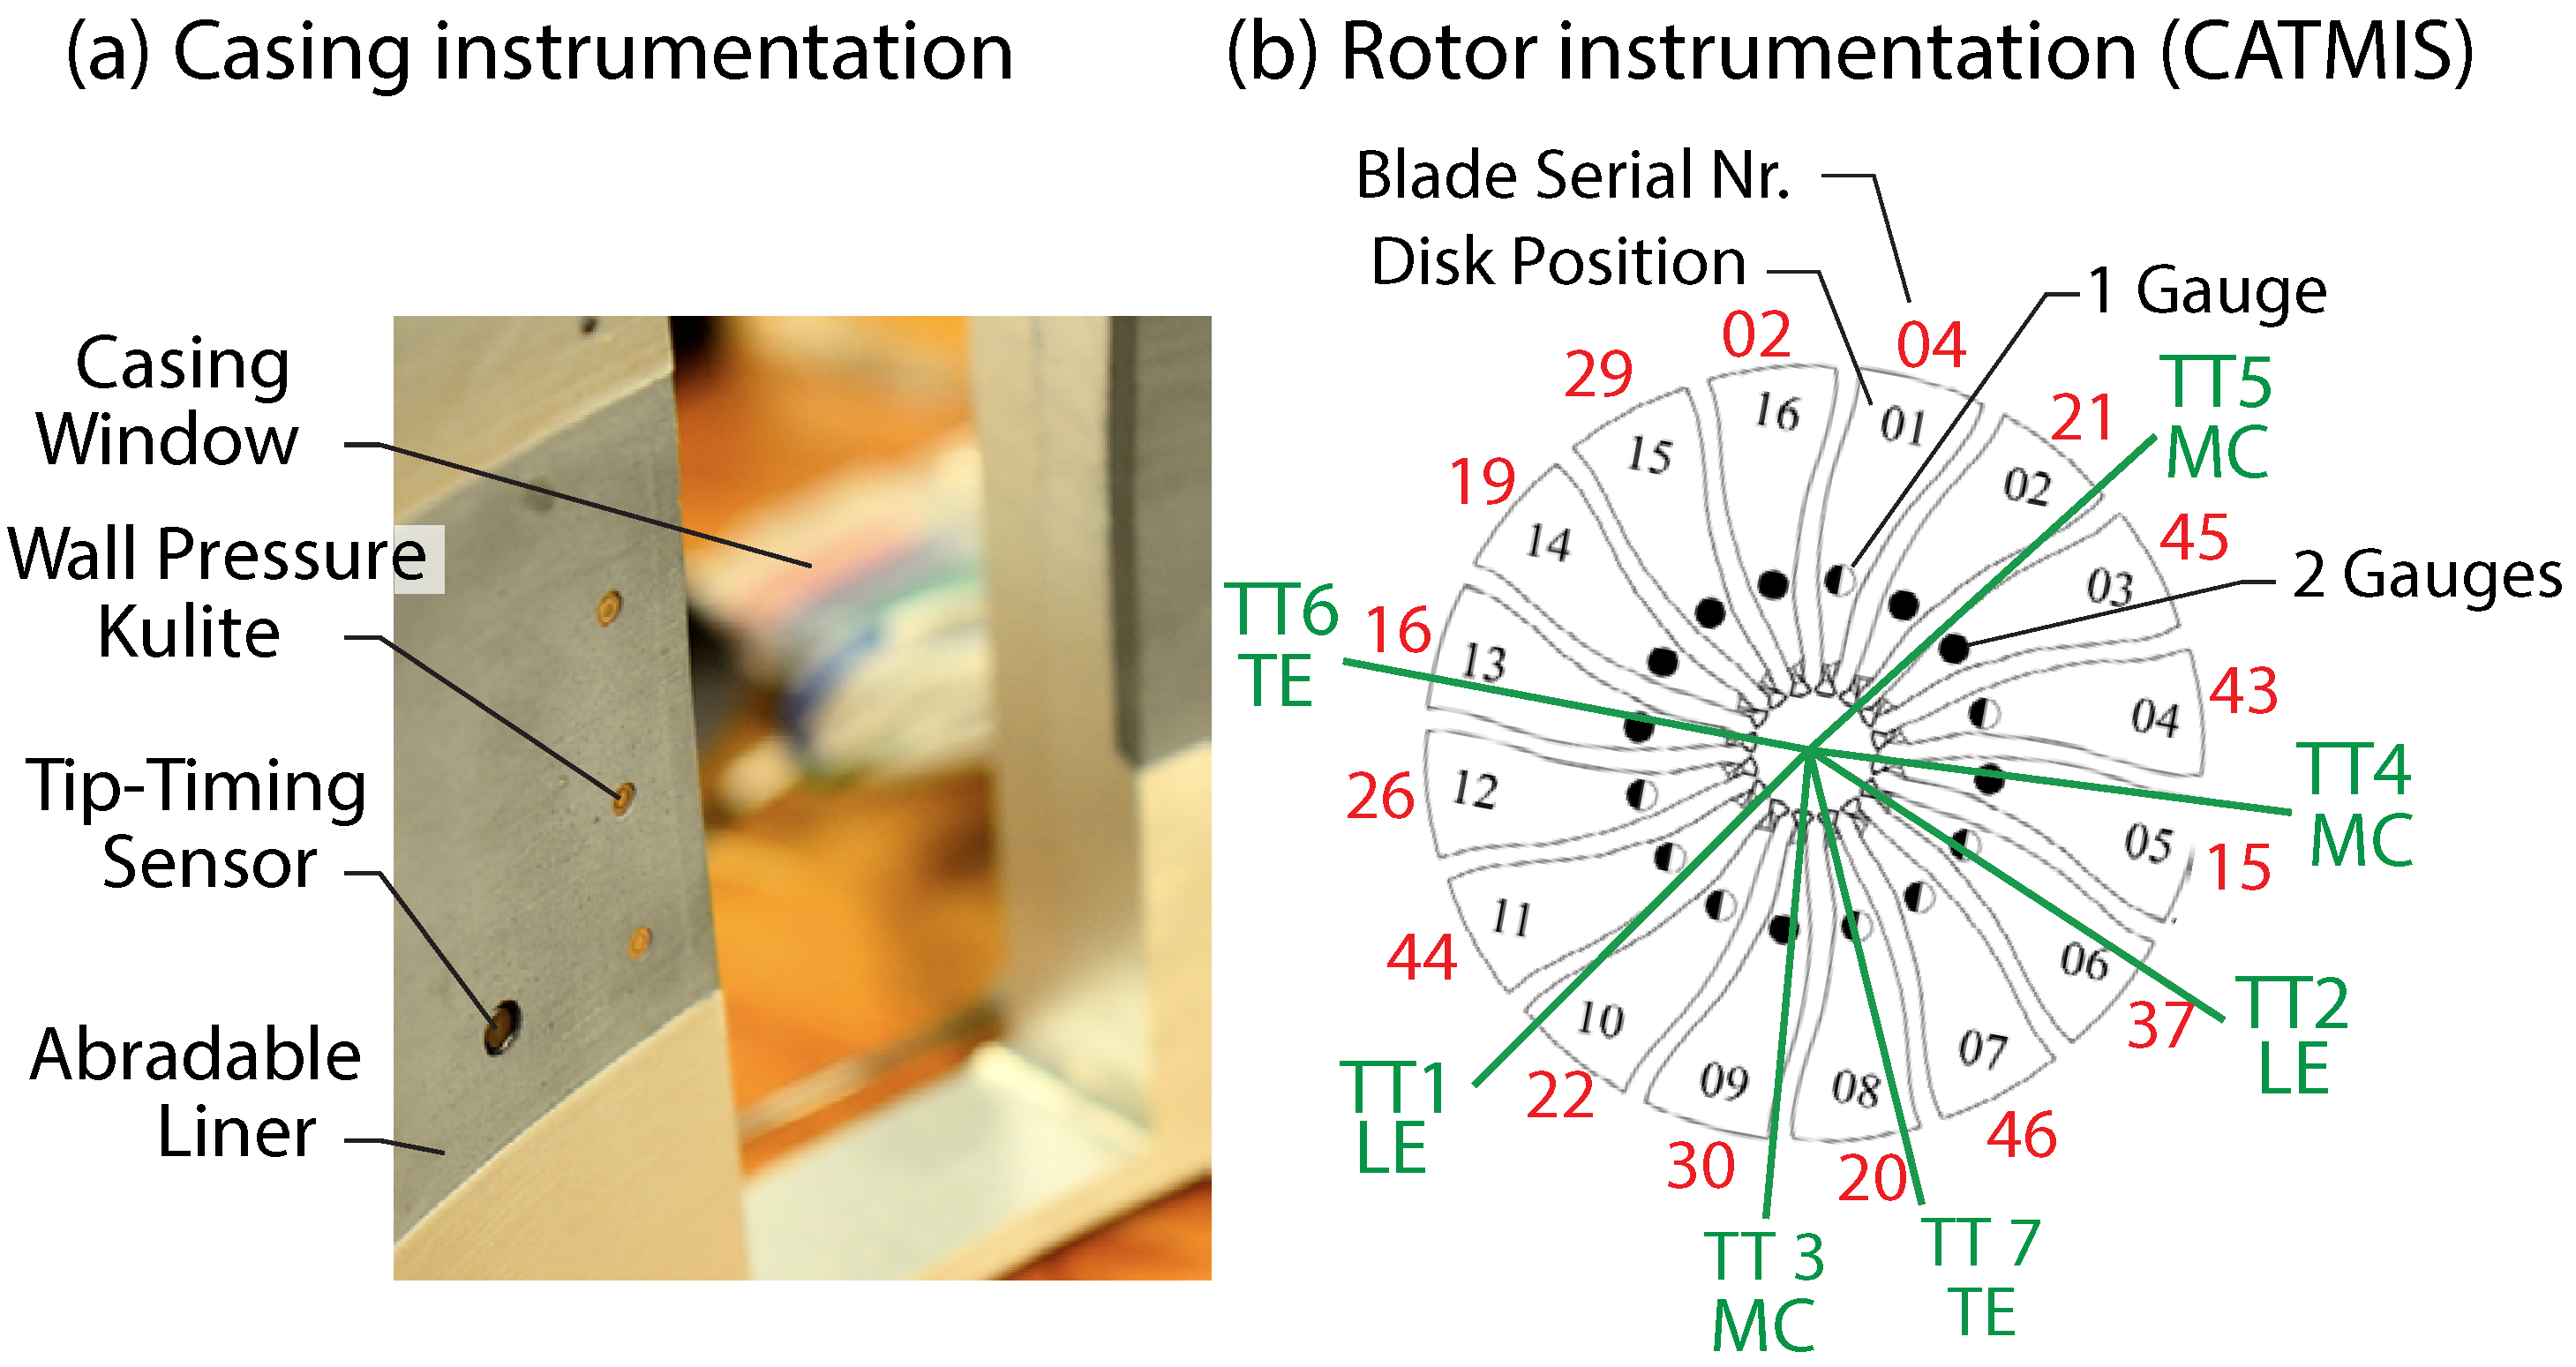
17]. Capacitive sensors were placed within a radial distance of 1.5 mm from the blade tips, well within the range recommended by the system manufacturer. A total of seven sensors has been integrated in the casing wall at three axial planes: two near the leading edge at 11%
(TT LE), three at mid-chord 64%
(TT MC), and two near the trailing edge 88%
(TT TE).
Figure 8 shows the integration of the capacitive sensors in the casing wall (a), and the distribution around the circumference (b). The axial planes are indicated in
Figure 1.
Inherently, the frequency resolution of the system is limited to the blade passing frequency (under-sampled signals) and requires elaborate methods to consider aliasing. To derive the non-synchronous response of blades, first, the system considers that all blades are vibrating at the same amplitude and with a fixed inter-blade phase shift. The deviation from the estimated blade passing time is calculated and used to calculate a non-uniform discrete Fourier transform to obtain an all-blade spectrum. Considering two probes with the modal frequency and the circumferential probe positions, the nodal diameter is derived, as described in [
7,
17].
The sensitivity of the system towards accuracy of the FEM simulation is therefore high. The system measures a combination of circumferential deflection and stagger-angle-dependent projection of axial deflection. While the strain gauges require accurate sensor placement with respect to the strain map at the blade surface, tip timing requires accurate information on the mode shape at the tip. If blades deform axially, derived values are systematically affected. For the experiments, the FEM-mode shapes were applied, and the results presented in
Figure 5b show that non-negligible deviations of the modal velocity vector are present. For the tested case, the conditions are conservative, as the predicted mode shape has less axial component for Mode 1 and 2, systematically increasing measured deflection values. Yet, this circumstance may not be generalized and appropriate modeshape determination is essential.
4.3. High-Speed Imaging
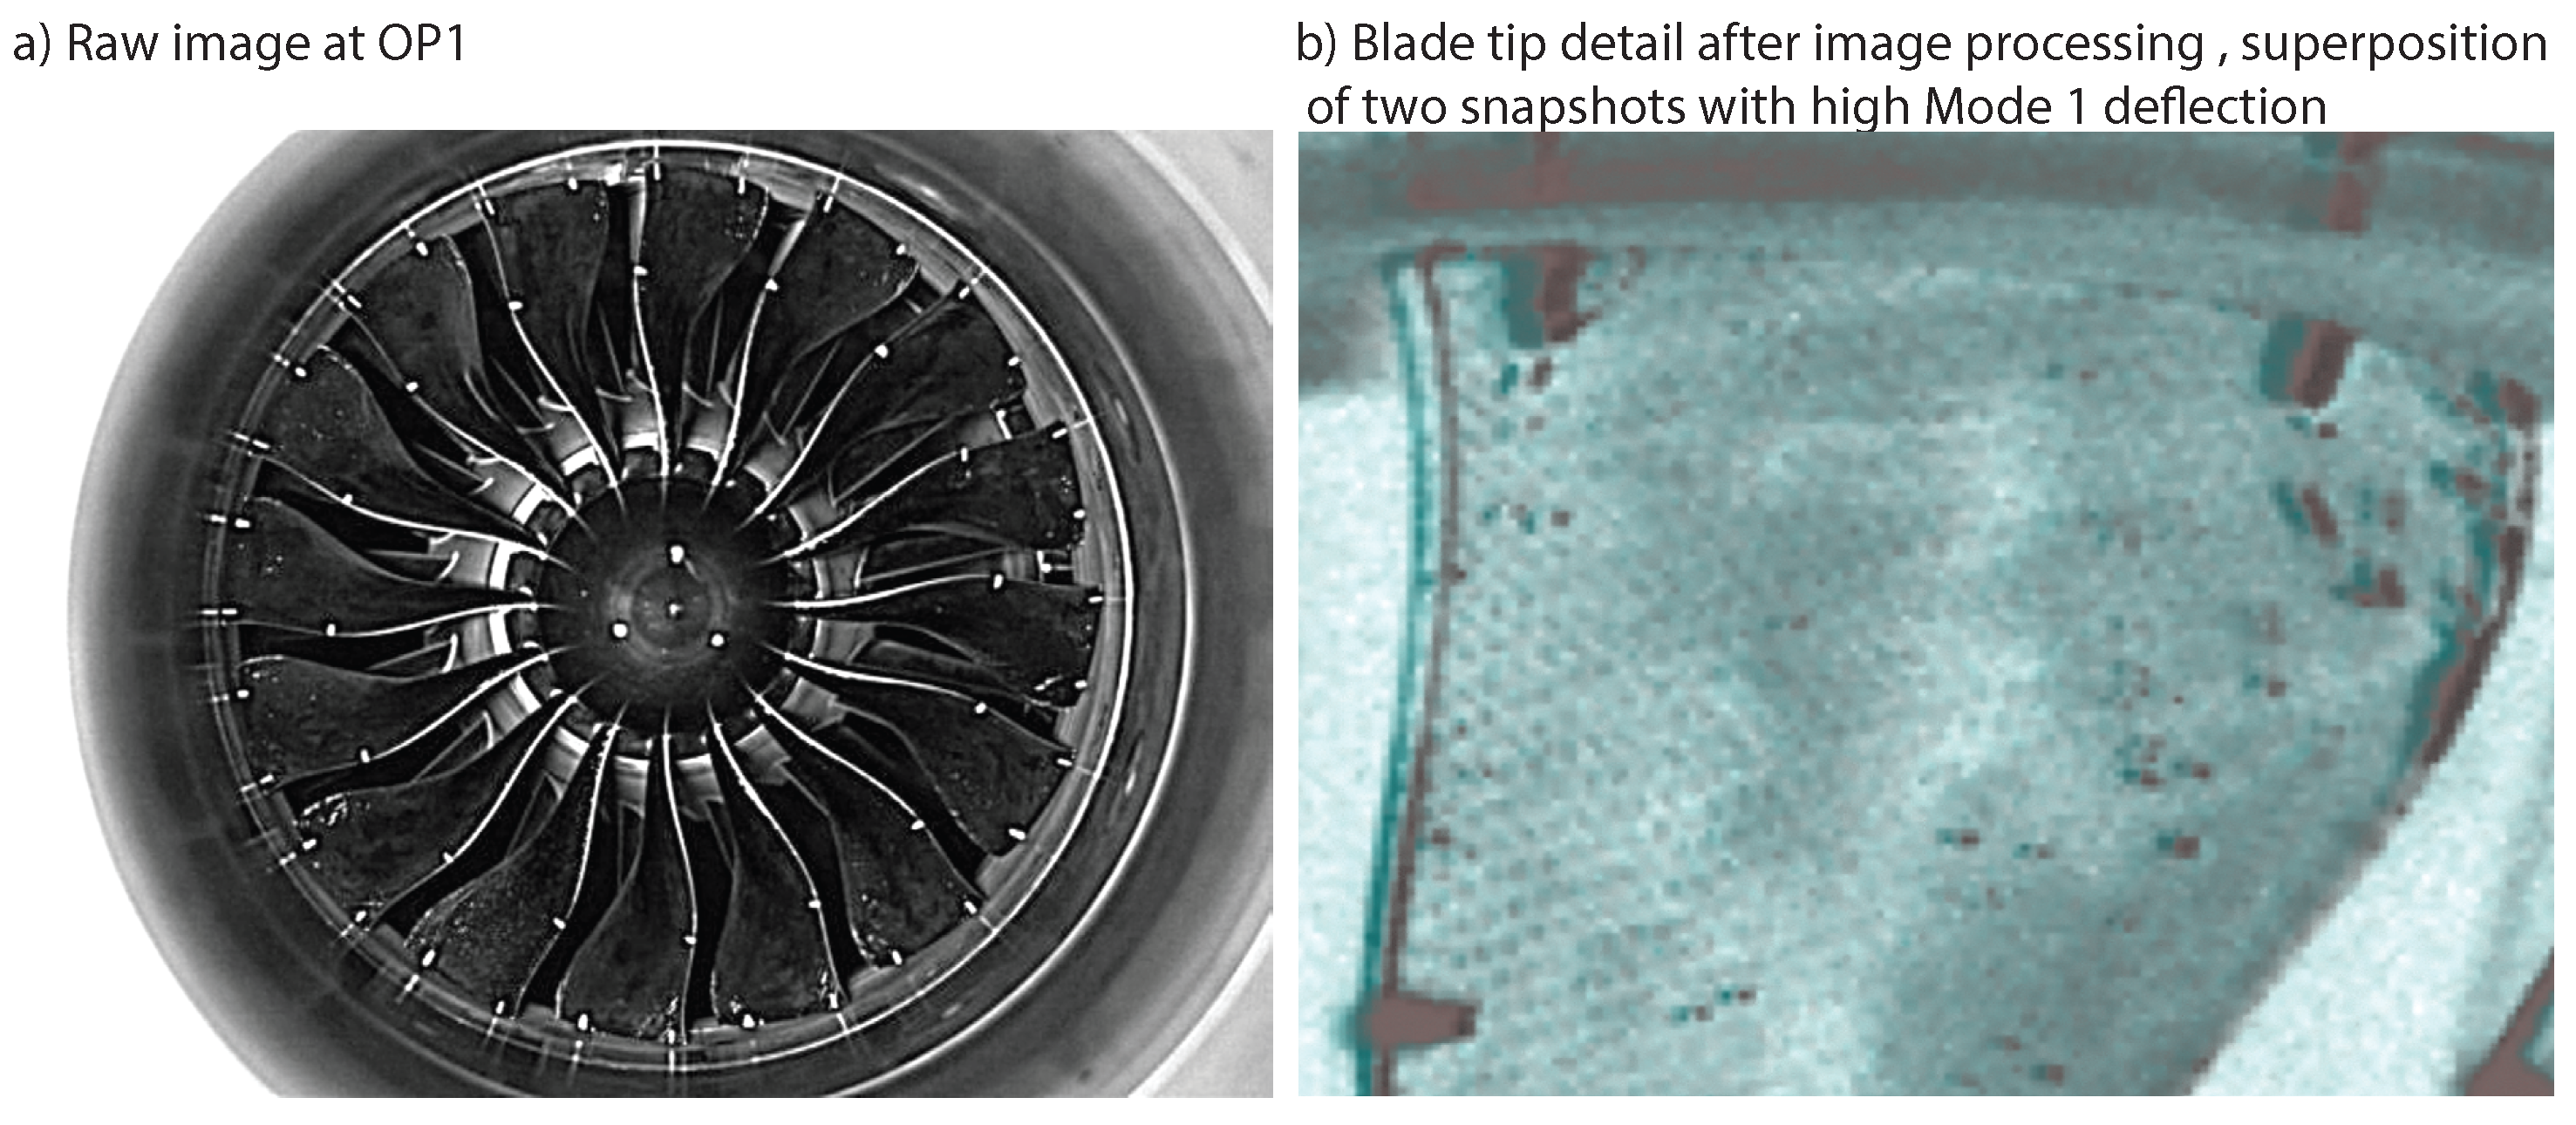
A high-speed camera (Phantom VEO) was mounted two meters upstream of the fan in line with the machine axis together with two stroboscopes. To trigger the camera, the once-per-revolution signal of the fan was multiplied to achieve sampling of each blade passing. Acquisition of the system was synchronized with the strain gauges, Kulites and tip timing to allow for direct comparison. Markers have been placed at different positions on the suction sides to allow robust detection of the blade movement. Due to hardware limitations, the maximum number of images per run was limited to 5000. Camera and stroboscope are depicted in
Figure 2. One typical snapshot under rotation is shown in
Figure 9a.
To evaluate the acquired files, the following image processing has been applied:
Alignment of all images towards fixed casing marker to eliminate camera vibration (<2 px).
Determination of rotation center.
Crop of 32 × 32 pixel window around surface marker (i.e., tip leading edge).
Creation of reference image window for each blade marker at each circumferential position of the fan (16 × 16 reference images per marker).
Cross-correlation of each sampled frame with the reference images to determine shift in x-y plane and transfer into cylindrical coordinates.
The above method closely resembles a typical PIV algorithm and exploits established methods for image pre-processing, correlation and peak detection, achieving sub-pixel accuracy of the deformation.
The main advantage of this system is that the whole fan could be monitored simultaneously. It directly measures the circumferential tip deflection as indicated in
Figure 5b without relying on FEM. At the 55% speedline, the three first blade eigenfrequencies are 2.3 EO, 5.9 EO and 8.6 EO, respectively. Since 16 images are recorded per rotation, the Nyquist frequency is 8 EO (
). Mode 1 and Mode 2 could be properly resolved, whereas Mode 3 surpasses the exploitable range.
5. Analysis at High Blade Vibration Amplitude
An investigation of the stability limit was conducted at constant speedlines ranging from 55% to 105% of the design speed by incrementally closing the throttle in steps of 0.1% of its area to reduce the mass flow rate. When the operating condition is far from the stability limit, the machine is stabilized for at least 40 seconds at each step. Closer to the stability limit, the stabilization time is reduced to prevent rotor damage. As soon as blade vibration amplitudes reach 50% of the Goodman scope limit, based on either strain gauge or tip timing measurements, the experiment is aborted by opening the throttle.
In the following, highly throttled operating conditions at 55% of nominal speed (6050 rpm/100.9 Hz) are investigated.
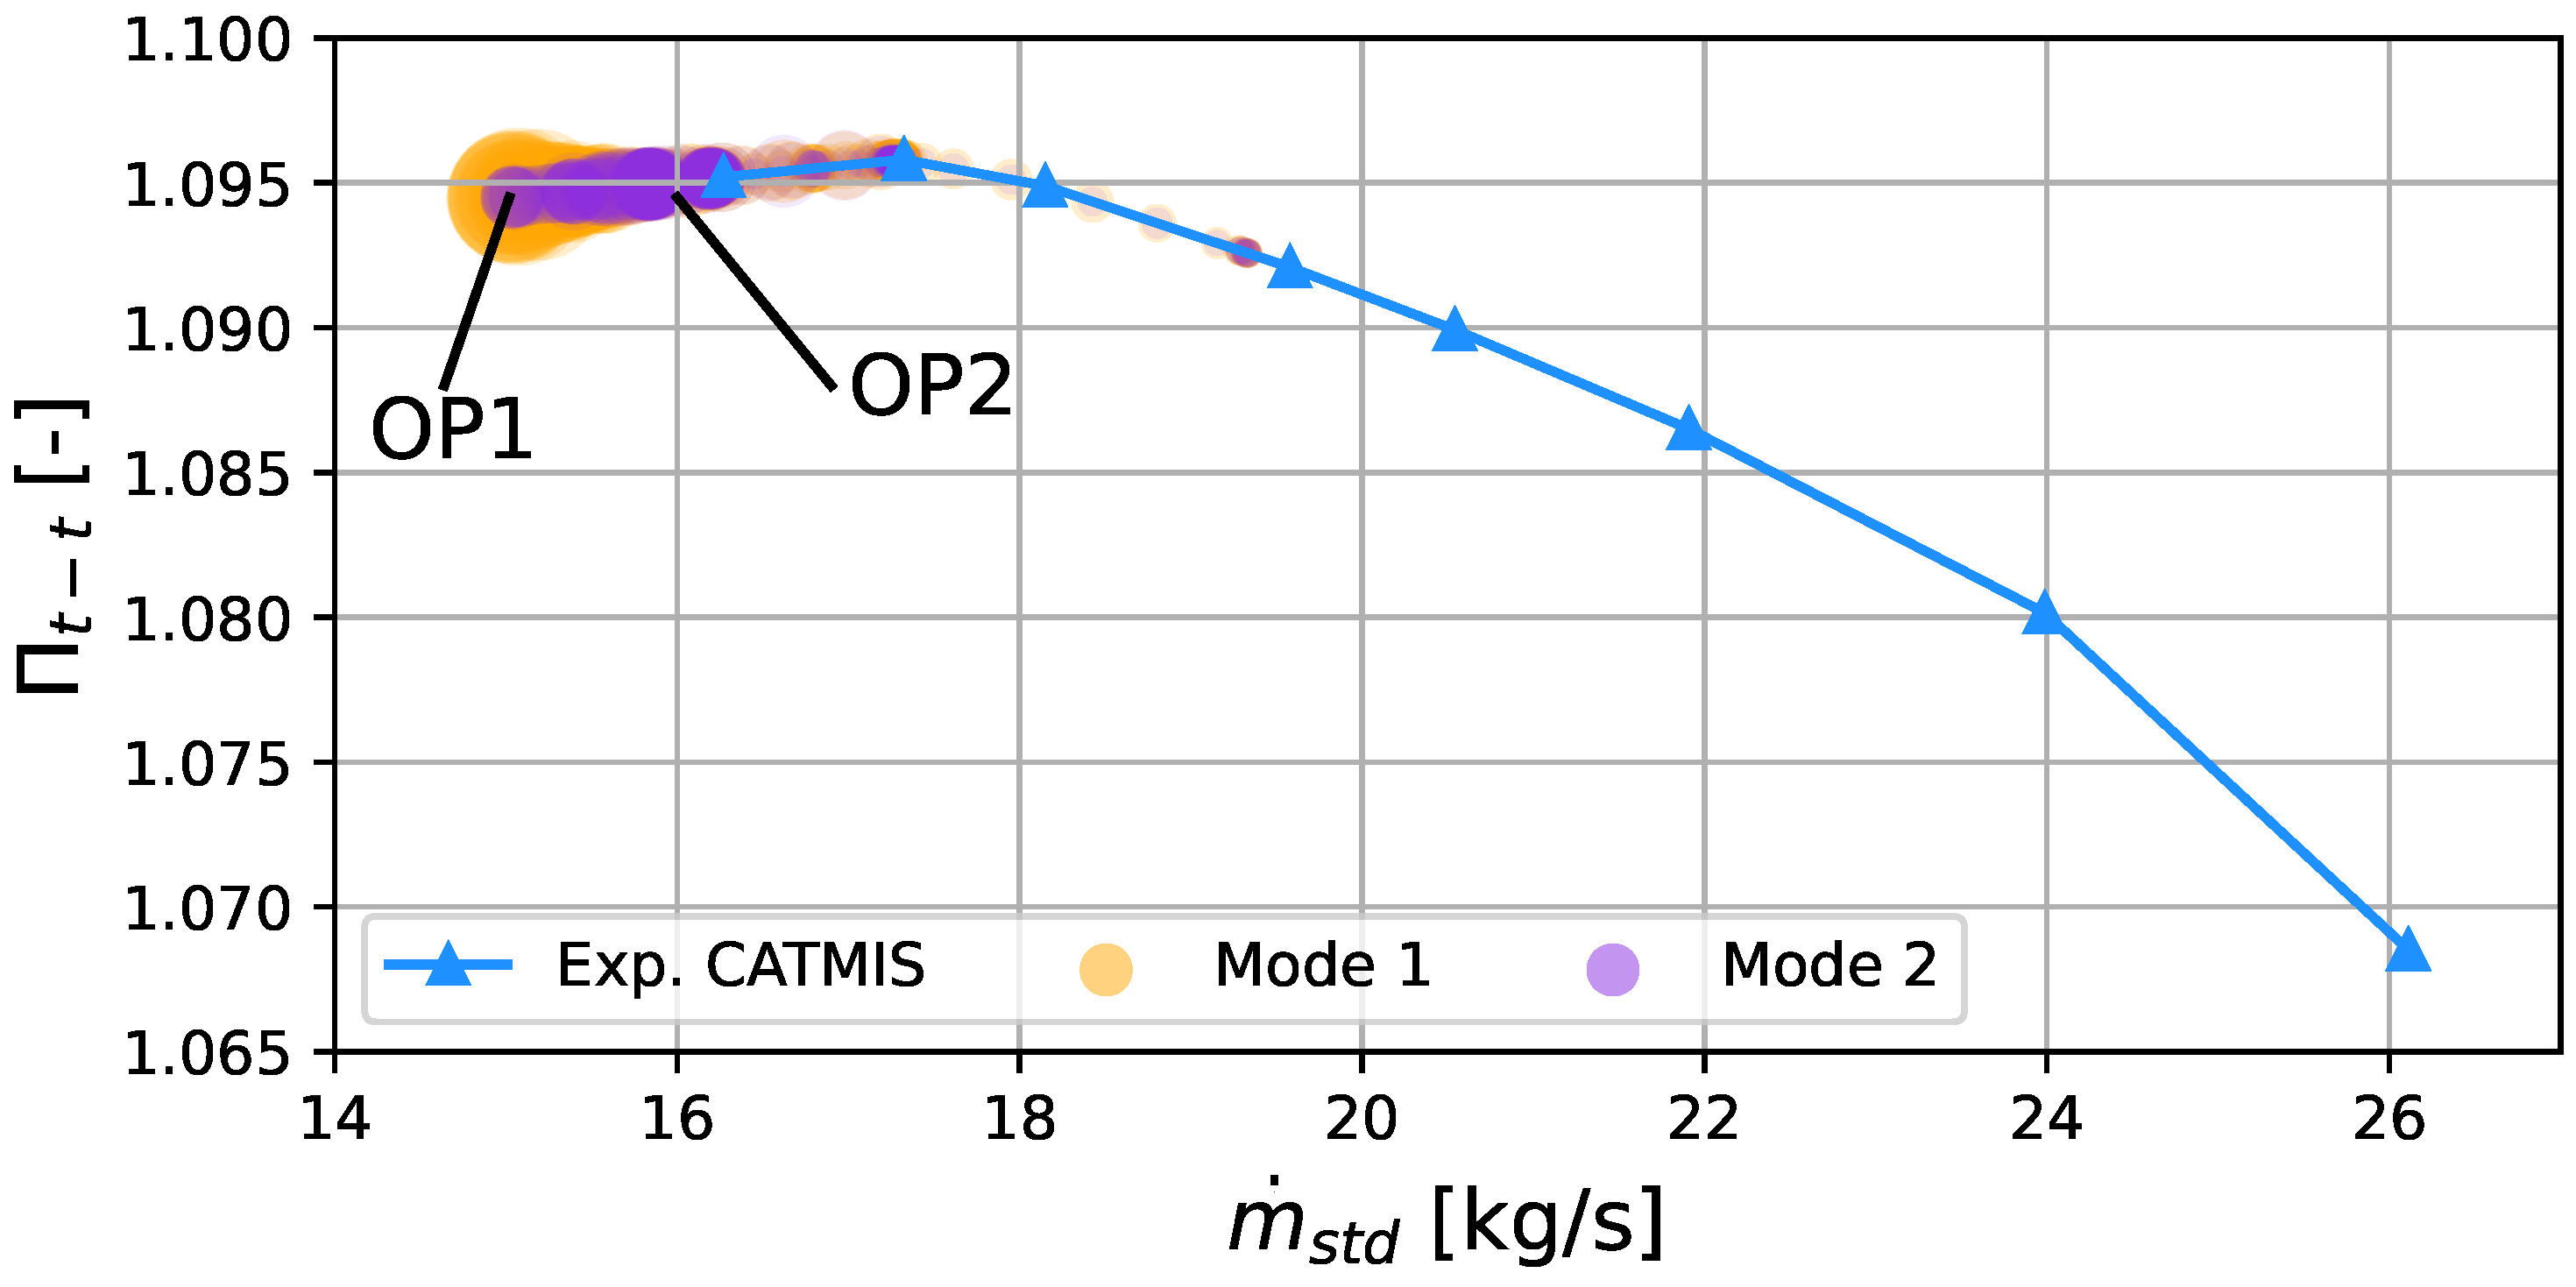
Figure 10 presents the compressor map at 55% of design speed. The size of orange and purple symbols indicate the measured modal amplitude for Mode 1 and Mode 2 derived from strain gauge signals, which both reached critical limits.
The established analysis of blade vibrations involves characterizing the interaction patterns between aerodynamics and structural blade vibration modes by considering unsteady wall static pressure (in the stationary frame of reference) and strain gauge signals (in the rotating frame of reference).
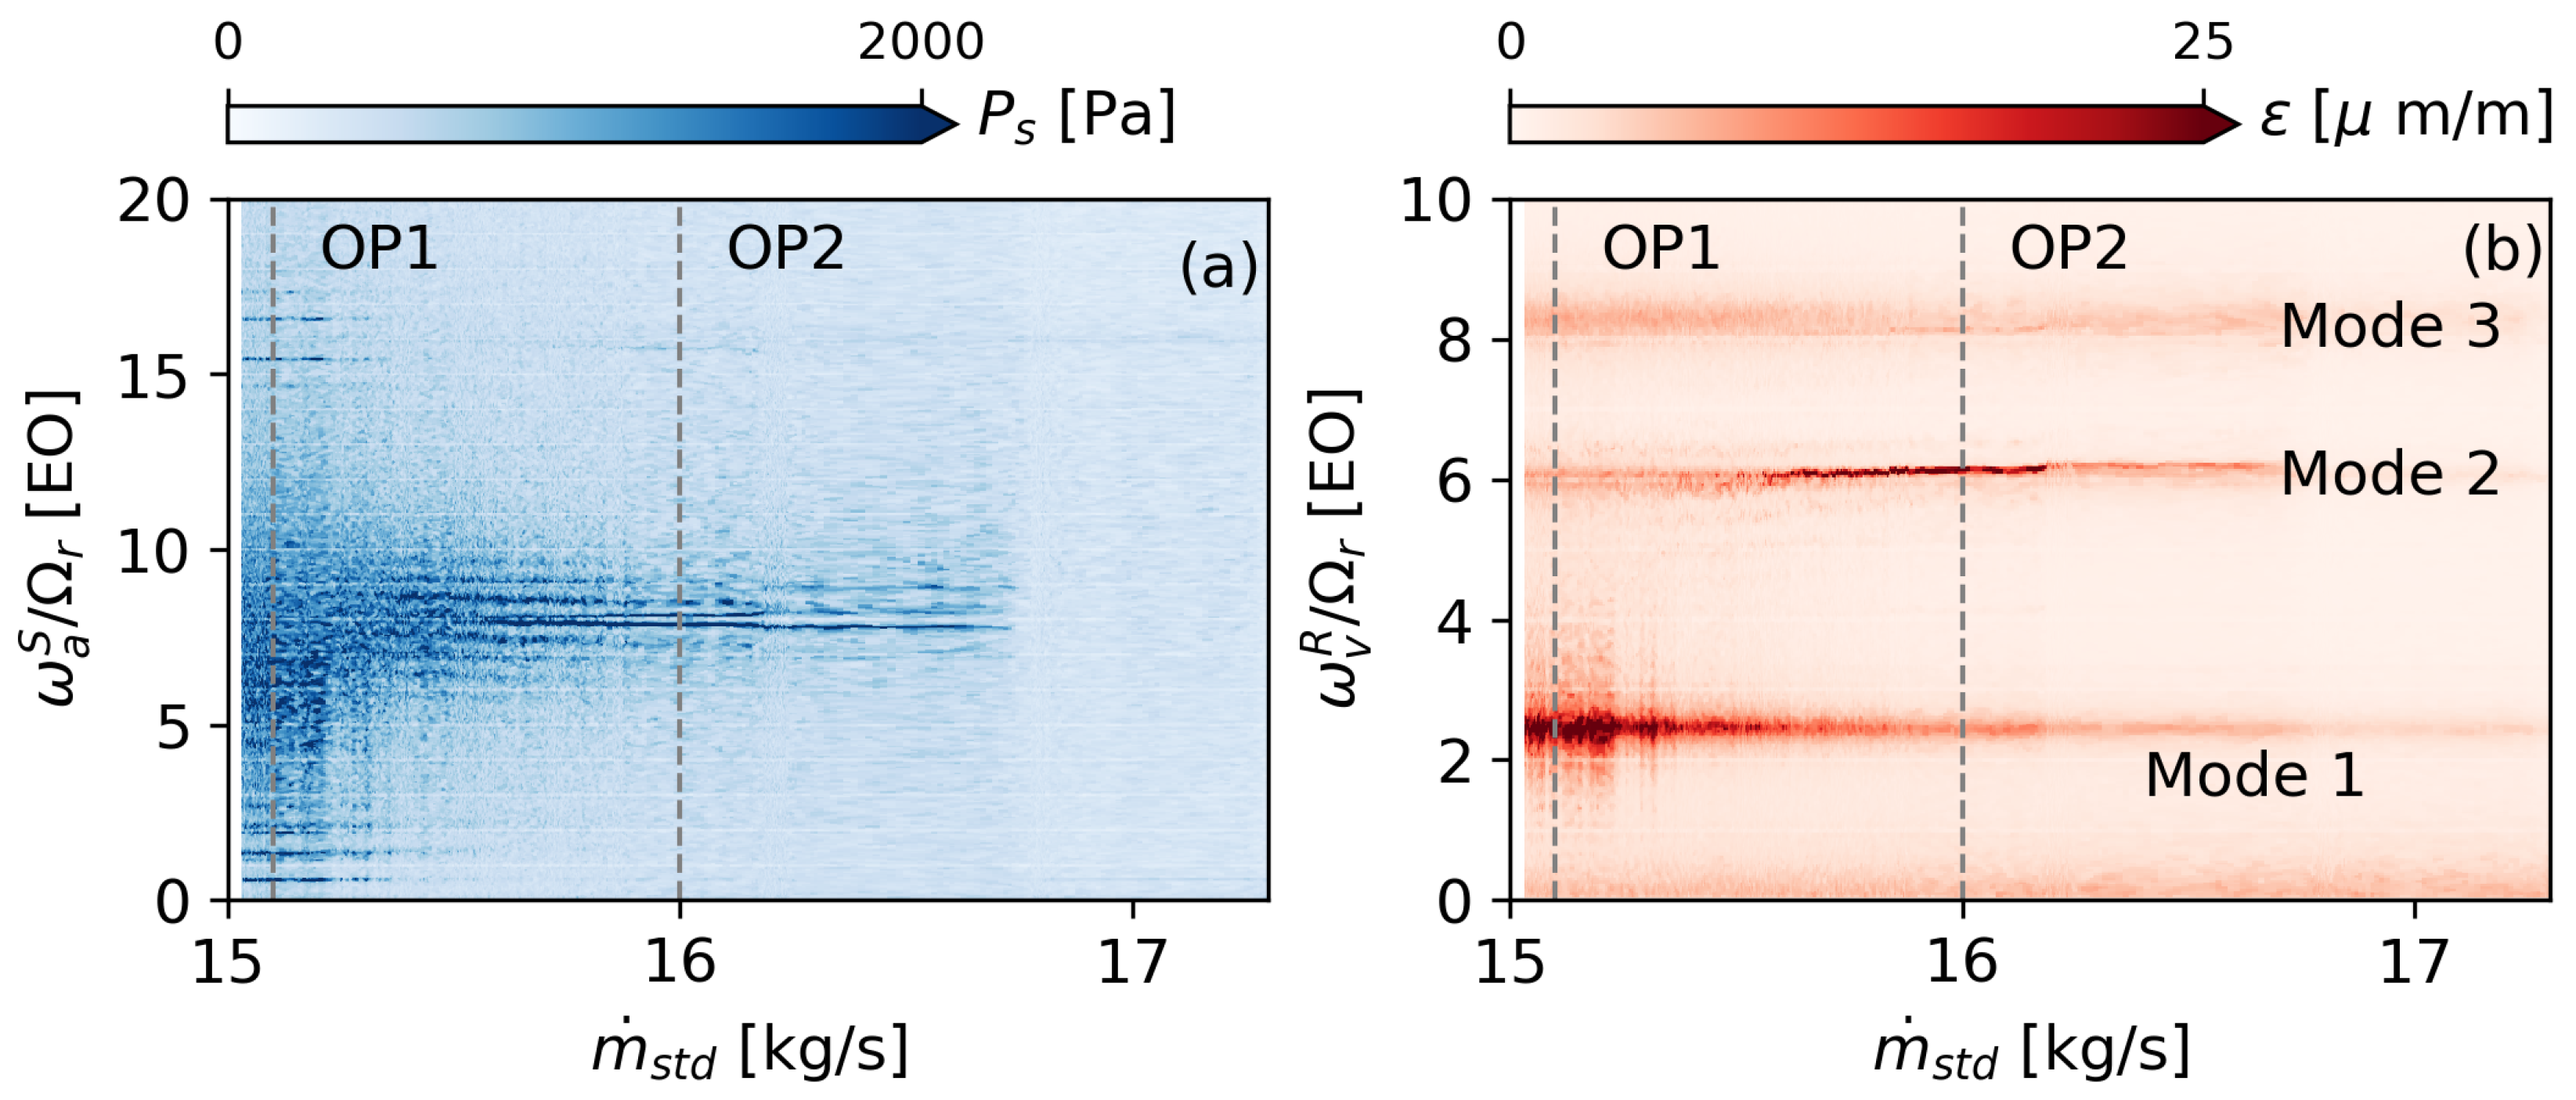
Figure 11 presents the spectrogram of wall-pressure in the leading edge plane (a), along with the vibration spectrum (b) as a function of the mass flow rate at 55% of design speed. A sliding ensemble average of each 10 rotations was subtracted from both signals to isolate non-synchronous content, and the frequencies are normalized by the shaft frequency, yielding engine order (EO).
Regarding the blade vibration spectrogram
Figure 11b, the first two blade eigenmodes are clearly identified at mass flow rates below 17 kg/s. Mode 3 is less active than at previously published conditions at higher operational speeds [
13,
15]. Between 16.5 and 15.5 kg/s, the rotor exhibits significant vibrations in Mode 2, reaching an amplitude peak at OP2 (16 kg/s, as indicated by a vertical gray dashed line). The associated pressure spectrogram in
Figure 11a shows distinct frequency peaks around engine order 8. Dominant modal peaks in the pressure and the vibration spectra of Mode 2 continuously shift with throttling from 16 to 15.5 kg/s. This behaviour is typical for a lock-in of convected aerodynamic disturbances with a blade eigenmode, potentially indicating the onset of NSV, as described in [
2,
18,
19].
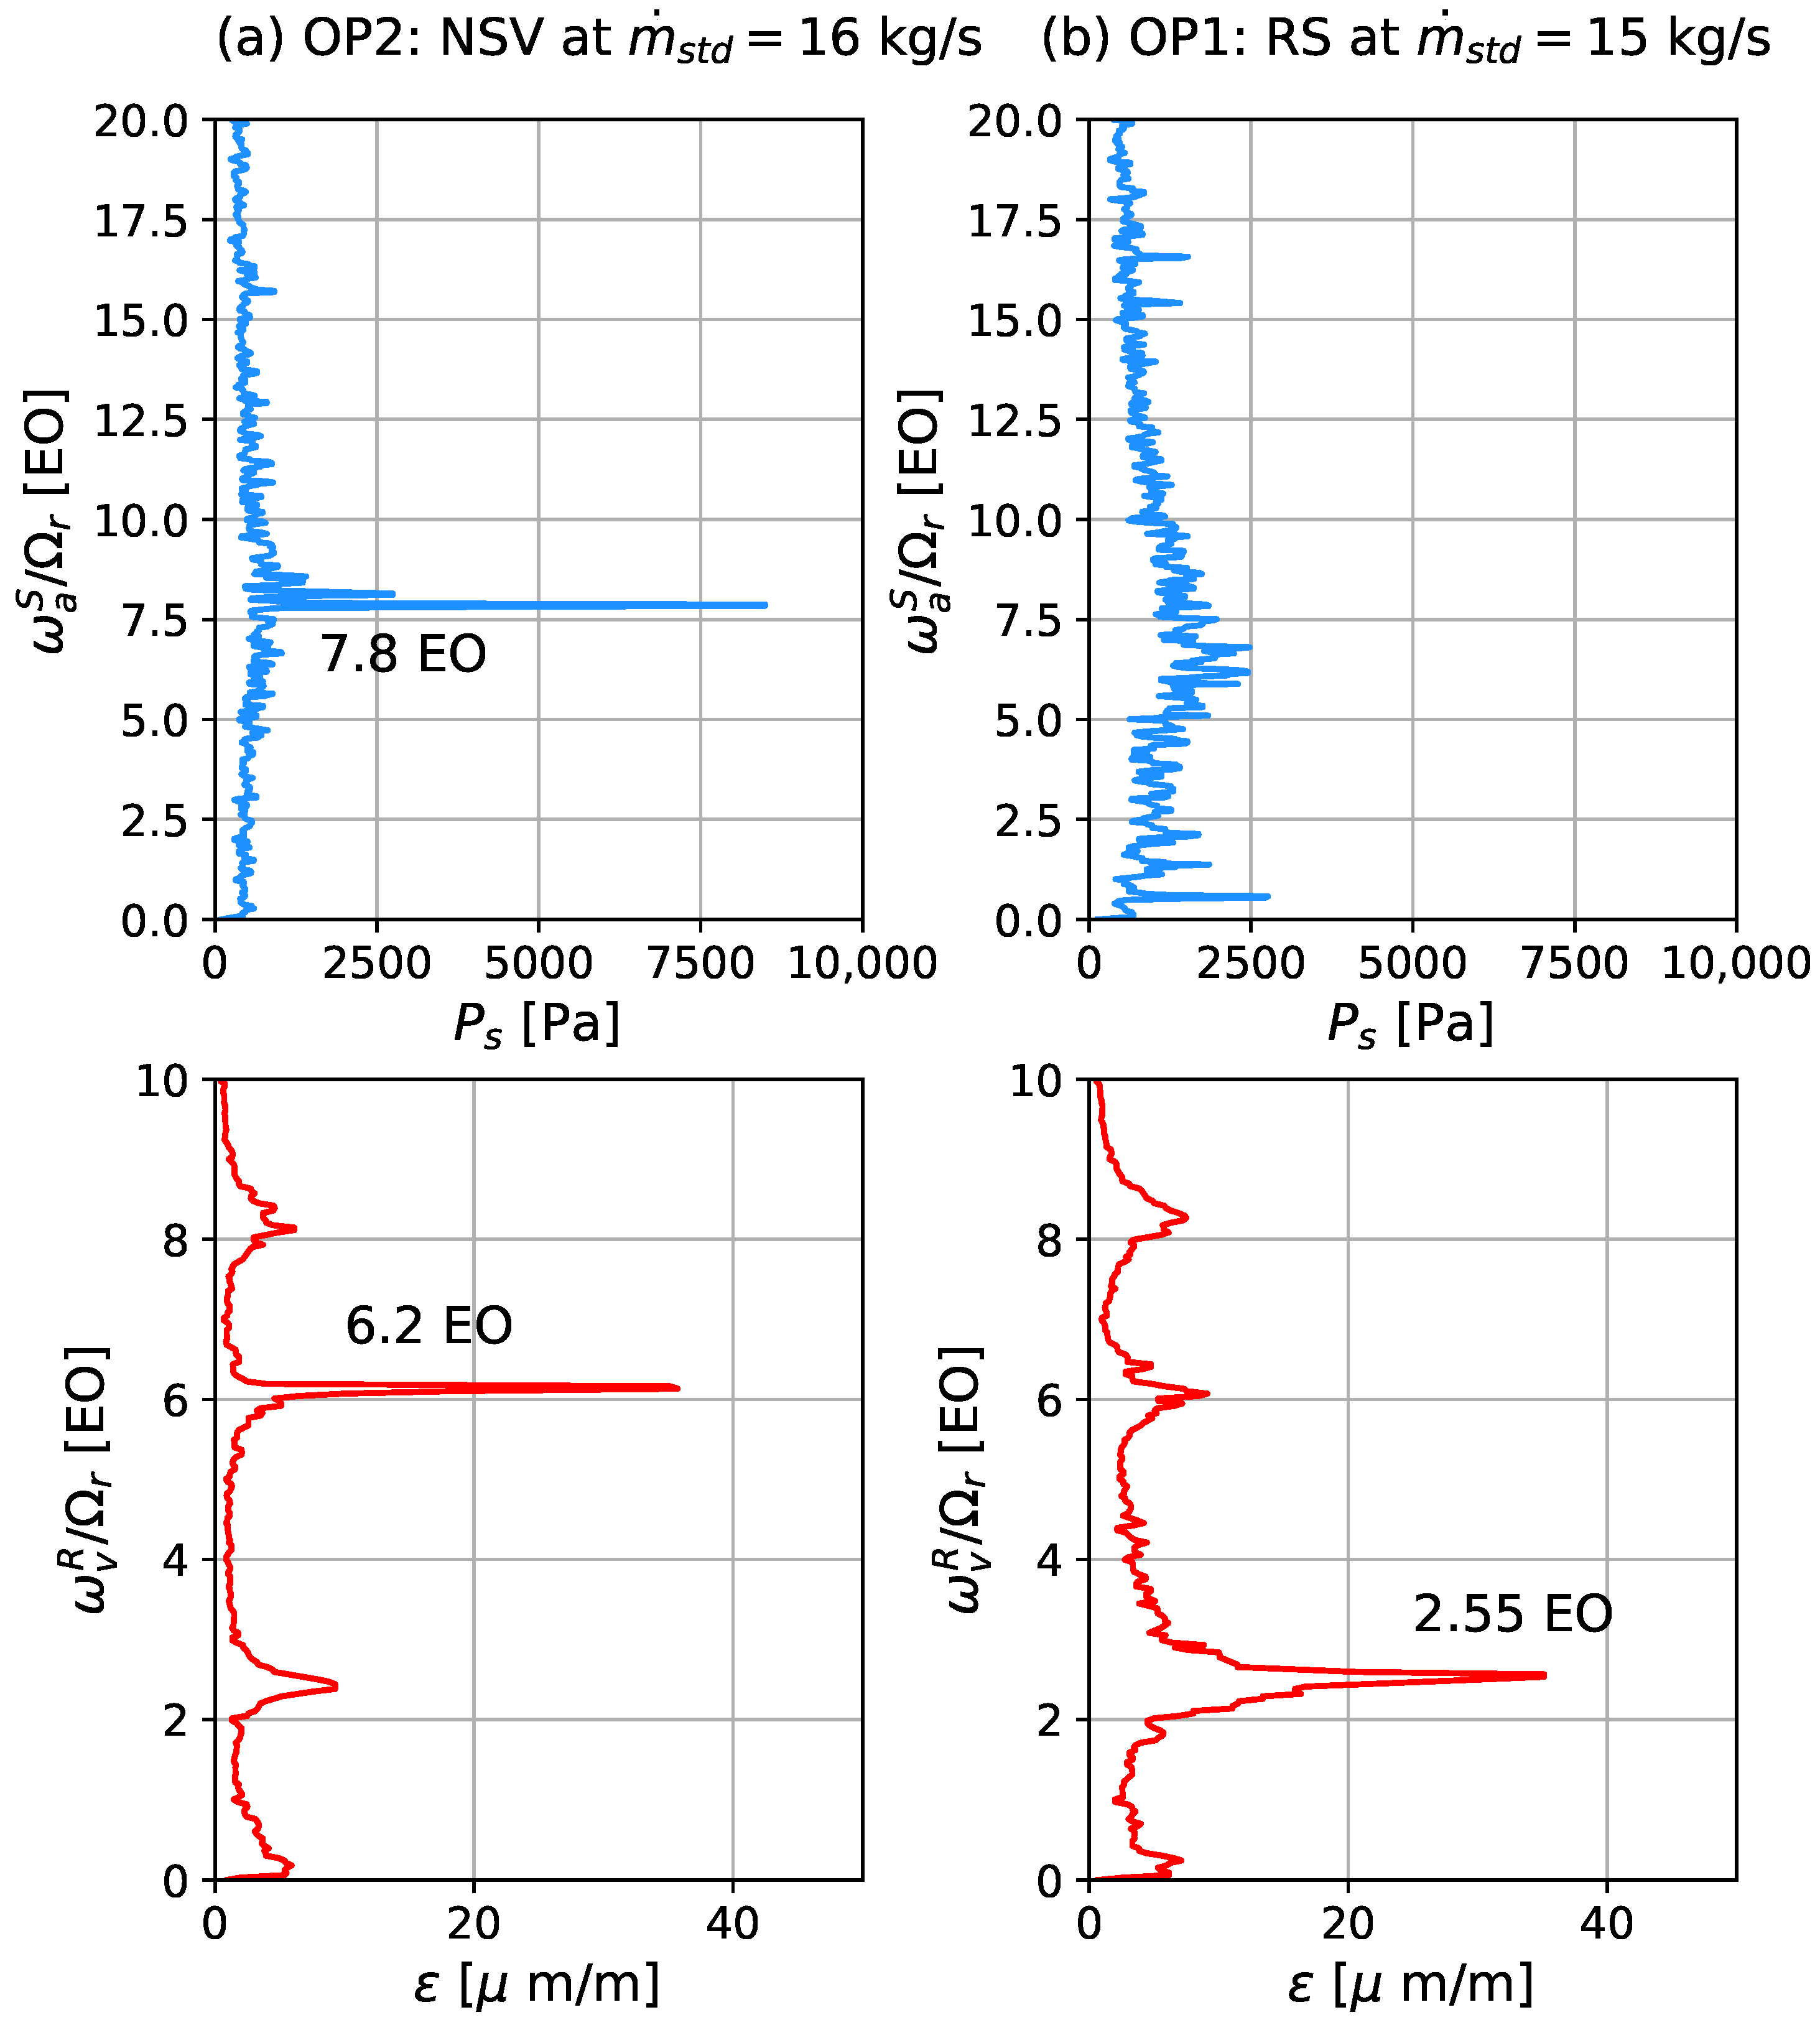
An extraction of the spectrum at OP2 is presented in
Figure 12a to allow for quantitative interpretation. A dominant peak is measured at a frequency of 7.8 EO and an amplitude of nearly 10 kPa. Associated vibration of Mode 2 is significant at 6.2 EO with an average amplitude of more than 15% of the critical limit. These values enable determination of the vibration pattern: a backward traveling aerodynamic disturbance of wave number
14 matches the dominant pressure peak in the stationary and the Mode 2 frequency peak in the relative frame of reference (
). The fan vibration pattern will be aliased to nodal diameter
. In the stationary frame the aerodynamic disturbance propagates at 56% of the rotor speed (
) which is in agreement with previously reported fan behaviour at higher speedlines [
13,
15].
With further reduced mass flow, a particular evolution of vibration amplitudes occurs. Towards 15 kg/s high amplitudes of Mode 1 are observed while activity of Mode 2 is reduced. Meanwhile, the pressure spectra still show broadband activity around 8 EO, but without pronounced peaks that could be associated to a lock-in. Instead, low-frequency peaks at multiples of 0.6 EO are prominent. The average amplitude of the pressure disturbances is lower than at OP2, even though the blade vibration of Mode 1 is significant. This spectral signature is typically observed at rotating stall conditions, but the pressure amplitude is low, with negligible off-resonant forcing (expected at 0.4 EO and harmonics) and a drop in aerodynamic performance was not observed in
Figure 10. Hence the present phenomenon is characterized between the small-scale disturbances leading to NSV, and typical rotating stall.
As no direct determination of an interaction mode is possible, further decomposition of the coupling is necessary.
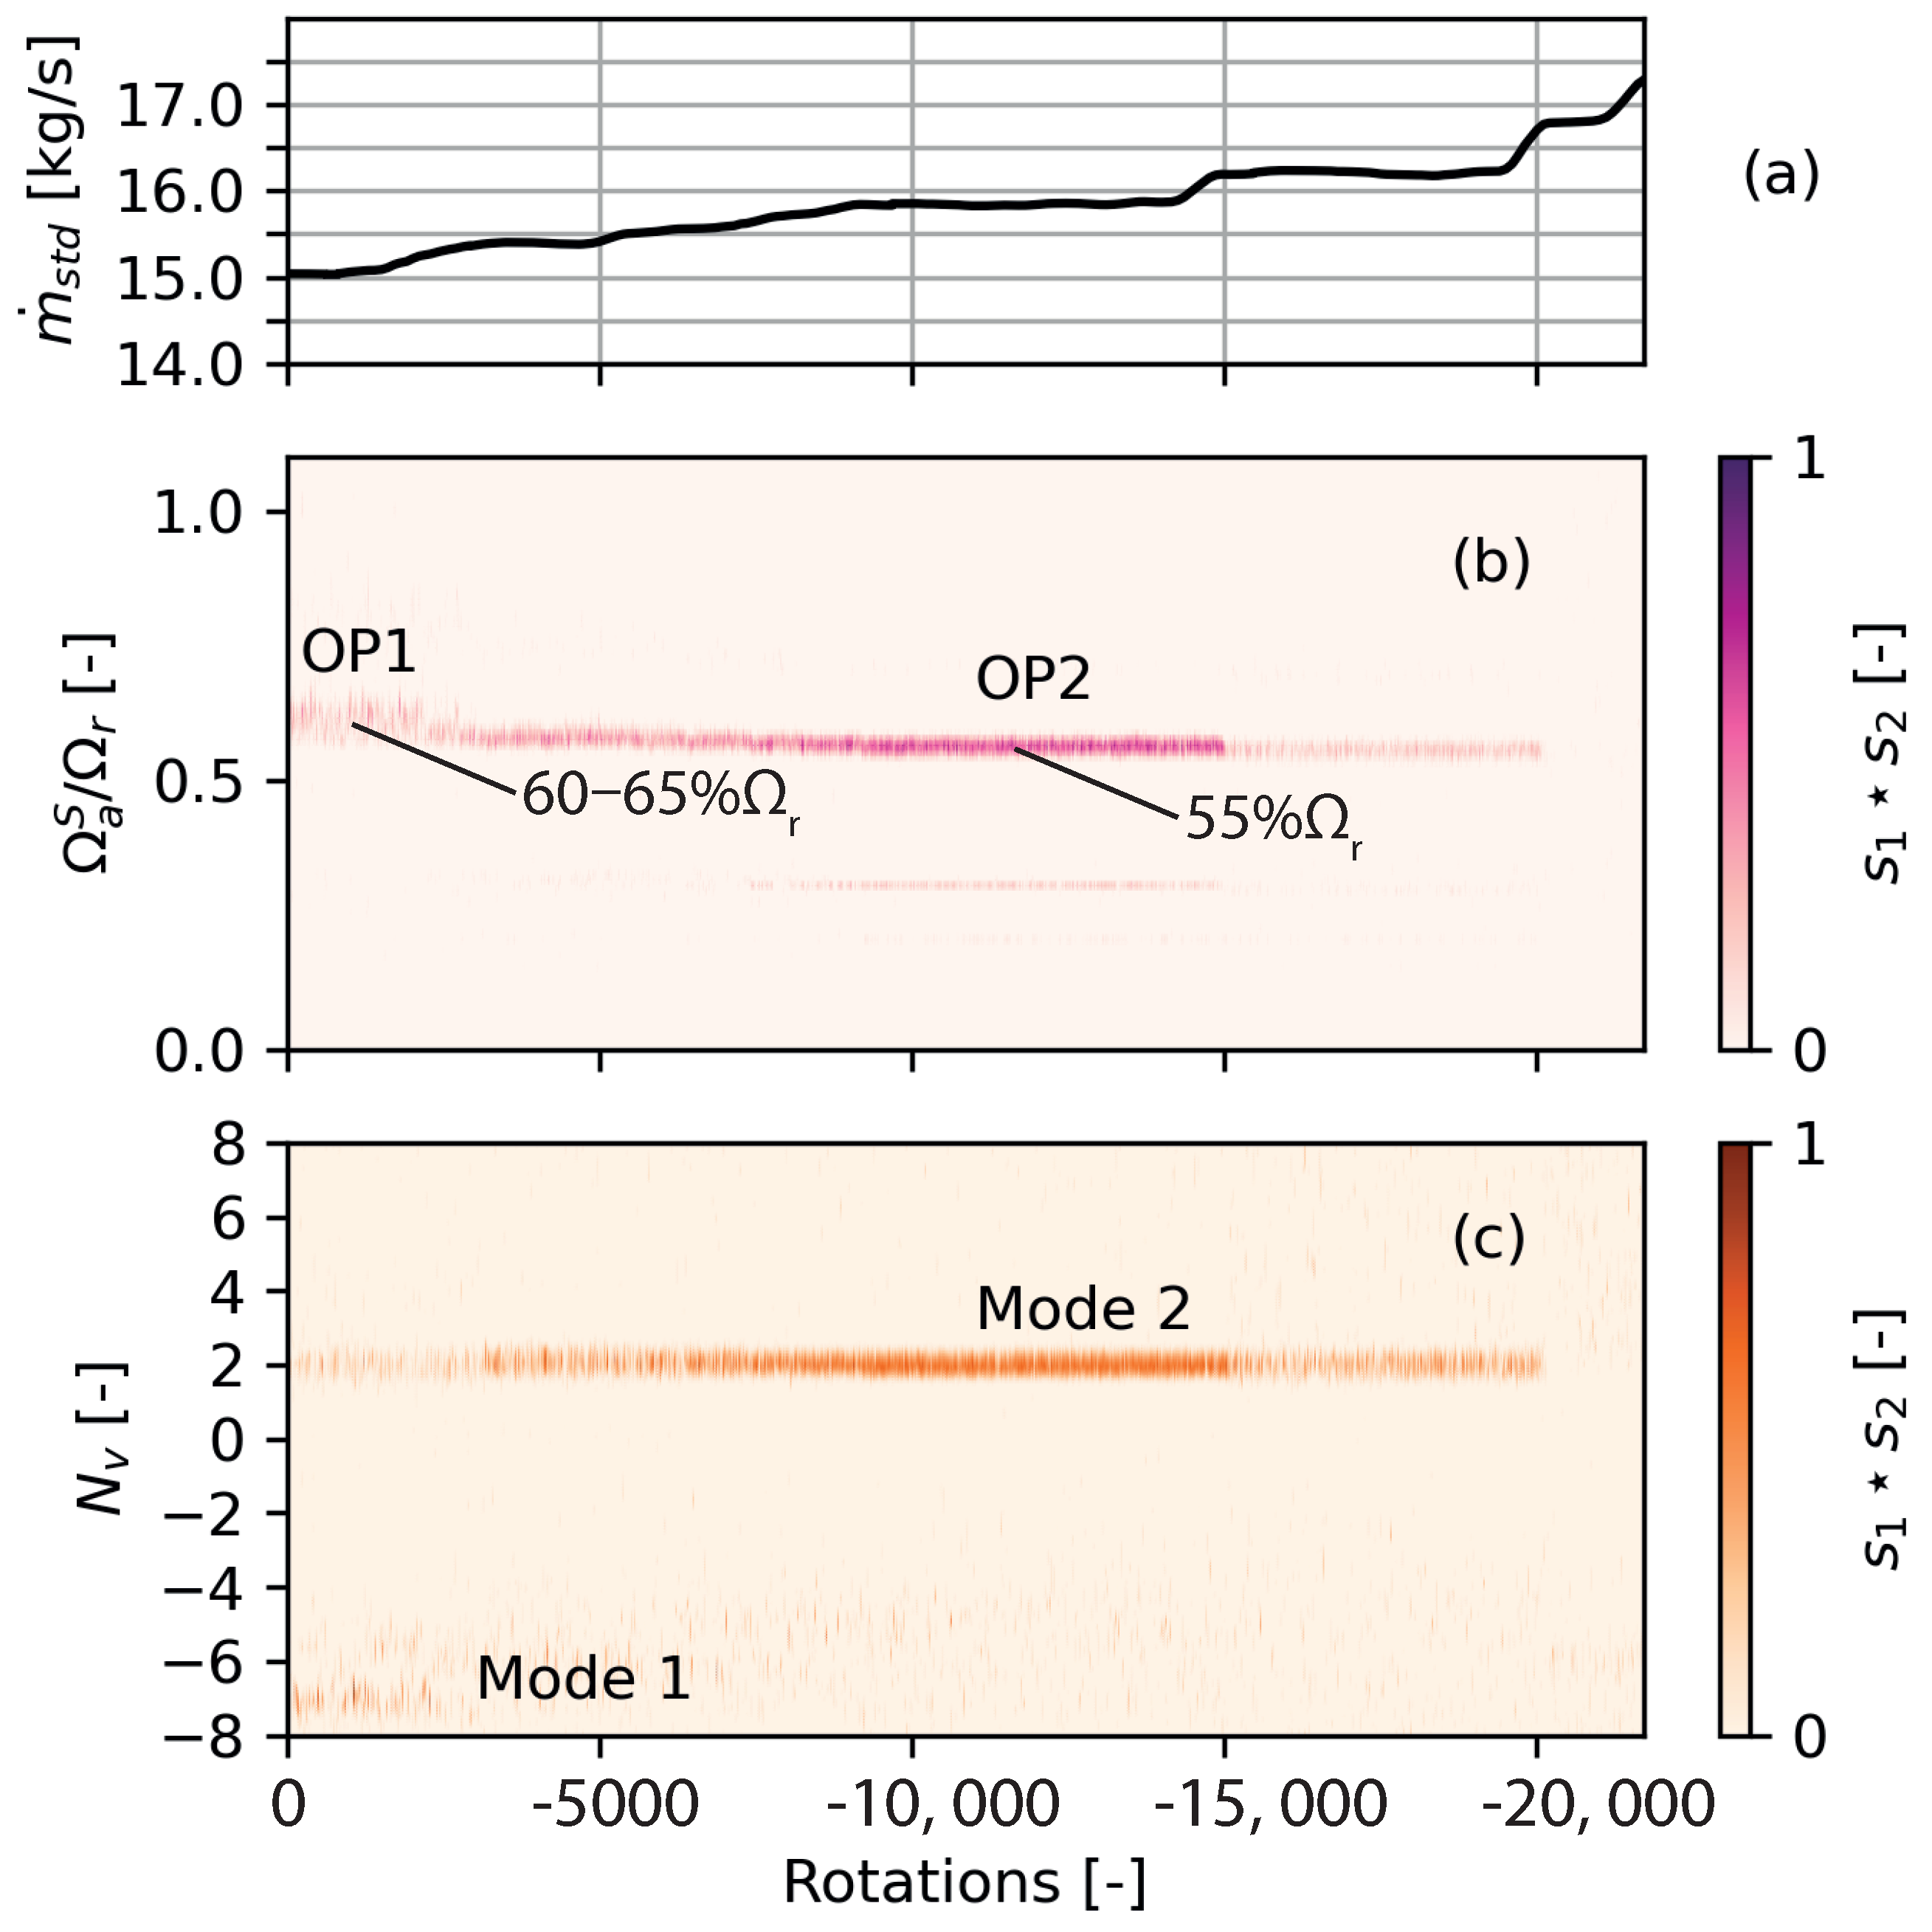
Figure 13 shows the temporal evolution of the mass flow during reduction in mass flow (going from right to left in the figure) at 55% speed (a), along with the evolution of the propagation speed of aerodynamic disturbances (b) and the evolution of the most dominant nodal diameter (c). The propagation speed is obtained by computing pairwise cross-correlations between wall pressure sensors located in the leading edge plane. Applying the same post-processing to strain gauge signals, band pass filtered around the blade eigenfrequency, reveals the dominant structural assembly modes (
) [
15].
Above 16.5 kg/s, a propagation speed of
is observed. In
Figure 13, at OP2 conditions, the coherence increases for a propagation speed of
rotor speed which is in agreement with the interaction mode inferred from the spectra discussed before. At the same time, the determination of the dominant nodal diameter yields
for Mode 2. For Mode 1 no clear vibration pattern is derived. As the mass flow decreases further, the pressure signals are significantly less coherent and the cross-correlation shows a slight increase in propagation speed, stabilizing around an average value between 60 and 65%
at OP1. Considering the minimum of blade-wise cross correlations the graph in
Figure 13c indicates a weak coherence for
on Mode 1.
The strain gauge data allows for a deeper analysis of the vibration pattern by considering the inter-blade phase angle between adjacent blades.
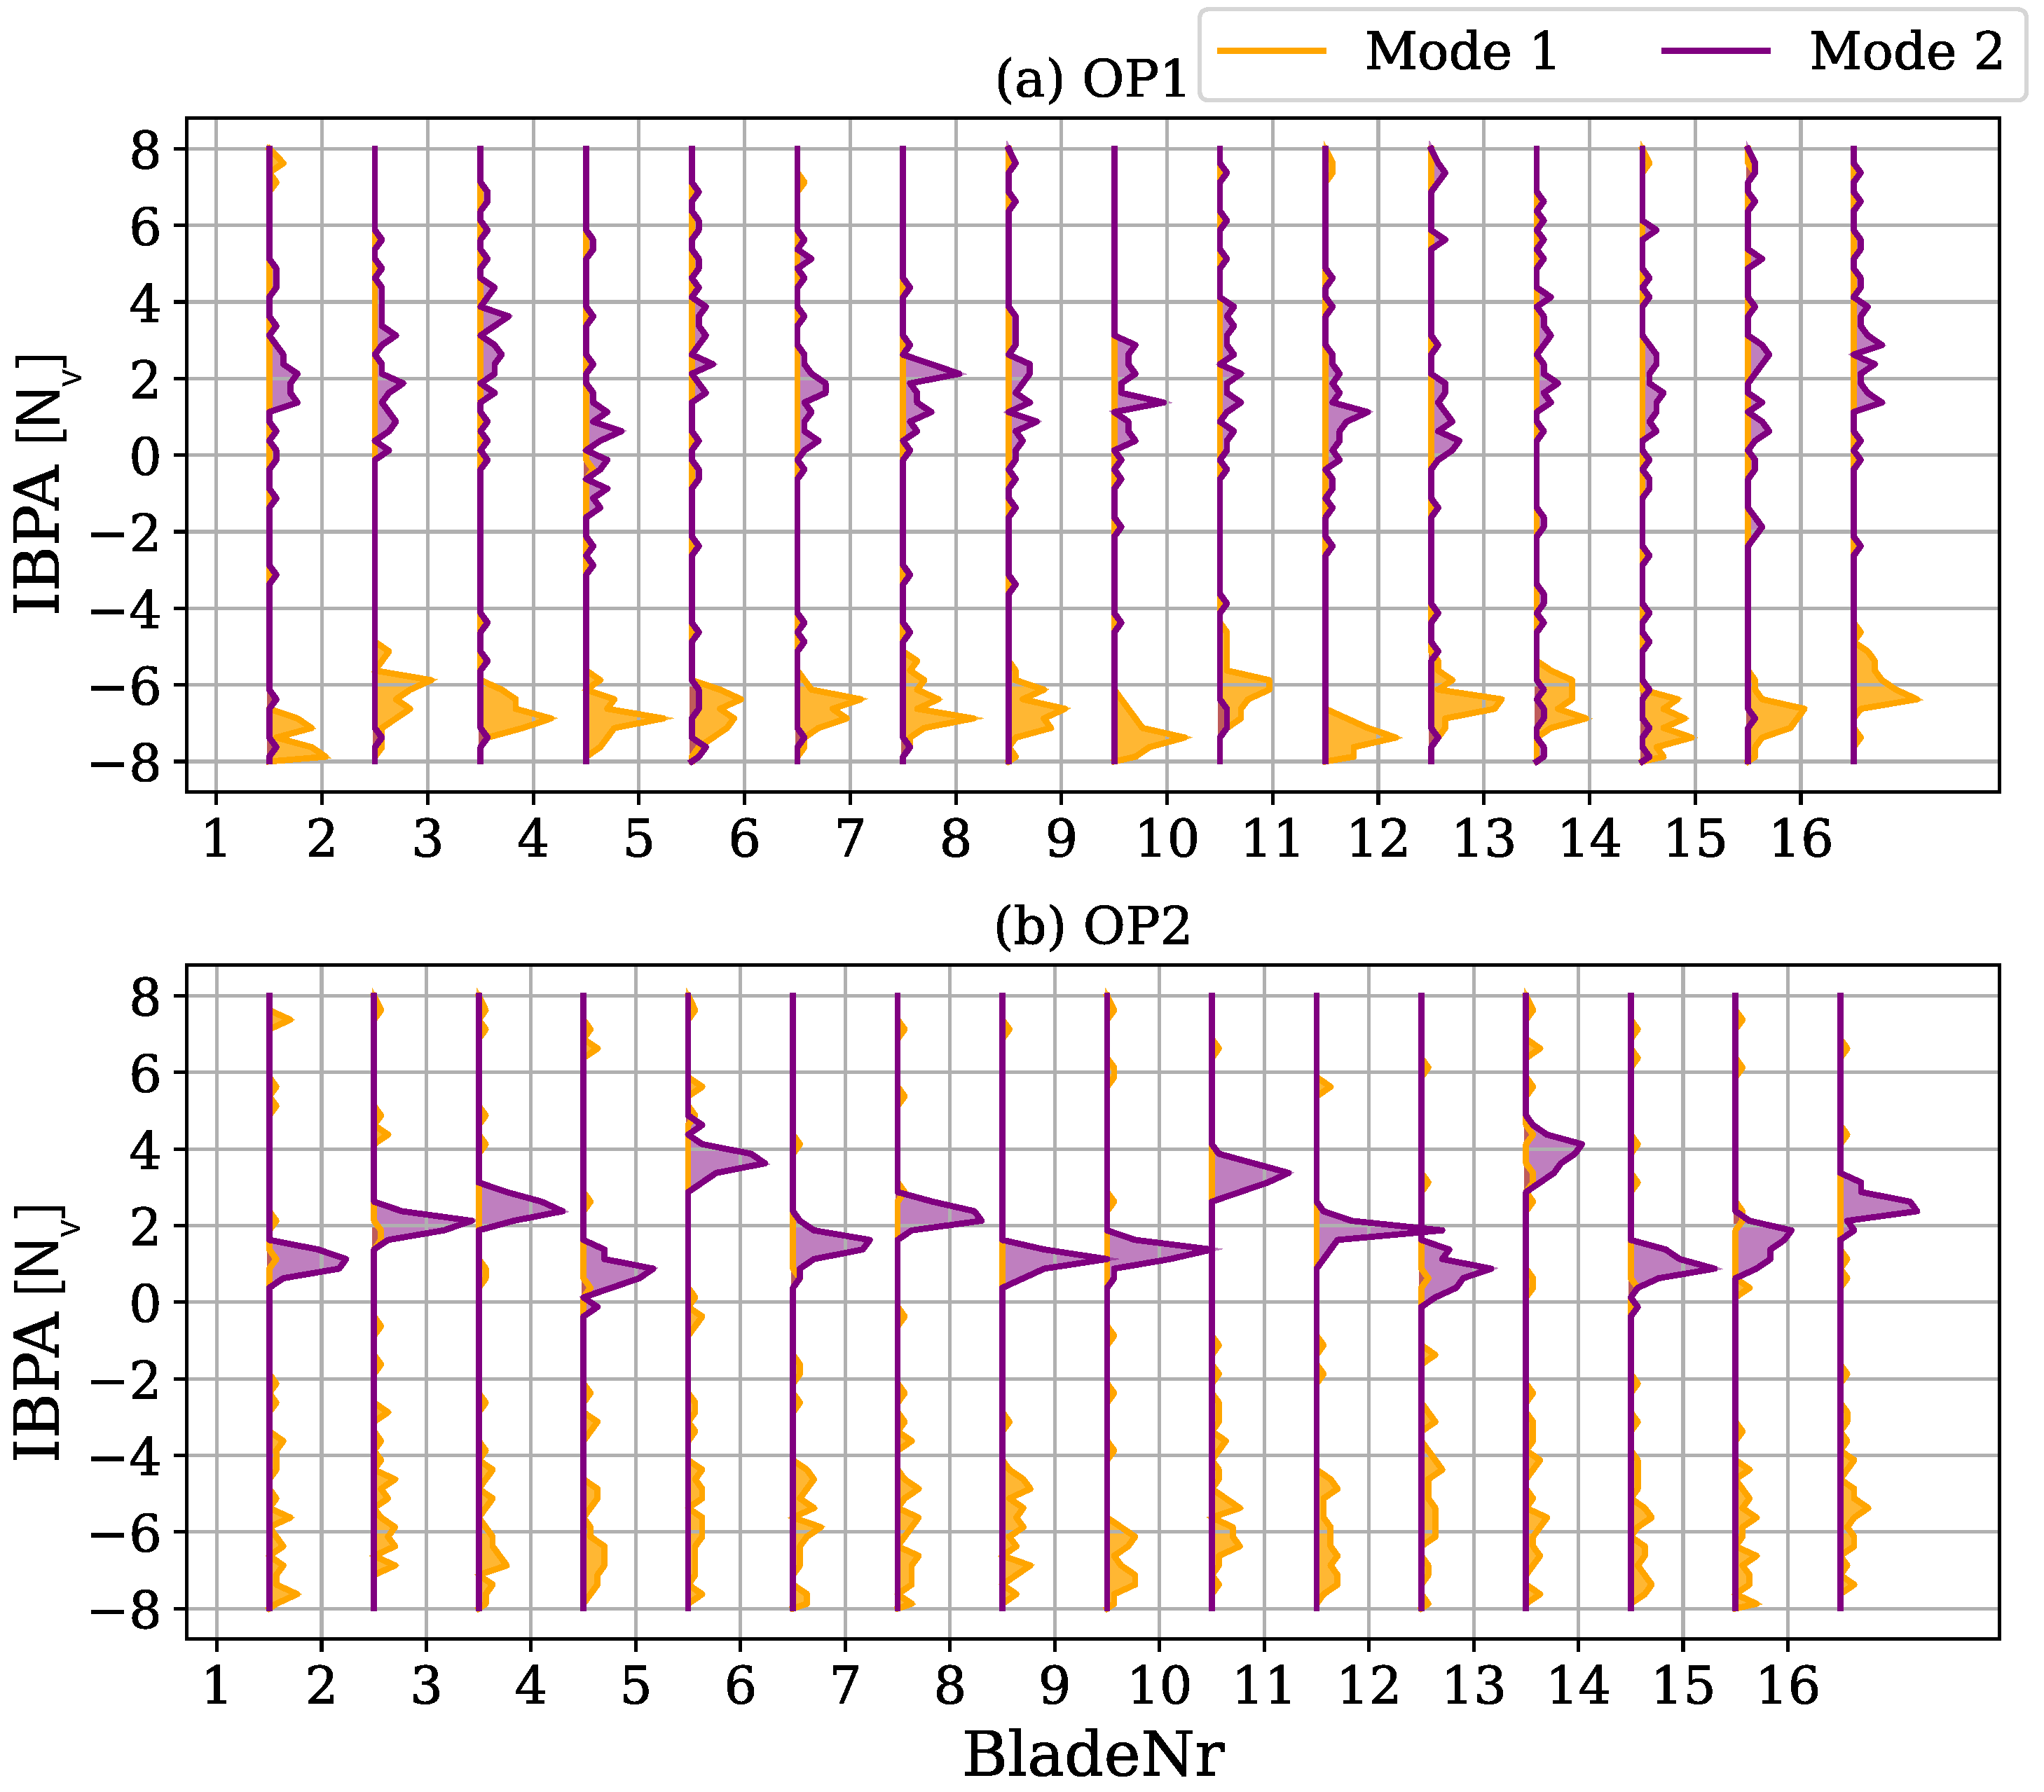
Figure 14 shows the histograms of pairwise cross correlations at the two operating points, indicating the phase of the respective mode between each blade pair. To show this graph in terms of nodal diameter (
), the average frequency of each blade pair was considered. In sliding windows of 0.1 seconds the interphase of the signals was derived and accumulated in the respective histograms. In contrast to the previously shown minimum correlation plot (
Figure 13c), this representation emphasizes sectorwise variations. At OP1, the dominant
is clearly observed in all blade pairs. Mode 2 is scattering widely around
. In greater detail, the response of Mode 2 is observed at OP2, with a highly consistent but bladewise varying phase pattern. On average, the previously discussed
is derived, but individual blade pairs oscillate from
(between Blade 1 and 2) through
(between Blade 13 and 14). At this condition Mode 1 is vibrating in a mostly incoherent pattern.
These results confirm the assumption that at OP1 propagating disturbances of low aerodynamic wave number are responsible for the spectral peaks in
Figure 11 and
Figure 12 at OP1. The IBPA read in
Figure 14a for Mode 1 can be directly considered as the aerodynamic wave number of the disturbances. A dominant wave number of
-7 propagating with a speed of 64% of the rotor speed in the stationary frame of reference coincides with the first blade mode. To avoid interference with nomenclature established in literature, we will refer to the disturbances at OP1 as (multi-cell) part span stall.
Comparative Analysis
Even though the critical vibration mode switched from Mode 2 to Mode 1 in a narrow range of operation, at both operating conditions OP1 and OP2 a distinct vibration pattern with similar amplitude was observed. This could not be explained with structural mistuning which is different for Mode 1 and 2 [
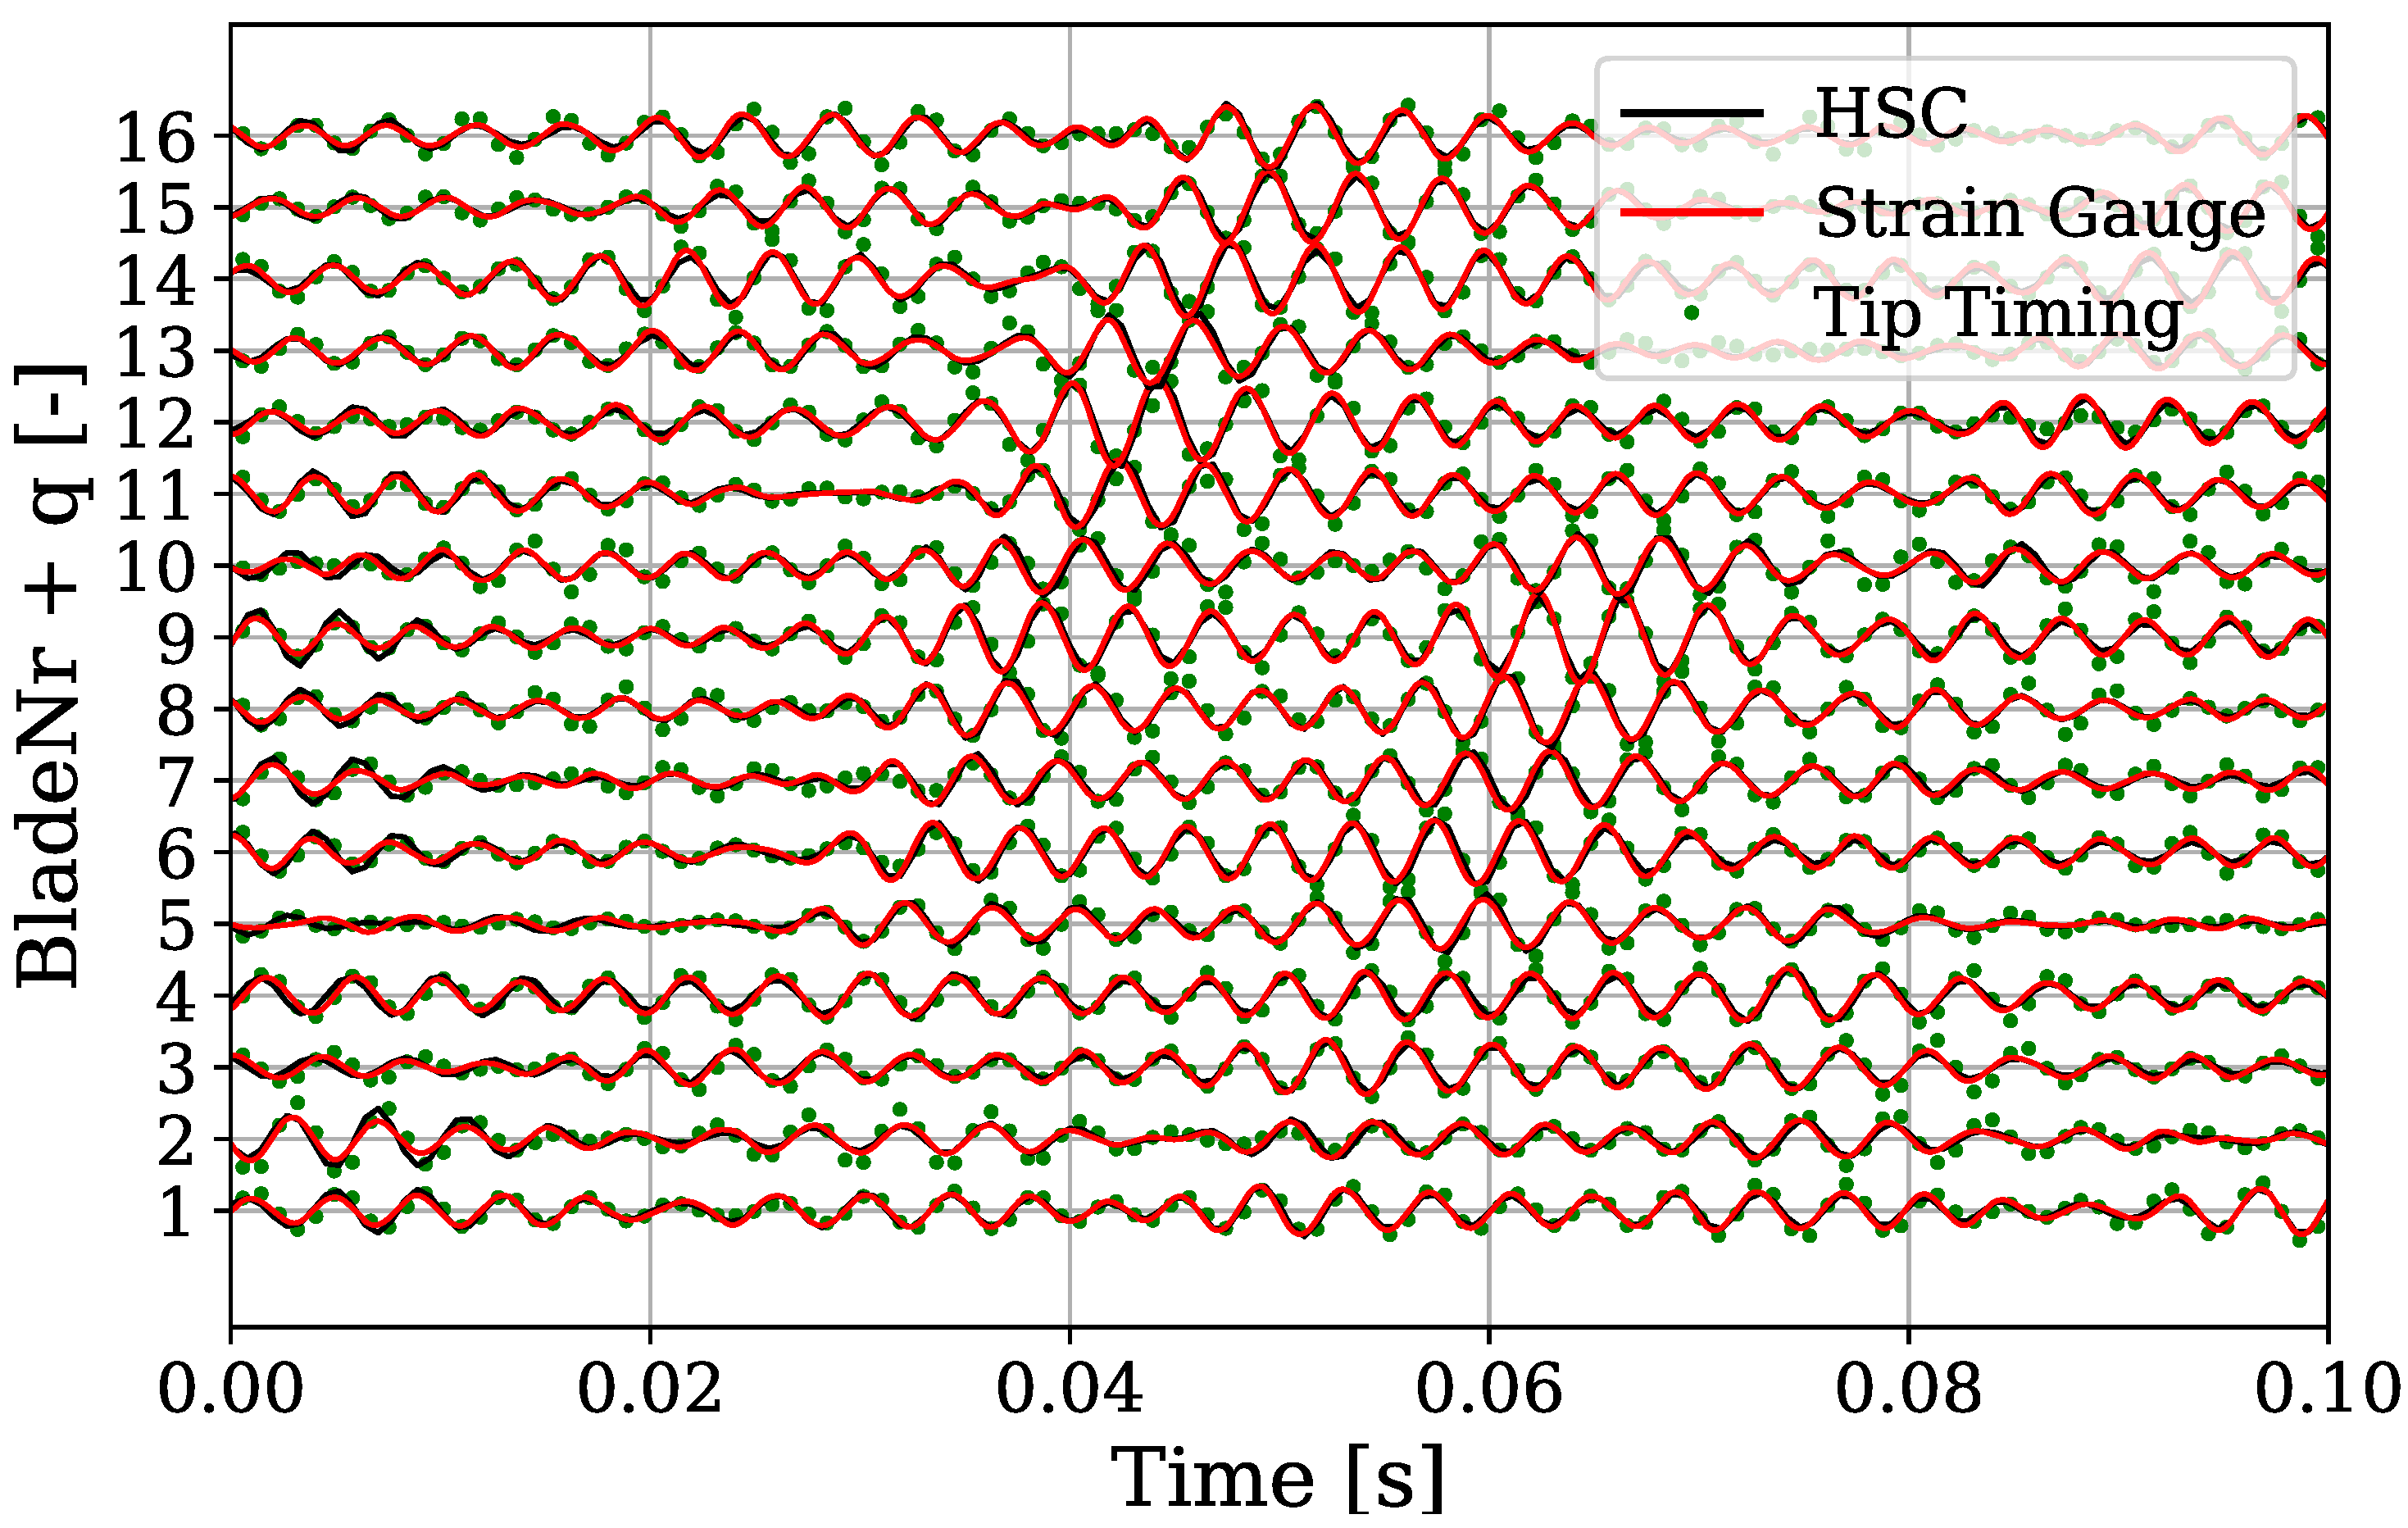
15] and raised doubts in the accuracy of the measurement. Hence, additionally to the regular strain gauges, and the tip timing, an independent high-speed camera was installed and synchronized. At constant operation at OP1,
Figure 15 shows the temporal evolution of the measured blade vibration for each blade as a function of time for all three measurement systems (≈10 shaft revolutions). The data is been band pass filtered around Mode 1 (250 Hz, ±80 Hz), and synchronous content was removed through subtraction of a sliding ensemble average of 10 revolutions. All values have been scaled to scope limit with modal amplitude
.
It can be seen, that strain gauges and a high-speed camera (HSC) provide almost identical results. The non-homogeneously sampled tip timing captures high-amplitude oscillations well, but individual measurements scatter slightly. This snapshot is representative for the observations at OP1, clearly highlighting the circumferential propagation of high intensity disturbances, followed by periods of low activity.
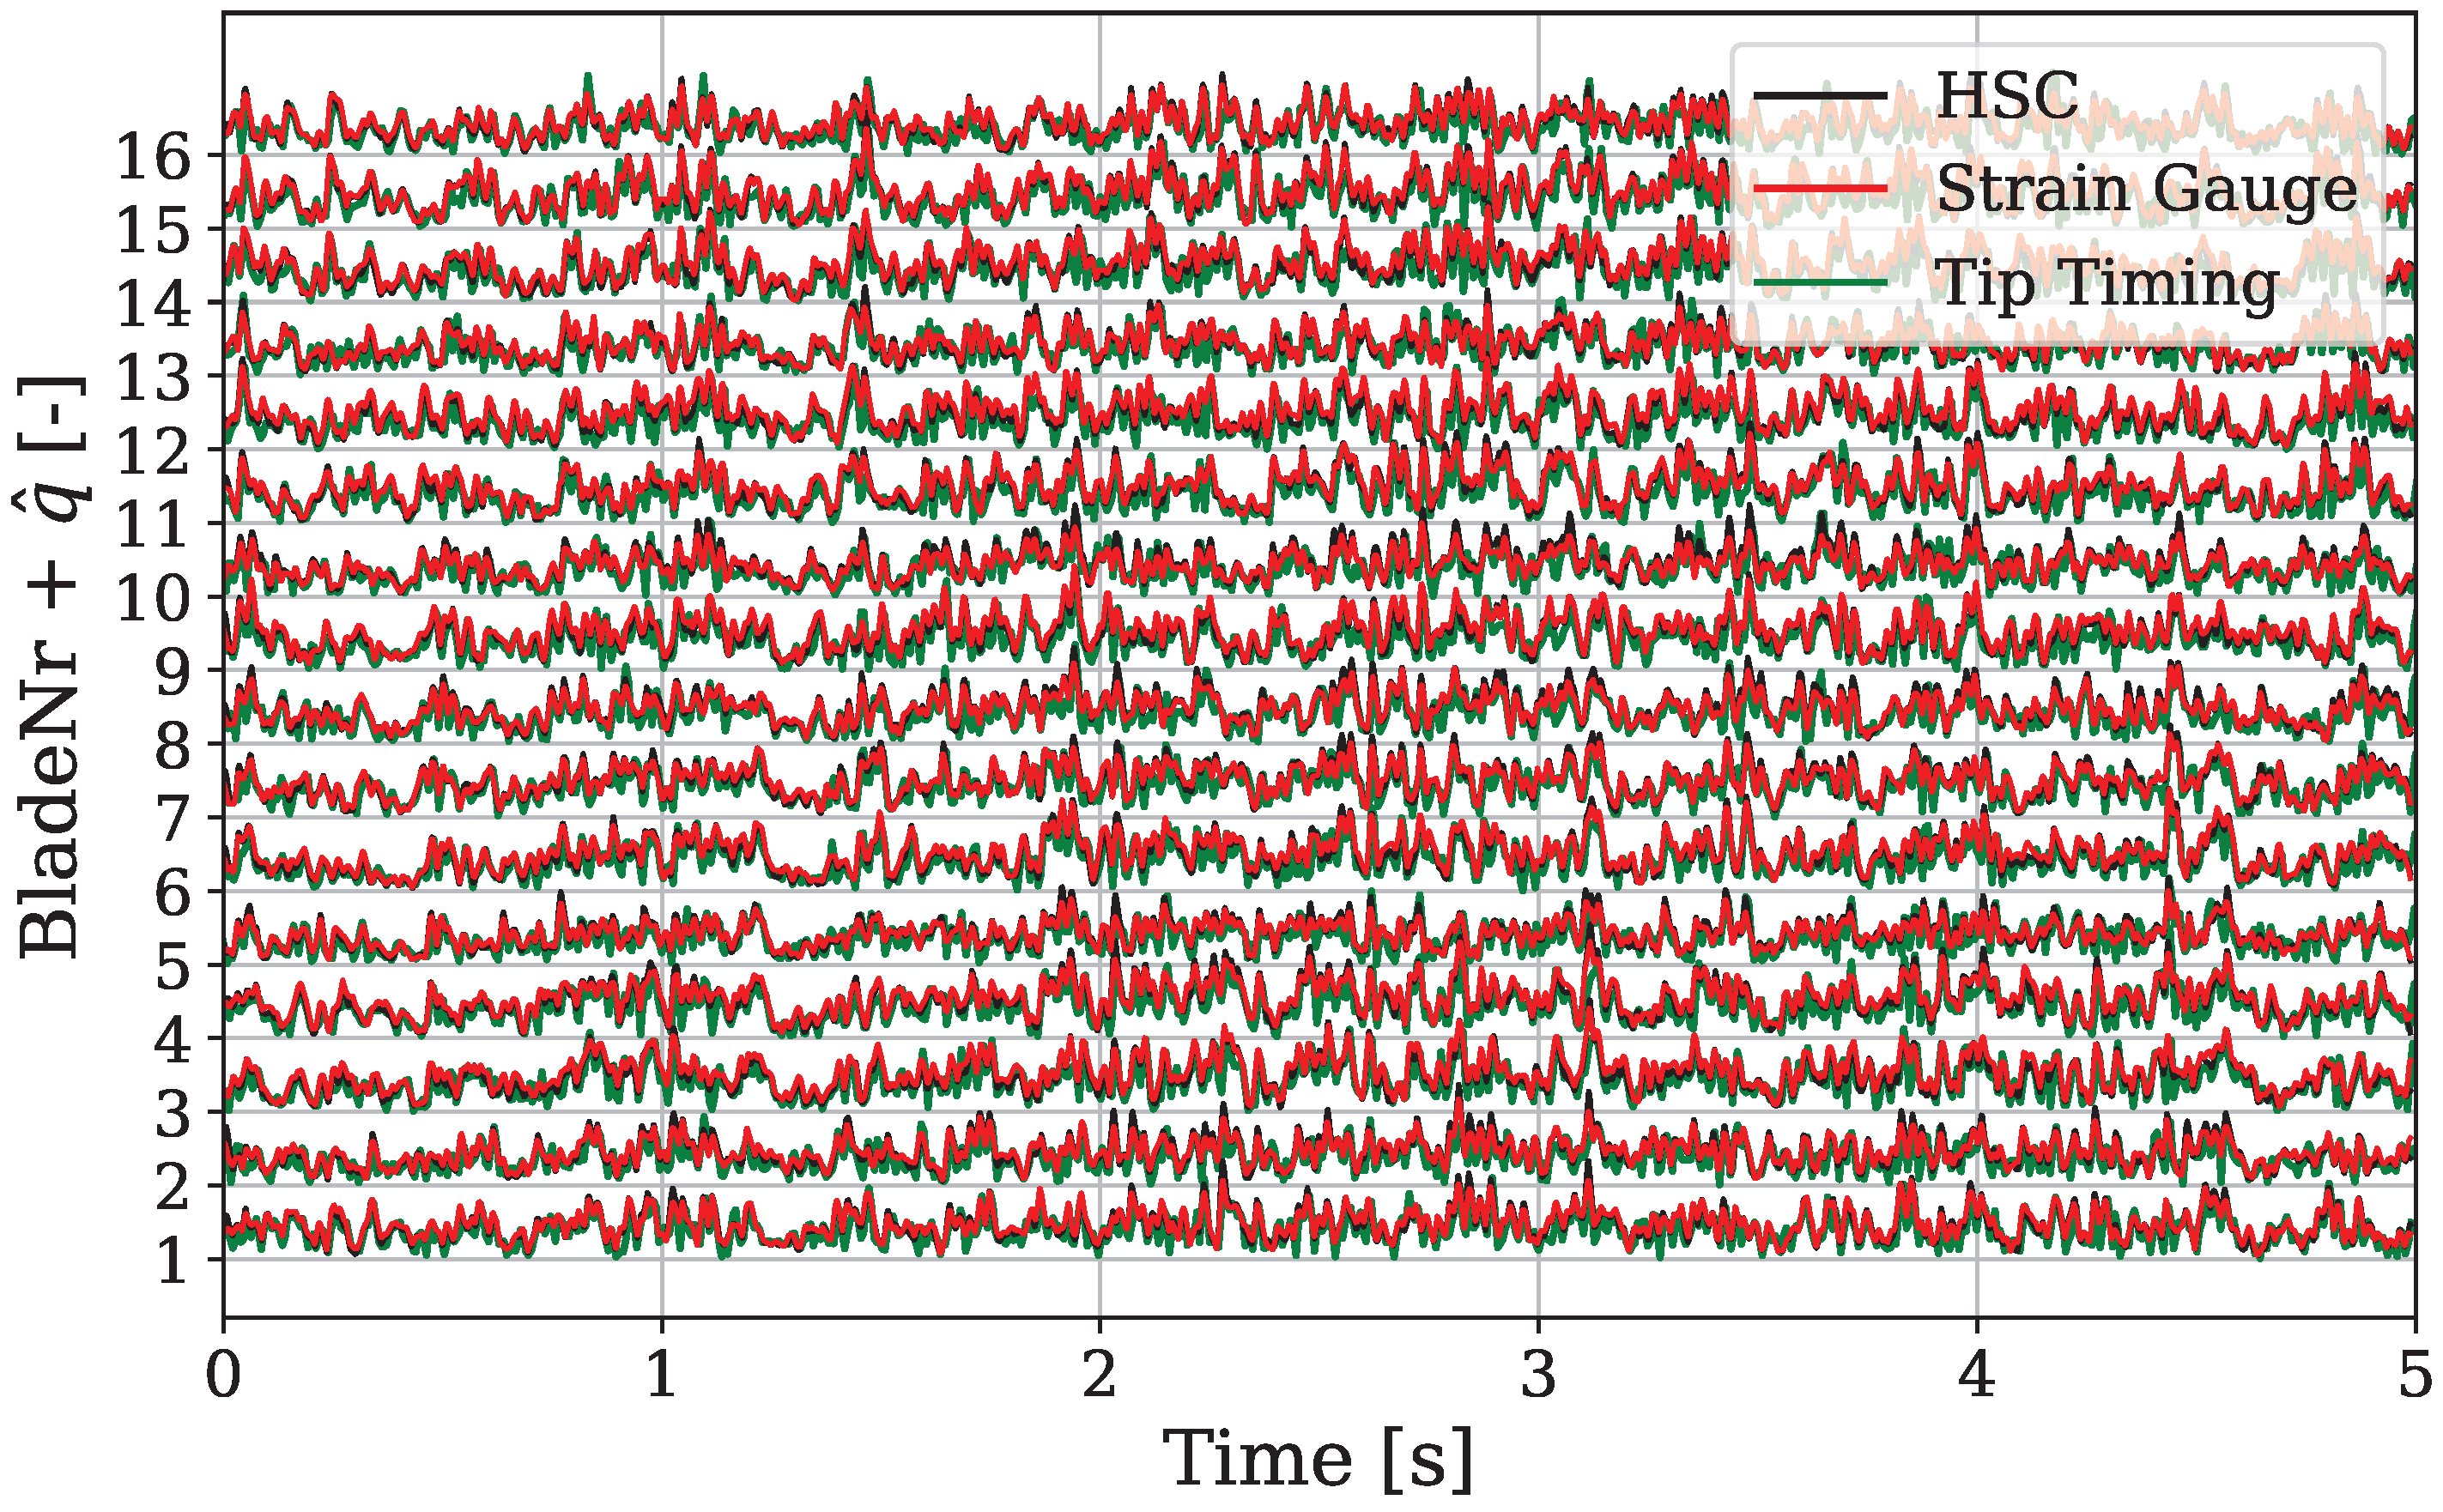
Considering a longer measurement period,
Figure 16 shows the amplitude evolution over a range of 500 fan revolutions (≈5 s), with average amplitudes calculated over a window of 0.1 s (overlap 50%). Here, the three measurement systems show barely distinguishable results, well representing temporal variations of the modal amplitude. This graph emphasizes the non-periodic behaviour of the fan at OP1 conditions, with erratic occurrences of high-amplitude vibration, extending mostly uniform around the whole fan circumference. It also highlights the variety of aerodynamic disturbance characteristics at such conditions, which stand in clear contrast to the deterministic onset of rotating stall, reported for different types of fans at high-speed conditions [
20].
While temporal history of filtered signals for the dominant Mode 1 at OP1 was mostly similar for all the techniques used, spectral analysis exhibits differences: a single blade spectrum is provided for two operating conditions OP1 and OP2 in
Figure 17 for BladeNr 1. The graph shows the raw spectra without frequency filtering, scaled to Goodman scope limit of Mode 1
Figure 17a and to Mode 2
Figure 17b as those were most significant at respective operating conditions. In both cases, HSC and strain gauges provide similar response near the relevant modes 1 and 2 though the HSC is limited to 800 Hz acquisition frequency, preventing it from capturing Mode 3. Tip timing shows aliased spectral peaks resulting from under-sampling and would require additional post-processing. All measurement systems show equal modal amplitude of 15% of the Goodman scope limit for Mode 2 at OP2, while at OP1, the modal amplitude reaches 20% for Mode 1.
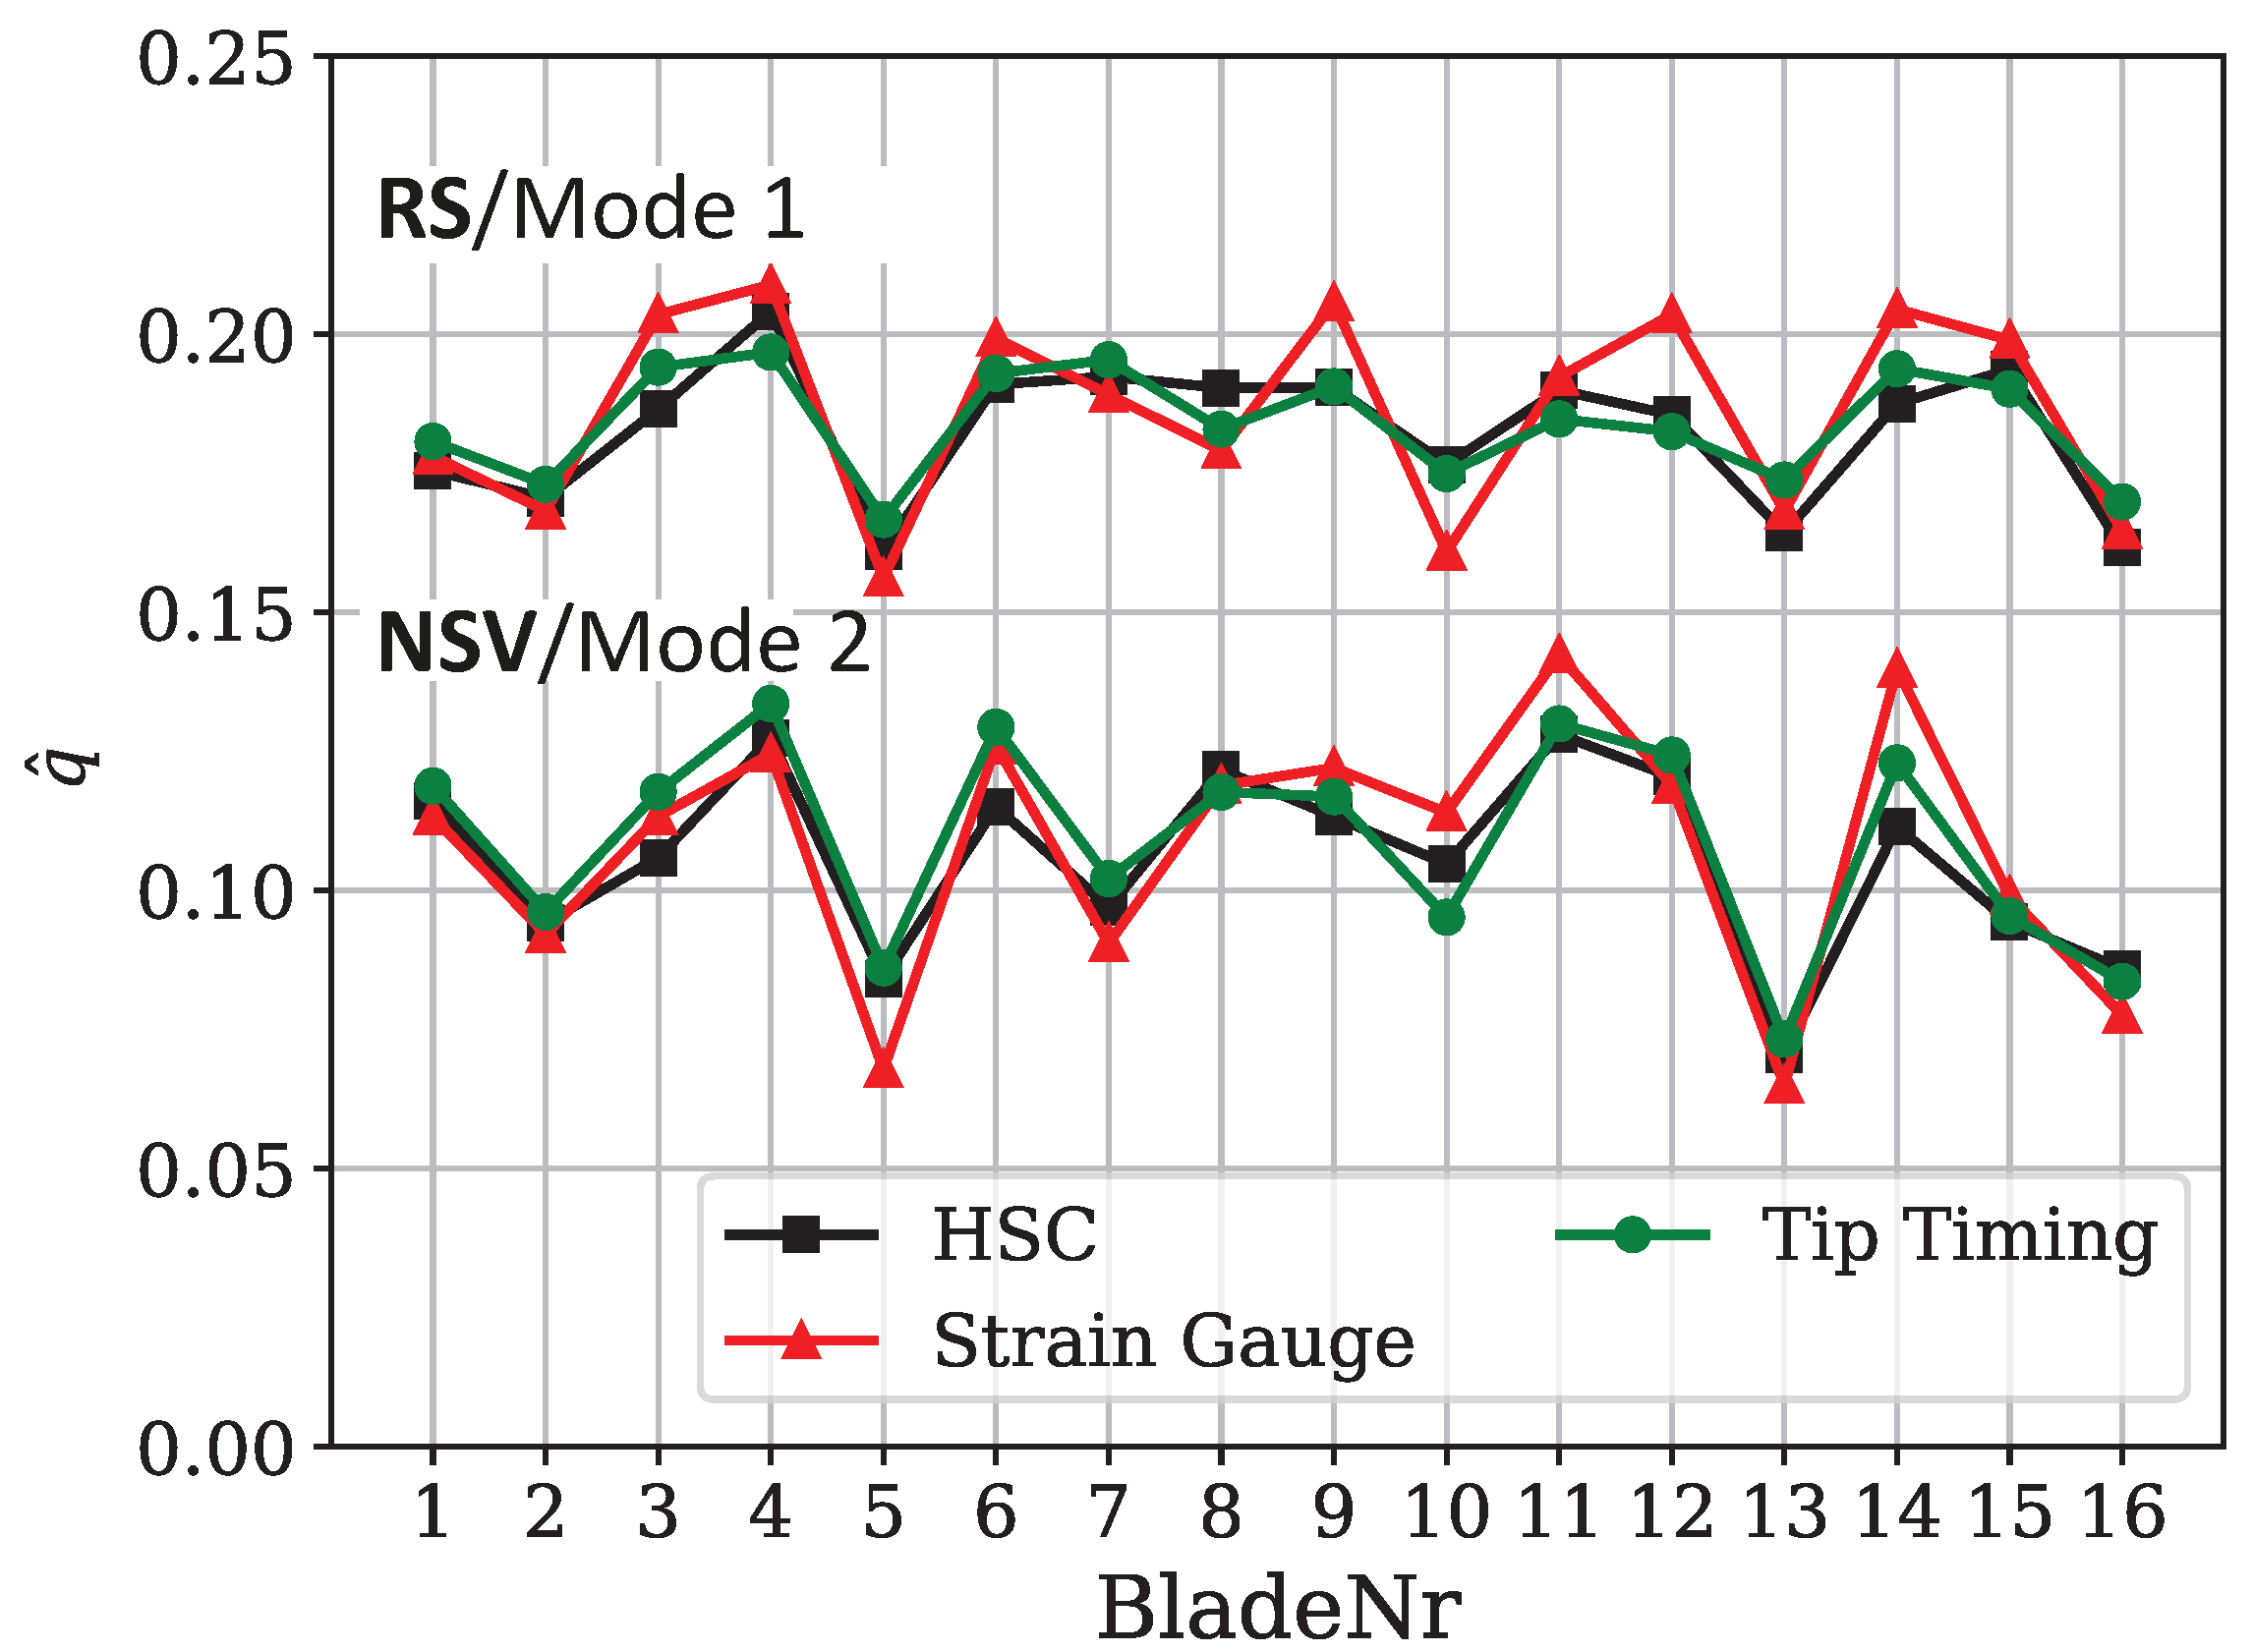
Averaging the amplitude evolution over a period of 5 s (which was the limit of possible HSC acquisition) gives the results presented in
Figure 18. This graph illustrates a non-uniform vibration amplitude pattern, with significant blade-to-blade amplitude variation. All three measurement systems show comparable values, though tip timing though the high-speed camera seems more consistent. The slight deviation of the strain gauges is attributed to the sensitivity variation discussed above, which may be subject to degradation between the rotating experiments and calibration after disassembly. Yet, average modal amplitude is extremely well reproduced by all systems with maximum deviations of 4% of the scope limit between all measurement systems (BladeNr 14 at OP2, HSC vs Strain Gauge).
To investigate the cause for the variation of blade vibration amplitudes, different parameters need to be considered. The study presented in [
15] revealed a dependence of the vibration phase on the structural mistuning pattern. This pattern is yet very different between Mode 1 and Mode 2 (see [
15]), whereas the vibration amplitude pattern in
Figure 18 is consistent across modes. Hence, geometrical variations related to manufacturing tolerances are of interest. The study of [
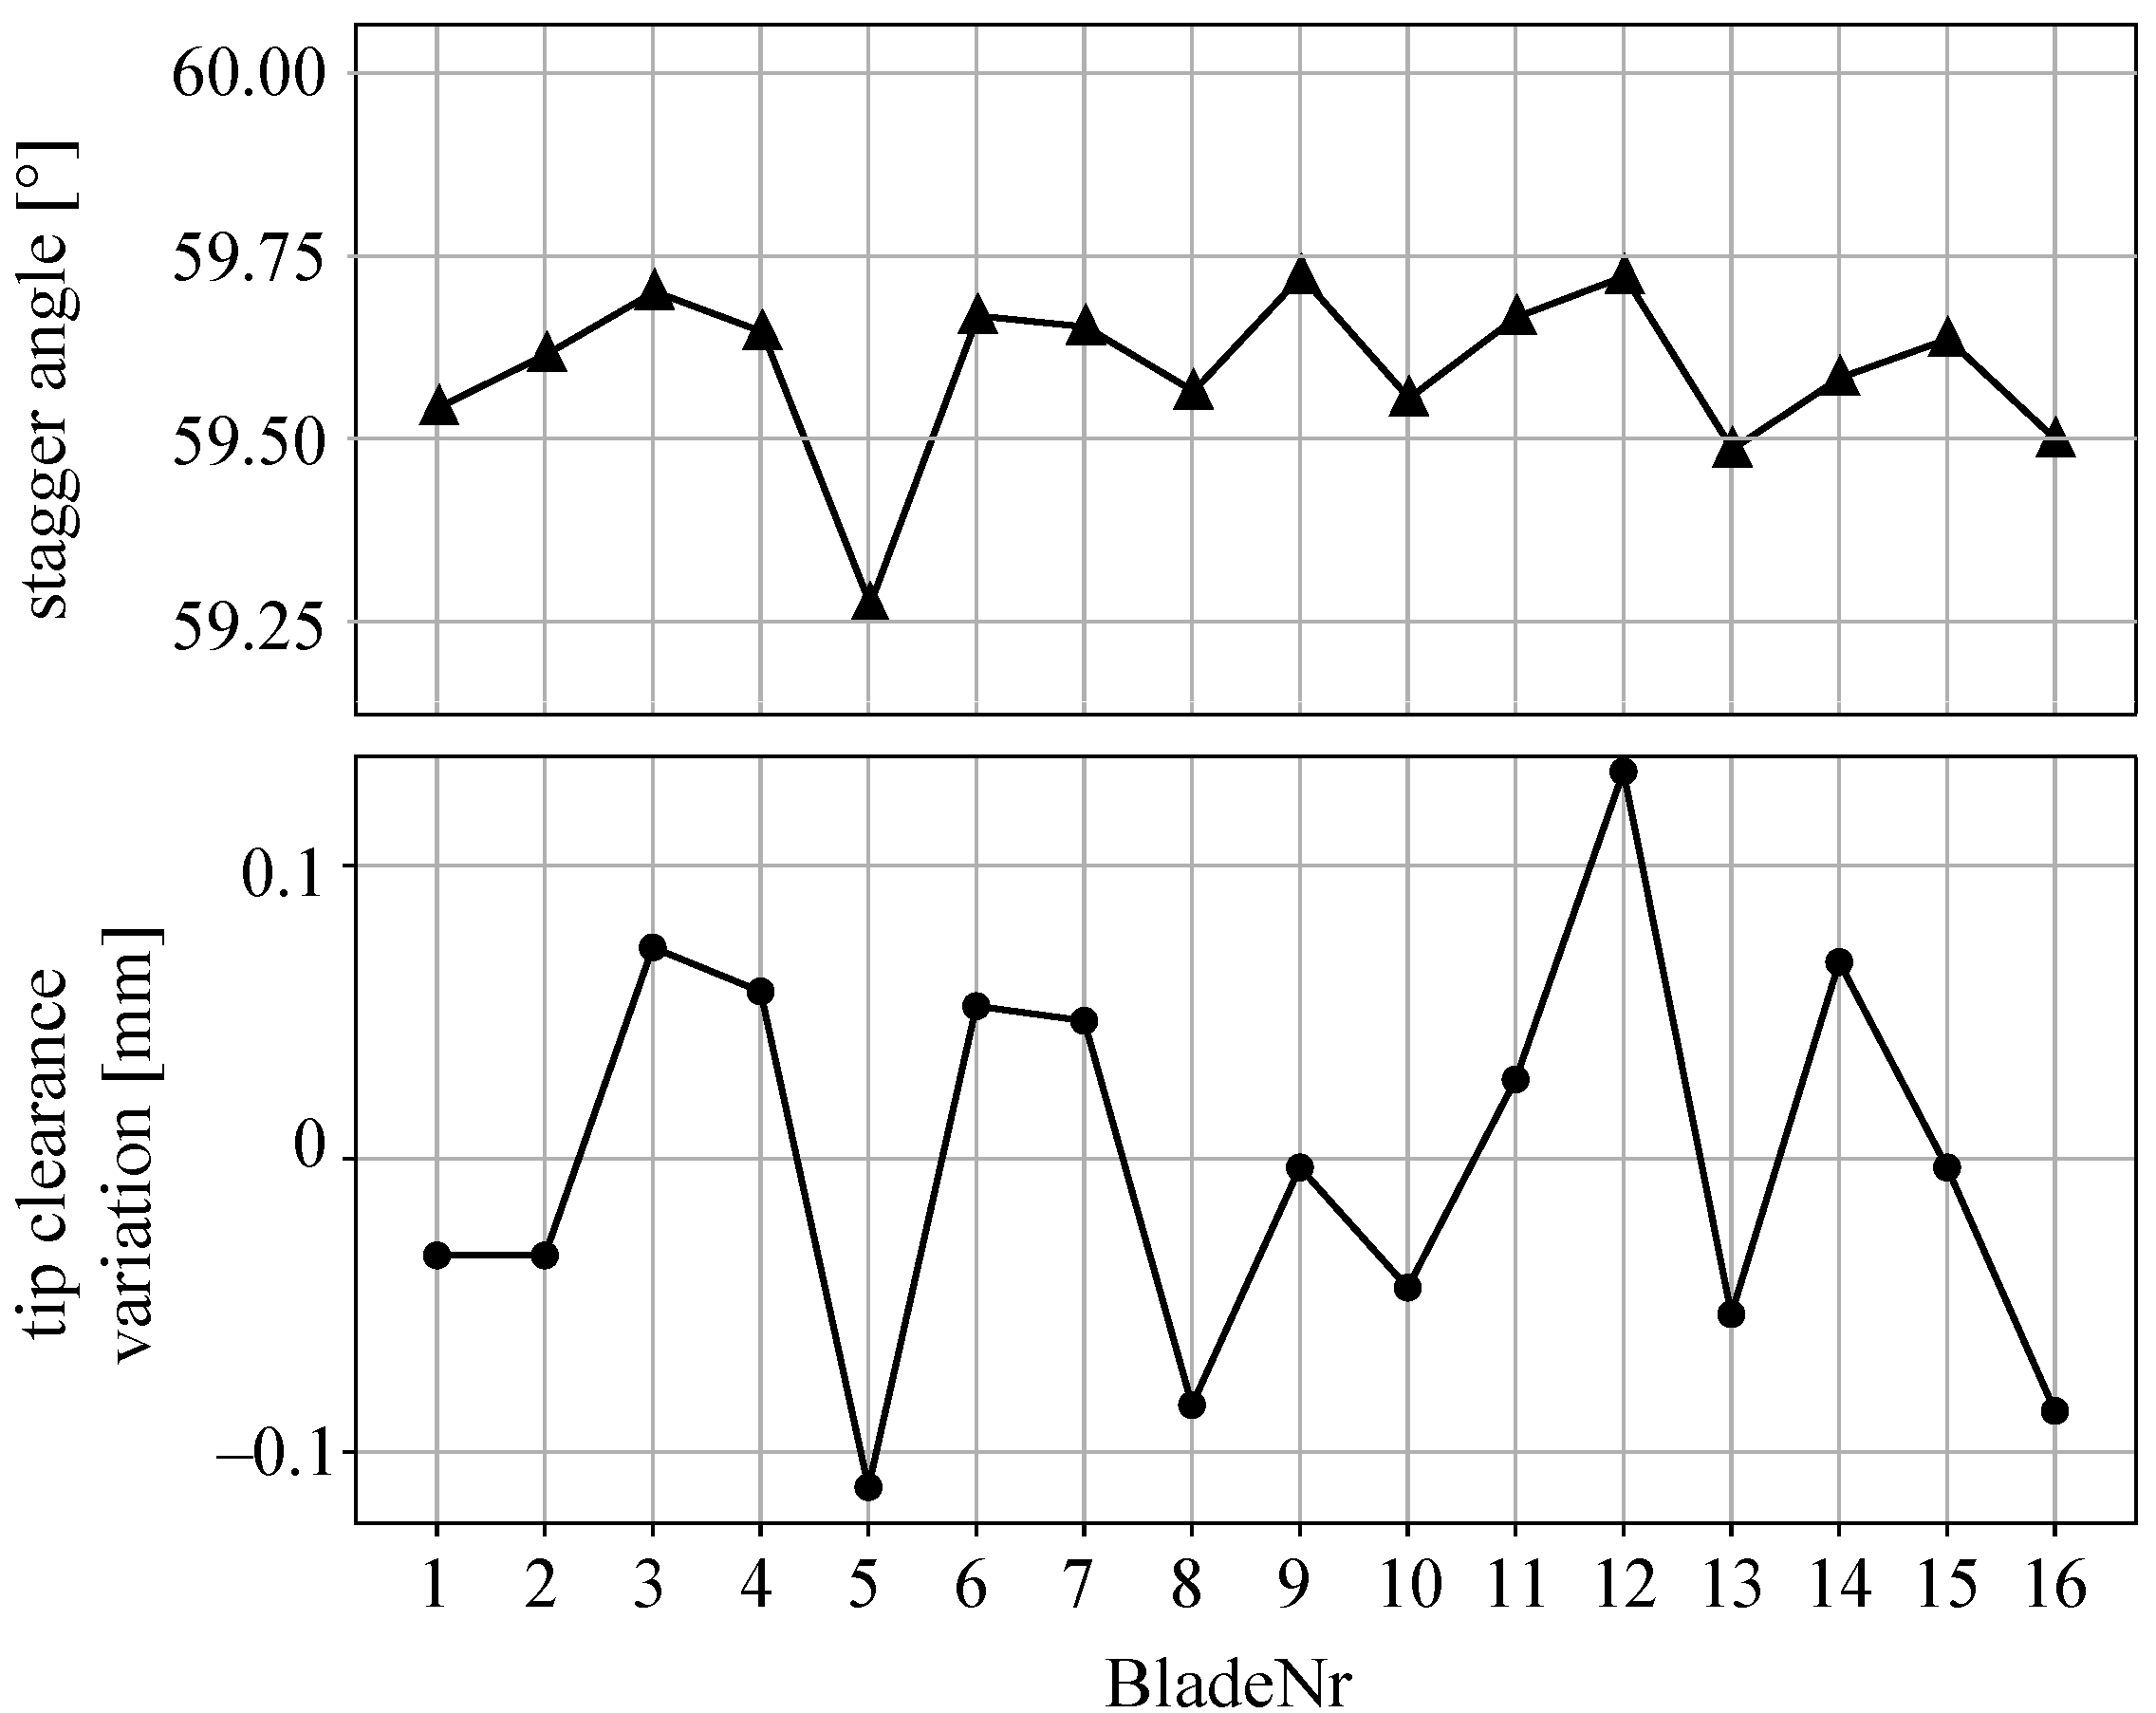
21] revealed a dependence of aerodynamic propagation characteristics on local tip clearance. The stagger angle is a further relevant parameter of the tip geometry. Both values, measured with the tip timing system at 55% speed are presented in
Figure 19. Stagger varies by ±0.25° and local tip clearance by ±0.1 mm, with a nominal value of 1 mm. These variations are significant. Unfortunately, the two patterns are not fully uncorrelated, and a direct interpretation of the influence on blade vibration is not possible based on this data. The blade with the lowest vibration amplitude (5) has both the lowest stagger angle and tip clearance, but a clear correlation is not derived for the full set of blades. Further investigations are necessary and exceed the scope of the present study. Values shown can be used as starting and boundary values for numerical studies on the topic. To provide these values, the presence of the complementary tip timing system is indispensable.
6. Discussion
The results presented in this study reveal three major insights:
NSV is complex at part speed. In a narrow range of operation, fundamentally different vibration mechanisms occur and require detailed analysis, critical modes and aerodynamic characteristics are shifting.
Analysis of individual blade vibration is required. Consistent results across all three measurement systems indicate that bladewise vibration analysis is essential for accurate characterization of the mechanism, specifically if structural mistuning is present.
Complementary instrumentation is crucial. A comprehensive understanding of the aeroelastic phenomena requires complementary measurement systems, and careful selection and calibration of the appropriate setup is critical. Unintentional geometric variations must be resolved under rotating conditions.
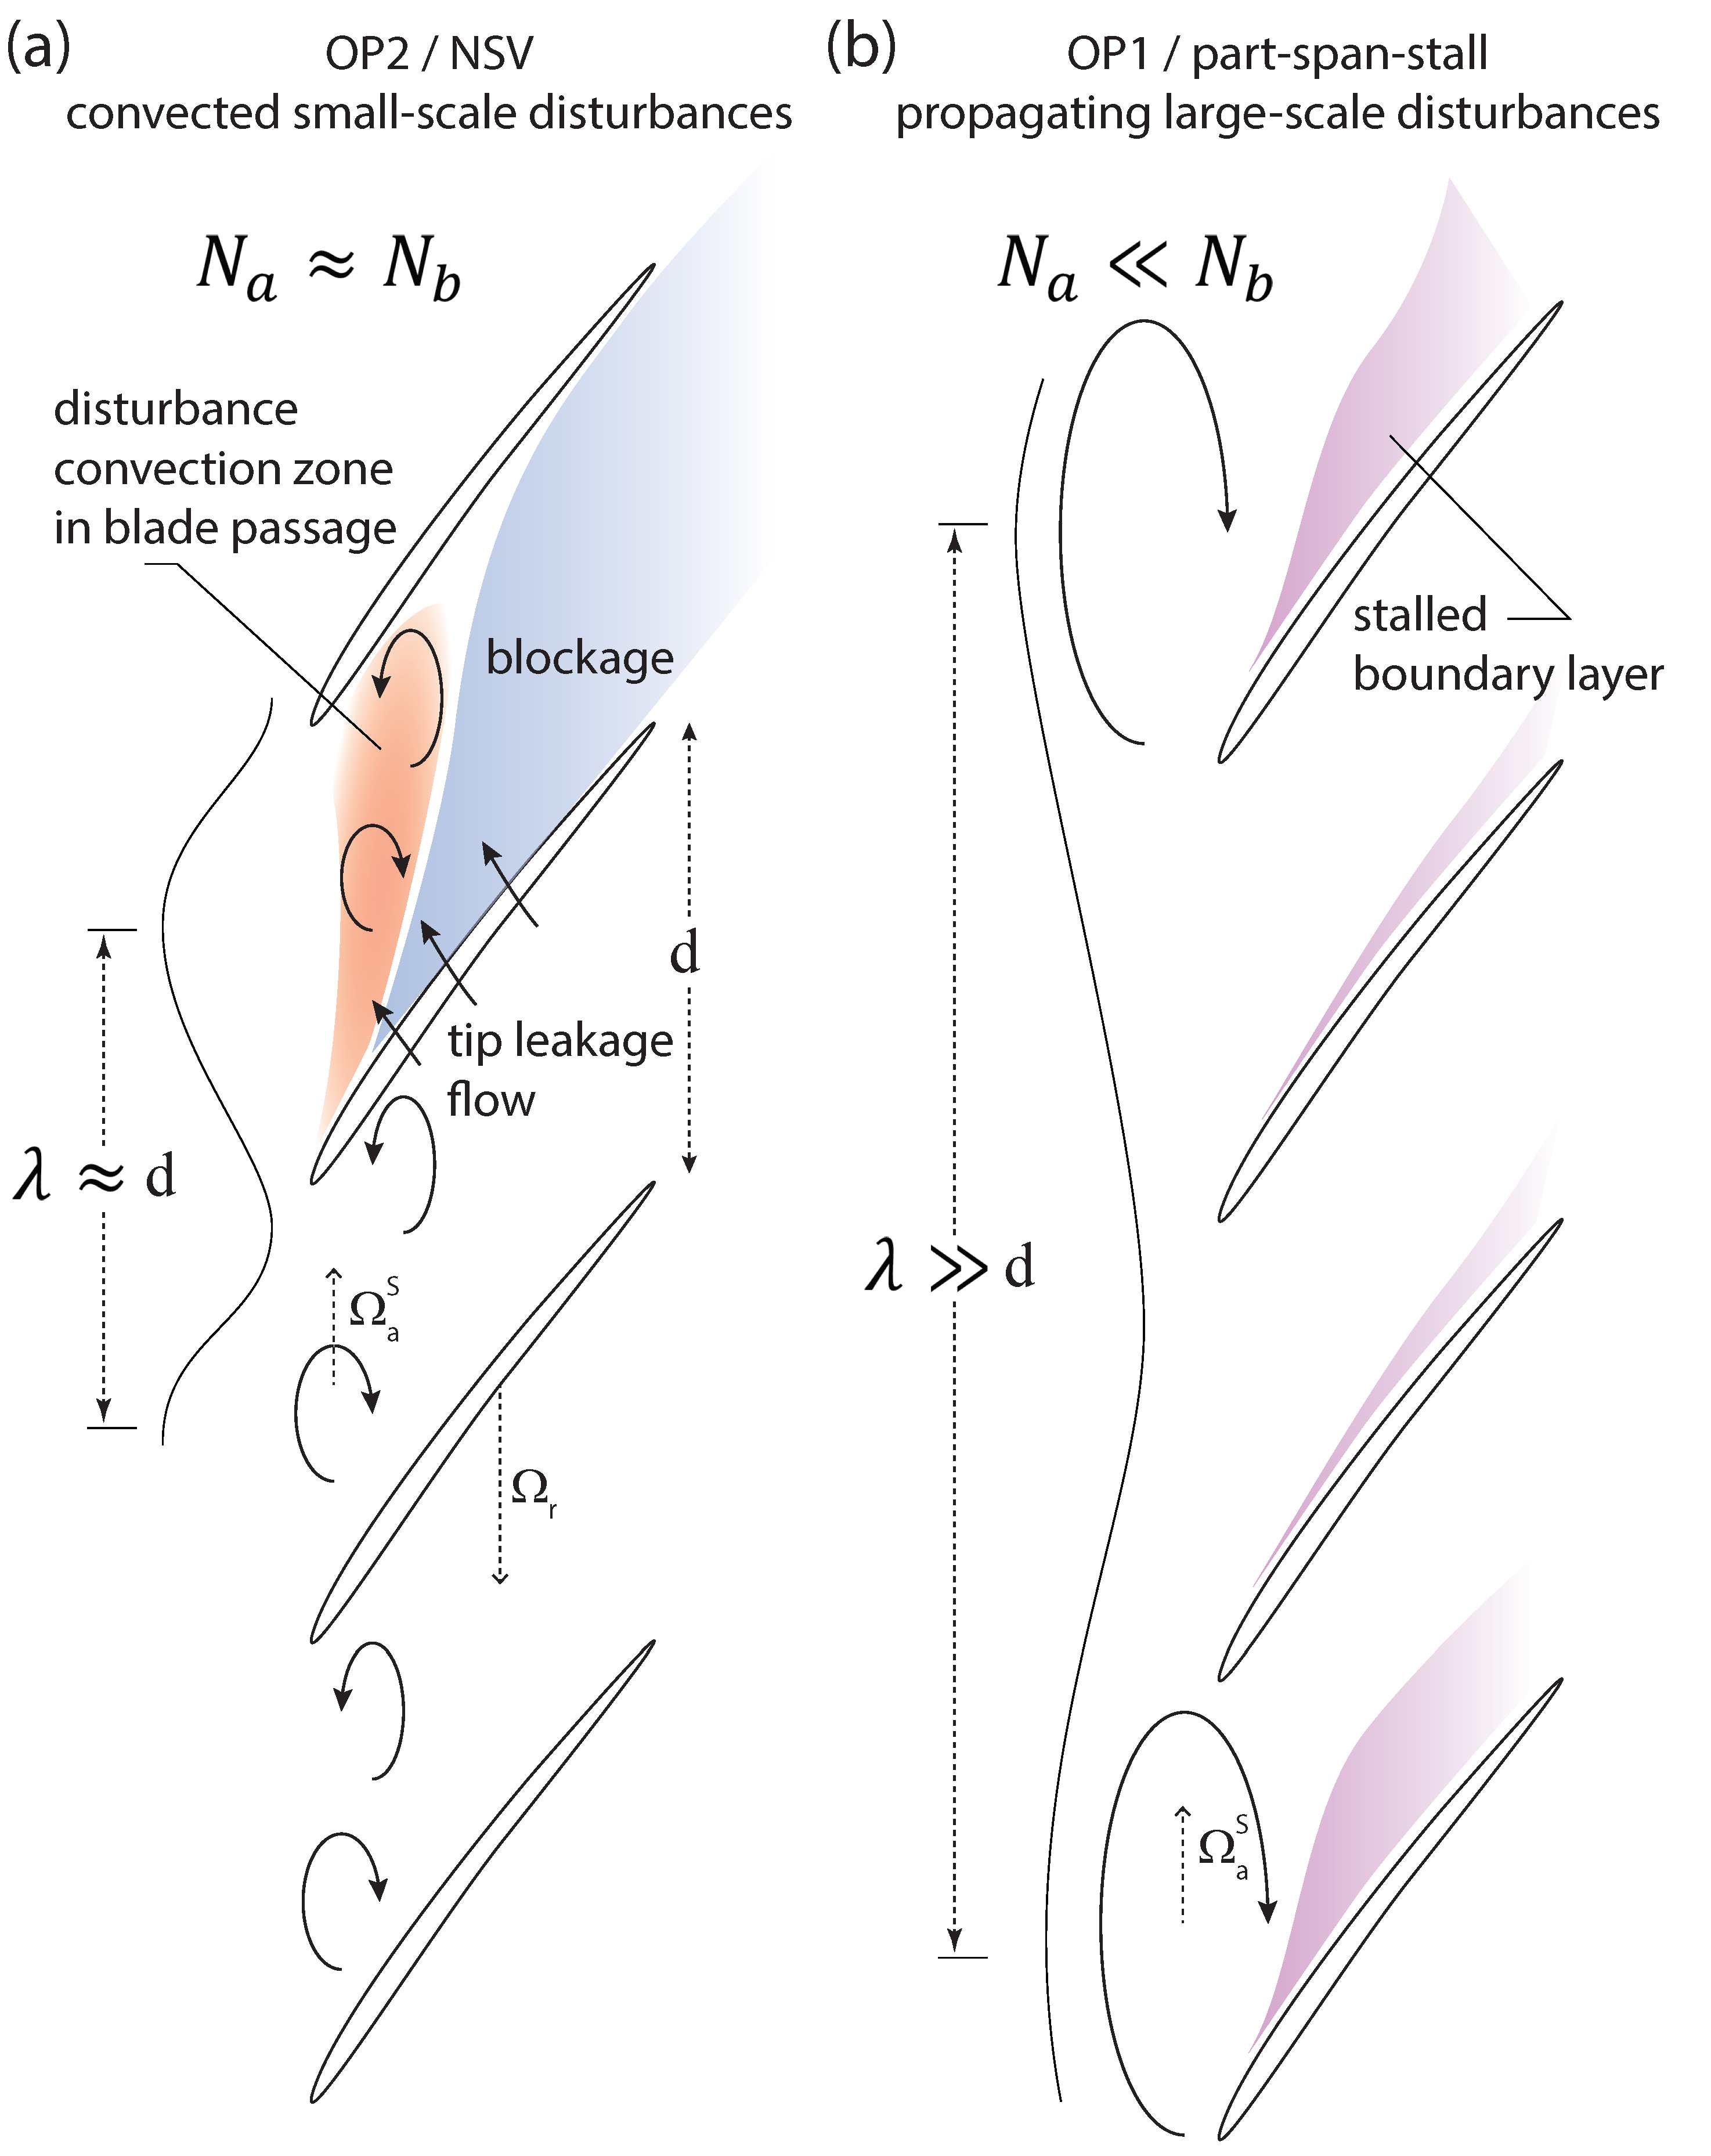
The investigation of NSV at 55% speed has been identified as an excellent validation case for experimental methods and numerics. In contrast to previously published studies at 80% speed, a very clear and distinct modal interaction was observed at OP2, involving high frequency aerodynamic disturbances of small wavelength, locking in with blade Mode 2. Throttling to OP1 shifts the general mechanism towards a more erratic forcing of blade Mode 1 due to disturbances with longer wavelength, resembling known signatures of part-span stall. To illustrate this, a schematic of the flow structures in the tip region at OP1 and OP2 is presented in
Figure 20. At the onset of NSV (OP2), small-scale disturbances propagate counter to the rotor’s direction, driven by high incidence, which leads to the formation of a large blockage zone within the blade passage. The corresponding aerodynamic wave numbers
are close to the number of blades. As throttling increases, large scale disturbances are observed and associated with a slightly shifted propagation speed. Hence it is plausible to assume that when Mode 2 is dominant, in NSV at OP2, the mechanism can be considered as self-excited, whereas for Mode 1 at OP2, the aerodynamic disturbance (part-span rotating stall) excites the blade with negligible mechanical feedback. This interpretation is further elaborated in the study presented in [
22]. With the thoroughly validated vibration characteristics in terms of amplitude and relevant mode presented in this paper, a quantitative validation benchmark for NSV simulations is now available. Eigenfrequency and blade geometry have been shared with the community [
12,
13] and the prediction of NSV based on these data is subject of ongoing research in different institutions.
Guidelines
For the CATANA experiments, strain gauges were employed as the primary tool for assessing operational stability. This system provided crucial information on individual blade vibration amplitudes, frequencies, and assembly-mode decomposition, allowing for a deeper understanding of structural mistuning, as demonstrated in [
15]. Particularly, the derivation of sector-wise inter-blade phase angles proved to be an important parameter. However, paper [
23] highlighted that the accuracy of modal amplitudes derived from Fourier transformations is highly dependent on the choice of parameters, with uncertainties in tip displacement measurements reaching up to 50%. This underscores the need for rigorous sensitivity calibration; in our study, a signal loss of 35% was observed for individual blades, even when the sensors showed no signs of delamination and provided accurate spectral responses. Inaccuracy of FEM-predicted mode shapes may be non-negligible and validation using a shaker is imperative.
The measurement systems used in the CATANA experiments are compared in
Table 4. Despite its effectiveness, the strain gauge system presents several limitations. The complexity of integration, including the need for costly telemetry and intricate sensor application and cabling, can be prohibitive. Additionally, sensor failure during experiments is common, and higher-order modes are difficult to resolve due to the fixed sensor positions. Nonetheless, the high-frequency resolution and real-time evaluation capabilities of the strain gauge system make it indispensable for the type of experiments conducted here.
The capacitive tip timing system offers an alternative with similar amplitude resolution for the modes of interest. This system is more cost-effective and requires no instrumentation within the rotating frame, which simplifies application and enables rapid changes in the fan blade configuration. The system’s real-time evaluation capabilities are comparable to those of strain gauges; however, post-processing for spectral analysis of individual blade signals is more complex and highly sensitive to the accuracy of mode shape predictions. Additionally, the system’s ability to measure local tip clearance, eccentricity, and stagger angle provides valuable data for interpreting aeroelastic phenomena beyond vibration analysis.
Finally, the high-speed camera system, while used as a redundant measurement tool in this study, presents an option for non-intrusive vibration measurements, provided the fan is optically accessible and a camera can be placed at a sufficient distance to avoid aerodynamic interference. Optical vibration measurement offers the advantage of straightforward calibration and data acquisition. However, the data processing demands are significant, with image acquisition at blade passing frequency generating approximately 3 GB of data per second. Continuous streaming and real-time analysis were not feasible with the current system, though future technological advances may render this approach more practical for online monitoring.
As presented in the discussion of the NSV mechanism, accurate aeroelastic analysis relies on sufficient aerodynamic instrumentation, particularly the use of circumferential distributed unsteady wall pressure sensors, which provide crucial data for cross-referencing with vibration measurements. Given the high costs associated with typical high-speed turbomachinery experiments, it is imperative that industry and academia adopt the best practice of incorporating at least one vibration measurement system, alongside circumferential distributed pressure sensors (recommended at least five non-homogeneously distributed sensors). This minimal setup not only ensures a more comprehensive understanding of complex aeroelastic phenomena but also mitigates the risk of misinterpreting results, thereby maximizing the value of these costly experiments and preventing wasted efforts when aeroelastic effects are identified too late in the process. Future studies should explore hybrid measurement strategies that combine strain gauges for real-time feedback with optical methods for full-field validation to validate sensor calibration. Advancements in post-processing for tip timing data could also improve mode shape identification, reducing dependency on prior numerical assumptions. Additionally, further research into sensor miniaturization and wireless telemetry could help address integration complexity in industrial applications.
The results presented here have strong implications on numerical simulations and experiments. Even small structural mistuning, which may be different in the assembled disk than in shaker tests, affects the blade individual vibration. In our case, bladewise amplitude variations of the order of 50% occur, and if instrumentation is lacking, safety-critical conditions arise. The observed variations in experimental mode shapes indicate that numerical models must incorporate realistic mistuning effects rather than assuming ideal periodicity. In particular, deviations in inter-blade phase angles suggest that NSV simulations should integrate experimentally derived mistuned structural parameters to improve predictive accuracy. Further, FEM-based mode shape validation via optical methods or shaker tests is recommended before finalizing NSV stability maps.
These findings have direct industrial relevance, particularly in predictive maintenance strategies for turbomachinery. The ability to identify NSV risks early through advanced vibration measurement techniques can lead to extended component lifetimes and reduced operational costs. Although in-service monitoring is currently unfeasible, periodic structural assessments during maintenance, combined with reduced-order modeling, could provide a viable approach to mitigating severe component damage.
7. Conclusions
Results of an NSV mode transition at part speed conditions of the open-test-case fan ECL5 have been presented. Limit-cycle oscillations with significant variation of vibration amplitude were observed and called for thorough validation. Critical aeroelastic interaction modes switch from typical convective NSV of blade Mode 2 near peak-pressure conditions to non-synchronous forcing of blade Mode 1 due to propagating multi-cell part span stall, associated with a shift in disturbance propagation speed. An inhomogeneous vibration amplitude pattern was observed for both conditions and called for a detailed validation of the measurement data.
A comparative study was conducted using three redundant and synchronized measurement systems: blade mounted strain gauges, capacitive tip timing, and a high-speed camera.
The strain gauge system, used as the primary method, offered precise real-time data on blade vibrations, capturing individual blade amplitudes and assembly-mode decomposition. However, uncertainties in modal amplitude estimations, particularly due to sensitivity calibration issues, were highlighted as significant. The capacitive tip timing system proved advantageous for rapid setup and cost-efficiency, providing useful blade tip deflection and clearance data, although its post-processing complexity and reliance on accurate mode shape predictions must be considered. The most cost effective method is a high-speed camera, offering high spatial resolution and redundancy, but with practical limitations in terms of data processing speed and storage. This restricted its use for real-time applications but proved the accuracy of the well calibrated strain gauge system.
The findings demonstrate that no single measurement system can comprehensively capture the full spectrum of aeroelastic behavior in turbomachinery under part-speed conditions. Each system brings unique strengths and limitations, necessitating their complementary use for a thorough understanding of blade dynamics; all call for reliable modal FEM simulations. The experimental efforts to directly compare the systems demonstrated the reliability of measurement data and provides a guideline for system selection. The investigated case of NSV and part-span stall can be considered a benchmark for prediction methods of aeroelastic instability in modern fans and compressors.
