

Population Genetics of Oncomelania hupensis Snails from New-Emerging Snail Habitats in a Currently Schistosoma japonicum Non-Endemic Area


Abstract
1. Introduction
2. Materials and Methods
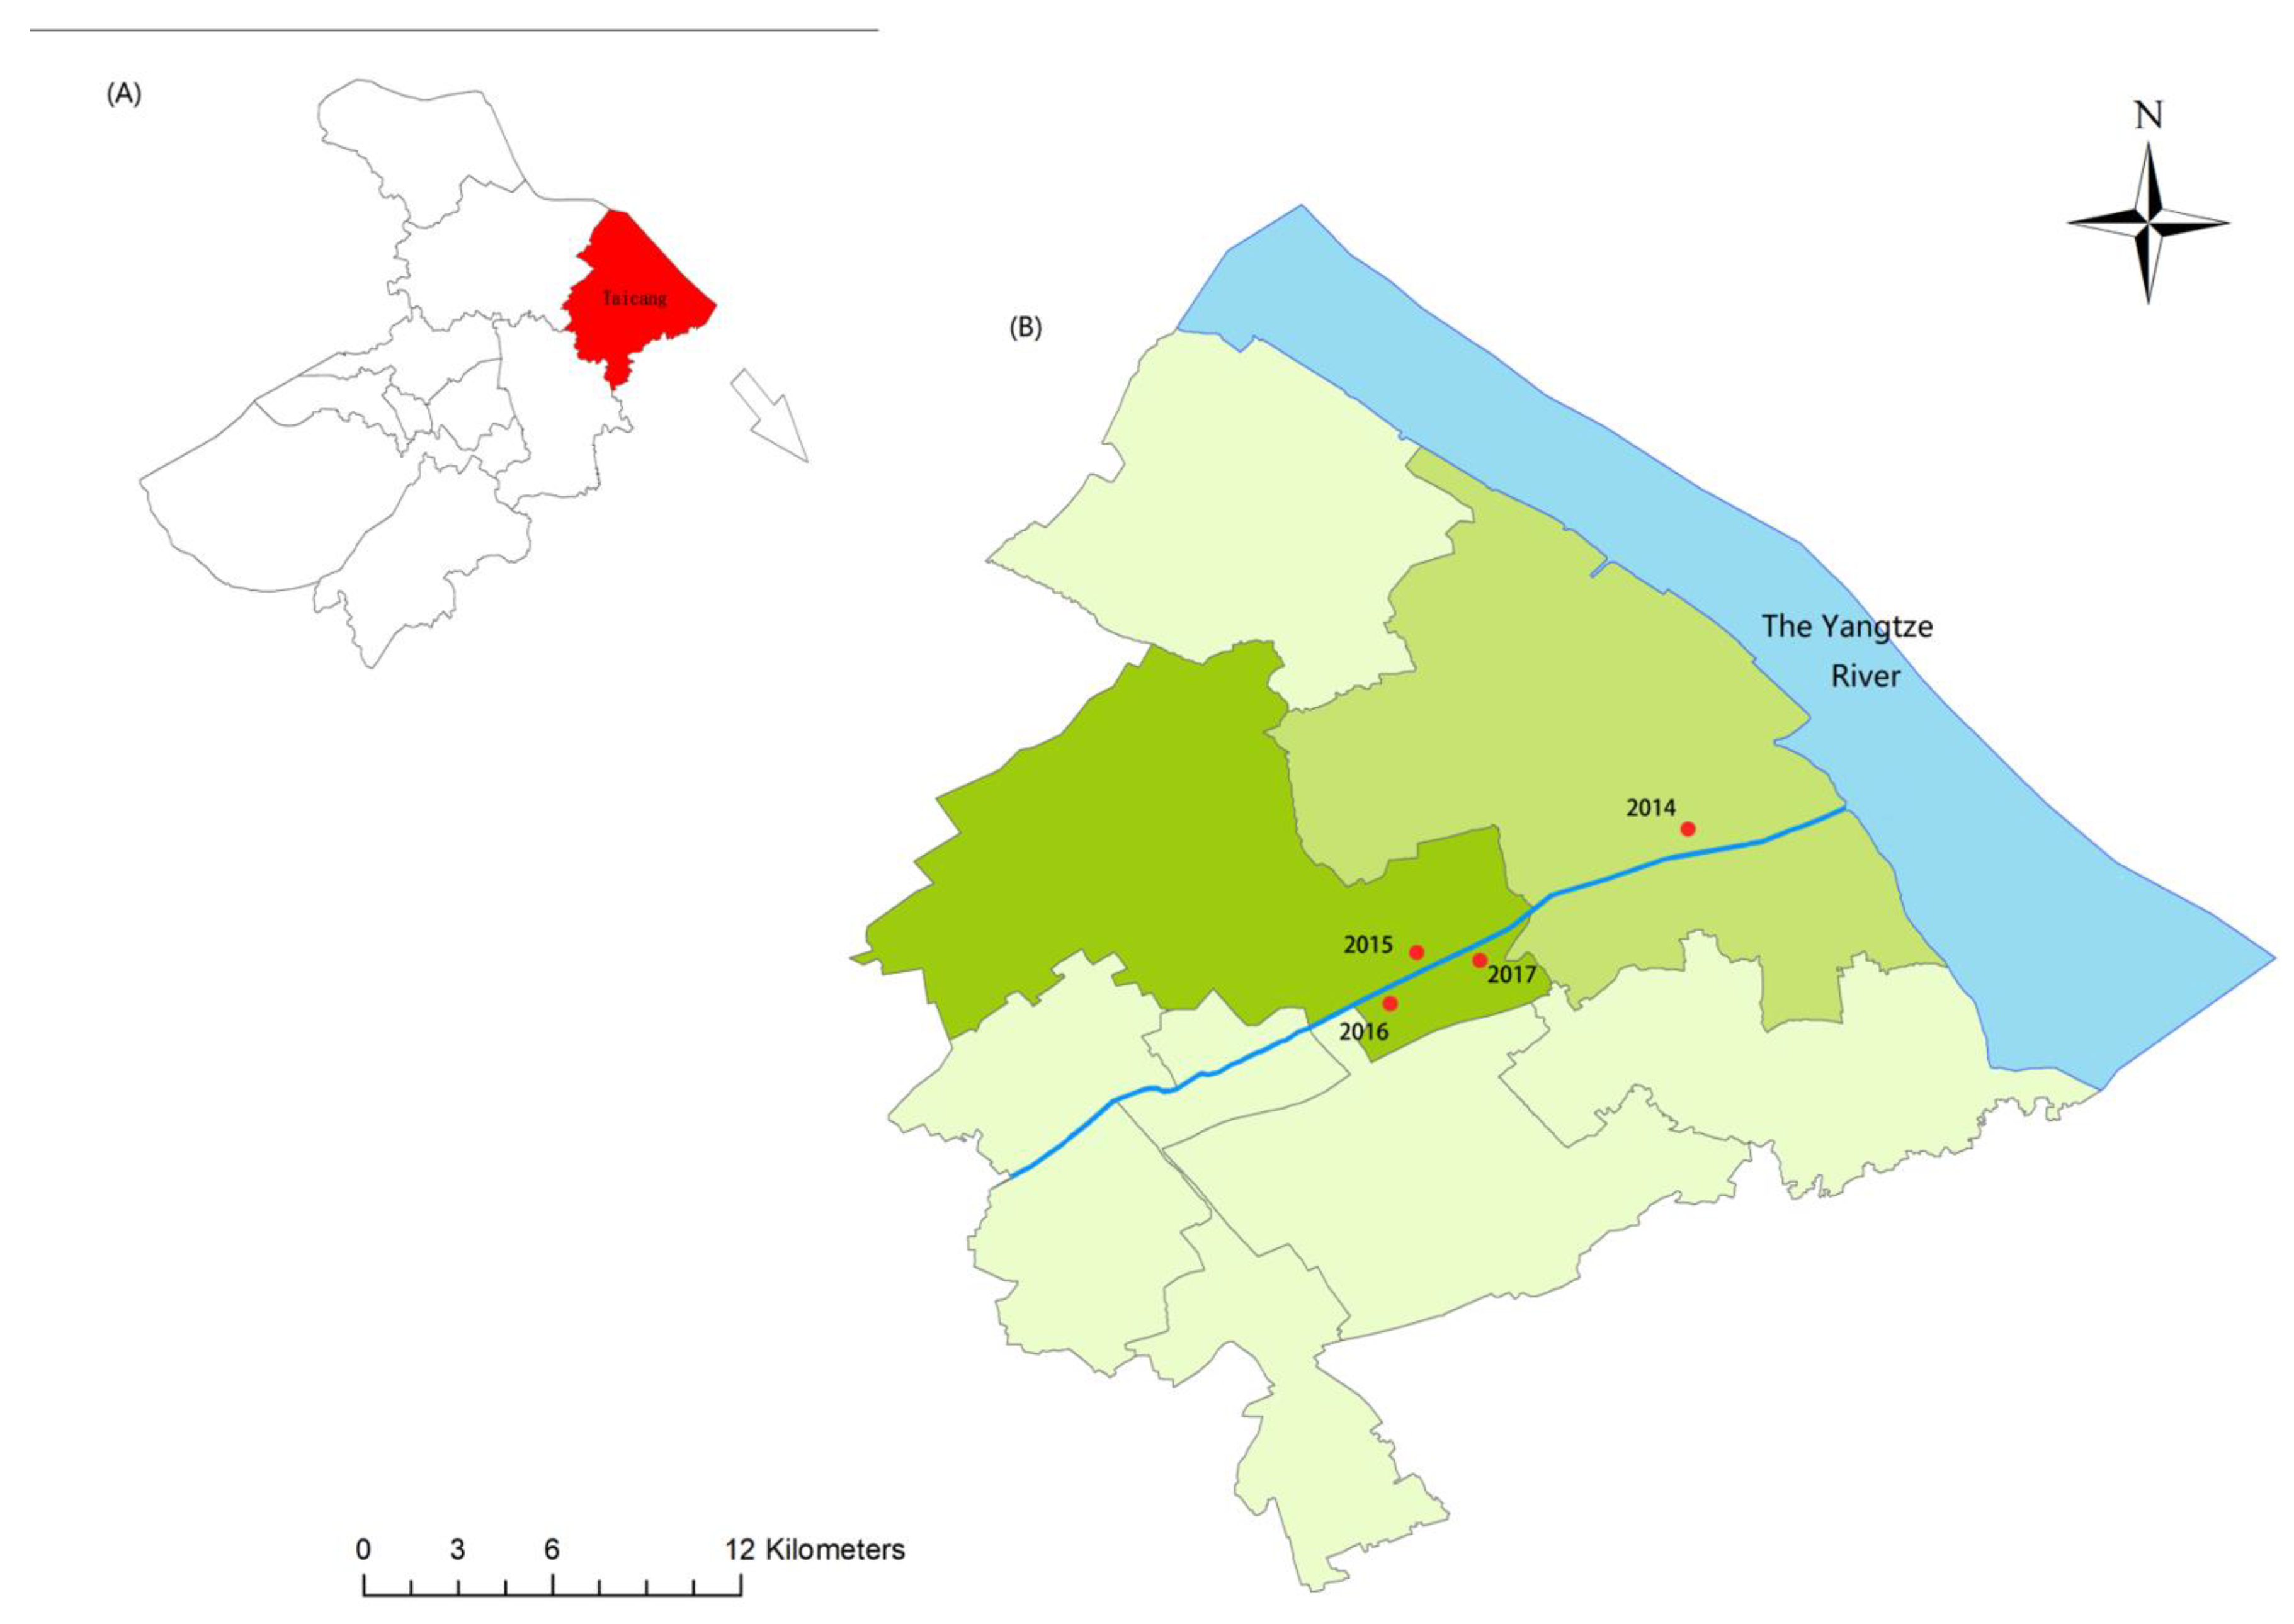
2.1. Sample Collection and DNA Extraction
2.2. DNA Extraction and Microsatellite Genotyping
2.3. Genotypic Analysis
2.3.1. Genetic Diversities
2.3.2. Genetic Difference and Structure
2.3.3. Effective Population Size
2.3.4. Population Divergence History
3. Results
3.1. Genetic Diversity
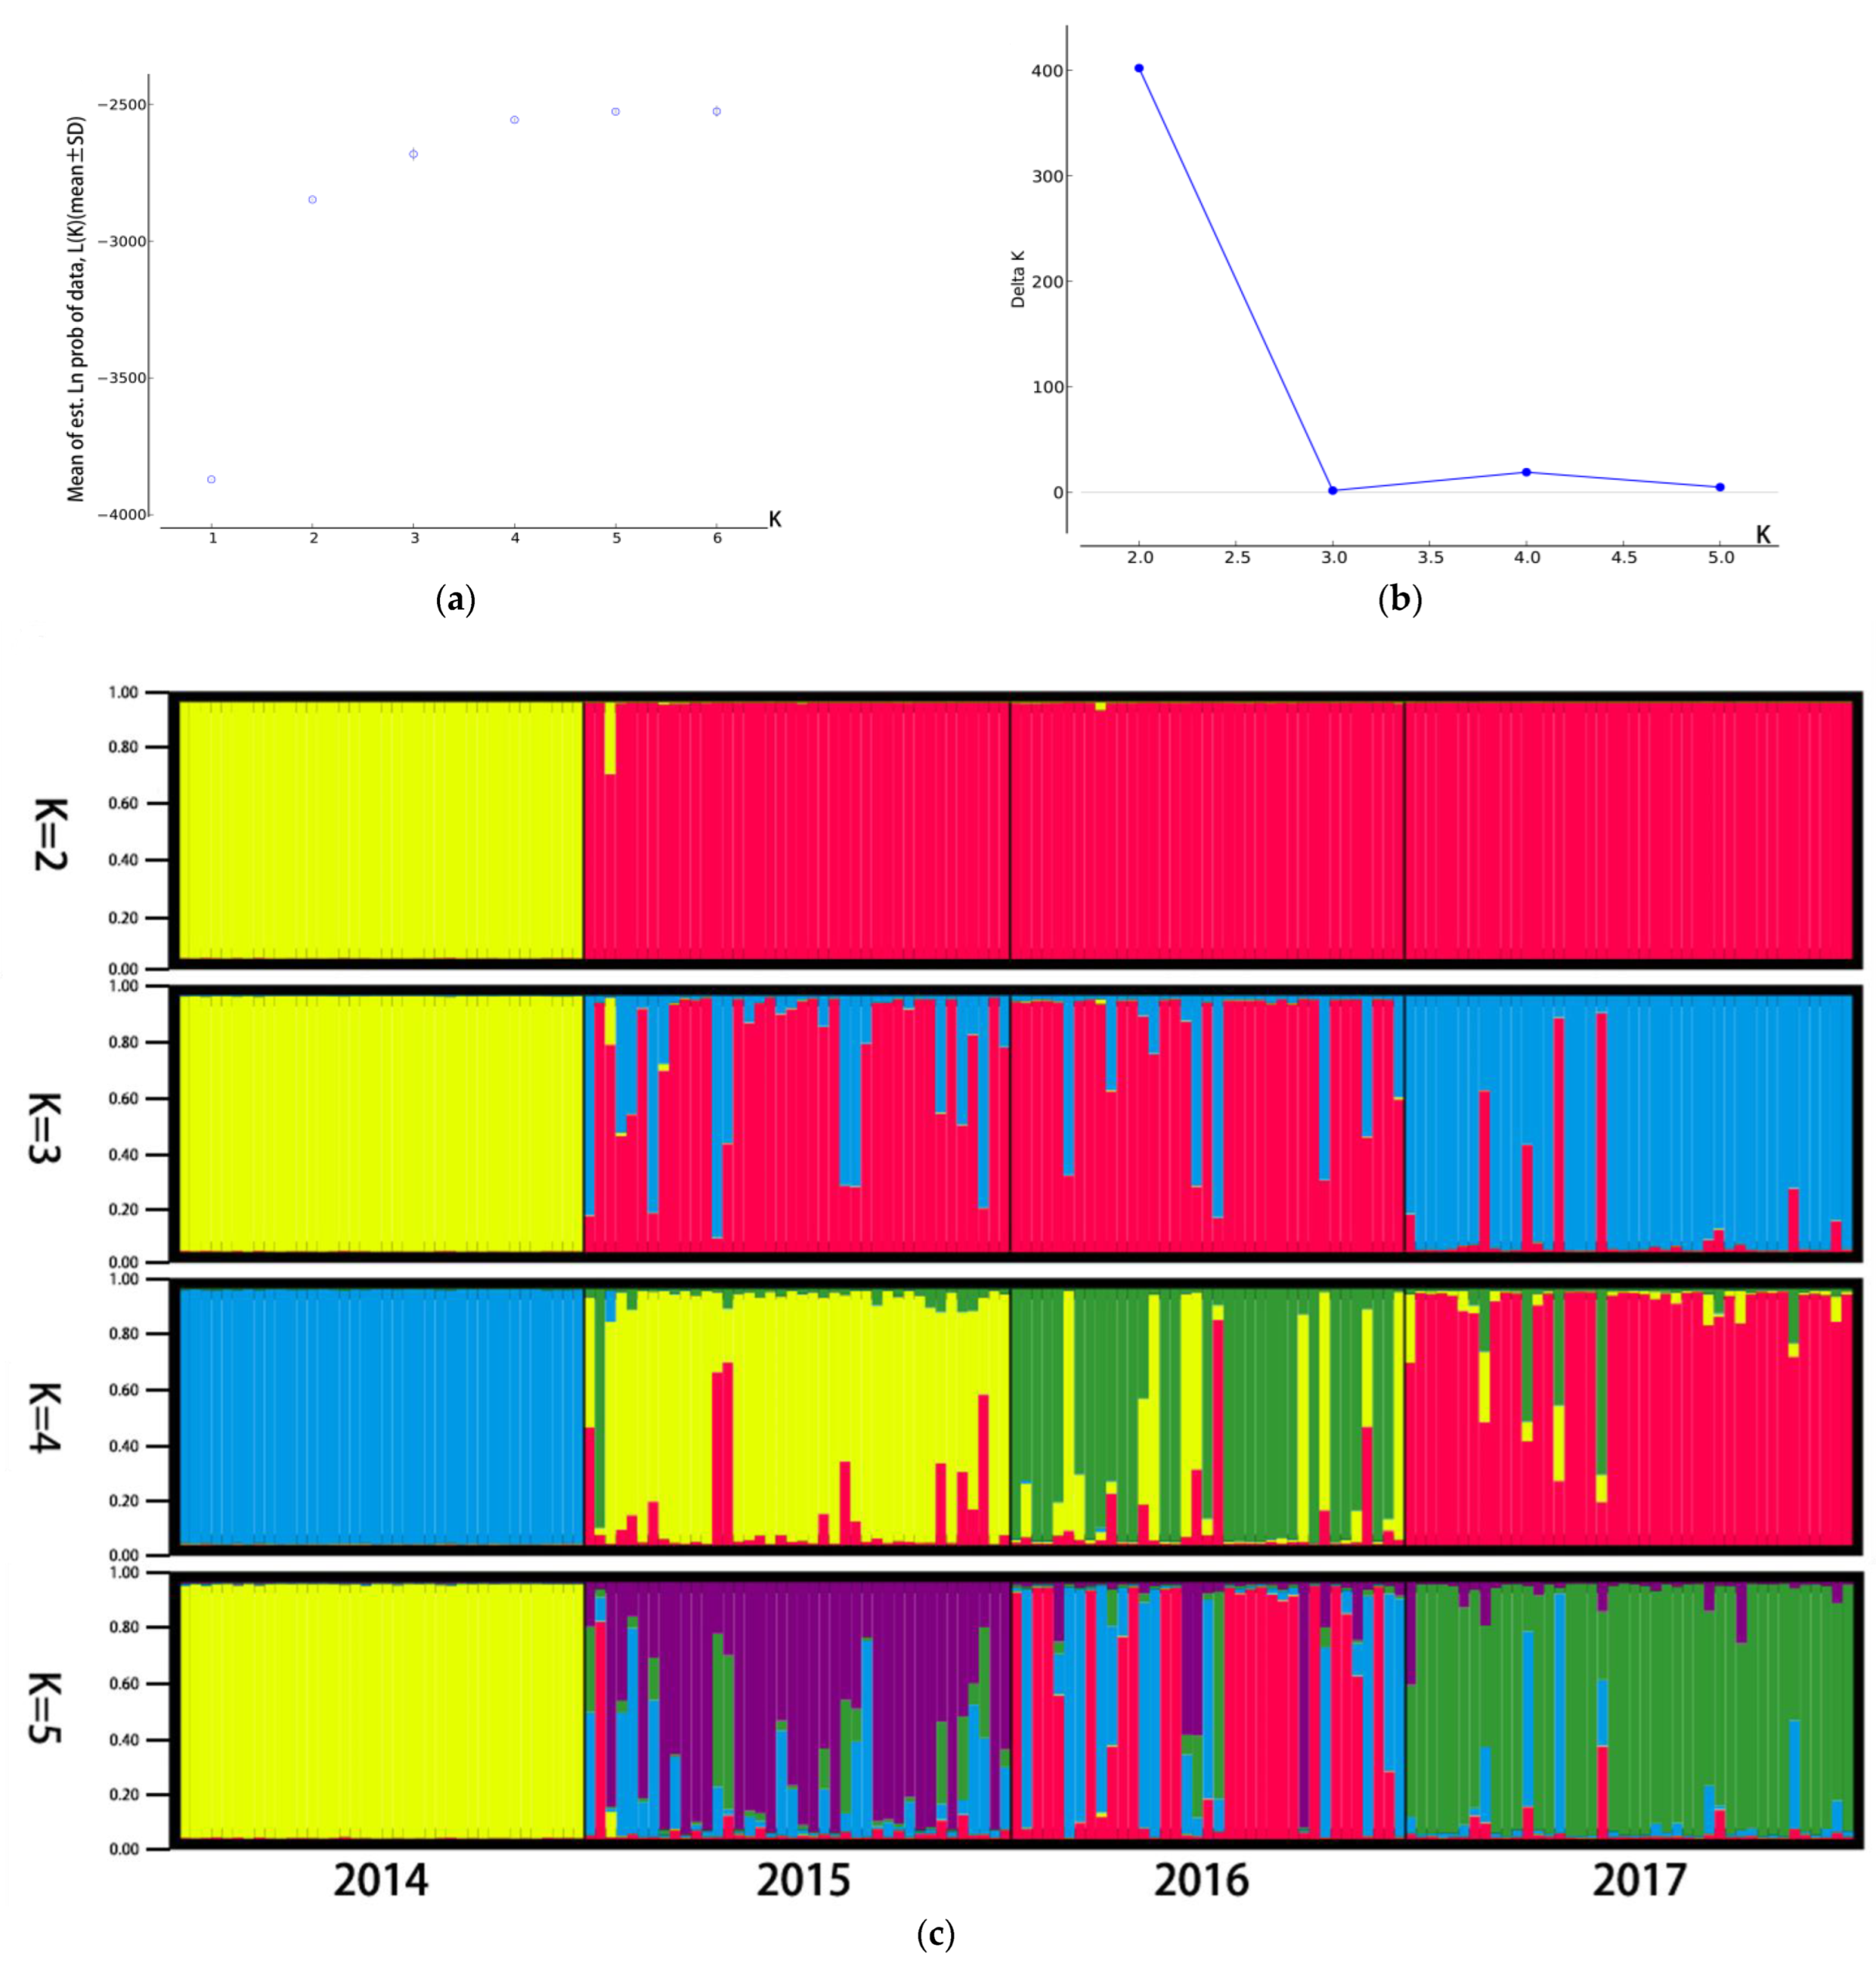
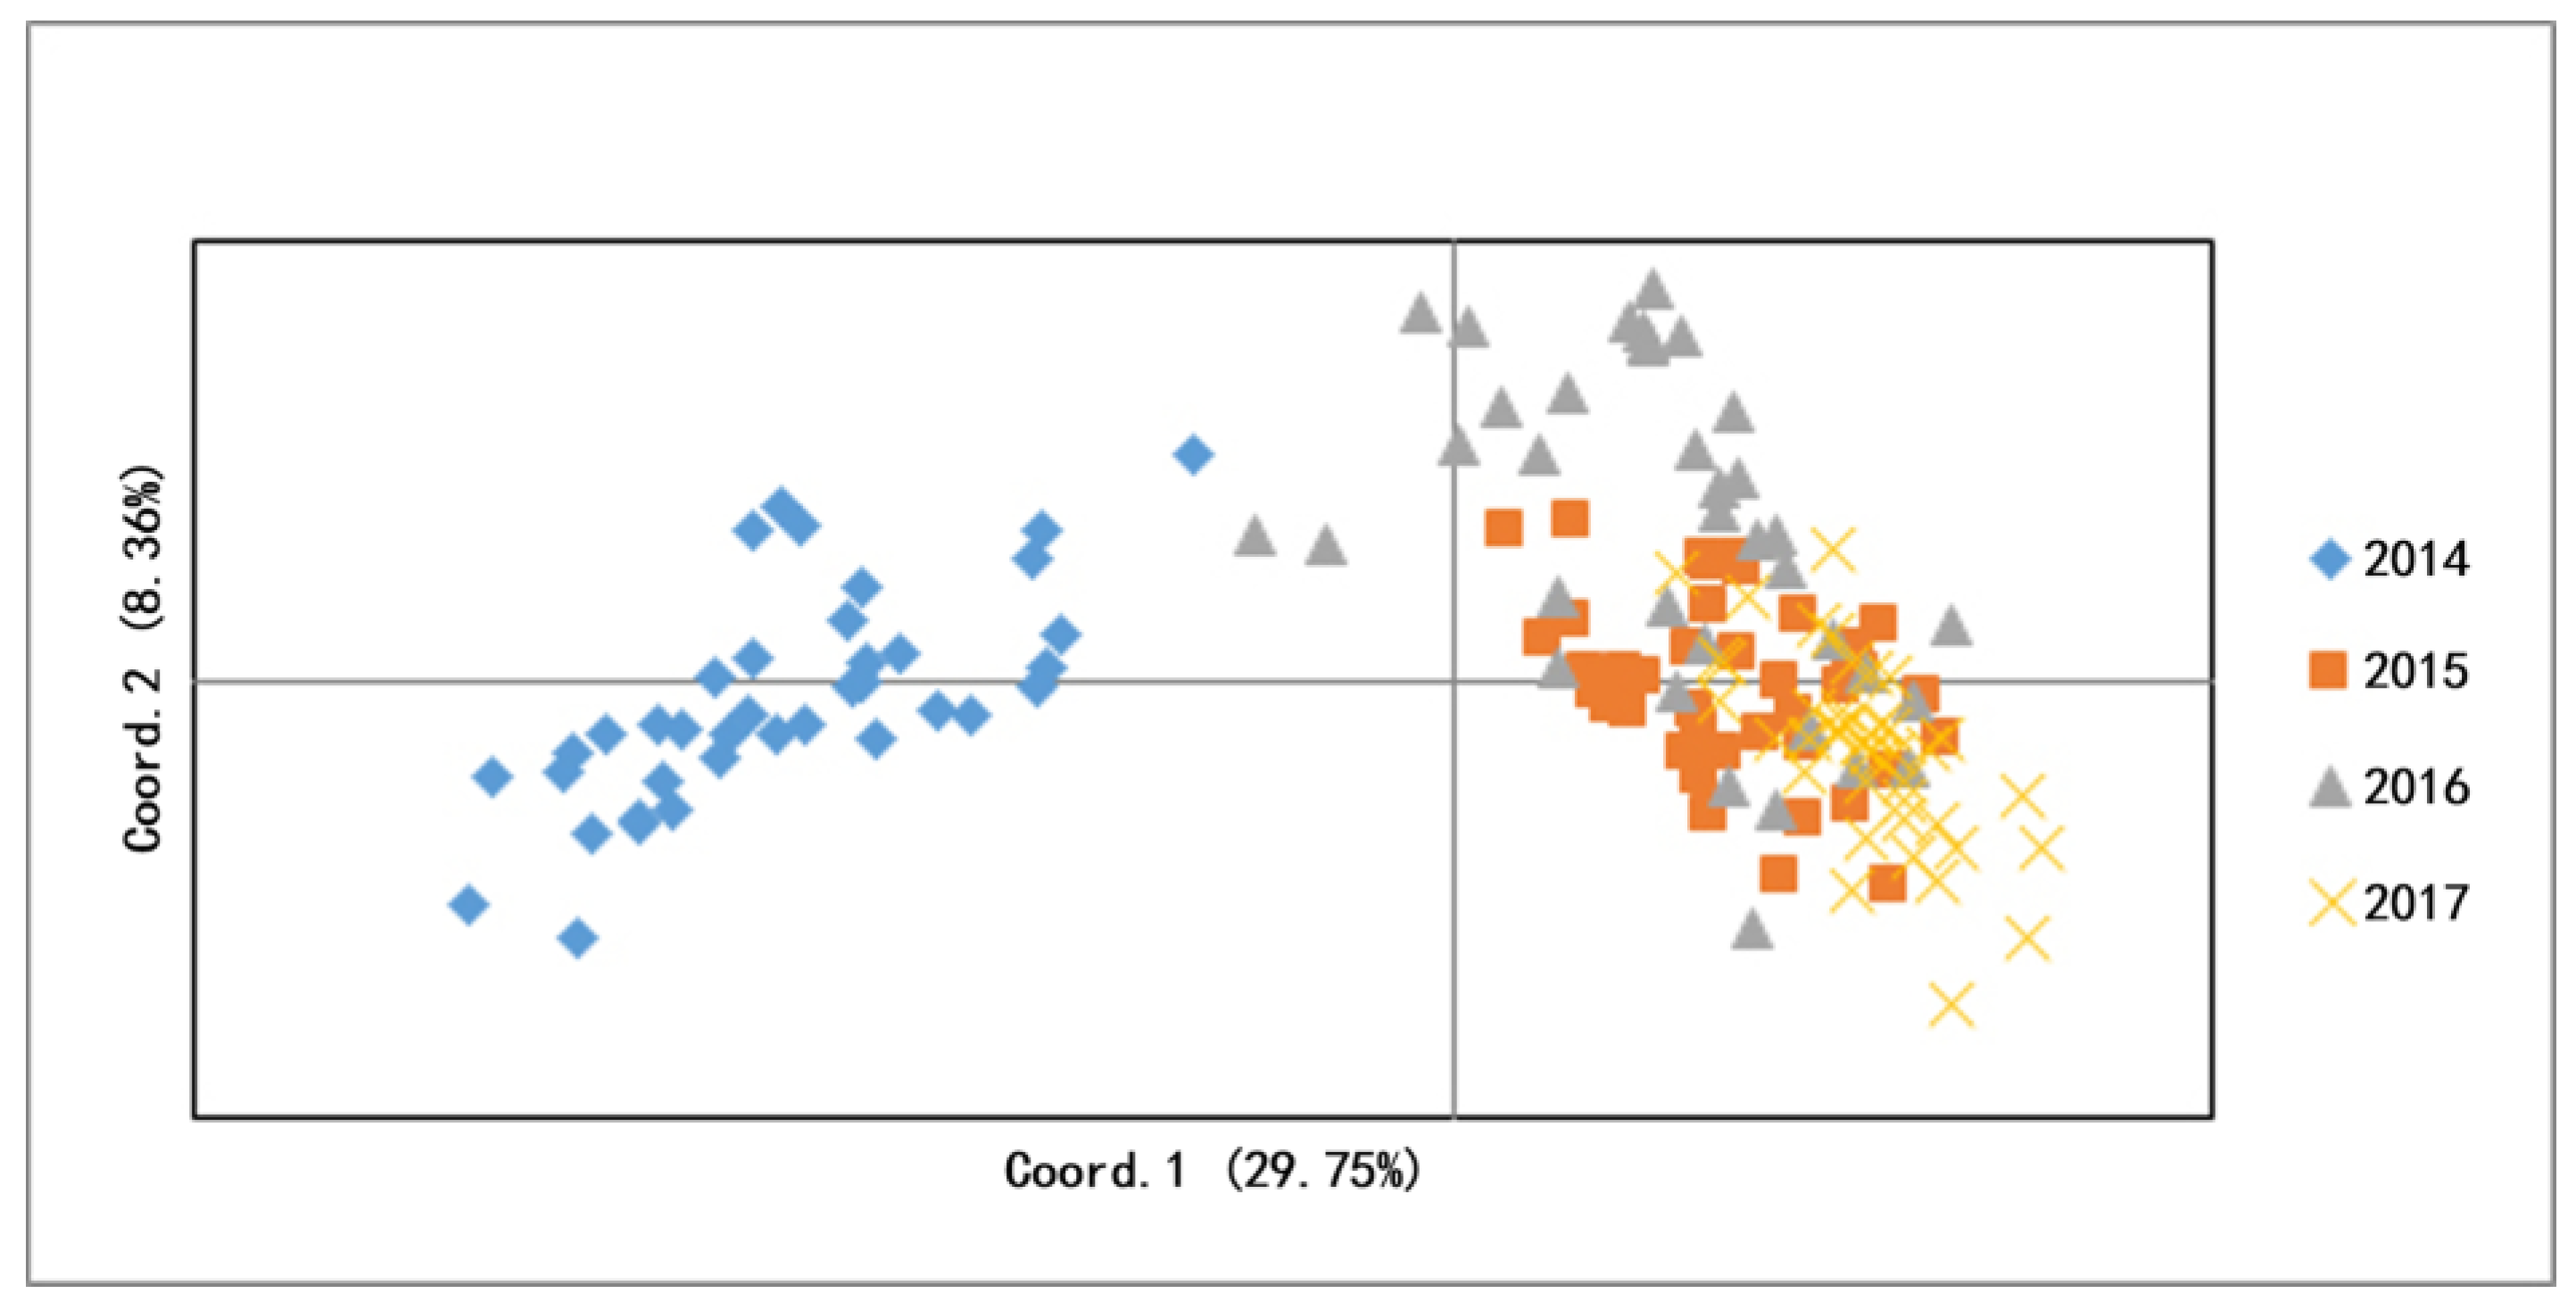
3.2. Genetic Difference and Structure
3.3. Effective Population Size (Ne)
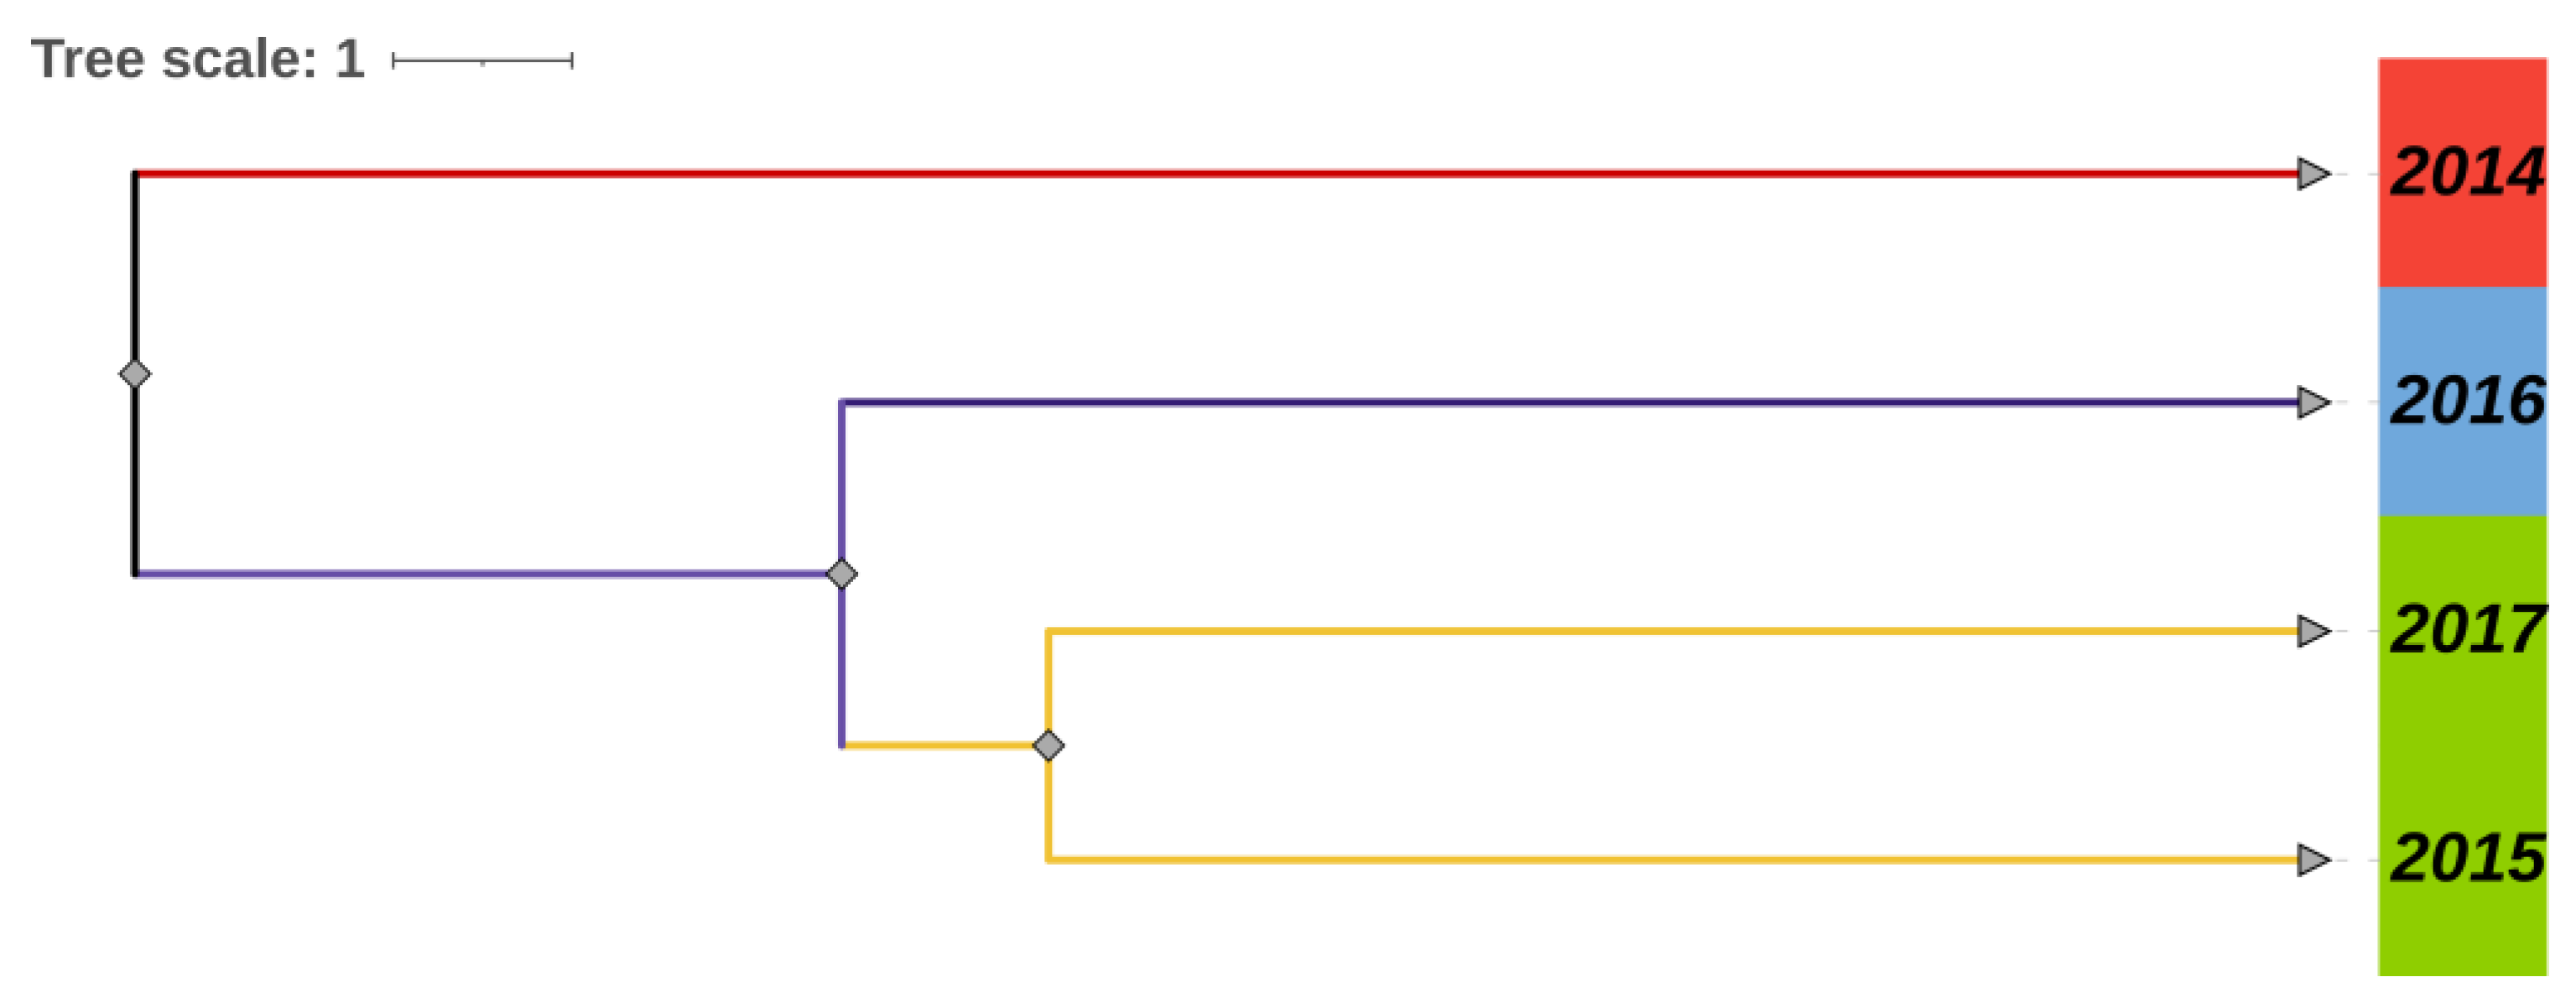
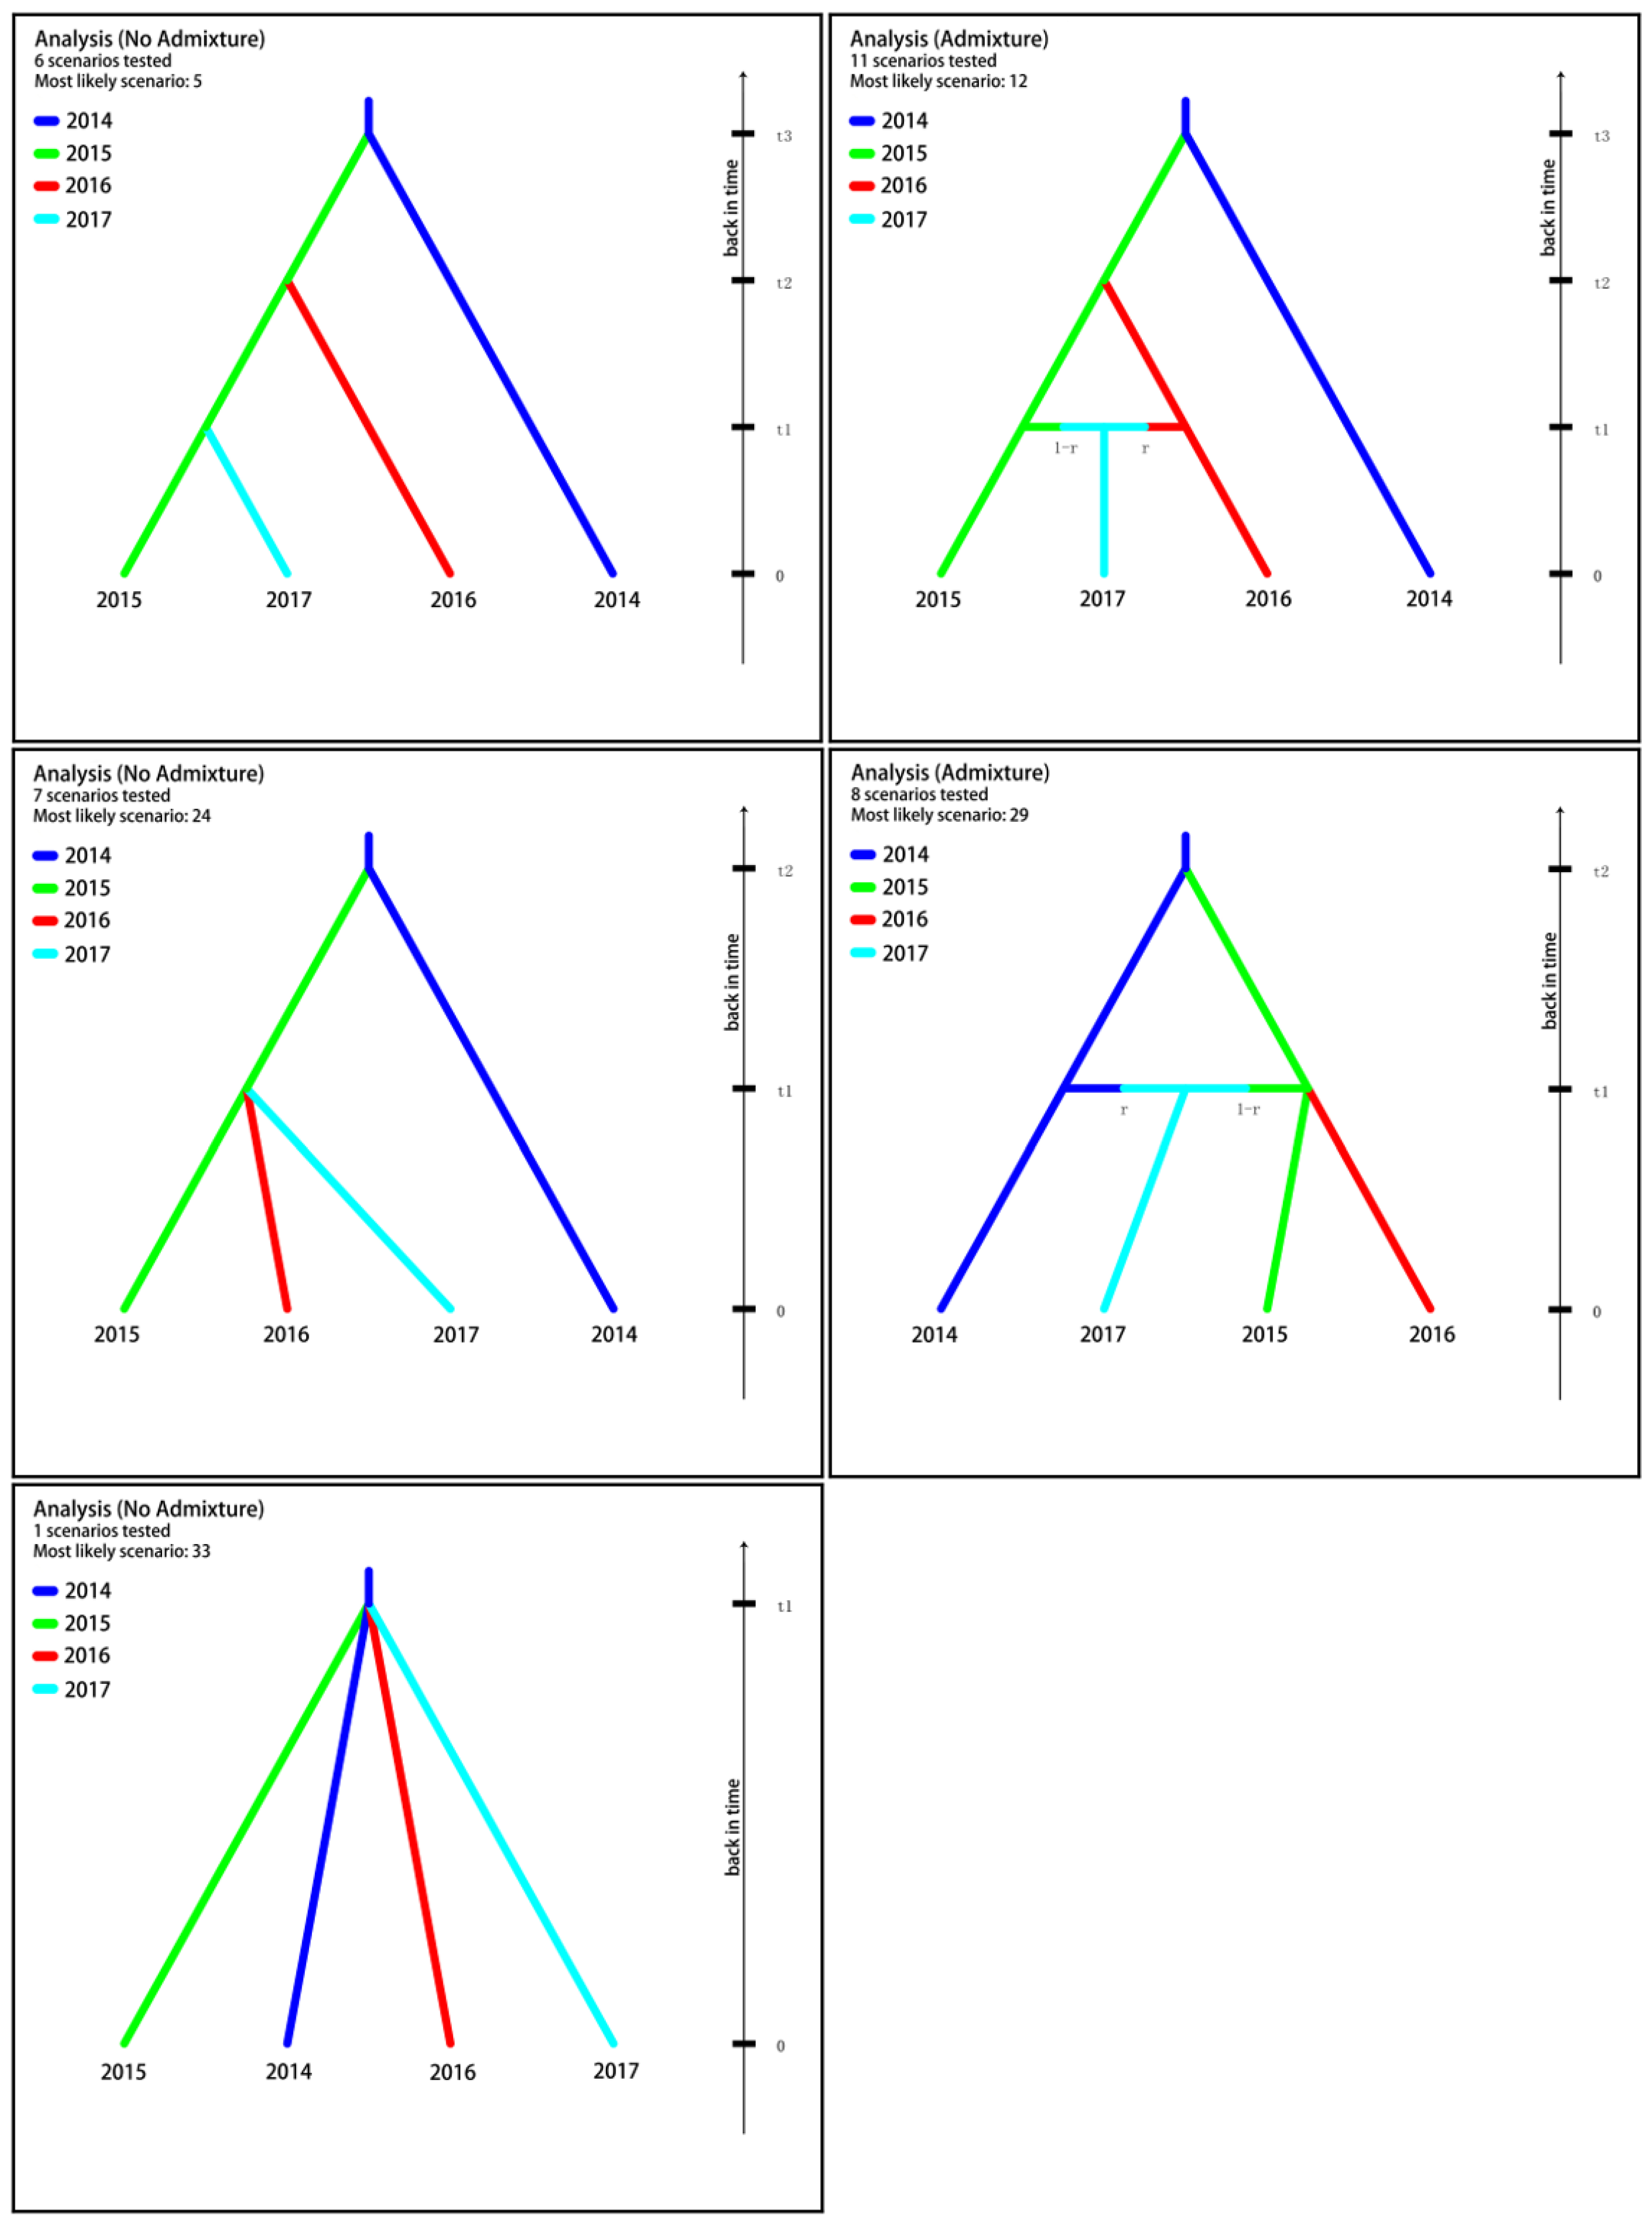
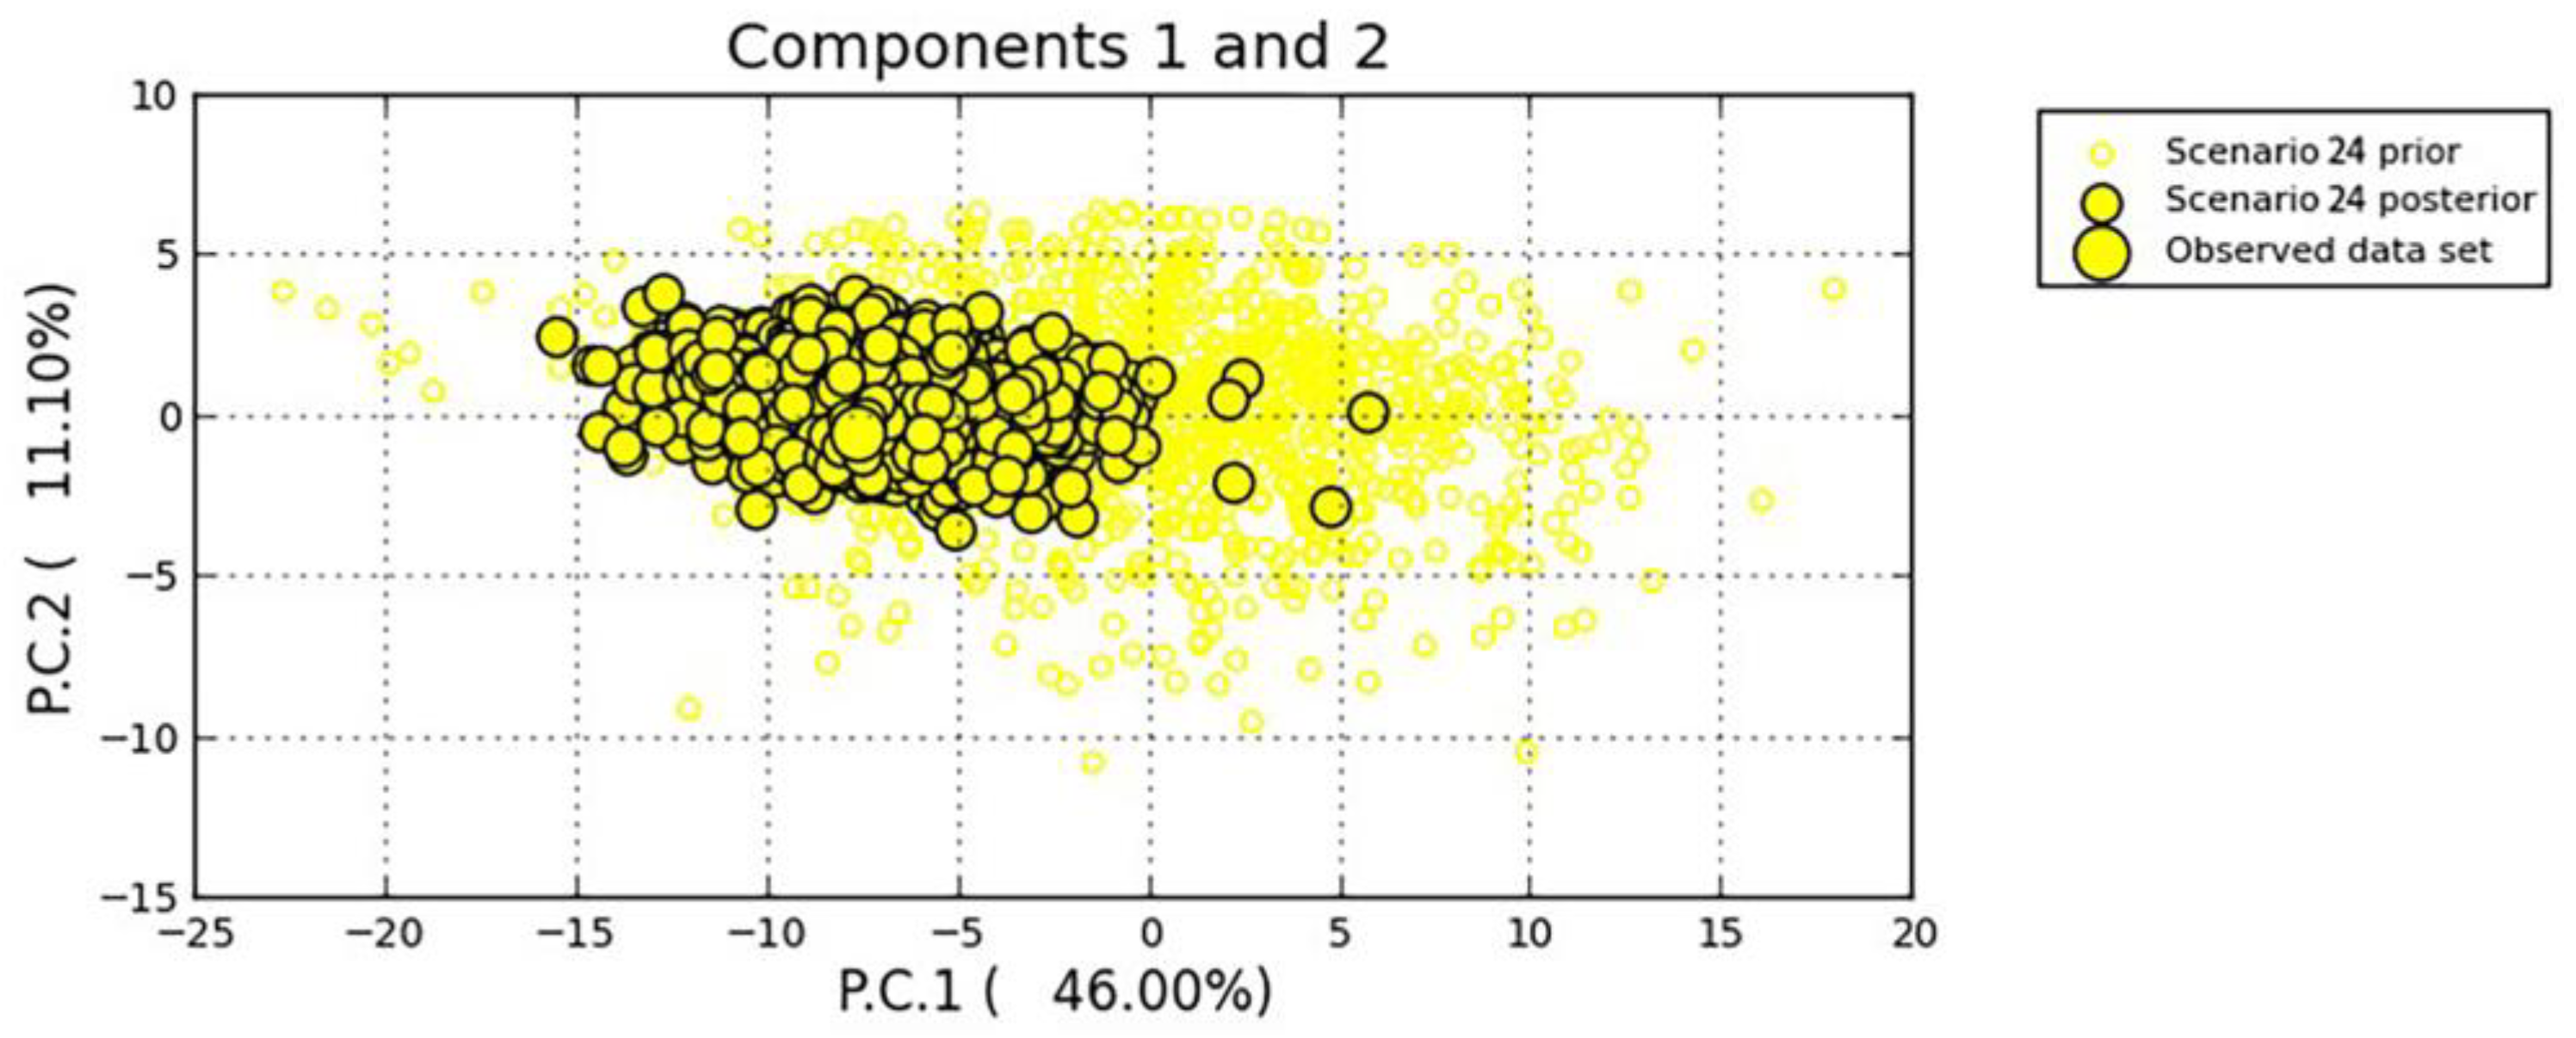
3.4. Population Divergence History
4. Discussion
5. Conclusions
Supplementary Materials
Author Contributions
Funding
Institutional Review Board Statement
Informed Consent Statement
Data Availability Statement
Conflicts of Interest
References
- Collins, C.; Xu, J.; Tang, S. Schistosomiasis control and the health system in P.R. China. Infect. Dis. Poverty 2012, 1, 8. [Google Scholar] [CrossRef] [PubMed]
- Zhang, L.J.; Xu, Z.M.; Yang, F.; Dang, H.; Li, Y.L.; Lu, S.; Cao, C.L.; Xu, J.; Li, S.Z.; Zhou, X.N. Endemic status of schistosomiasis in People’s Republic of China in 2020. Zhongguo Xue Xi Chong Bing Fang Zhi Za Zhi 2021, 33, 225–233. [Google Scholar] [CrossRef]
- Hu, B.-J.; Xie, H.-L.; Li, S.-M.; Zhao, Z.-Y.; Zhou, Y.-B.; Luo, Z.-H.; Jiang, Q.-W.; Ren, G.-H. Measures and achievements of schistosomiasis control in the Yangtze River Basin. Zhongguo Xue Xi Chong Bing Fang Zhi Za Zhi 2018, 30, 592–595. [Google Scholar] [CrossRef]
- Zou, H.Y.; Yu, Q.F.; Qiu, C.; Webster, J.P.; Lu, D.B. Meta-analyses of Schistosoma japonicum infections in wild rodents across China over time indicates a potential challenge to the 2030 elimination targets. PLoS Negl. Trop. Dis. 2020, 14, e0008652. [Google Scholar] [CrossRef] [PubMed]
- Liang, S.; Ponpetch, K.; Zhou, Y.B.; Guo, J.; Erko, B.; Stothard, J.R.; Murad, M.H.; Zhou, X.N.; Satrija, F.; Webster, J.P.; et al. Diagnosis of Schistosoma infection in non-human animal hosts: A systematic review and meta-analysis. PLoS Negl. Trop. Dis. 2022, 16, e0010389. [Google Scholar] [CrossRef] [PubMed]
- Li, Z.J.; Ge, J.; Dai, J.R.; Wen, L.Y.; Lin, D.D.; Madsen, H.; Zhou, X.N.; Lv, S. Biology and control of snail intermediate host of Schistosoma japonicum in The People’s Republic of China. Adv. Parasitol. 2016, 92, 197–236. [Google Scholar] [CrossRef] [PubMed]
- Liu, M.M.; Feng, Y.; Zhang, J.F.; Shi, L.; Wang, X.Y.; Liu, L.; Zhao, S.; Xiong, C.R.; Dong, X.; Yao, Y.Y.; et al. Spatio-temporal patterns of Oncomelania hupensis snail habitats in Suzhou, Wuxi and Changzhou cities along the Taihu Lake region. Zhongguo Xue Xi Chong Bing Fang Zhi Za Zhi 2020, 32, 469–475. [Google Scholar] [CrossRef]
- Zhang, J.F.; Li, W.; Feng, Y.; Yao, Y.Y.; Wang, X.Y.; Xiong, C.R.; Liu, L.; Yang, K. Endemic situation of schistosomiasis in national surveillance sites of Jiangsu Province from 2011 to 2018. Zhongguo Xue Xi Chong Bing Fang Zhi Za Zhi 2019, 31, 599–602. [Google Scholar] [CrossRef]
- Campbell, G.; Noble, L.R.; Rollinson, D.; Southgate, V.R.; Webster, J.P.; Jones, C.S. Low genetic diversity in a snail intermediate host (Biomphalaria pfeifferi Krass, 1848) and schistosomiasis transmission in the Senegal River Basin. Mol. Ecol. 2010, 19, 241–256. [Google Scholar] [CrossRef]
- Xu, X.J.; Wei, F.H.; Yang, X.X.; Dai, Y.H.; Yu, G.Y.; Chen, L.Y.; Su, Z.M. Possible effects of the Three Gorges dam on the transmission of Schistosoma japonicum on the Jiang Han plain, China. Ann. Trop. Med. Parasitol. 2000, 94, 333–341. [Google Scholar] [CrossRef]
- Zhang, L.J.; Xu, Z.M.; Dang, H.; Li, Y.L.; Lu, S.; Xu, J.; Li, S.Z.; Zhou, X.N. Endemic status of schistosomiasis in People’s Republic of China in 2019. Zhongguo Xue Xi Chong Bing Fang Zhi Za Zhi 2020, 32, 551–558. [Google Scholar] [CrossRef] [PubMed]
- Schlotterer, C.; Amos, B.; Tautz, D. Conservation of polymorphic simple sequence loci in cetacean species. Nature 1991, 354, 63–65. [Google Scholar] [CrossRef] [PubMed]
- Guan, W.; Li, S.Z.; Abe, E.M.; Webster, B.L.; Rollinson, D.; Zhou, X.N. The genetic diversity and geographical separation study of Oncomelania hupensis populations in mainland China using microsatellite loci. Parasites Vectors 2016, 9, 28. [Google Scholar] [CrossRef]
- Zhou, Y.B.; Zhao, G.M.; Wei, J.G.; Jiang, Q.W. Genetic diversity in 19 Chinese populations of Oncomelania hupensis (Gastropoda: Rissooidea) detected by simple sequence repeat-anchored polymerase chain reaction amplification. Zhonghua Liu Xing Bing Xue Za Zhi 2007, 28, 859–862. [Google Scholar]
- Li, S.Z.; Wang, Y.X.; Yang, K.; Liu, Q.; Wang, Q.; Zhang, Y.; Wu, X.H.; Guo, J.G.; Bergquist, R.; Zhou, X.N. Landscape genetics: The correlation of spatial and genetic distances of Oncomelania hupensis, the intermediate host snail of Schistosoma japonicum in mainland China. Geospat. Health 2009, 3, 221–231. [Google Scholar] [CrossRef]
- Qiu, C.; Lu, D.B.; Deng, Y.; Zou, H.Y.; Liang, Y.S.; Webster, J.P. Population genetics of Oncomelania hupensis snails, intermediate hosts of Schistosoma japonium, from emerging, re-emerging or established habitats within China. Acta Trop. 2019, 197, 105048. [Google Scholar] [CrossRef] [PubMed]
- Dabo, A.; Diarra, A.Z.; Machault, V.; Toure, O.; Niambele, D.S.; Kante, A.; Ongoiba, A.; Doumbo, O. Urban schistosomiasis and associated determinant factors among school children in Bamako, Mali, West Africa. Infect. Dis. Poverty 2015, 4, 4. [Google Scholar] [CrossRef]
- Peakall, R.; Smouse, P.E. GenAlEx 6.5: Genetic analysis in Excel. Population genetic software for teaching and research--an update. Bioinformatics 2012, 28, 2537–2539. [Google Scholar] [CrossRef]
- Excoffier, L.; Lischer, H.E. Arlequin suite ver 3.5: A new series of programs to perform population genetics analyses under Linux and Windows. Mol. Ecol. Resour. 2010, 10, 564–567. [Google Scholar] [CrossRef]
- Pritchard, J.K.; Stephens, M.; Donnelly, P. Inference of population structure using multilocus genotype data. Genetics 2000, 155, 945–959. [Google Scholar] [CrossRef]
- Evanno, G.; Regnaut, S.; Goudet, J. Detecting the number of clusters of individuals using the software STRUCTURE: A simulation study. Mol. Ecol. 2005, 14, 2611–2620. [Google Scholar] [CrossRef] [PubMed]
- Earl, D.A.; Vonholdt, B.M. STRUCTURE HARVESTER: A website and program for visualizing STRUCTURE output and implementing the Evanno method. Conserv. Genet. Resour. 2012, 4, 359–361. [Google Scholar] [CrossRef]
- Guillot, G.; Santos, F. A computer program to simulate multilocus genotype data with spatially autocorrelated allele frequencies. Mol. Ecol. Resour. 2009, 9, 1112–1120. [Google Scholar] [CrossRef] [PubMed]
- Taubert, O.; Reinartz, I.; Meyerhenke, H.; Schug, A. diSTruct v1.0: Generating biomolecular structures from distance constraints. Bioinformatics 2019, 35, 5337–5338. [Google Scholar] [CrossRef] [PubMed]
- Hall, B.G. Building phylogenetic trees from molecular data with MEGA. Mol. Biol. Evol. 2013, 30, 1229–1235. [Google Scholar] [CrossRef] [PubMed]
- Husemann, M.; Zachos, F.E.; Paxton, R.J.; Habel, J.C. Effective population size in ecology and evolution. Heredity 2016, 117, 191–192. [Google Scholar] [CrossRef] [PubMed]
- Do, C.; Waples, R.S.; Peel, D.; Macbeth, G.M.; Tillett, B.J.; Ovenden, J.R. NeEstimator v2: Re-implementation of software for the estimation of contemporary effective population size (Ne) from genetic data. Mol. Ecol. Resour. 2014, 14, 209–214. [Google Scholar] [CrossRef]
- Waples, R.S.; Do, C. ldne: A program for estimating effective population size from data on linkage disequilibrium. Mol. Ecol. Resour. 2008, 8, 753–756. [Google Scholar] [CrossRef]
- Cornuet, J.M.; Pudlo, P.; Veyssier, J.; Dehne-Garcia, A.; Gautier, M.; Leblois, R.; Marin, J.M.; Estoup, A. DIYABC v2.0: A software to make approximate Bayesian computation inferences about population history using single nucleotide polymorphism, DNA sequence and microsatellite data. Bioinformatics 2014, 30, 1187–1189. [Google Scholar] [CrossRef]
- Aeschbacher, S.; Beaumont, M.A.; Futschik, A. A novel approach for choosing summary statistics in approximate Bayesian computation. Genetics 2012, 192, 1027–1047. [Google Scholar] [CrossRef]
- Bertorelle, G.; Benazzo, A.; Mona, S. ABC as a flexible framework to estimate demography over space and time: Some cons, many pros. Mol. Ecol. 2010, 19, 2609–2625. [Google Scholar] [CrossRef] [PubMed]
- Barres, B.; Carlier, J.; Seguin, M.; Fenouillet, C.; Cilas, C.; Ravigne, V. Understanding the recent colonization history of a plant pathogenic fungus using population genetic tools and Approximate Bayesian Computation. Heredity 2012, 109, 269–279. [Google Scholar] [CrossRef] [PubMed]
- Estoup, A.; Jarne, P.; Cornuet, J.M. Homoplasy and mutation model at microsatellite loci and their consequences for population genetics analysis. Mol. Ecol. 2002, 11, 1591–1604. [Google Scholar] [CrossRef] [PubMed]
- Fagundes, N.J.; Ray, N.; Beaumont, M.; Neuenschwander, S.; Salzano, F.M.; Bonatto, S.L.; Excoffier, L. Statistical evaluation of alternative models of human evolution. Proc. Natl. Acad. Sci. USA 2007, 104, 17614–17619. [Google Scholar] [CrossRef] [PubMed]
- Excoffier, L.; Estoup, A.; Cornuet, J.M. Bayesian analysis of an admixture model with mutations and arbitrarily linked markers. Genetics 2005, 169, 1727–1738. [Google Scholar] [CrossRef]
- Coltman, D.W.; Pilkington, J.G.; Smith, J.A.; Pemberton, J.M. Parasite-Mediated Selection against Inbred Soay Sheep in a Free-Living Island Populaton. Evolution 1999, 53, 1259–1267. [Google Scholar] [CrossRef]
- Jarne, P.; Theron, A. Genetic structure in natural populations of flukes and snails: A practical approach and review. Parasitology 2001, 123, S27–S40. [Google Scholar] [CrossRef]
- Wright, S. Evolution and Genetics of Population; University of Chicago Press: Chicago, IL, USA, 1978. [Google Scholar]
- Lu, D.B.; Rudge, J.W.; Wang, T.P.; Donnelly, C.A.; Fang, G.R.; Webster, J.P. Transmission of Schistosoma japonicum in marshland and hilly regions of China: Parasite population genetic and sibship structure. PLoS Negl. Trop. Dis. 2010, 4, e781. [Google Scholar] [CrossRef]
- Sun, C.S.; Luo, F.; Liu, X.; Miao, F.; Hu, W. Oncomelania hupensis retains its ability to transmit Schistosoma japonicum 13 years after migration from permissive to non-permissive areas. Parasites Vectors 2020, 13, 146. [Google Scholar] [CrossRef]
- Hauswald, A.K.; Remais, J.V.; Xiao, N.; Davis, G.M.; Lu, D.; Bale, M.J.; Wilke, T. Stirred, not shaken: Genetic structure of the intermediate snail host Oncomelania hupensis robertsoni in an historically endemic schistosomiasis area. Parasites Vectors 2011, 4, 206. [Google Scholar] [CrossRef]
- Chen, S.; Lu, D.; Duan, L.; Ma, B.; Lv, C.; Li, Y.L.; Lu, S.N.; Li, L.H.; Xu, L.; Wu, Z.S.; et al. Cross-watershed distribution pattern challenging the elimination of Oncomelania hupensis, the intermediate host of Schistosoma japonica, in Sichuan province, China. Parasites Vectors 2022, 15, 363. [Google Scholar] [CrossRef] [PubMed]
- Zhao, Q.P.; Jiang, M.S.; Littlewood, D.T.; Nie, P. Distinct genetic diversity of Oncomelania hupensis, intermediate host of Schistosoma japonicum in mainland China as revealed by ITS sequences. PLoS Negl. Trop. Dis. 2010, 4, e611. [Google Scholar] [CrossRef] [PubMed]
- Wood, C.L.; Sokolow, S.H.; Jones, I.J.; Chamberlin, A.J.; Lafferty, K.D.; Kuris, A.M.; Jocque, M.; Hopkins, S.; Adams, G.; Buck, J.C.; et al. Precision mapping of snail habitat provides a powerful indicator of human schistosomiasis transmission. Proc. Natl. Acad. Sci. USA 2019, 116, 23182–23191. [Google Scholar] [CrossRef]
- Head, J.R.; Chang, H.; Li, Q.; Hoover, C.M.; Wilke, T.; Clewing, C.; Carlton, E.J.; Liang, S.; Lu, D.; Zhong, B.; et al. Genetic Evidence of Contemporary Dispersal of the Intermediate Snail Host of Schistosoma japonicum: Movement of an NTD Host Is Facilitated by Land Use and Landscape Connectivity. PLoS Negl. Trop. Dis. 2016, 10, e0005151. [Google Scholar] [CrossRef] [PubMed]
- Zhang, Z.; Ong, S.; Peng, W.; Zhou, Y.; Zhuang, J.; Zhao, G.; Jiang, Q. A model for the prediction of Oncomelania hupensis in the lake and marshland regions, China. Parasitol. Int. 2008, 57, 121–131. [Google Scholar] [CrossRef] [PubMed]


| Site/Year | Snail Habitat (m2) | No. Surveyed Frames (/0.11 m2) | No. Snail Frames (/0.11 m2) | Snail Density (/0.11 m2) |
|---|---|---|---|---|
| 2014 | 1425 | 250 | 5 | 1.60 |
| 2015 | 600 | 32 | 26 | 6.88 |
| 2016 | 700 | 30 | 24 | 7.03 |
| 2017 | 1330 | 25 | 27 | 26.26 |
| Population | N | Na | NeA | Ho | He | uHe | FIS | |
|---|---|---|---|---|---|---|---|---|
| 2014 | Mean | 30.778 | 3.333 | 2.568 | 0.349 | 0.536 | 0.544 | 0.377 |
| SE | 3.957 | 0.601 | 0.330 | 0.088 | 0.079 | 0.080 | 0.110 | |
| 2015 | Mean | 33.778 | 4.556 | 2.682 | 0.391 | 0.503 | 0.509 | 0.301 |
| SE | 4.037 | 0.959 | 0.436 | 0.132 | 0.103 | 0.104 | 0.161 | |
| 2016 | Mean | 28.333 | 4.889 | 2.654 | 0.343 | 0.538 | 0.551 | 0.495 |
| SE | 3.686 | 0.790 | 0.394 | 0.101 | 0.078 | 0.078 | 0.130 | |
| 2017 | Mean | 37.778 | 3.667 | 2.172 | 0.384 | 0.447 | 0.452 | 0.138 |
| SE | 3.639 | 0.601 | 0.303 | 0.089 | 0.090 | 0.092 | 0.088 |
| Source of Variation | Sum of Squares | Variance Components | Percentage of Variation | Fixation Index |
|---|---|---|---|---|
| Among populations | 82.084 | 0.331 | 18.97 | FST = 0.190 * |
| within populations | 438.184 | 1.414 | 81.03 |
| Population | 2014 | 2015 | 2016 | 2017 |
|---|---|---|---|---|
| 2014 | 2.185 | 2.064 | 2.394 | |
| 2015 | 0.241 * | 0.193 | 0.196 | |
| 2016 | 0.236 * | 0.066 * | 0.264 | |
| 2017 | 0.320 * | 0.094 * | 0.133 * |
| Population | With NeEst | With LDNe |
|---|---|---|
| 2014 | 175.6 (11.5, 898.5) | 43.0 (16.2, Inf) |
| 2015 | Inf (33.0, Inf) | Inf (69.8, Inf) |
| 2016 | 20.7 (4.8, 31.6) | 53.9 (17.4, Inf) |
| 2017 | 3687.7 (15.2, Inf) | 52.0 (20.0, Inf) |
| Analysis | Scenario Code | Scenario Profile | Posterior Probability | 95% CI | ||
|---|---|---|---|---|---|---|
| t3 | t2 | t1 | ||||
| No admixture (t1 t2 t3) | 5 | 2014 → 2015 | 2015 → 2016 | 2015 → 2017 | 0.2561 | [0.2376,0.2747] |
| Admixture (t1 t2 t3) | 12 | 2014 → 2015 | 2015 → 2016 | 2015 + 2016 → 2017 | 0.1964 | [0.1811,0.2116] |
| No admixture (t1 t2) | 24 | 2014 → 2015 | 2015 → 2016; 2015 → 2017 | 0.5326 | [0.5114,0.5538] | |
| Admixture (t1 t2) | 29 | 2014 → 2015 | 2015 → 2016; 2014 + 2015 → 2017 | 0.0138 | [0.0045,0.0230] | |
| No admixture (t1) | 33 | 2014 → 2015; 2014 → 2016; 2014 → 2017 | 0.0011 | [0.0000,0.0102] | ||
Disclaimer/Publisher’s Note: The statements, opinions and data contained in all publications are solely those of the individual author(s) and contributor(s) and not of MDPI and/or the editor(s). MDPI and/or the editor(s) disclaim responsibility for any injury to people or property resulting from any ideas, methods, instructions or products referred to in the content. |
© 2023 by the authors. Licensee MDPI, Basel, Switzerland. This article is an open access article distributed under the terms and conditions of the Creative Commons Attribution (CC BY) license (https://creativecommons.org/licenses/by/4.0/).
Share and Cite
Cheng, Y.-H.; Sun, M.-T.; Wang, N.; Gao, C.-Z.; Peng, H.-Q.; Zhang, J.-Y.; Gu, M.-M.; Lu, D.-B. Population Genetics of Oncomelania hupensis Snails from New-Emerging Snail Habitats in a Currently Schistosoma japonicum Non-Endemic Area. Trop. Med. Infect. Dis. 2023, 8, 42. https://doi.org/10.3390/tropicalmed8010042
Cheng Y-H, Sun M-T, Wang N, Gao C-Z, Peng H-Q, Zhang J-Y, Gu M-M, Lu D-B. Population Genetics of Oncomelania hupensis Snails from New-Emerging Snail Habitats in a Currently Schistosoma japonicum Non-Endemic Area. Tropical Medicine and Infectious Disease. 2023; 8(1):42. https://doi.org/10.3390/tropicalmed8010042
Chicago/Turabian StyleCheng, Yu-Heng, Meng-Tao Sun, Ning Wang, Chang-Zhe Gao, Han-Qi Peng, Jie-Ying Zhang, Man-Man Gu, and Da-Bing Lu. 2023. "Population Genetics of Oncomelania hupensis Snails from New-Emerging Snail Habitats in a Currently Schistosoma japonicum Non-Endemic Area" Tropical Medicine and Infectious Disease 8, no. 1: 42. https://doi.org/10.3390/tropicalmed8010042
APA StyleCheng, Y.-H., Sun, M.-T., Wang, N., Gao, C.-Z., Peng, H.-Q., Zhang, J.-Y., Gu, M.-M., & Lu, D.-B. (2023). Population Genetics of Oncomelania hupensis Snails from New-Emerging Snail Habitats in a Currently Schistosoma japonicum Non-Endemic Area. Tropical Medicine and Infectious Disease, 8(1), 42. https://doi.org/10.3390/tropicalmed8010042