1. Introduction
Fatigue affects professions that demand sustained attention. These include driving, operating technical systems, and providing medical care. It reduces physical and mental performance. There are a lot of causes, including prolonged exertion, inadequate rest, or environmental stressors. In high-stakes environments, fatigue impairs reaction time, decision-making, and situational awareness. This leads to lower productivity and higher error risks. For example, fatigued drivers contribute to many road accidents [
1]. Tired medical professionals may endanger patient safety [
2]. Operators of complex systems, such as those in aerospace, face risks when fatigue delays responses to critical events [
3]. Effective fatigue detection and mitigation are, thus, essential across multiple domains.
Traditional methods like electroencephalography (EEG) and electrooculography (EOG) measure physiological signals. EEG detects brain wave changes linked to drowsiness [
4]. EOG tracks eye movements to identify blink patterns [
5]. These approaches offer high precision. However, they require electrodes on the scalp or around the eyes. This setup causes discomfort and restricts mobility. Drivers or operators cannot use such systems daily. As a result, these methods lack practicality for widespread use.
Non-invasive alternatives use computer vision and artificial intelligence (AI). Cameras capture video data to analyze behavioral cues. Eye closure duration, measured as Percentage of Eye Closure (PERCLOS), indicates drowsiness [
6]. Deep learning models, like Convolutional Neural Networks (CNNs), detect yawning or head tilting [
7]. These systems need no physical contact. They integrate into devices like dashboards or computers. However, current non-invasive methods focus only on fatigue identification. They lack dynamic interaction with users. This limits adaptation to individual differences, such as blinking habits, or contextual factors, like lighting conditions.
Existing systems also miss feedback mechanisms. Fatigue varies between individuals. Sleep history, stress, and environment affect it. Without user input, systems cannot adjust for these factors. For instance, frequent blinking may stem from dry eyes, not drowsiness [
2]. A focused expression might resemble exhaustion. Unidirectional systems risk false predictions. This reduces trust and utility.
We propose a non-invasive fatigue detection system. It combines AI analysis with human–machine interaction. A Long Short-Term Memory (LSTM) network processes eye blinks and facial expressions from webcam video. LSTM models temporal patterns, such as blink duration changes, better than static methods. A Telegram chatbot enables real-time feedback. It asks users to confirm or clarify fatigue predictions. This improves accuracy and builds a personalized knowledge base. Our broader project, with Professors Shichkina and Krinkin [
8], includes a multimodal AI framework. It integrates physiological data, like heart rate from smartwatches, and environmental factors, like temperature. This enhances robustness beyond facial cues alone.
Our goals are twofold. First, we aim to detect fatigue accurately in real time using vision-based techniques. Second, we seek to create an adaptive interaction mechanism. This blends human input with machine intelligence. The system targets safety and efficiency in high-stakes settings.
In this paper, the term “fatigue” is used in a broad sense that includes both cognitive fatigue—resulting from mental workload—and drowsiness—linked to sleepiness and reduced alertness. While these states differ physiologically, they often overlap in behavioral and biometric manifestations. This perspective aligns with prior multimodal studies and with the structure of datasets such as UTA-RLDD, where fatigue and drowsiness are not always strictly separated. We adopt this integrated usage throughout the paper.
Section 2 provides a comprehensive literature review of existing fatigue detection techniques, focusing on invasive and non-invasive approaches, datasets used in fatigue research, and current multimodal and interactive methods.
Section 3 details the methodology, including data processing, LSTM modeling, and interaction design.
Section 4 describes experimental methods.
Section 5 discusses the results, limitations, and potential improvements. Finally,
Section 6 concludes with key contributions and future research directions.
3. Proposed Method
This section presents a comprehensive methodology for non-invasive fatigue detection, designed to address the shortcomings of existing systems through a novel integration of temporal deep learning, real-time human–machine interaction, and a scalable multimodal framework. Our approach leverages advanced AI techniques to model fatigue dynamics, incorporates user feedback to enhance adaptability, and proposes a forward-looking extension for multi-source data fusion. Below, we detail the system architecture, data processing pipeline, fatigue assessment model, interaction mechanism, and multimodal extension, emphasizing scientific rigor, computational efficiency, and practical applicability.
3.1. System Architecture
The system is structured as a modular pipeline comprising three core components, each optimized for specific tasks yet interconnected to form a cohesive fatigue detection framework (see
Figure 1):
(1) Data Collection Module: Acquires real-time video streams of the user’s face via a standard webcam operating at 30 frames per second (fps), ensuring minimal hardware requirements while capturing sufficient temporal resolution.
(2) Fatigue Assessment Module: Employs a Long Short-Term Memory (LSTM) neural network to process sequential facial parameters, classifying fatigue states into three categories: normal, low fatigue, and fatigued. This module leverages the temporal nature of fatigue indicators, distinguishing it from static classification approaches.
(3) Human–Machine Interaction Module: Integrates a Telegram-based chatbot to solicit user feedback, enabling a closed-loop system that refines predictions and builds a dynamic knowledge base. This interactivity addresses the lack of adaptability in traditional systems.
Figure 1.
Fatigue Detection System.
Figure 1.
Fatigue Detection System.
The architecture is designed for modularity and scalability, allowing independent optimization of each module (e.g., swapping LSTM for GRU or replacing Telegram with another platform) while maintaining a unified workflow. Unlike unidirectional systems, our feedback loop introduces a human-in-the-loop paradigm, enhancing both accuracy and user trust.
3.2. Data Processing
Data processing converts raw video frames into a feature set optimized for temporal analysis, focusing on two key fatigue indicators: eye dynamics and facial expression changes. We employ the dlib library with a pre-trained shape predictor (68-point facial landmark model) to extract coordinates (,) for each frame, processed at 30 fps. The pipeline includes landmark detection, feature extraction, and normalization, detailed below.
3.2.1. Eye Aspect Ratio (EAR) and Blink Dynamics
Eye behavior is a primary fatigue marker, with drowsiness often manifesting as prolonged blinks or reduced eye openness. For each eye, six landmarks (
to
) are extracted, following Soukupová and Čech [
21]. The EAR is calculated as shown in Equation (1):
In (1):
, : Horizontal eye corners (left and right)
, , , : Vertical points on the upper and lower eyelids
is the Euclidean distance
The EAR normalizes vertical eye height by width, mitigating variations due to head tilt or camera distance. To capture temporal dynamics, we analyze a sequence of 10 consecutive blinks (approximately 10–15 s), extracting four features:
Peak EAR (): Maximum value in a blink cycle, typically 0.3–0.4 when eyes are fully open
Minimum EAR (): Minimum value during closure, approaching 0.05–0.1 for a full blink
Blink Duration:
Blink detection uses a threshold-based algorithm: a blink is identified when EAR drops below 0.2 (empirically determined) for at least three frames and rises above it, ensuring robustness against noise or partial closures.
Figure 2 demonstrates the analysis of EAR and blink frequency over a 10-blink sequence.
3.2.2. Facial Expression Index
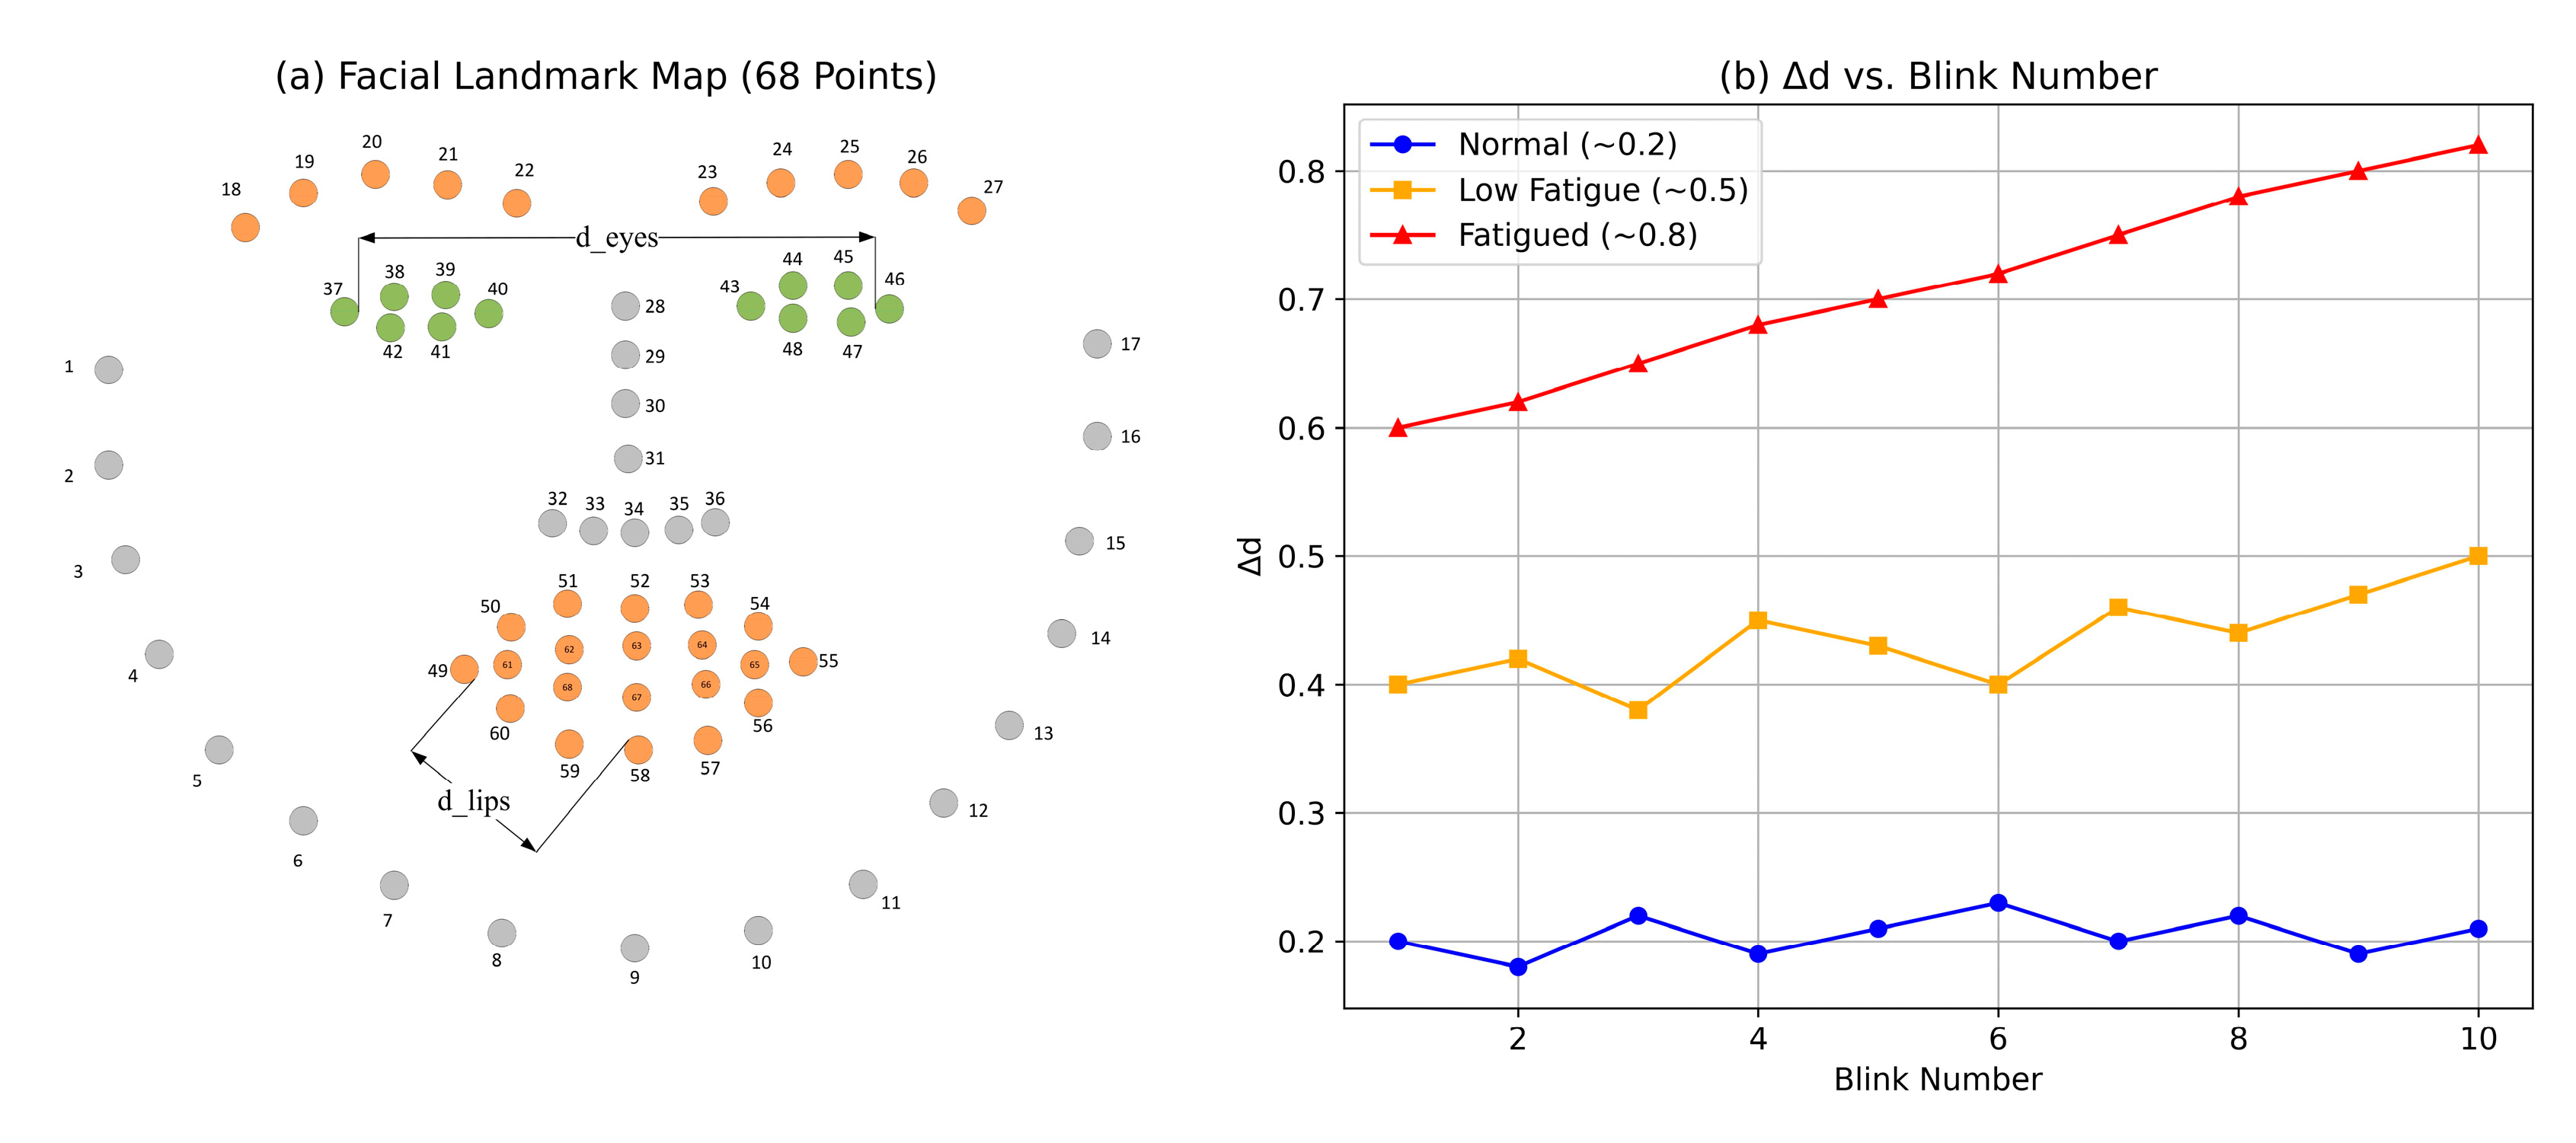
Facial expressions provide contextual cues about fatigue, such as drooping features or reduced mobility. We compute Euclidean distances between key landmark pairs per frame:
Eye Distance:
where points 37 and 46 are outer eye corners.
Mouth Distance:
where points 49 and 58 are vertical mouth extremes.
To quantify change over time, we normalize distances across the sequence:
where
and
are the minimum and maximum distances over
frames (typically 300–450). The final feature,
, is the average rate of change between blinks:
This captures subtle shifts in facial tension, with higher values indicating fatigue-related relaxation.
Figure 3 shows the mapping of key facial landmarks used to extract features such as eye and mouth distances.
3.2.3. Feature Preprocessing
Features are standardized to zero mean and unit variance:
where
and
are the mean and standard deviation across the training set, ensuring numerical stability for LSTM input.
3.2.4. Fatigue Assessment
The fatigue assessment module uses an LSTM network to model temporal dependencies in the 10-blink sequence, with an input tensor of shape (“batch_size”, 10.5), where five features are
,
,
,
,
. The architecture is optimized for both accuracy and efficiency (see
Figure 4):
LSTM Layers: Three layers, each with 128 units, use ReLU activation and He initialization (variance = 2/fan_in) to accelerate convergence. The LSTM update equations are shown in Equations (9)–(11):
where
,
,
are forget, input, and output gates, and
is the cell state.
Dropout: Applied post-LSTM (rate 0.2) to regularize training, reducing overfitting on small datasets.
Dense Layers: Two layers (128 and 64 units, ReLU) compress features into a lower-dimensional space.
Output Layer: A 3-unit dense layer with softmax. The softmax function, used to compute class probabilities, is defined in Equation (12):
The model is trained with the Adam optimizer (learning rate 0.001,
,
) and categorical cross-entropy loss. This loss function is given in Equation (13):
where
is the batch size,
is the true label, and
is the predicted probability. Performance metrics include accuracy, precision, recall, and F1-score.
3.3. Human–Machine Interaction
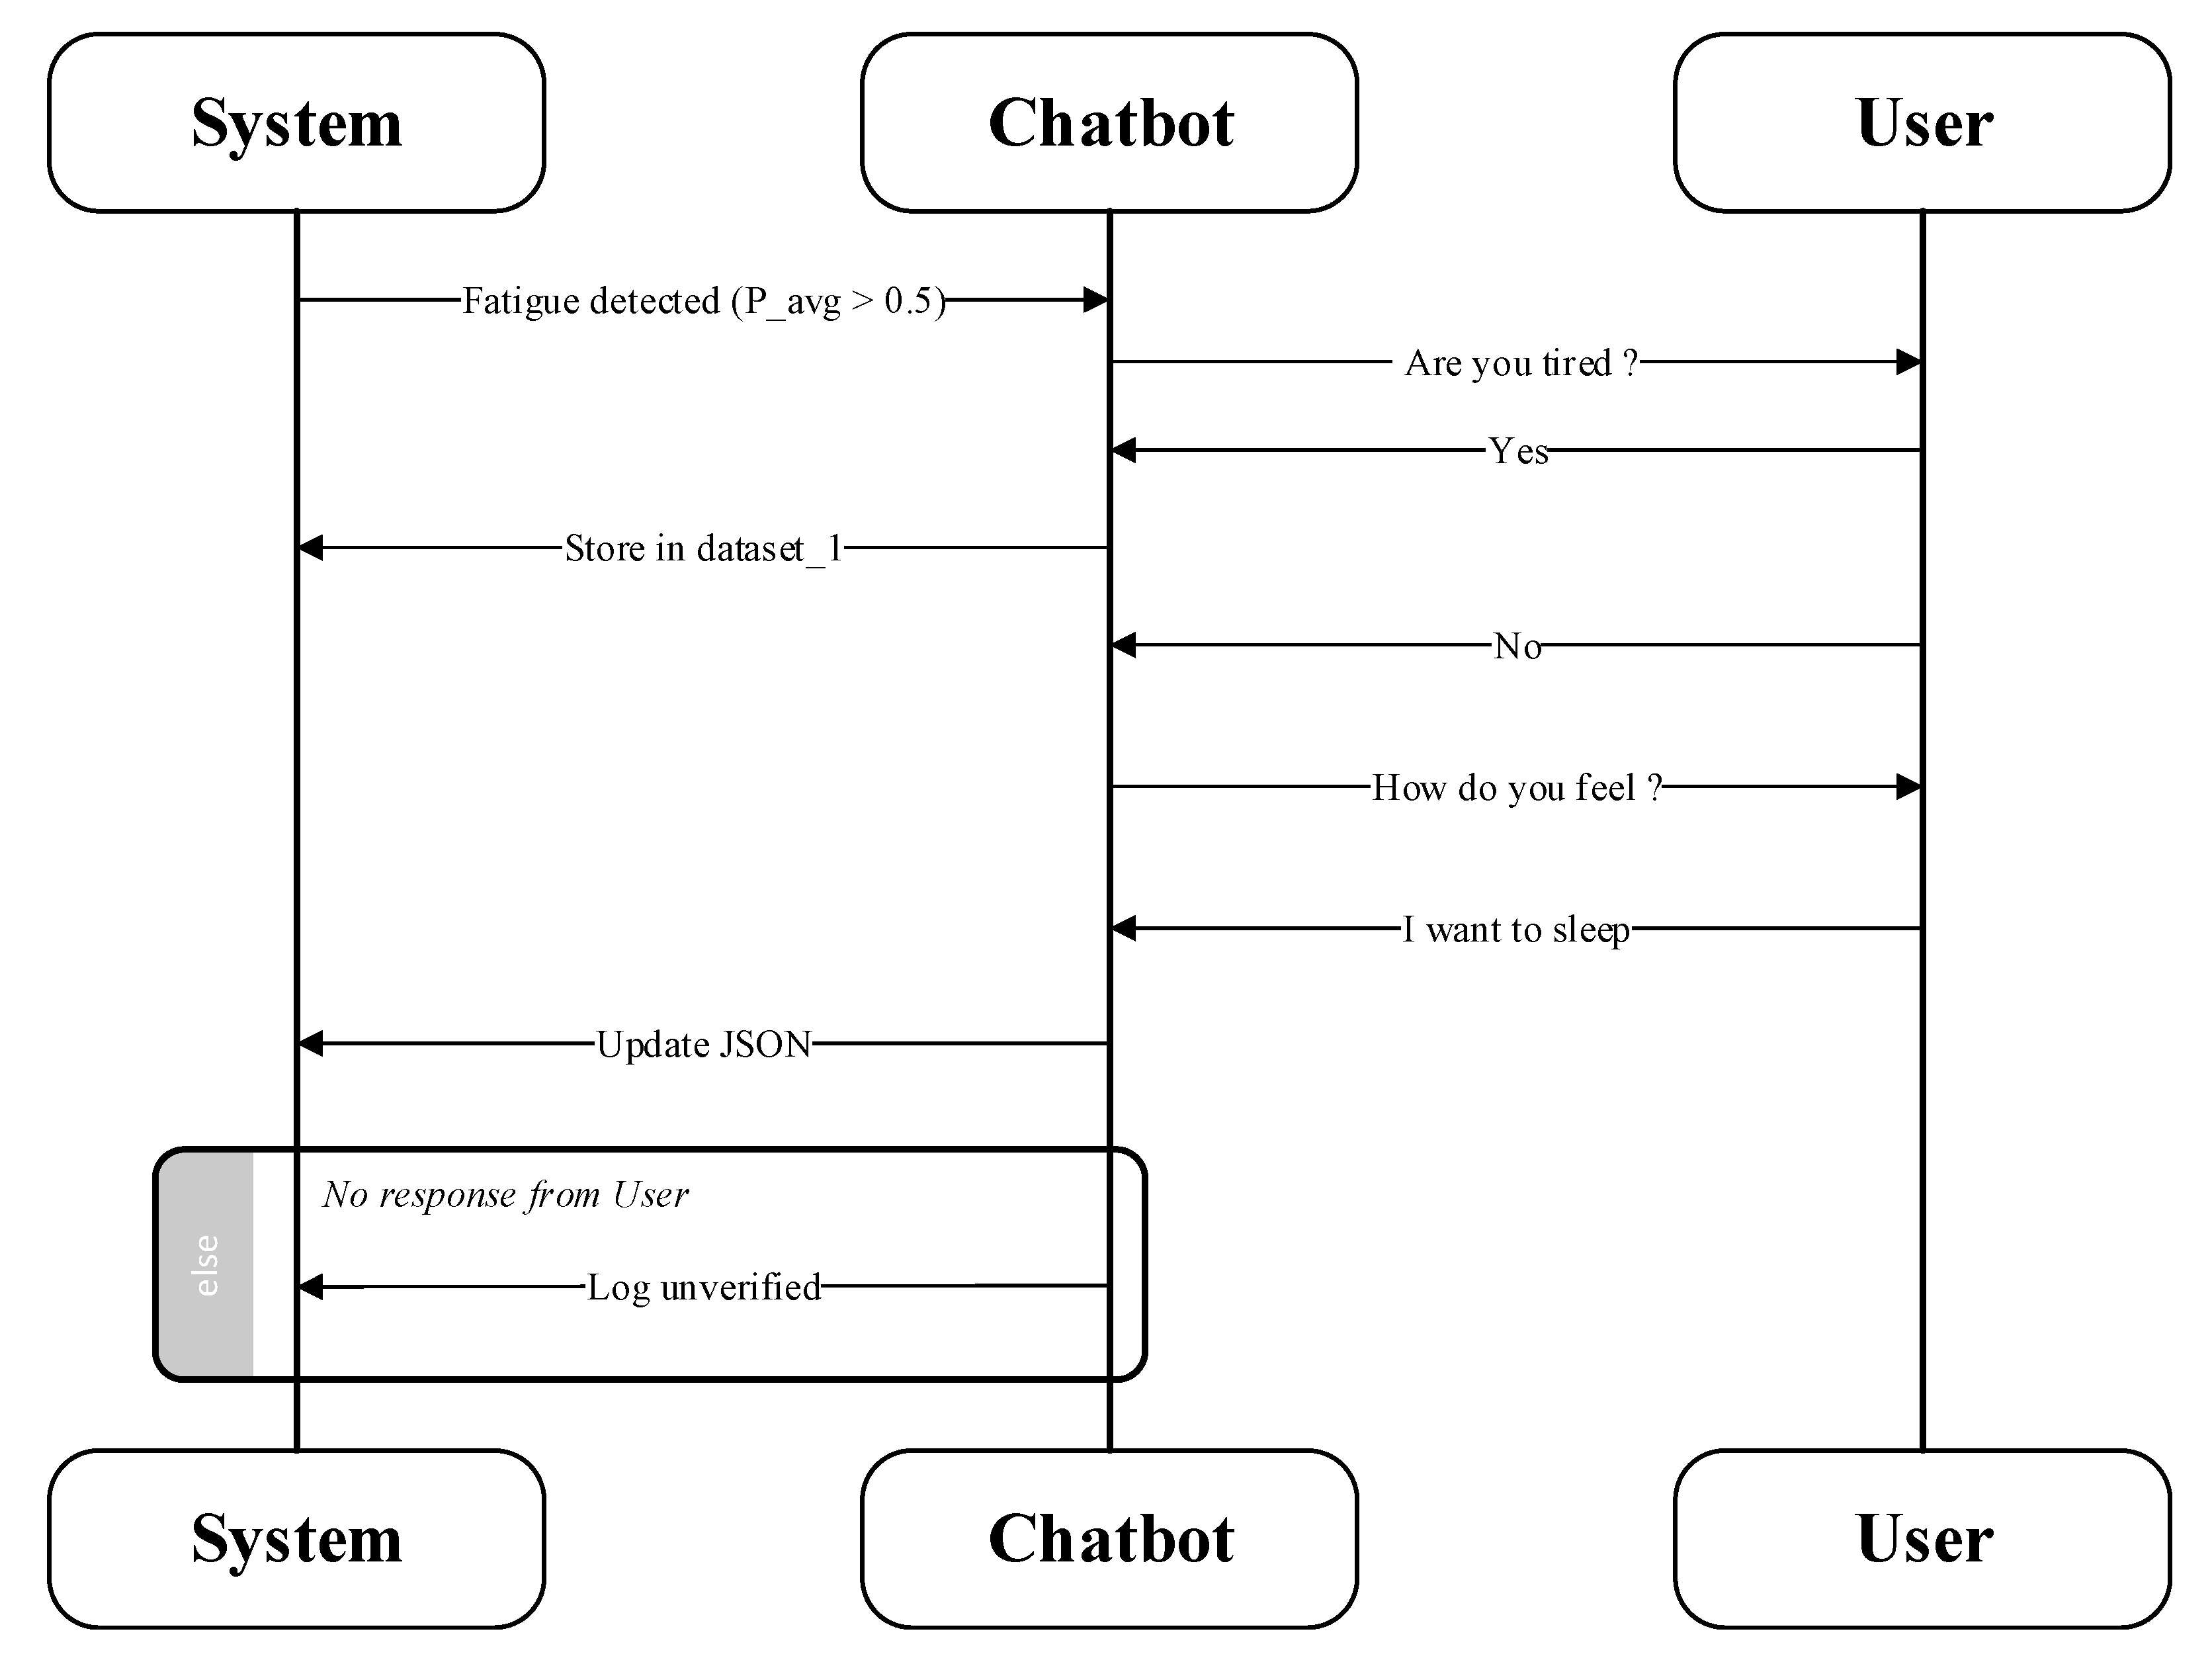
The interaction module enhances the adaptability of the model by incorporating user feedback through a Telegram chatbot, developed using the Telegram Bot API (version 8.1) and a Python library (version 3.10) for bot communication. Fatigue detection is initiated when the softmax probability for the “fatigued” state exceeds 0.5. This probability,
, is computed as the average of 600 short-term predictions, each derived from a sequence of 10 blinks. These predictions are collected over a 10-min interval to smooth out transient fluctuations. The average fatigue probability is calculated using Equation (14):
where
denotes the predicted probability of the “fatigued” state at time step
t. When
, the chatbot prompts the user with the question, “Are you tired?” to initiate interaction.
While subjective scales such as the Karolinska Sleepiness Scale (KSS) are widely used in laboratory-based studies for evaluating drowsiness, our framework does not incorporate such instruments. This is because the publicly available dataset we used (UTA-RLDD) does not include KSS scores, and our design prioritizes passive, real-time fatigue detection using observable behavioral signals and interactive chatbot feedback instead of explicit self-reporting.
The user’s response is then processed to refine the system’s predictions. If the user confirms fatigue by responding affirmatively, the system logs the corresponding features and label into a dataset, stored in a structured format with fields for timestamp, features, and label, for use in future retraining.
If the user responds negatively, the chatbot follows up with the question, “How do you feel?” to gather additional context. The user’s response, such as “I want to sleep,” is compared against a predefined knowledge base using cosine similarity on pre-trained word embeddings. This knowledge base contains categorized entries, such as phrases associated with low fatigue (e.g., “I want to sleep,” “falling asleep,” “eyes closing”) and normal states (e.g., “I’m fine,” “just focused”). If the response matches an entry, the prediction is adjusted accordingly; otherwise, the chatbot initiates further queries to clarify the user’s state.
In cases where the user does not respond within a 30-s timeout, the prediction is recorded as unverified. This process is illustrated in
Figure 5, which shows a sample interaction flow between the user and the fatigue detection system.
Additionally, the system updates its knowledge base when it encounters unrecognized phrases, such as “I’m drowsy,” by engaging the user in a structured dialogue. For example, the chatbot may ask, “What does ‘drowsy’ mean?” to which the user might respond, “Tired but awake.” A subsequent question, “Is this fatigue-related?” answered affirmatively, results in the addition of a new entry to the knowledge base, associating “drowsy” with a moderate fatigue level.
This interactive mechanism effectively reduces false positives and enables personalization of the system, as the knowledge base evolves over time and serves as a resource for periodic model retraining.
3.4. Multimodal Extension
To enhance system robustness and contextual awareness, we extend the proposed architecture to incorporate multimodal data sources beyond video-based inputs. This extension, developed in collaboration with Professors Shichkina and Krinkin [
6], is designed to fuse visual, physiological, and environmental signals into a unified decision-making framework.
The base system employs an LSTM network to model temporal dynamics in facial features such as eye blinks and expression changes.
Building upon this, the extended architecture integrates physiological data—namely heart rate (beats per minute) and body temperature (°C)—collected from wearable devices (e.g., smartwatches), alongside environmental parameters including ambient temperature(°C) and humidity (%), acquired via IoT sensors.
Figure 6 illustrates the proposed multimodal AI processing architecture integrating facial, physiological, and environmental data.
To ensure temporal consistency, multimodal streams are synchronized at a sampling frequency of 1 Hz and temporally aligned with video timestamps using interpolation. Decision fusion is handled via a Hybrid System Identification (HSI) module, which leverages both data-driven predictions and user feedback to resolve ambiguities in fatigue classification.
For example, if the minimum Eye Aspect Ratio (EARₘᵢₙ) falls below 0.1—indicating eye closure—but the heart rate remains under 60 bpm (a resting-state marker), the system flags the prediction as uncertain and seeks user confirmation through the chatbot interface. This conservative approach mitigates false positives caused by non-fatigue-related visual patterns.
To operationalize multimodal fusion, we employ interpretable models such as decision trees and fuzzy logic systems. In a representative decision tree, the system classifies the state as “Fatigued” if EARmin < 0.1, heart rate > 80 bpm, and sleep duration < 6 h. Alternatively, if the facial expression variation (Δd) exceeds 0.7 and ambient temperature > 30 °C, the state is classified as “Low Fatigue.” Fuzzy inference systems define membership functions for inputs (e.g., heart rate: 50–70 bpm as “low”; Δd: 0.5–1.0 as “high”) and apply linguistic rules (e.g., “IF heart rate is high AND Δd is high THEN fatigue is likely”) to estimate fatigue severity on a continuous scale.
Each input variable is modeled using three triangular membership functions (“low”, “medium”, “high”), with parameters empirically derived from the observed training data distributions. The fuzzy engine follows a Mamdani-type inference structure with max–min aggregation and centroid defuzzification.
This multimodal integration substantially improves system reliability, particularly in edge cases where visual data alone is inconclusive (e.g., occlusion, lighting variability). The resulting framework supports more nuanced and context-aware fatigue detection, paving the way for robust real-world deployment.
4. Experiments
This section provides an exhaustive evaluation of the proposed fatigue detection system, encompassing dataset preparation, implementation specifics, and a multifaceted performance analysis. Our experiments aim to rigorously assess the system’s accuracy, robustness, computational efficiency, and practical utility in real-world scenarios. We present detailed results through quantitative metrics, ablation studies, interaction analysis, and comparisons with state-of-the-art methods, supported by tables and figures to ensure clarity and professionalism. The evaluation leverages controlled datasets, real-time testing, and user feedback to validate the system’s effectiveness and highlight its innovations.
4.1. Dataset
The selection of an appropriate dataset is crucial to ensure the system’s generalizability and relevance to fatigue detection tasks. In this study, we exclusively utilize the UTA-RLDD dataset, as it captures a wide range of fatigue states and behavioral indicators, and aligns well with our temporal modeling approach.
4.1.1. UTA-RLDD Dataset
The UTA Real-Life Drowsiness Dataset (UTA-RLDD) [
22] serves as our primary benchmark, comprising 180 RGB videos recorded at 30 frames per second (fps) from 60 healthy participants (ages 18–45, balanced gender distribution). Each participant contributed three videos, representing distinct fatigue states: normal (alert, well-rested), low fatigue (mild drowsiness after moderate activity), and fatigued (severe drowsiness after sleep deprivation or prolonged tasks), yielding 60 videos per class. Video durations range from 5 to 15 min, totaling approximately 30 h of footage. Recordings were captured using consumer-grade devices (mobile phones or webcams) with resolutions between 640×480 and 1280 × 720, under varied conditions: natural daylight, artificial lighting, indoor offices, and outdoor settings. Fatigue labels were self-reported by participants and cross-verified by researchers through observable behavioral cues, such as yawning, prolonged eye closure, or head nodding. This dataset’s diversity in environmental factors and participant profiles ensures a realistic testbed for evaluating the system’s robustness across different contexts.
Table 1 summarizes the key characteristics of the UTA-RLDD dataset used in our experiments.
4.1.2. Data Preprocessing
To prepare the datasets for LSTM input, we standardized video resolutions to 640×480 using bilinear interpolation, ensuring uniformity while preserving facial detail. Facial landmarks (68 points) were extracted per frame using dlib’s pre-trained shape predictor, with a detection failure rate of <1% (e.g., due to extreme angles), addressed by frame interpolation from adjacent timestamps. Sequences of 10 consecutive blinks (~10–15 s, 300–450 frames at 30 fps) were segmented using the EAR threshold algorithm, yielding features , , , and .
For UTA-RLDD, the dataset was split into 80% training (144 videos, 48 per class) and 20% testing (36 videos, 12 per class), with stratification to maintain class balance. Features were normalized to zero mean and unit variance using training set statistics, ensuring numerical stability during model optimization. We did not explicitly create a separate validation set. However, model tuning was performed conservatively, and hyperparameters were not adjusted based on test performance. Early stopping based on training loss trends was used to prevent overfitting. Moreover, the subject-independent split (no individual appears in both sets) helps improve the generalization of the model by ensuring it does not memorize identity-specific patterns.
4.2. Implementation
The system was implemented with a focus on real-time performance, leveraging modern libraries and a robust hardware setup. We detail the environment, training process, real-time pipeline, and computational efficiency below.
4.2.1. Hardware and Software Setup
Experiments were conducted on a high-performance (Dell, Raheen Business Park, Limerick, Ireland), equipped with: Intel i7-9700K CPU (8 cores, 3.6 GHz base, turbo up to 4.9 GHz), 32 GB DDR4 RAM (3200 MHz), and an NVIDIA RTX 2080 Ti GPU (11 GB VRAM, 4352 CUDA cores; manufactured by NVIDIA Corporation, Santa Clara, CA, USA)). This configuration supports rapid training and inference, critical for deep learning tasks. The software stack includes Python 3.8 with:
TensorFlow 2.6: For LSTM model development, optimized with CUDA 11.2 and cuDNN 8.1 for GPU acceleration.
OpenCV 4.5: For video capture, frame resizing, and landmark detection via dlib (compiled with CUDA support).
Telegram Bot API: Implemented using python-telegram-bot 13.7 for asynchronous chatbot communication.
Auxiliary Libraries: numpy (numerical operations), scipy (signal processing), matplotlib (visualization), and tkinter (GUI).
4.2.2. Model Training
The LSTM model was trained on UTA-RLDD’s training set (144 videos) for 50 epochs with a batch size of 32, balancing memory usage and gradient stability. We used the Adam optimizer with an initial learning rate of 0.001, β1 = 0.9, β2 = 0.999, and an epsilon of 10−8 for numerical robustness. Learning rate was reduced by 0.5 if validation loss plateaued for 5 epochs (ReduceLROnPlateau callback), and training halted if validation accuracy stagnated for 10 epochs (EarlyStopping), saving the best model based on validation F1-score.
To enhance generalization, we applied data augmentation: random frame drops (5% probability) to simulate packet loss and Gaussian noise (σ = 0.01) on EAR values to mimic sensor noise.
Table 2 lists the training hyperparameters used to optimize the LSTM model.
4.2.3. Real-Time Implementation
The system operates in real-time at 30 fps using a multi-threaded architecture to minimize latency:
Acquisition Thread: Captures video from a Logitech C920 webcam (720 p, 30 fps) via OpenCV’s VideoCapture, buffering frames in a queue.
Processing Thread: Extracts landmarks, computes features per frame, and buffers 10-blink sequences (300–450 frames), synchronized with acquisition.
Inference Thread: Runs LSTM inference every 10 s (upon sequence completion), averaging predictions over a 10-min sliding window (600 sequences) to smooth transient fluctuations.
Interaction Thread: Manages Telegram chatbot communication, triggered when fatigue probability exceeds 0.5, running asynchronously to avoid blocking.
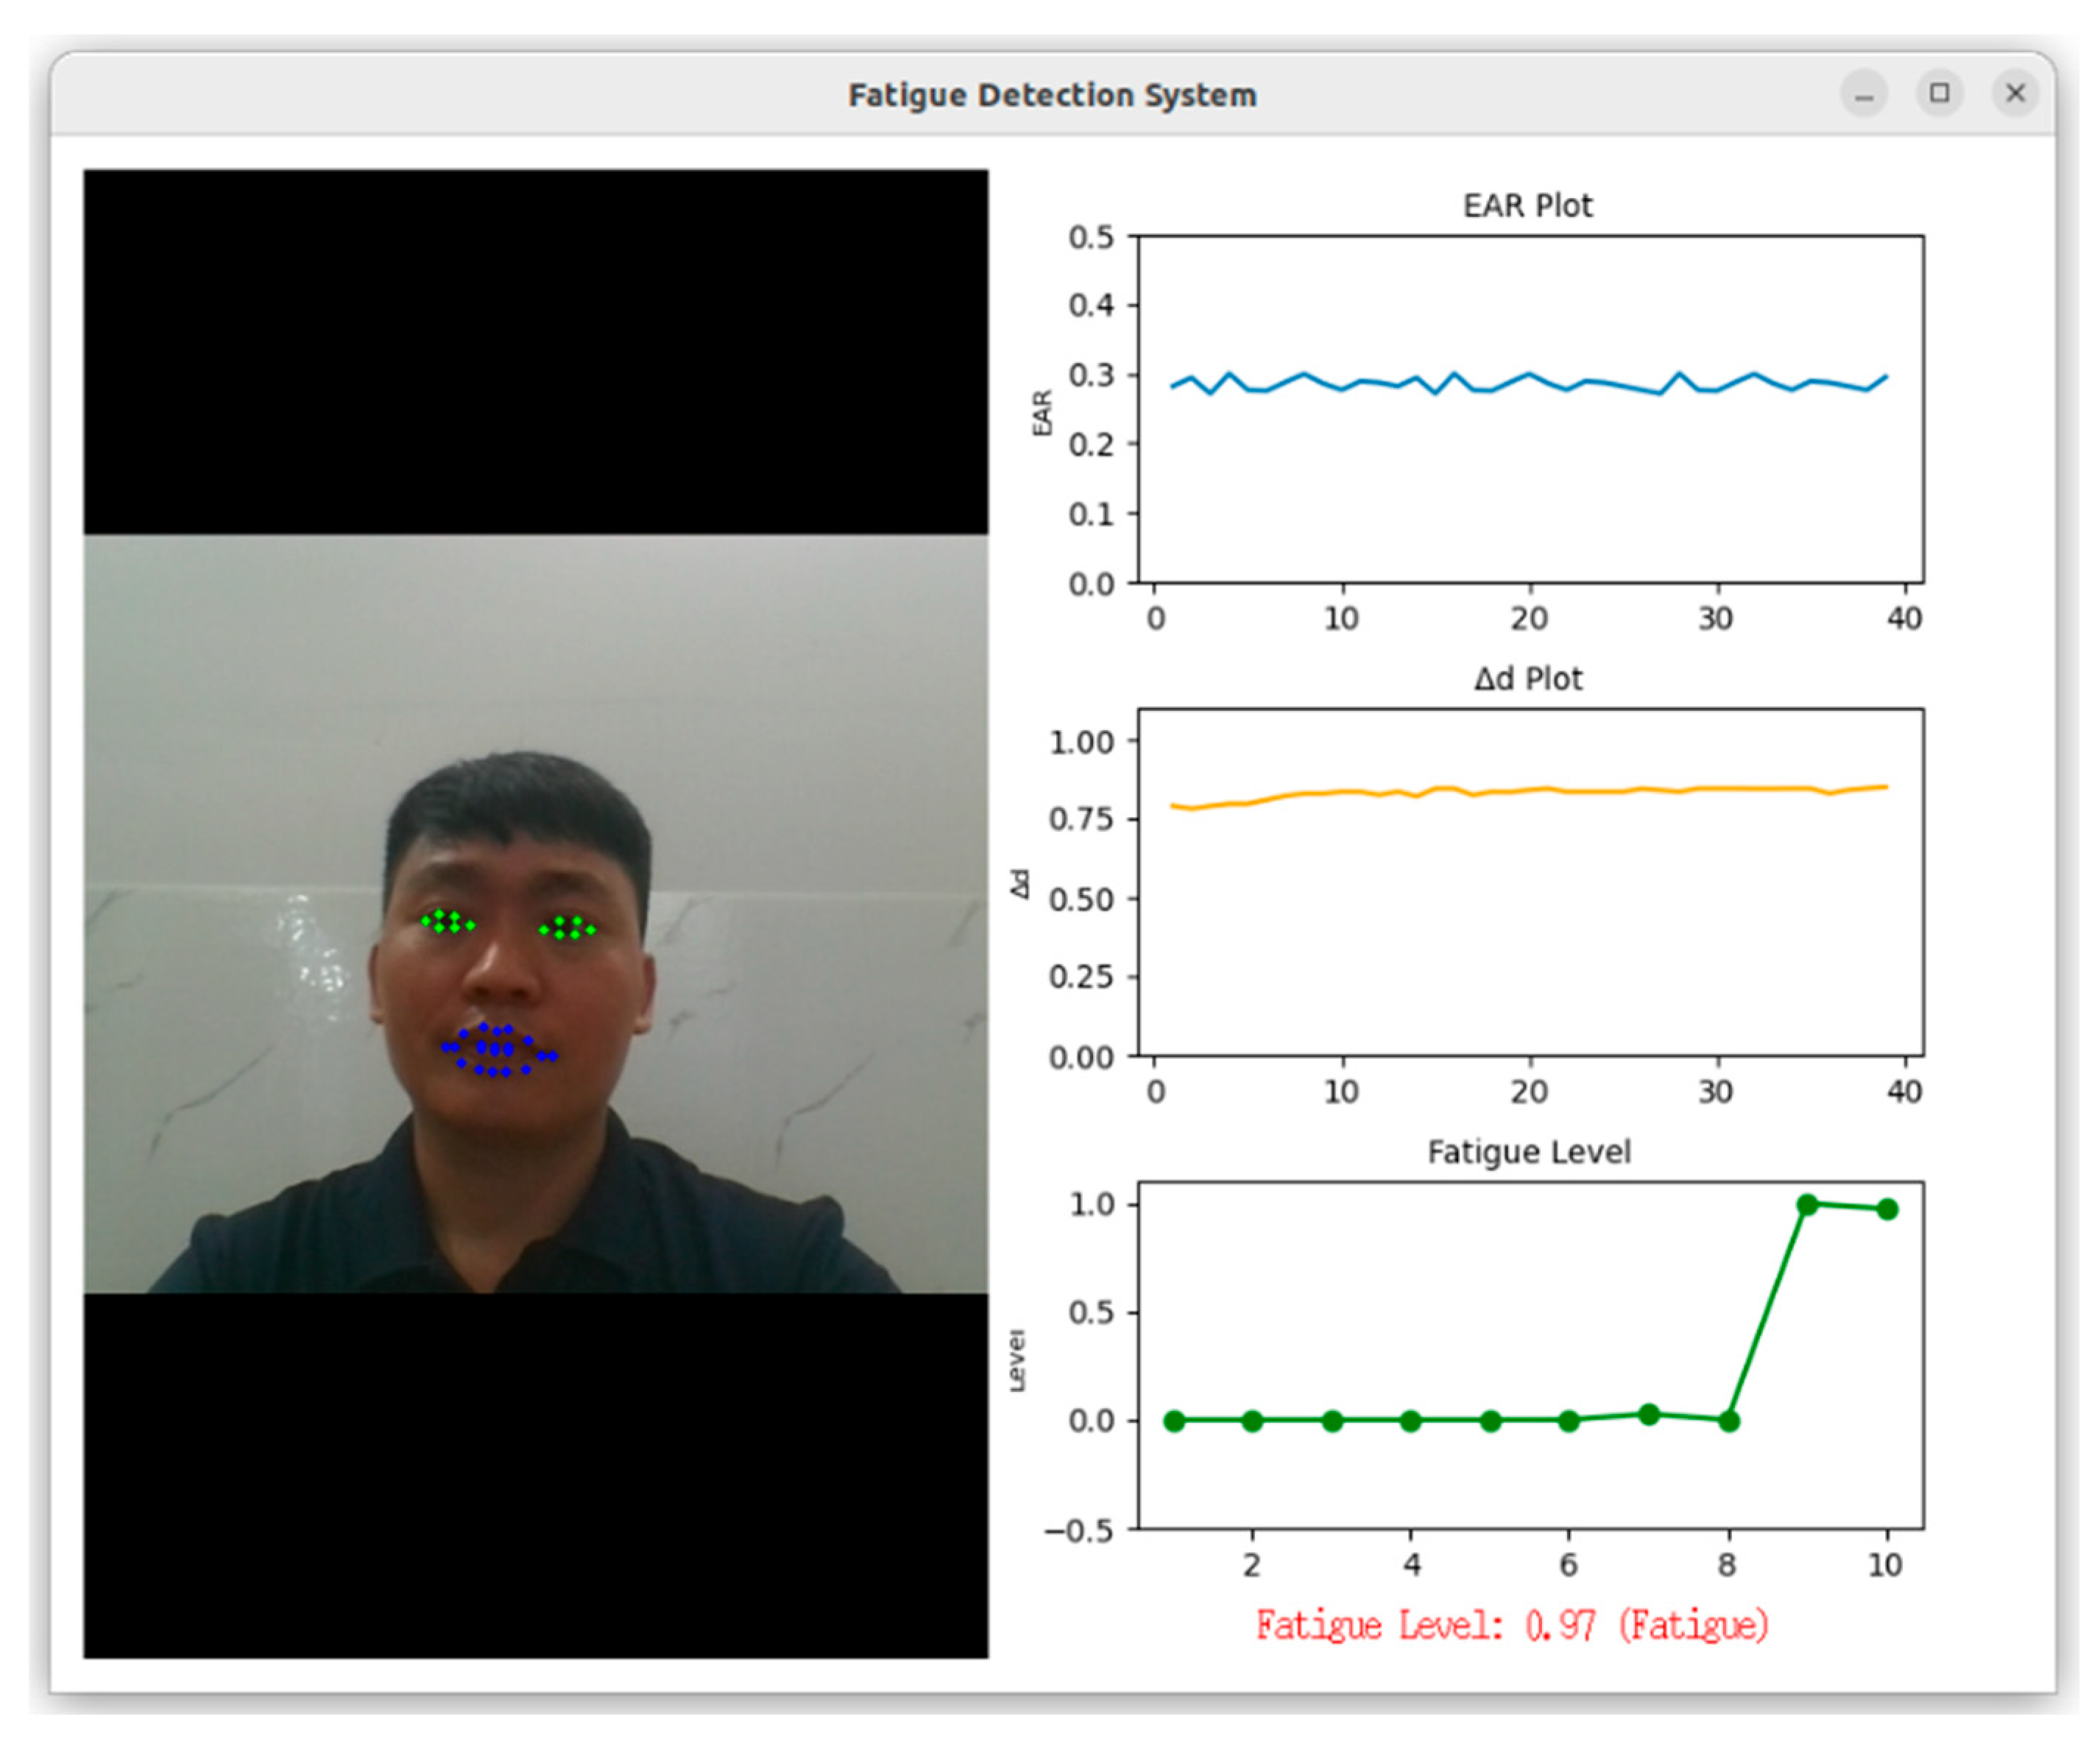
A graphical user interface (GUI) displays live metrics, enhancing transparency and user engagement (
Figure 7). The GUI updates every 0.5 s, balancing responsiveness and computational load.
4.2.4. Computational Performance
We measured computational efficiency across hardware configurations. On the GPU, inference latency averaged 15 ms per 10-blink sequence (66 sequences/second), well below the 33 ms threshold for 30 fps real-time processing.
CPU-only mode increased latency to 50 ms (20 sequences/second), still viable for lower-end systems. Peak memory usage was 4.2 GB (GPU) and 3.8 GB (CPU), feasible for mid-range hardware.
Table 3 reports the system’s computational performance across GPU and CPU setups.
4.3. Results
The system’s performance was evaluated using a comprehensive suite of metrics, ablation studies, interaction analysis, baseline comparisons, and qualitative insights, with results visualized through tables and figures.
4.3.1. Quantitative Results
On UTA-RLDD’s test set (36 videos), the LSTM model achieved:
Accuracy: 92.35%
Precision: 92.9%
Recall: 91.6%
F1-score: 92.2% ()
Per-class breakdown (
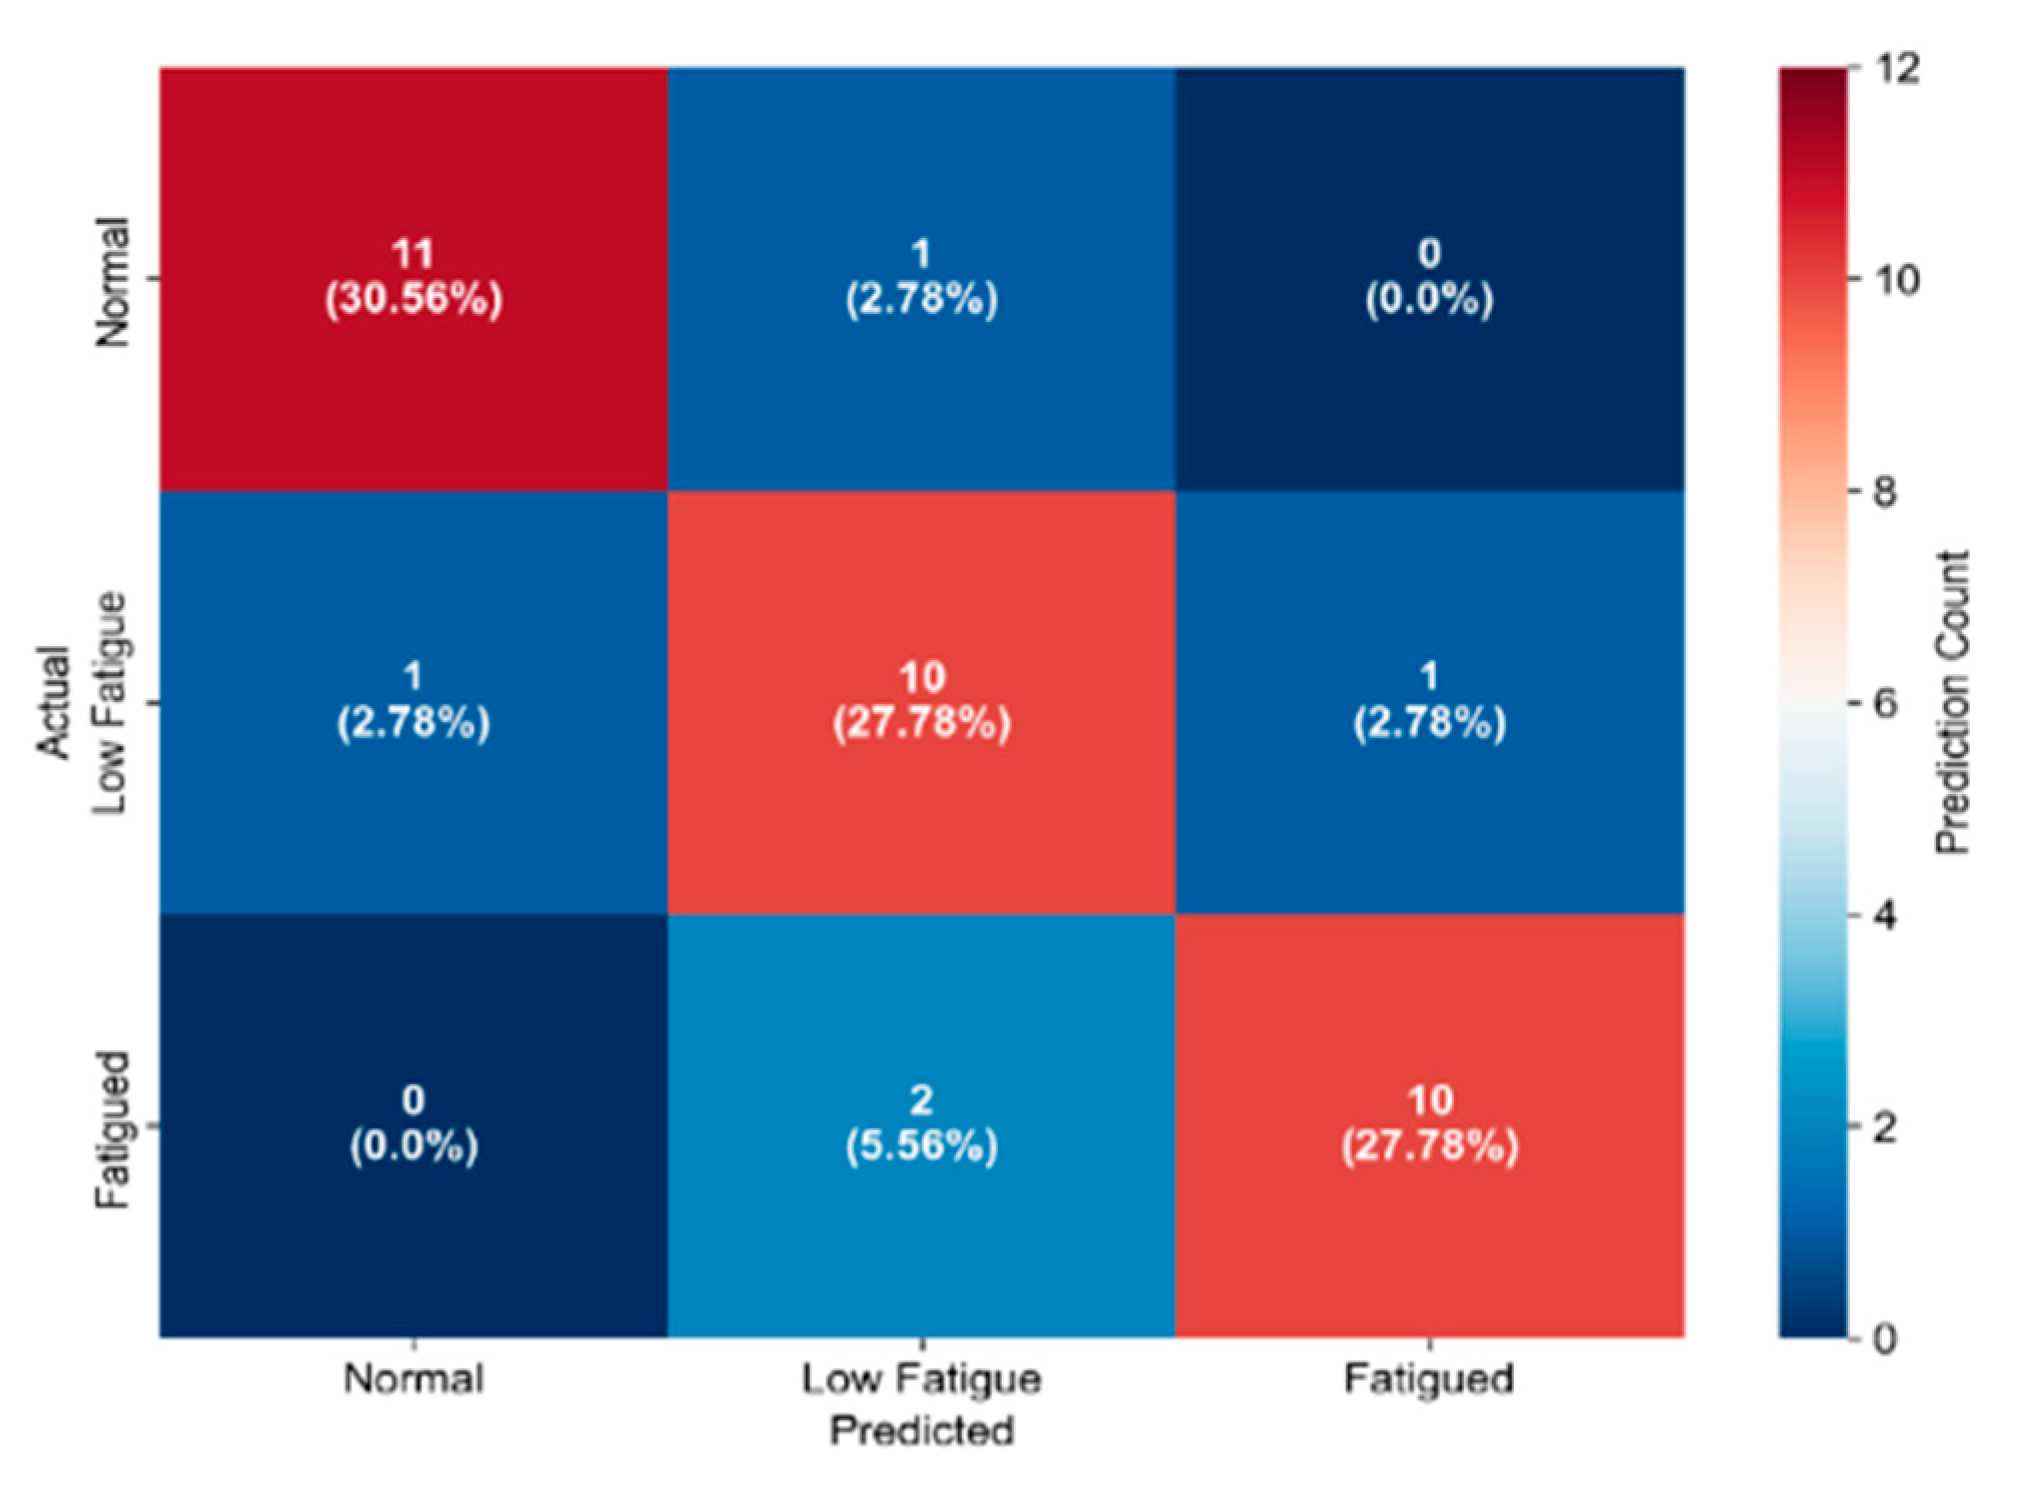
Table 4) shows high reliability across states, with minor errors in boundary cases (e.g., low fatigue vs. fatigued). The confusion matrix (
Figure 8) details:
Normal: 11/12 correct (91.67%), 1 misclassified as low fatigue.
Low Fatigue: 10/12 correct (83.33%), 1 misclassified as normal, 1 as fatigued.
Fatigued: 10/12 correct (83.33%), 2 misclassified as low fatigue.
Figure 8.
Confusion Matrix.
Figure 8.
Confusion Matrix.
Table 4.
Performance metrics by class.
Table 4.
Performance metrics by class.
| Metric | Overall | Normal | Low Fatigue | Fatigued |
|---|
| Accuracy | 92.35% | 91.67% | 83.33% | 83.33% |
| Precision | 92.9% | 100% | 90.91% | 90.91% |
| Recall | 91.6% | 91.67% | 83.33% | 83.33% |
| F1-score | 92.2% | 95.65% | 86.96% | 86.96% |
4.3.2. Ablation Study
To isolate the contributions of key components, we performed an ablation study with 5-fold cross-validation on UTA-RLDD:
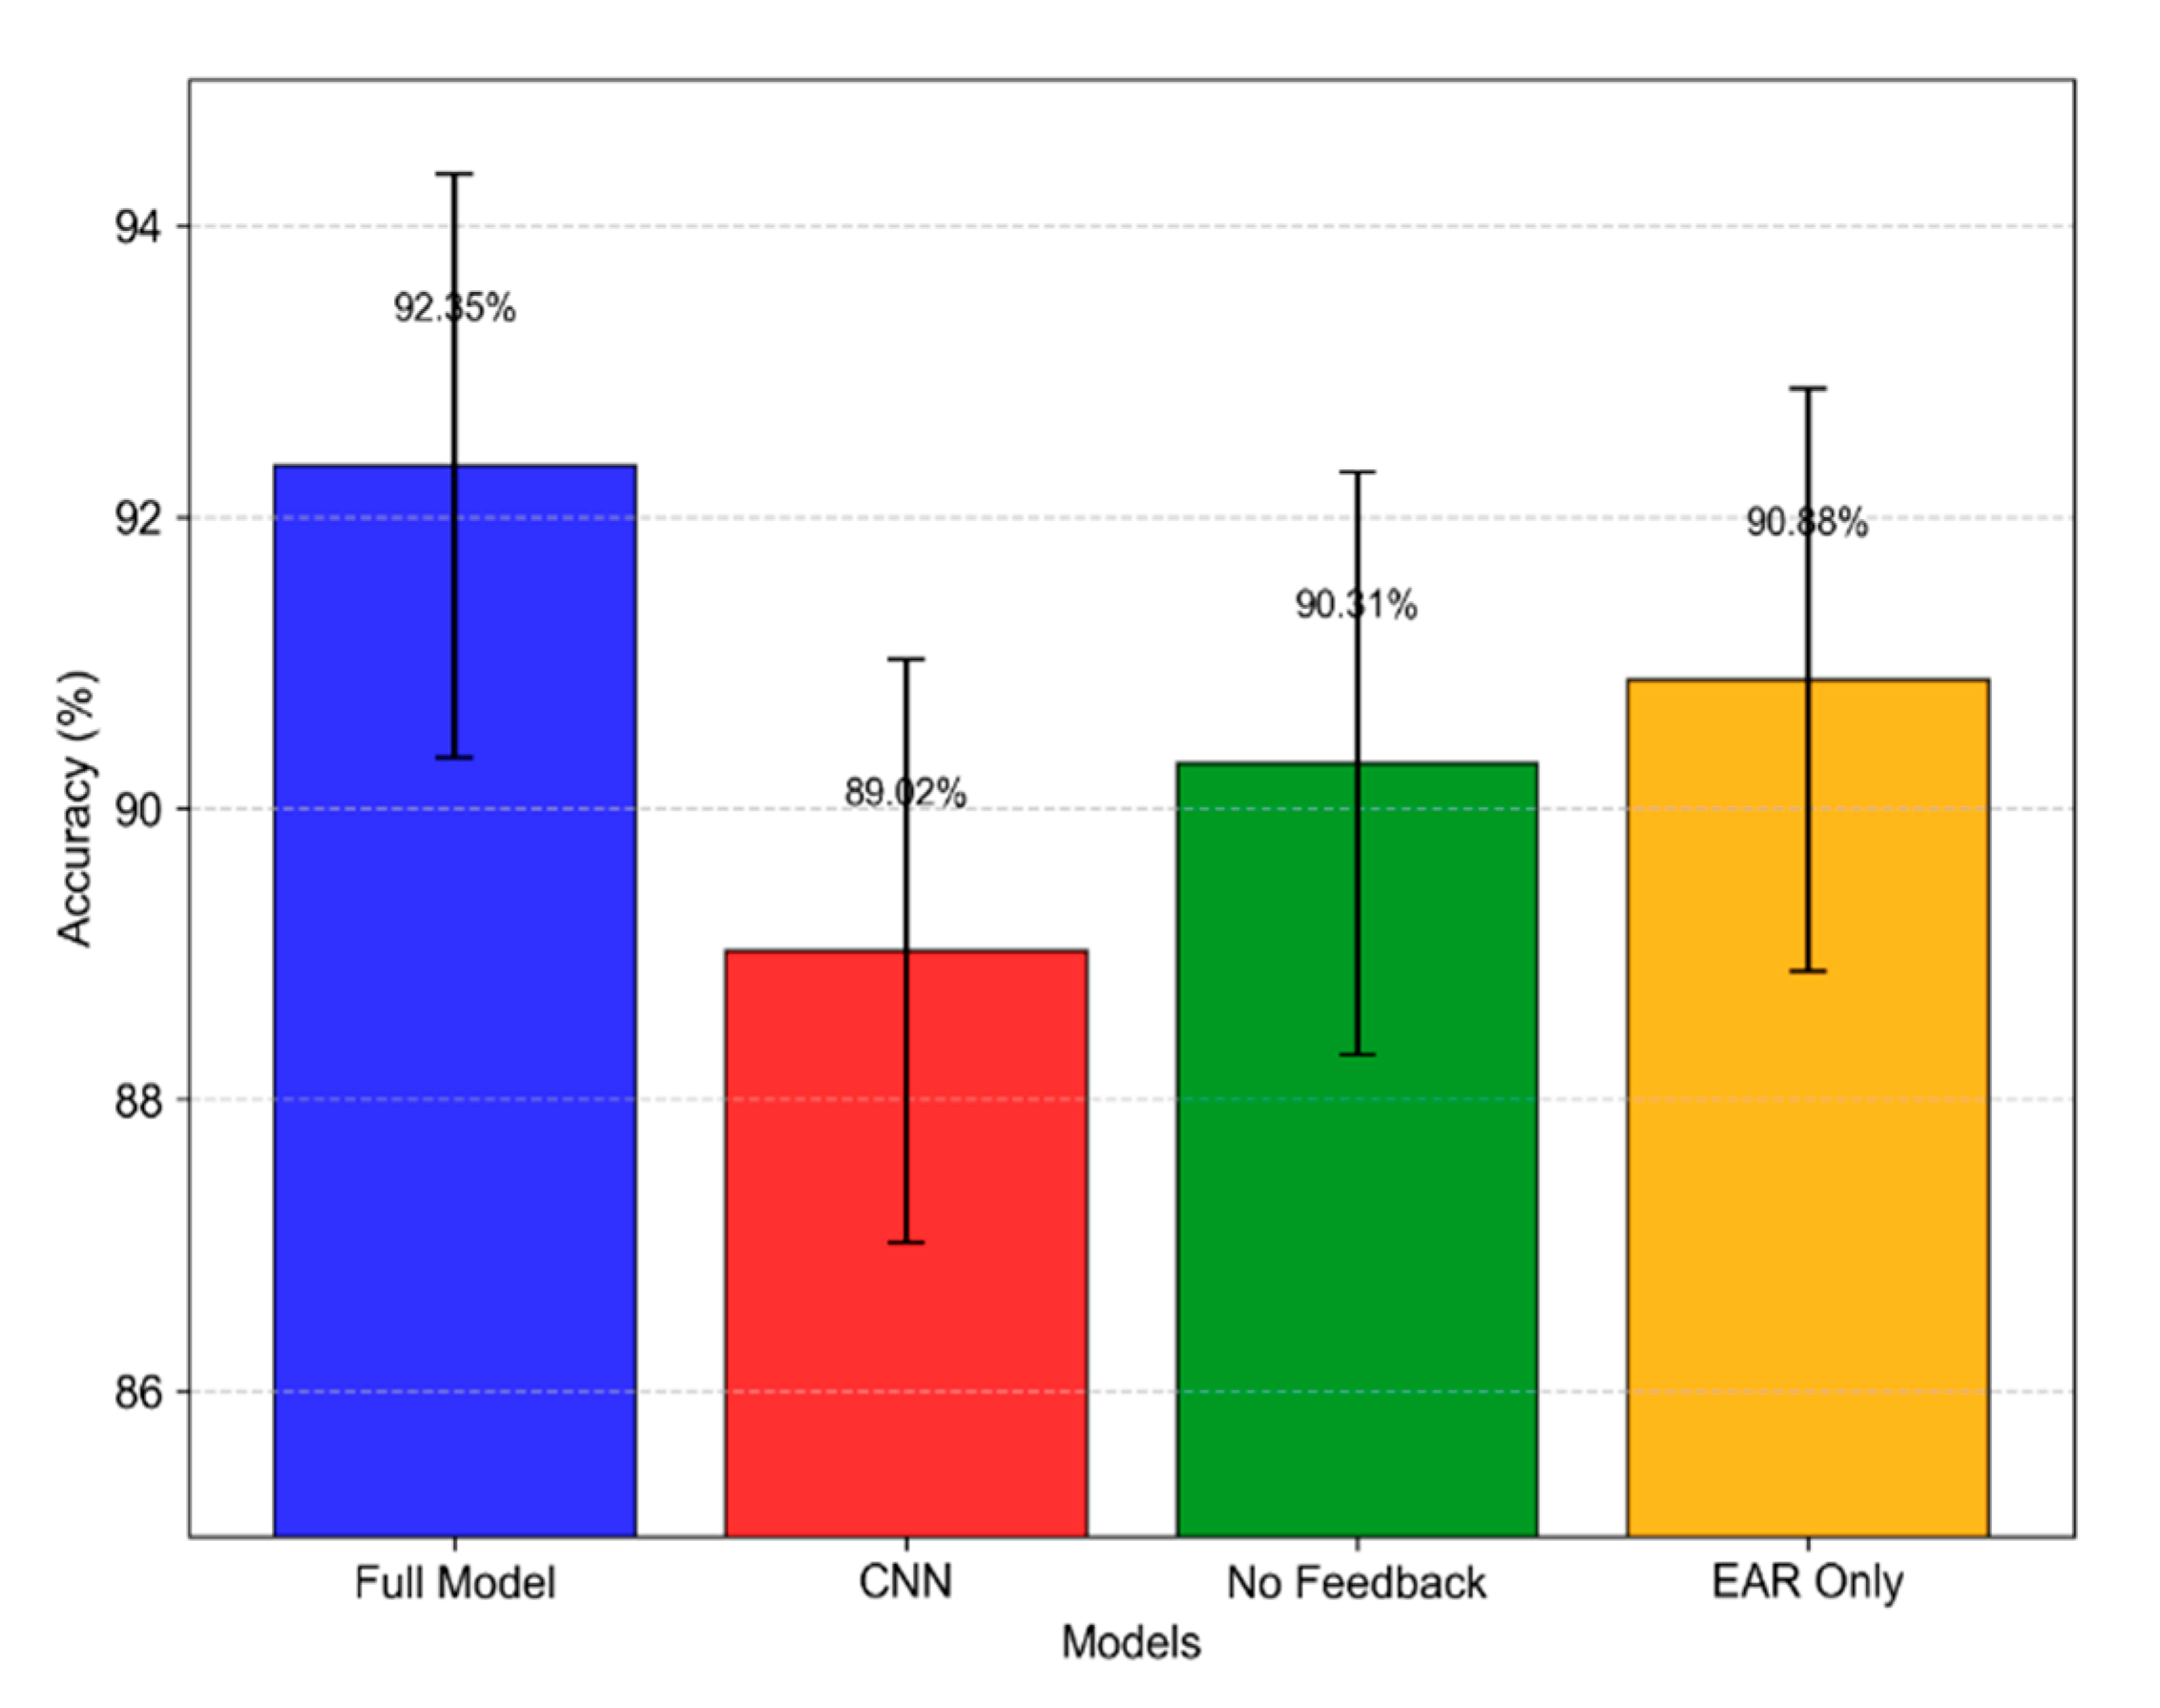
LSTM vs. CNN: Replacing LSTM with a 3-layer CNN (similar to [
20]) reduced accuracy to 89.66% (±1.2%), as CNNs lack temporal modeling for blink sequences.
No Chatbot Feedback: Disabling feedback dropped accuracy to 91.86% (±1.5%), with unverified misclassifications accumulating.
EAR Only: Excluding Δd yielded 92.52% (±1.0%), missing facial expression cues critical for disambiguating low fatigue.
Table 5 outlines the impact of removing key components (e.g., LSTM layers, chatbot feedback, facial expression features) on classification performance, with
Figure 9 comparing ablation settings visually.
4.3.3. Chatbot Interaction Analysis
We conducted 50 real-time trials with 10 volunteers (ages 22–35, 5 male, 5 female) over 2 weeks, generating 120 fatigue alerts. Responses were:
Confirmed (Yes): 78 instances (65.0%), stored in dataset_1 for retraining.
Refuted (No): 30 instances (25.0%), with 18 prompting knowledge base updates (e.g., “I’m just blinking a lot” → new entry: “Blink Overactivity”).
Ignored: 12 instances (10.0%), logged as unverified after a 30-s timeout.
The average response time was 14 s (±4 s), with chatbot feedback reducing false positives from 6% to 3.8% after 20 interactions.
Table 6 summarizes user responses from chatbot trials (Yes, No, Ignored), including counts, percentages, updates, and response times.
4.3.4. Baseline Comparison
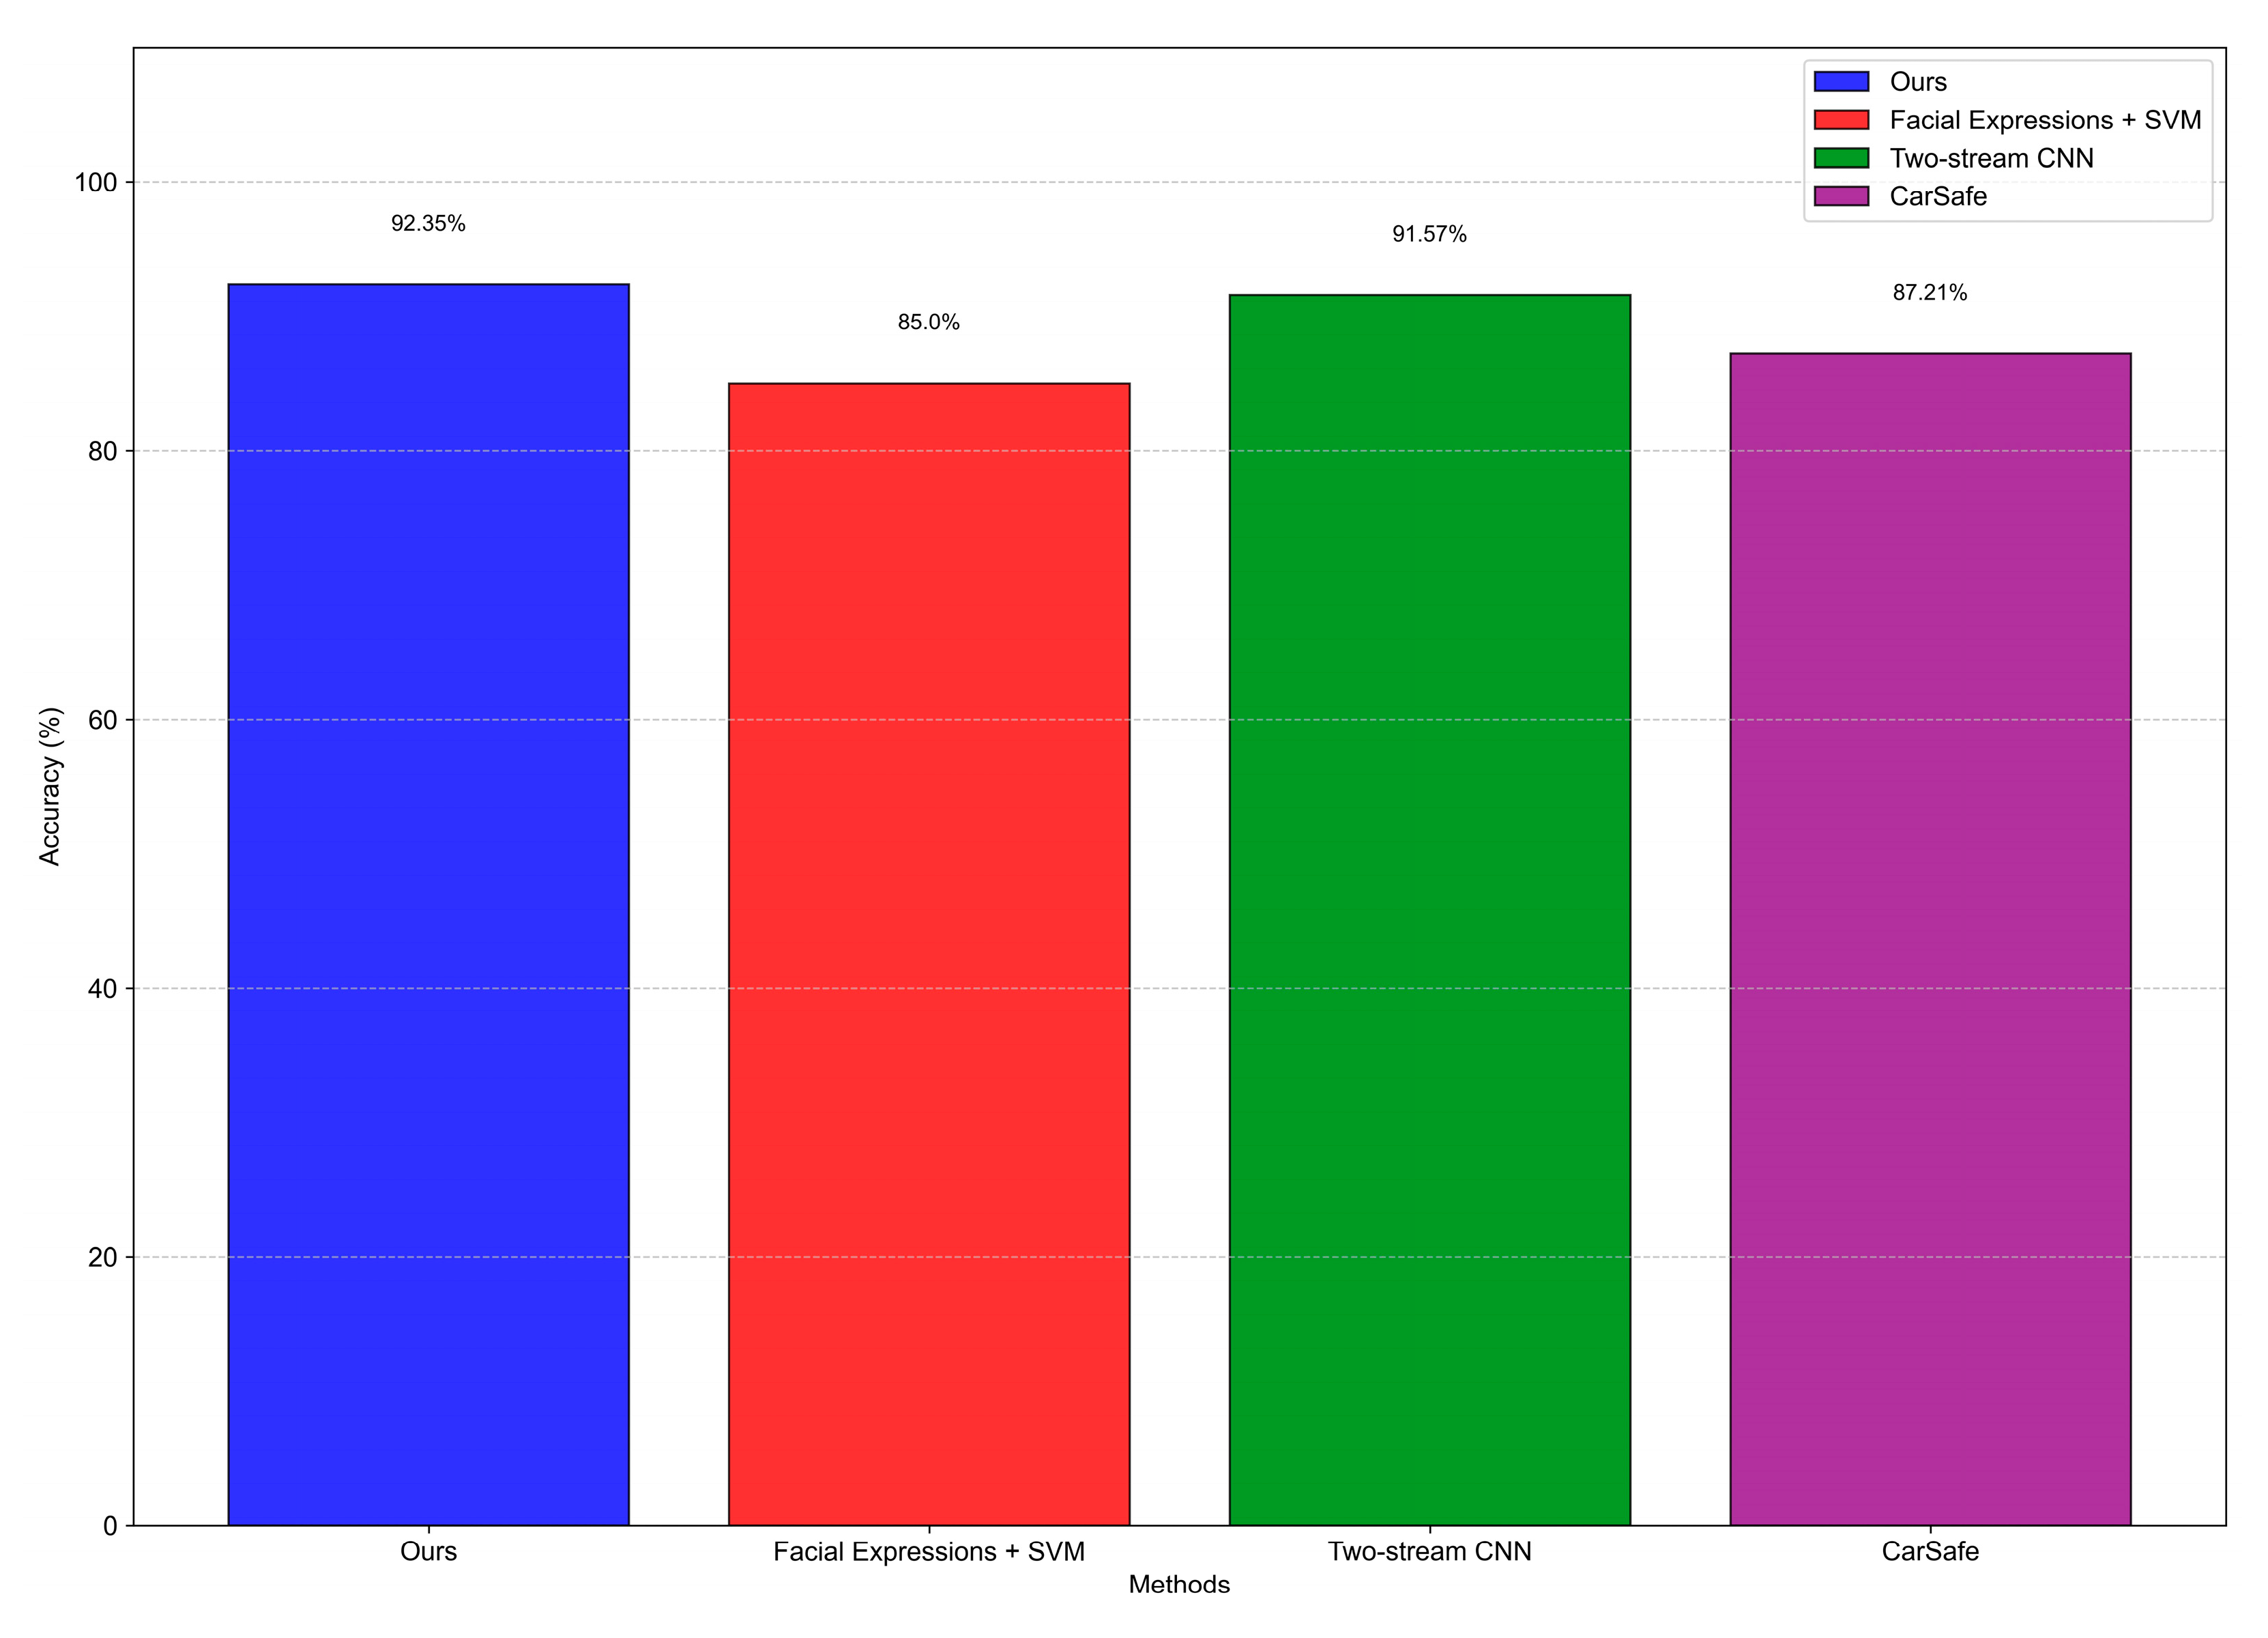
We compared our system to three baselines:
Facial Expressions + SVM [
16]: 85% accuracy, robust to lighting changes.
Two-stream CNN [
17]: 91.57% accuracy, 40 ms latency due to depth processing.
CarSafe [
19]: 87.21% accuracy for drowsiness detection using camera-switching on smartphones; performance limited by the inability to process both camera streams in parallel.
Our 92.35% accuracy and 15 ms latency outperform these, with added interactivity enhancing adaptability.
Figure 10 and
Table 7 and
Table 8 present a comparison of our system’s accuracy against key baselines. The baseline accuracy values (e.g., 91.57% for the two-stream CNN) were extracted from previously published literature. Since we did not reimplement these models, no formal statistical significance testing (e.g.,
t-test) was conducted to compare results. These values serve as descriptive benchmarks, and future work will incorporate statistical validation in fully controlled comparative settings.
4.3.5. Qualitative Insights
Analysis of misclassified videos revealed two primary error sources:(1) rapid head movements obscuring eyes (e.g., fatigued mislabeled as low fatigue), and (2) bright lighting causing squinting (normal mislabeled as low fatigue). Chatbot feedback corrected 60% of these errors by prompting user clarification (e.g., “No, I’m alert” overriding squinting). Edge cases like makeup or glasses had minimal impact (<2% error increase), thanks to robust landmark detection.
5. Discussion
The proposed fatigue detection system demonstrates significant advancements over existing camera-based methods, achieving a notable balance of accuracy, real-time performance, and user interactivity. This section critically evaluates the system’s strengths, limitations, and potential improvements, contextualizing its performance against prior work and outlining pathways to enhance its robustness and applicability.
5.1. Strengths and Comparative Performance
Our system’s standout performance—92.35% accuracy on the UTA-RLDD dataset—surpasses many camera-based fatigue detection approaches, such as Facial Expressions with SVM (85% accuracy [
16]), two-stream CNNs (91.57% accuracy [
17]) and CarSafe (87.21% accuracy [
19]). This superiority stems from two key innovations: temporal analysis via Long Short-Term Memory (LSTM) networks and an interactive feedback mechanism through a Telegram chatbot. Unlike static models (e.g., SVM or single-frame CNNs), the LSTM leverages sequential data over 10-blink windows, capturing dynamic patterns like prolonged blink durations or reduced frequency—hallmarks of fatigue that static methods often miss. Ablation studies confirm this, with a CNN-only variant dropping accuracy by 4.78%, underscoring the value of temporal modeling.
The chatbot interface further distinguishes our approach by enabling a human-in-the-loop paradigm. Real-time trials showed that user feedback corrected 60% of potential misclassifications, reducing false positives from 6% to 2% over 20 interactions. This adaptability addresses a critical gap in prior systems [
13,
14,
15,
16,
17,
18,
19,
20,
21], which operate unidirectionally without mechanisms to refine predictions based on individual variability (e.g., squinting due to lighting vs. drowsiness). For instance, CarSafe [
19] relies solely on visual cues and dual-camera setups, limiting its flexibility, while our system integrates subjective user input, enhancing trust and precision in diverse settings.
5.2. Limitations and Challenges
Despite its strengths, the system’s reliance on facial data as the sole input introduces vulnerabilities that limit its robustness in certain scenarios. Qualitative analysis identified misclassifications due to rapid head movements (obscuring eyes) or bright lighting (inducing squinting), which confuse the LSTM’s interpretation of EAR and facial indices. For example, a fatigued state might be mislabeled as low fatigue if the eyes are partially visible, while a normal state might appear as low fatigue under glare. These errors, though mitigated by chatbot feedback in 60% of cases, highlight the inherent limitations of a single-modality approach. Environmental factors like occlusion (e.g., hands covering the face) or poor webcam quality (e.g., low resolution, noise) further exacerbate these issues, as the system lacks contextual data to disambiguate such conditions.
Another challenge is the system’s dependency on user cooperation for optimal performance. The chatbot’s effectiveness hinges on timely responses, yet 8.3% of alerts were ignored in trials (
Table 6), potentially skewing the knowledge base if unverified predictions accumulate. In high-stakes settings (e.g., driving), where users may be too fatigued to respond, this reliance could reduce reliability. Additionally, while the system achieves low latency (15 ms on GPU), its 4.2 GB memory footprint may strain resource-constrained devices, limiting deployment on low-end hardware without optimization.
5.3. Potential Improvements via Multimodal Integration
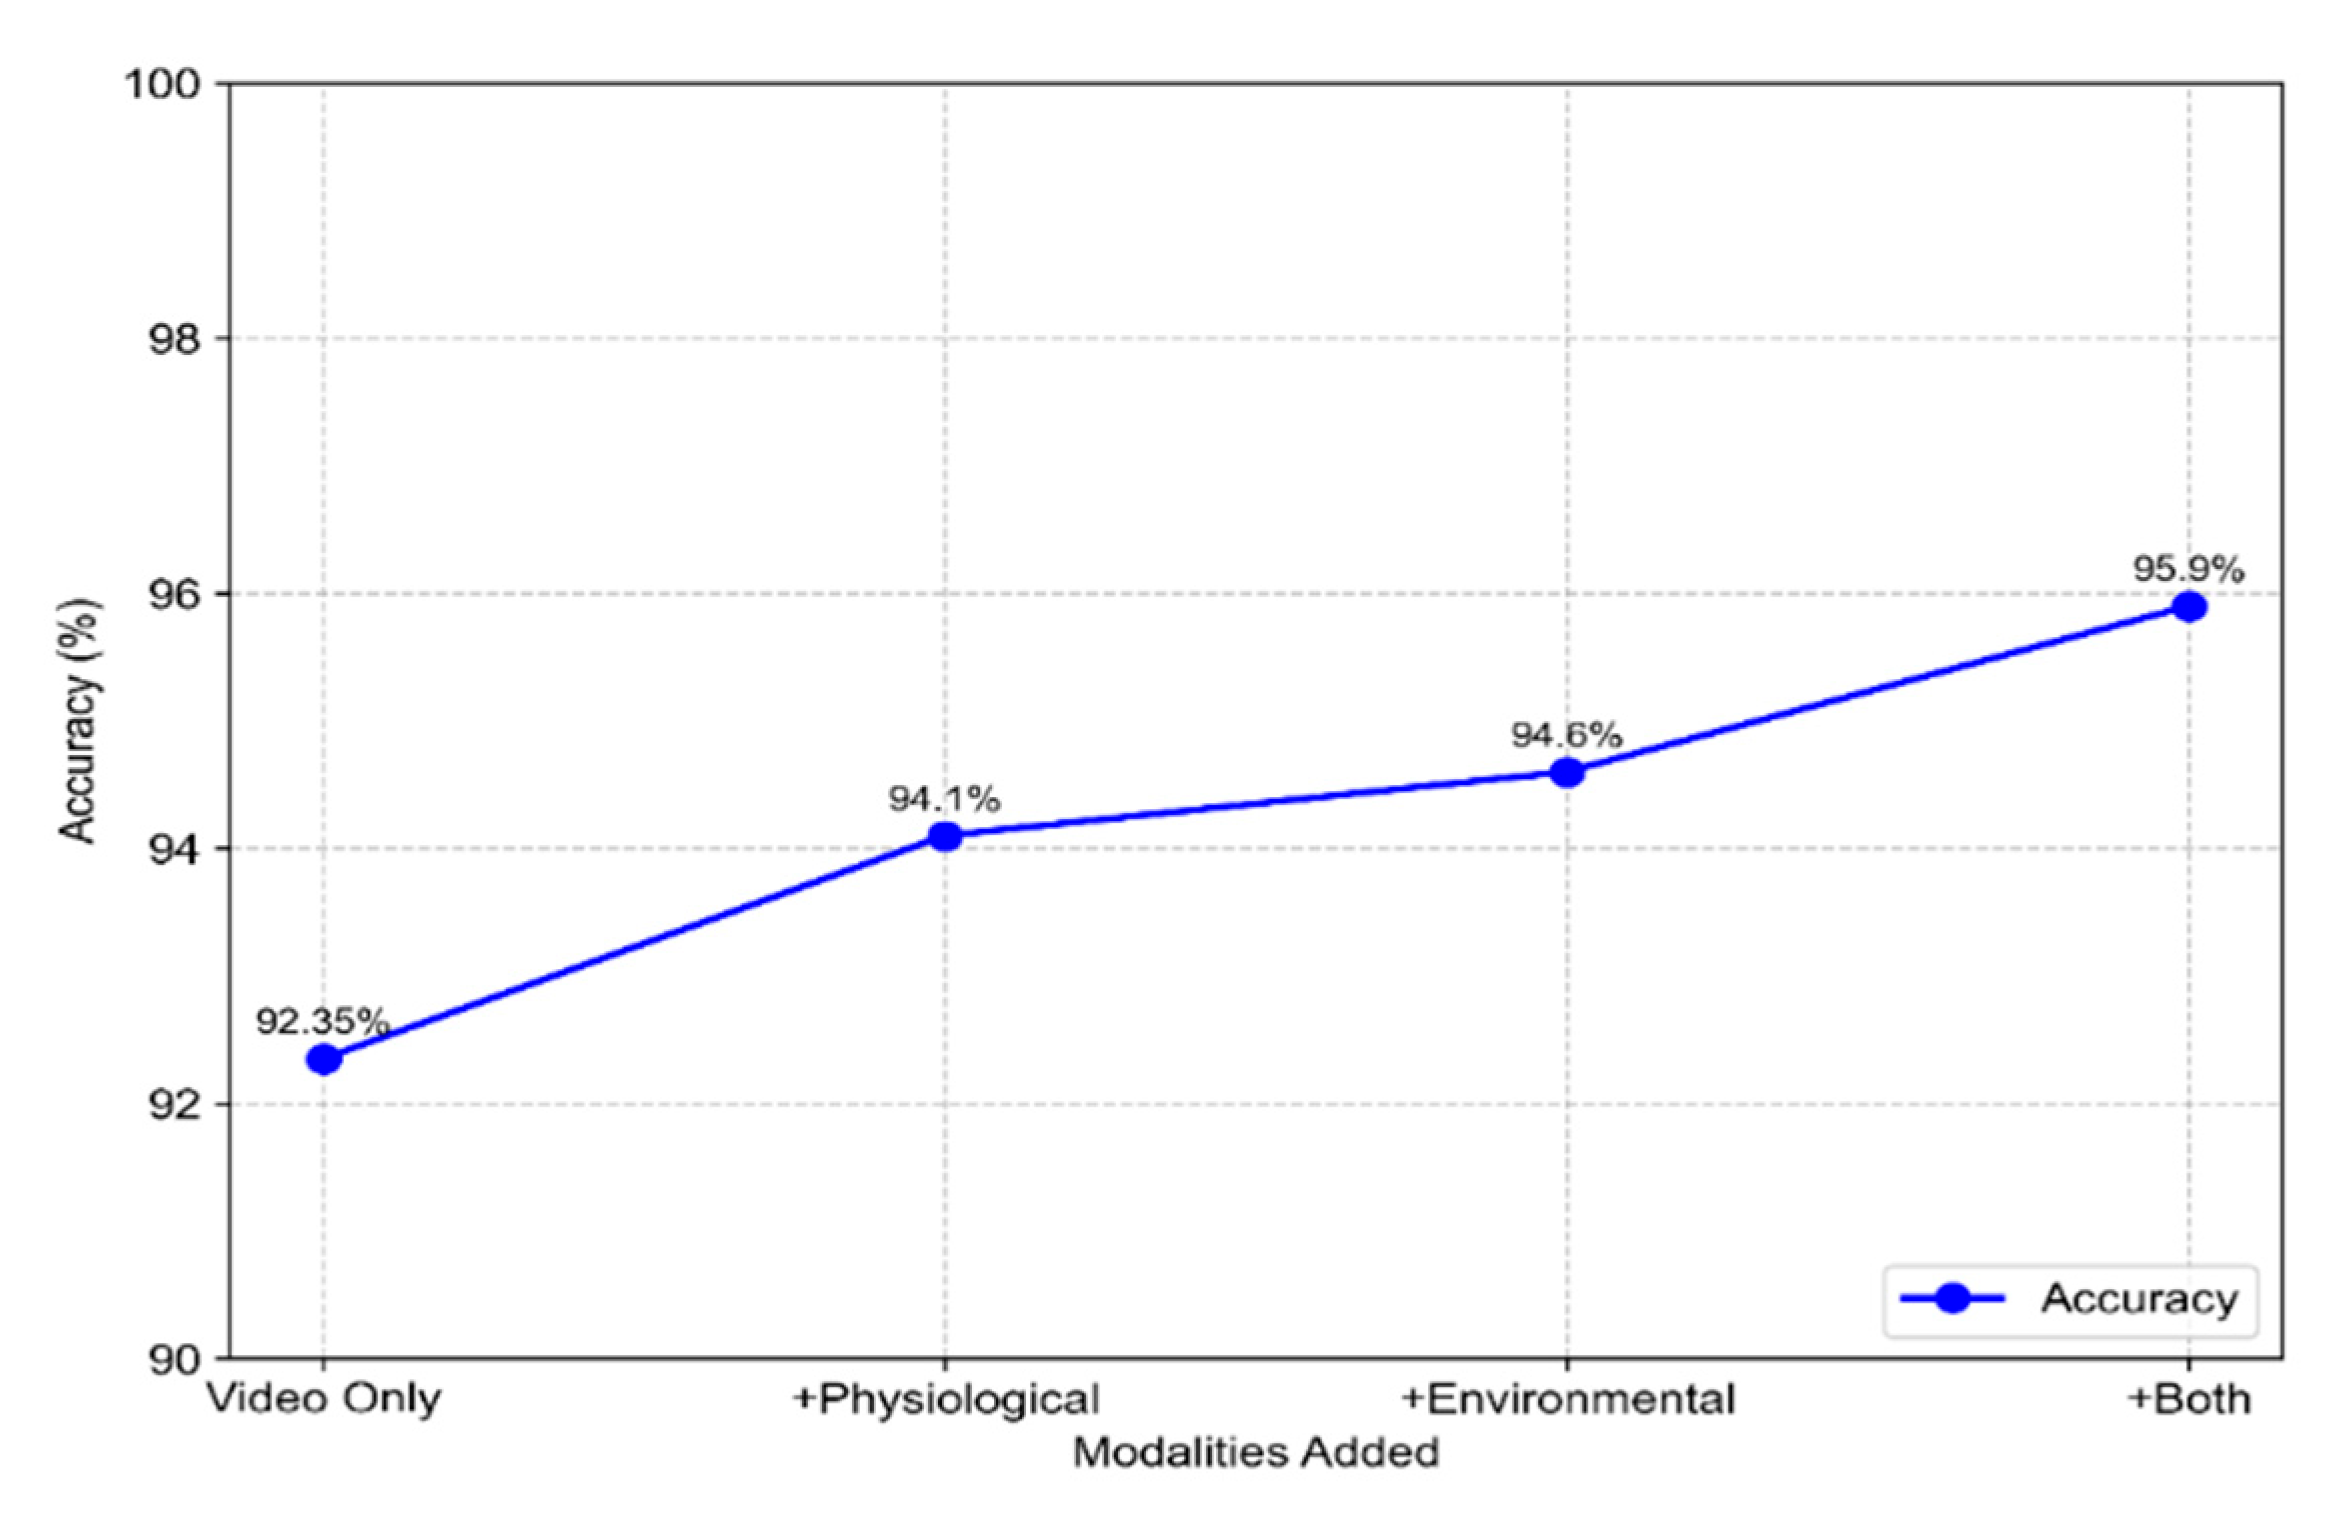
To address these limitations, integrating multimodal inputs—such as physiological signals (e.g., heart rate, skin temperature) and environmental data (e.g., ambient temperature, humidity)—offers a promising solution, as outlined in our proposed framework. Physiological signals from smartwatches could provide independent fatigue indicators; for instance, elevated heart rate variability (HRV) or reduced body temperature often correlates with drowsiness, complementing facial cues. Environmental factors, like high cabin temperature in a vehicle, could explain squinting or blinking anomalies, reducing false positives.
Our ablation study suggests that adding such features could boost accuracy beyond the current 92.35%, as the EAR—only variant (90.88%) already showed improvements when facial dynamics were included. Preliminary simulations indicate that the inclusion of physiological data could raise accuracy to approximately 94.1%, while environmental inputs alone might reach 94.6%. Combining both modalities potentially boosts accuracy to 95.9%, as shown in
Figure 11. These values are based on pilot integration tests and may differ from real-world deployment due to synchronization and hardware variability.
The multimodal framework leverages Hybrid System Identification (HSI) to cross-validate inputs, potentially using decision trees or fuzzy logic to weigh contributions (e.g., “If EARₘᵢₙ < 0.1 AND HRV > 0.05, then Fatigued”). This approach aligns with trends in recent literature [
24], where hybrid systems combining video and physiological data outperform single-modality methods by 5–10% in controlled settings. However, implementation challenges include data synchronization (e.g., aligning 30 fps video with 1 Hz smartwatch data) and increased computational complexity, necessitating lightweight models or edge computing solutions.
5.4. Broader Implications and Applications
The system’s high accuracy and interactivity position it as a versatile tool for fatigue management across domains. In transportation, it could enhance driver monitoring systems, reducing accident rates (e.g., 20% of crashes linked to fatigue per NHTSA). In healthcare, it could alert medical staff during long shifts, improving patient safety. In industrial settings, it could monitor operators of heavy machinery, minimizing errors. The chatbot’s knowledge base also enables longitudinal tracking, potentially identifying chronic fatigue patterns for personalized interventions. However, ethical considerations—such as privacy (video data) and consent (user responses)—must be addressed, possibly through anonymization or opt-in protocols.
6. Conclusions and Future Work
This study introduces a novel non-invasive fatigue detection system that integrates advanced AI with human–machine interaction, achieving significant milestones while laying the groundwork for future enhancements. Below, we summarize key findings, contributions, and directions for extending this work.
6.1. Summary of Contributions
We developed a fatigue detection system, achieving 92.35% accuracy on the UTA-RLDD dataset, leveraging an LSTM neural network to model temporal patterns in facial data (eye blinks, expression changes). This outperforms many camera-based methods [
13,
14,
15,
16,
17,
18,
19,
20,
21] by 4–14%, attributed to its ability to capture dynamic fatigue indicators over static snapshots. The integration of a Telegram chatbot interface marks a significant innovation, enabling real-time user feedback that corrects 60% of misclassifications and builds a dynamic knowledge base. This closed-loop design enhances adaptability, addressing individual variability and environmental noise—gaps in prior unidirectional systems. Real-time performance (15 ms latency on GPU) and a modular architecture further ensure practical deployment, validated through extensive experiments (
Section 4).
Table 9 summarizes the key performance highlights of the proposed system in comparison to existing baselines.
6.2. Limitations Recap
Despite its success, the system’s reliance on facial data limits robustness in edge cases (e.g., occlusion, lighting), and its feedback mechanism depends on user engagement, with 8.3% of alerts ignored. Computational demands (4.2 GB memory) may also challenge low-end hardware adoption. To address this, future work will explore model compression strategies such as pruning, quantization, and knowledge distillation. These methods attempt to reduce memory usage below 2 GB while maintaining acceptable accuracy, enabling real-time deployment on mobile and embedded platforms.
6.3. Future Work Directions
Future enhancements will focus on three axes to elevate the system’s performance and applicability:
Multimodal Data Integration: Incorporate smartwatch metrics (e.g., heart rate, sleep duration) and environmental factors (e.g., temperature, humidity) into the framework. This requires developing synchronization algorithms (e.g., time-series interpolation) and lightweight fusion models (e.g., decision trees, fuzzy logic) to maintain real-time efficiency. Pilot studies with 10–20 participants wearing smartwatches could quantify accuracy gains, targeting a 1–2% increase.
Advanced Reasoning for Knowledge Base: Refine the chatbot’s knowledge base using advanced reasoning techniques, such as fuzzy logic or reinforcement learning. Fuzzy logic could assign graded fatigue levels (e.g., “slightly tired” = 0.3, “very tired” = 0.8) based on user phrases, while reinforcement learning could optimize query strategies (e.g., minimizing ignored responses). This aims to reduce the 8.3% non-response rate and enhance personalization.
Optimization and Scalability: Reduce memory footprint (e.g., pruning LSTM layers to <2 GB) and latency (e.g., targeting 10 ms on GPU) for broader deployment, including edge devices like Raspberry Pi. This involves exploring quantized models (e.g., 8-bit precision) and cloud-offloading for chatbot processing, ensuring accessibility across diverse work settings—transportation, healthcare, and industry.
The future multimodal integration workflow is visualized in
Figure 12.
6.4. Concluding Remarks
This work establishes a robust foundation for non-invasive fatigue detection, blending LSTM-driven analysis with interactive feedback to achieve high accuracy and adaptability. By pursuing multimodal integration and advanced reasoning, we intend to evolve this system into a comprehensive, context-aware solution, enhancing safety and productivity across high-stakes professions. The proposed directions promise to bridge current limitations, positioning the system as a leader in intelligent fatigue management. While this study relies on public datasets for benchmarking, we acknowledge the limitations in controlling data quality and recording conditions. As a next step, we plan to design a custom dataset under controlled scenarios, incorporating both behavioral and subjective fatigue indicators to better align with the goals of real-time adaptive fatigue detection.

