Article

Optimizing HUD-EVS Readability: Effects of Hue, Saturation and Lightness on Information Recognition

School of Software, Minhang Campus, Shanghai Jiao Tong University, 800 Dongchuan Road, Minhang District, Shanghai 200240, China
Multimodal Technol. Interact. 2025, 9(5), 46; https://doi.org/10.3390/mti9050046
Submission received: 24 March 2025 / Revised: 29 April 2025 / Accepted: 8 May 2025 / Published: 14 May 2025

Abstract

:
Enhanced Vision System (EVS) offers a display advantage that conventional devices lack, enabling interface information to be overlaid on real-world imagery. However, information overload, especially in complex environments, can reduce the recognizability of important information and impair decision-making. This study investigates a dual color-coding strategy to optimize the recognizability of Primary Information (PI) and Secondary Information (SI) in Head-Up Display–Enhanced Vision System (HUD-EVS) against complex backgrounds. The results show that adjusting the hue, saturation, and lightness of SI affects the recognizability of both PI and SI. Specifically, certain saturation (20% or 80%) and lightness (60%) combinations should be avoided to ensure PI prominence and maintain sufficient recognizability for SI. These findings provide insights for designing color-coding strategies for EVS, enhancing the recognizability of information on mobile devices.

1. Introduction

Enhanced Vision System (EVS) is a typical Augmented Reality (AR) technology based on Video See-Through (VST). By integrating computer vision, graphic imaging, and optical techniques, EVS overlays digitally enhanced information onto the real-world view [1,2,3]. Currently, EVS finds broader applications in aviation, where it has replaced conventional head-up displays (HUDs) and undergone testing on multiple supersonic aircraft [4,5]. Beyond aviation, EVS demonstrates its advantages in enhanced information perception and real-time visualization across domains such as AR-based drone operation, vehicle panoramic imaging, remote surgery, and remote equipment maintenance. Compared to traditional devices, it excels in overlaying augmented information onto real-world scenes, thereby increasing cognitive efficiency. This capability not only meets the demands for efficient information interaction in complex scenarios but also highlights EVS’s potential to become a core function of mainstream mobile devices in the future.
However, with the rapid development of EVS in aviation, the challenge of information overload has become increasingly apparent: monochromatic, high-density visual elements frequently exceed the limits of human recognition, while large volumes of equally prioritized information distract attention and undermine operators’ ability to rapidly identify and process high-priority data, thereby negatively impacting decision-making efficiency. Moreover, the dense presence of lower-priority elements further disperses operators’ attention and diminishes overall recognizability. This issue will also need to be addressed in future EVS and other AR mobile devices. To address this problem, color-coding has been proven as an effective hierarchical strategy that leverages carefully chosen colors to strengthen bottom-up attention, making high-priority information more salient [6,7,8,9,10]. However, existing research on HUD color-coding has largely focused on alert information rather than on basic information. Most findings note that adding magenta [11] or red/yellow [12] to the green base color can effectively increase the priority of alerts. It is worth emphasizing that basic information itself is not homogeneous; it can be further divided into high-priority Primary Information (PI) and lower-priority Secondary Information (SI). For instance, current flight altitude is substantially more important than altitude scale markings. Although HUD-EVS expands possibilities for color design, the existing overload of high-density, monochromatic basic information continues to hinder operators’ attention allocation: low-priority SI distracts from the prompt and accurate recognition of high-priority PI. Consequently, further empirical research is needed to explore how to optimize color-coding for basic information, minimizing SI interference and ensuring the prominence of PI.
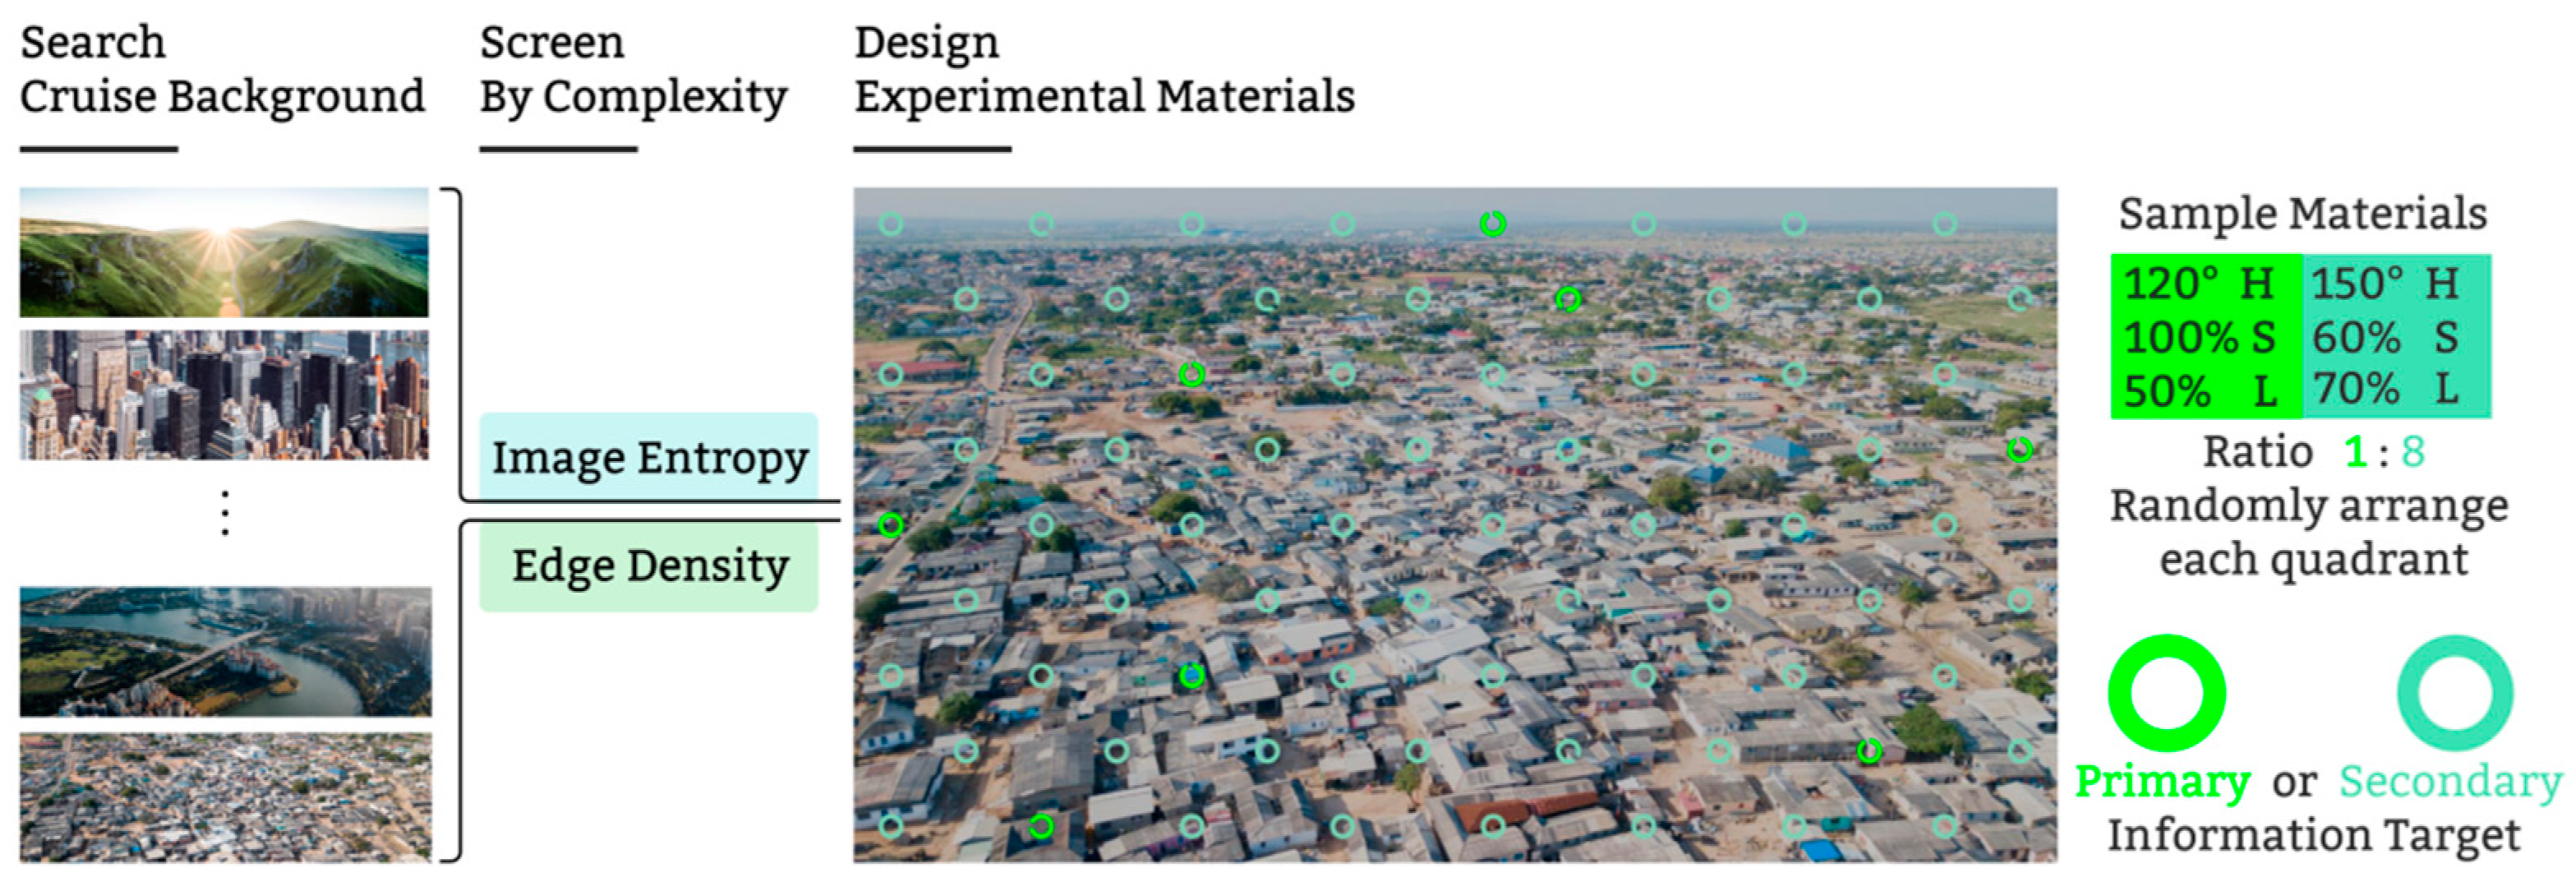
On the other hand, reducing the visual priority of SI does not mean sacrificing its recognizability. When designing the color-coding of basic information, it is also necessary to ensure that SI retains sufficient recognizability against complex backgrounds. As with AR technology, the complexity of the background layer influences visual elements [13,14], particularly in complex cruising environments characterized by numerous adjacent buildings, diverse terrains, narrow roads, and irregular vegetation arrangements. These conditions increase the operator’s sense of visual confusion. Previous studies [15,16] have demonstrated that as background complexity rises, the readability and cognitive efficiency of foreground information, including both PI and SI, decrease. Therefore, in designing the color-coding methods for basic information, it is essential not only to ensure the prominence of PI but also to maintain sufficient recognizability for SI against complex backgrounds.
Adjusting the hue of visual elements is a common approach to altering their recognizability. It is recommended that conventional information symbols in enhanced display systems use green within the wavelength range of 500 to 560 nm [17]. Current aviation HUD-EVS employ green at approximately 555 nm. According to the human eye’s luminous efficiency function, light at 555 nm represents the peak of perceived brightness [18], reflecting the eye’s subjective response to light intensity. Hues corresponding to wavelengths above or below 555 nm exhibit gradually decreasing perceived brightness. This brightness advantage, based on hue, makes it more likely to capture the user’s visual attention, thus gaining a competitive edge in attention allocation [7]. However, whether an effective dual color-coding hierarchy can be achieved within the 500 to 560 nm range requires further experimental investigation.
Saturation and lightness are two key factors influencing the recognizability of visual elements, and both values are based on the HSL (hue, saturation, lightness) color model. Colors with lower saturation appear closer to gray and tend to have lower recognizability. In contrast, higher saturation and lightness enhance the perceived depth and attract more attention [19]. Conversely, lower saturation and lightness lead to lower levels of recognizability [20]. However, this general trend does not provide clear guidance for balancing the use of dual color-coding for basic information, and further experimental investigation under more specific conditions is required.
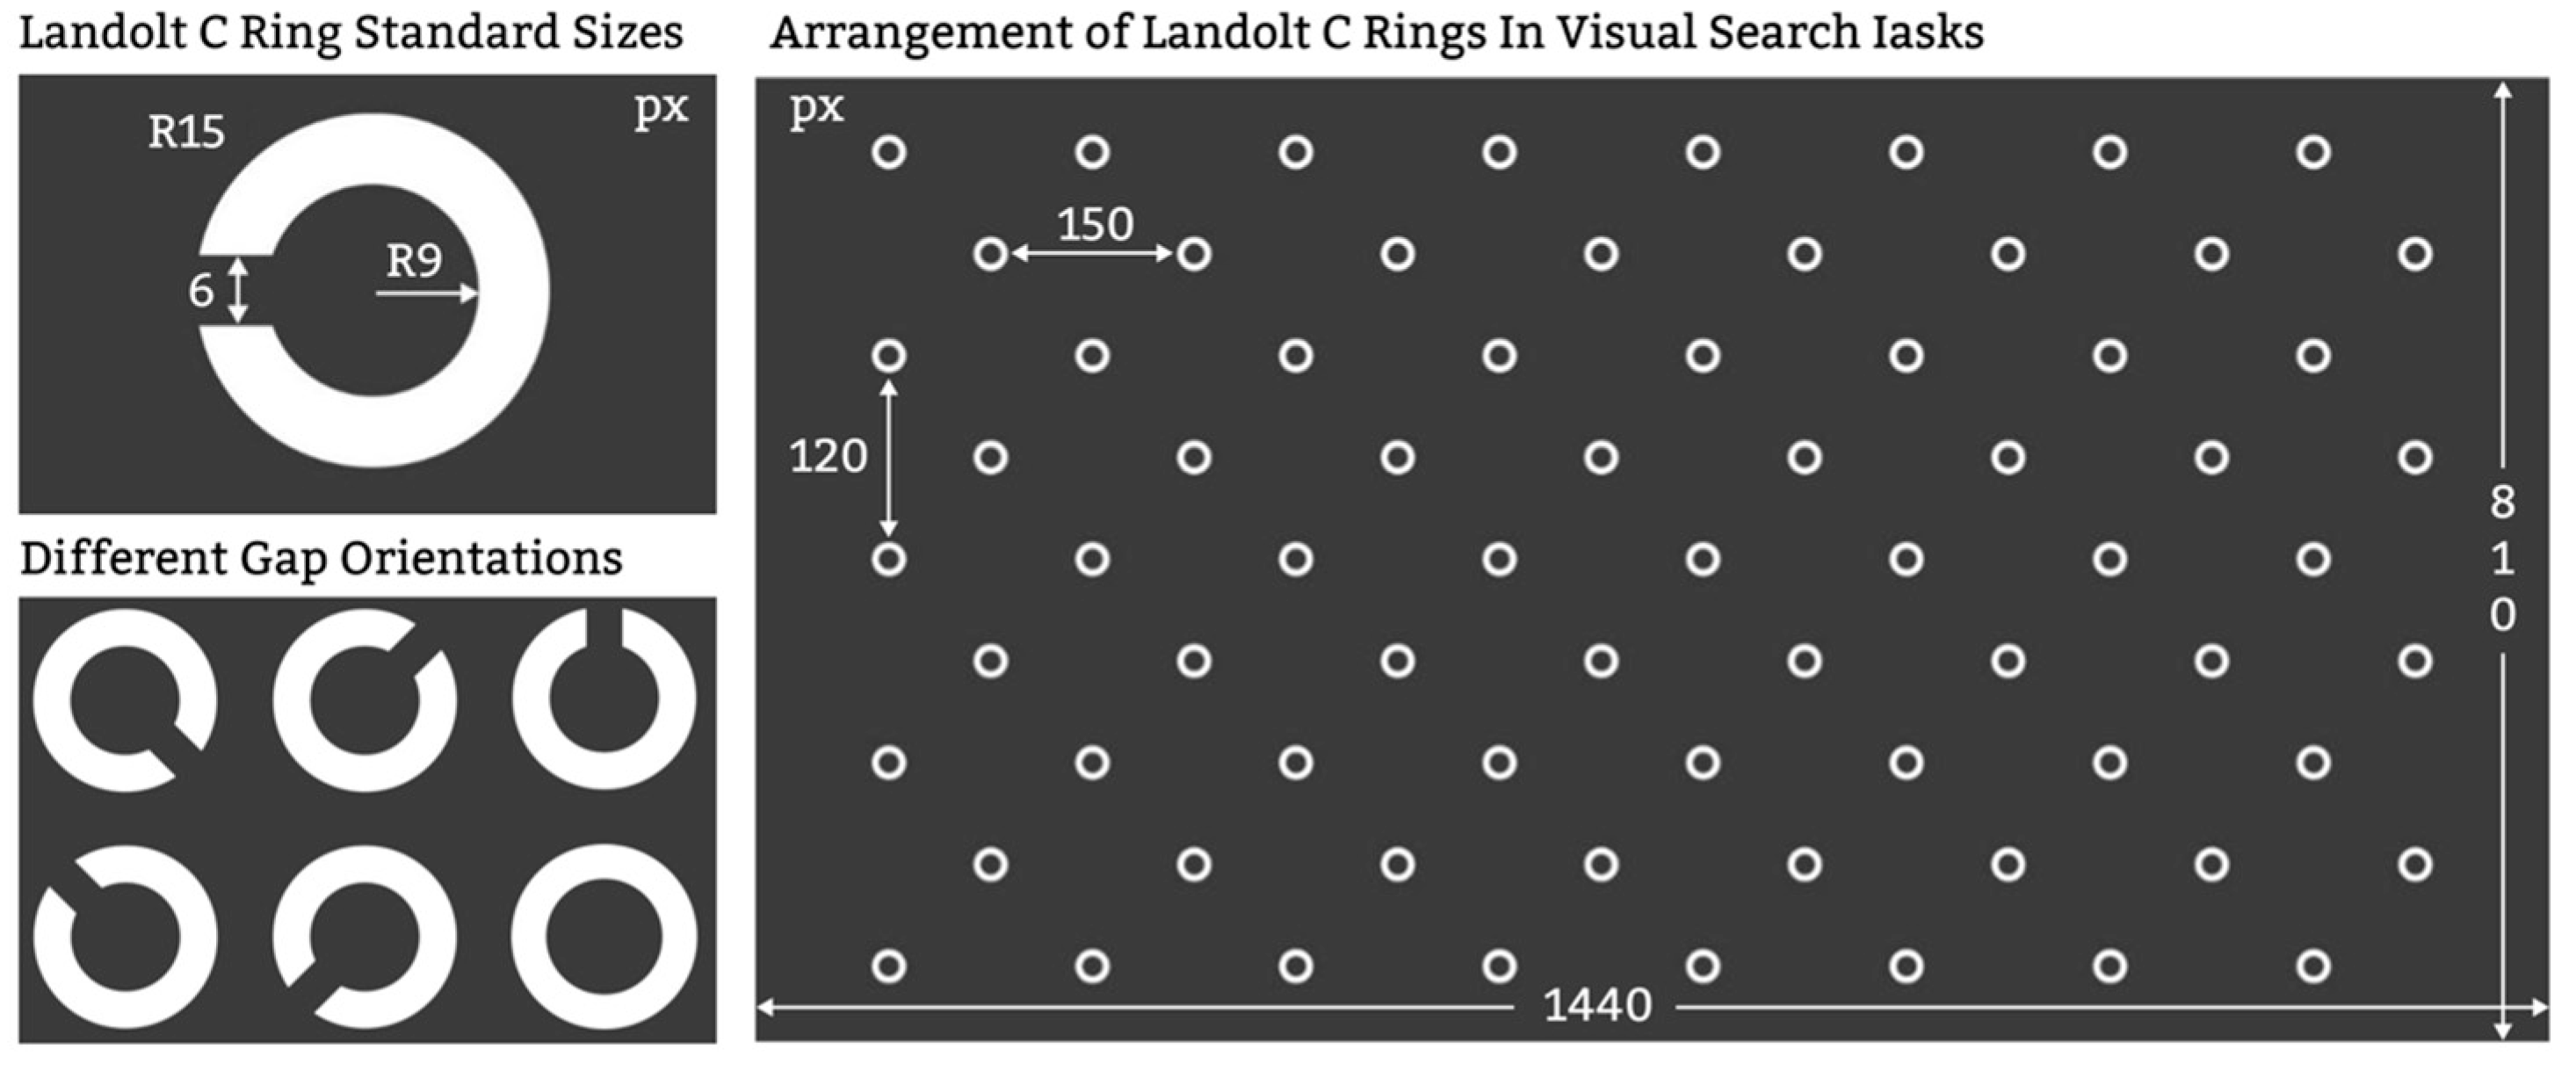
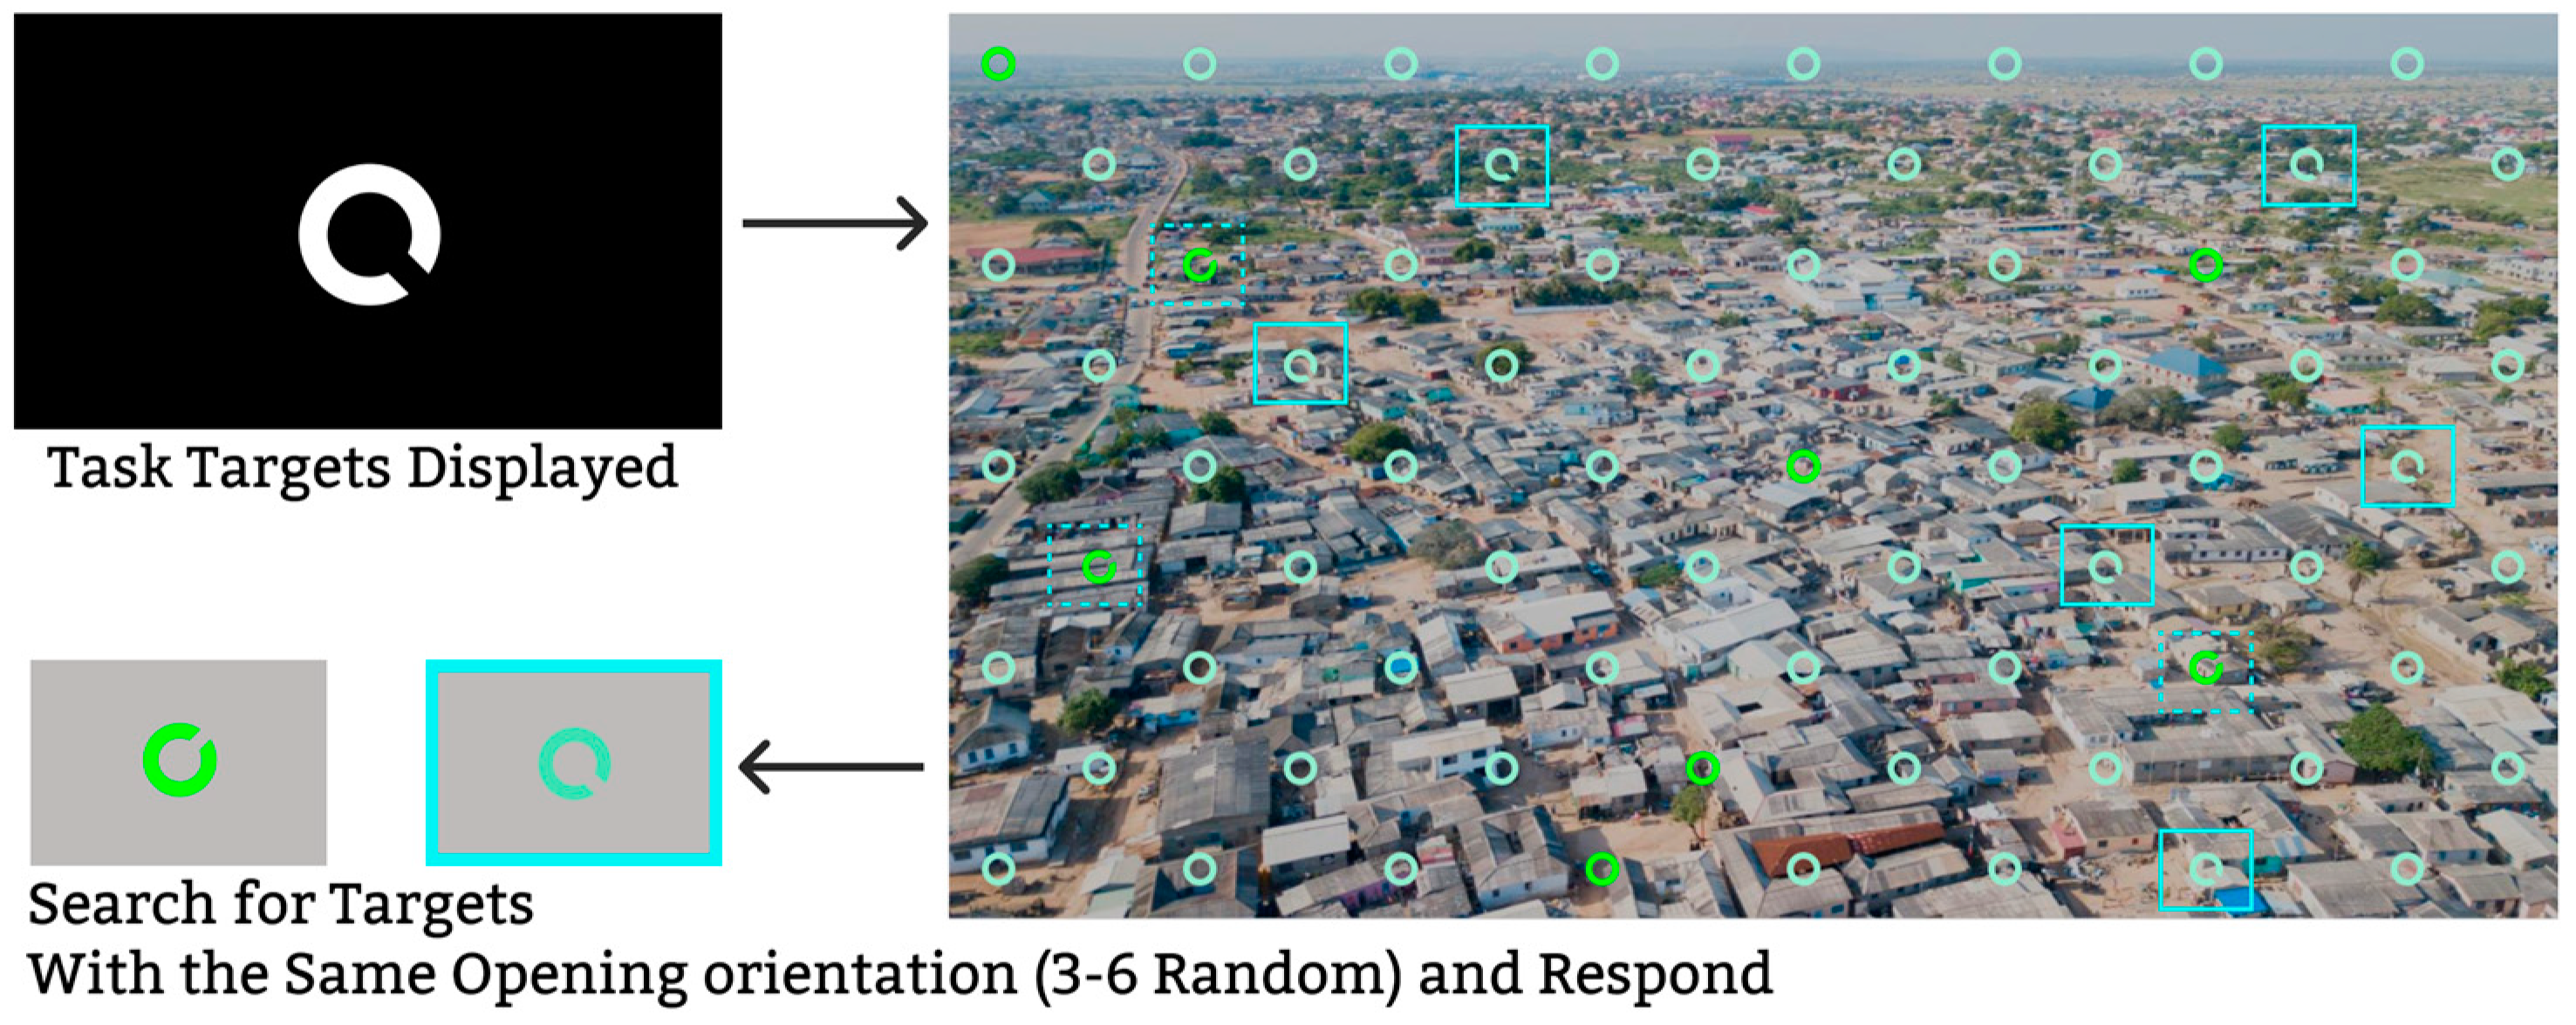
In previous studies, the Landolt C paradigm has been widely recognized as an experimental framework for investigating how color-coding affects the recognizability of visual elements [21,22]. Within this paradigm, participants are required to locate a Landolt C target with a specific gap orientation among a series of visual fields. The core task involves feature discrimination and target selection, closely resembling actual target recognition and search processes. Thus, the Landolt C paradigm serves as a feasible surrogate for examining factors that influence visual search performance. By measuring accuracy and reaction time in the Landolt C paradigm, researchers can evaluate the recognizability of visual elements, providing a controlled approach for color-coding design research.
For HUD-EVS, the complex nature of the background and the prevalence of information overload underscore the need to optimize color-coding strategies to ensure the prominence of Primary Information (PI) while maintaining adequate recognizability of Secondary Information (SI). Therefore, the purpose of this study is to investigate a dual color-coding strategy for HUD-EVS basic information against complex backgrounds, aiming to address the challenge of balancing PI’s recognizability advantage with sufficient SI recognizability.
The specific objectives of this study were to: (1) examine the effects of SI hue, saturation, and lightness on the recognizability advantage of PI’s visual elements when PI’s color is predetermined; (2) explore how the hue, saturation, and lightness of SI affect the recognizability of its visual elements against complex ground-based backgrounds.
This study provides a systematic exploration of dual color-coding design for HUD-EVS basic information. The findings offer practical guidance for improving HUD-EVS interface color design in increasingly complex operational contexts. Furthermore, the results may serve as a reference for developing future dual color-coding standards, thus supporting the robustness of EVS applications across diverse scenarios and mobile platforms.

2. Materials and Methods

2.1. Participants

A total of 20 participants, comprising undergraduate, graduate, and doctoral students, were recruited for this experiment. Among them, 14 were male and 6 were female, with ages having a mean of 23 ± 1.84 years. All participants were knowledgeable about or had received training in interpreting avionics interface displays, and prior to the experiment, their normal or corrected-to-normal visual acuity (exceeding 1.0) was confirmed. None of the participants had color blindness or color vision deficiencies. They were recruited via email and volunteered to take part in the study. Before the experiment, all participants provided informed consent and were fully briefed on the purpose and procedures of the study. As an incentive, participants received compensation upon completing the experiment.

2.2. Experimental Apparatus

The experimental environment was uniformly illuminated with daylight at an illuminance level of 500 lx, effectively minimizing interference from external light sources. An overview of the experimental setup is shown in Figure 1. The apparatus included a 27-inch 4K-resolution display with a 60 Hz refresh rate and an sRGB color gamut coverage of 111%. Participants were seated approximately 55 cm away from the monitor, with their line of sight forming a 60° angle to the display plane, providing optimal viewing comfort and angle. Prior to the experiment, the monitor was hardware-calibrated using a Datacolor Spyder X colorimeter. The calibration parameters were set to sRGB Gamma 2.2, white point D65 (6500 K), and a luminance level of 120 cd/m2, ensuring accurate and consistent color rendering. Background noise in the laboratory was strictly maintained below 40 dB to minimize auditory distractions, while relative humidity was controlled between 40% and 60%, and temperature was maintained at 22 ± 4 °C to ensure participant comfort and environmental stability. During the experiment, the laboratory remained quiet, with strict background noise control to avoid affecting participant attention. The experimental tasks were presented via computer software, and all operations and data recordings were conducted under controlled conditions.

2.3. Experimental Materials

In accordance with ISO DIS 9241-210 [17], and taking into account the dimensions of symbols such as flight path markers and beacons [23], a circular target stimulus with an outer diameter of 10 mrad was selected. The actual size of the target stimulus on the screen was approximately a 6 mm diameter ring. The search area on the screen measured 1440 × 810 pixels (px). Both the target and distractor rings had an outer diameter of 30 px × 30 px, an inner diameter of 18 px, and a notch width of 6 px. There were five possible orientations for the Landolt C rings. As illustrated in Figure 2, a total of 8 × 9 = 72 rings were arranged, with a horizontal spacing of 150 px and a vertical spacing of 60 px.
Similar to other AR or EVS mobile interface visualization studies [24,25,26], the complex background in this research refers to the high-texture, color-varying ground environment encountered by aviation EVS systems. A background with high texture density and extensive color variation is more likely to cause the foreground interface to become lost within the user’s field of view, thus affecting its recognizability. Currently, commonly used methods for assessing image complexity include metrics such as image entropy, compression ratio, edge density, colorfulness, and feature congestion [27]. To simulate the impact of complex ground-based cruising environments on the visual search efficiency of HUD-EVS in aviation scenarios, this study collected a large number of aerial images from publicly available high-resolution image databases. Using Python’s SciPy and OpenCV libraries, these images were evaluated and filtered based on their image entropy and edge density. Ultimately, a village aerial view image with both high image entropy and high edge density was selected as a representative complex background, onto which randomly generated Landolt C ring stimuli were superimposed.
The Landolt C targets used in this experiment comprised two types—one in the PI color and the other in the SI color—at a ratio of 1:8, with PI targets evenly and randomly distributed across each quadrant. Within the same background image, both PI Targets and SI Targets were present, each with a random quantity ranging from 3 to 6 targets. As illustrated in Figure 3, the background selection process and an example of the experimental stimuli are shown.

2.4. Experimental Variables and Design

2.4.1. Independent Variables

The HSL color model is a widely used method for representing colors, defined along three dimensions: hue, saturation, and lightness. In this study, the HSL model was employed under strictly controlled experimental conditions, based on the standard sRGB color space. Stimulus intensity levels were determined using the method of constant stimuli from psychophysics.
Referring to the recommended visible wavelength range of 500–560 nm in HUD-EVS color design, this study selected three hue values at 30° intervals within the green-to-cyan range. The hue of PI was set at 120°, while 150° and 180° were chosen as SI hue variables. Additionally, the saturation and lightness of PI were set at 100% and 50%, respectively, to enhance visual recognizability [28].
The hue, saturation, and lightness values of SI were treated as independent variables in this study. A 2 × 4 × 4 experimental design was employed (as illustrated in Figure 4). For saturation, four levels—80%, 60%, 40% and 20%—were selected relative to PI’s 100% saturation. For lightness, four levels—60%, 70%, 80% and 90%—were chosen.

2.4.2. Experimental Procedure and Dependent Variables

Before the experiment began, the experimenter explained in detail the upcoming tasks and procedures to ensure that participants fully understood the instructions. Before starting the formal experiment, participants provided their personal information (gender and age) and read the experimental instructions. After confirming their understanding, they pressed the space key to begin the practice session. The practice session used the same materials as the formal experiment to familiarize participants with the task requirements and procedures. If there were any questions, participants could consult the experimenter during this phase. After completing the practice, the formal experiment began, as illustrated in Figure 5.
In the formal experiment, there were two different visual search tasks. Each task consisted of 32 trials with different color combinations, totaling 64 trials, which were randomly assigned to two experimental blocks. The two blocks were presented in a complementary order to control for sequence effects.
At the beginning of each trial, a fixation cross (“+”) appeared at the center of the screen for 1000 milliseconds, followed by a colorless Landolt C target with a randomly selected gap orientation (from five possibilities), serving as a cue. After confirming the cue, participants pressed the space key to enter the search display. The detailed procedure of a single trial is illustrated in Figure 6.
The search display consisted of a fixed layout of circular items rendered in two colors representing Primary Information (PI) and Secondary Information (SI), with a ratio of 1:8. Most items were solid rings without gaps. In each trial, both PI and SI sets contained one specific type of Landolt C target, each with a distinct gap orientation. For each color set, 3 to 6 such targets were randomly placed, while all remaining items remained solid rings. PI targets were evenly distributed across all quadrants.
The gap orientation of the cue matched the orientation of either the PI or SI target type, thereby implicitly determining the task type for that trial (PI or SI). However, this information was not disclosed to participants. They were instructed to search across all targets, regardless of color, and report the total number of items matching the cue’s gap orientation by pressing a corresponding key (3, 4, 5, or 6) within 15 s. If no response was made within the time limit, the trial ended automatically, and participants were prompted to refocus and press the space key to proceed to the next trial.

2.5. Statistical Analysis

To evaluate the effects of the three independent variables—SI hue, saturation, and lightness—on the four dependent variables (accuracy and reaction time for both PI and SI), a descriptive analysis of the performance indicators was first conducted. Due to non-normal distributions and issues with kurtosis, the aligned rank transformation (ART) was applied. This allowed for a nonparametric equivalent of analysis of variance (ANOVA), followed by pairwise multiple comparisons with Bonferroni corrections. Statistical significance was set at p ≤ 0.05. All statistical analyses and tests were performed in R (version 4.2.1) within the RStudio environment (2022.12.0 Build 353) [29].

3. Results

The following section presents the effects of SI hue, saturation, and lightness on four dependent variables (accuracy and reaction time in both the PI Search Task and the SI Search Task), as well as the interactions among these three factors.

3.1. PI Search Task Performance

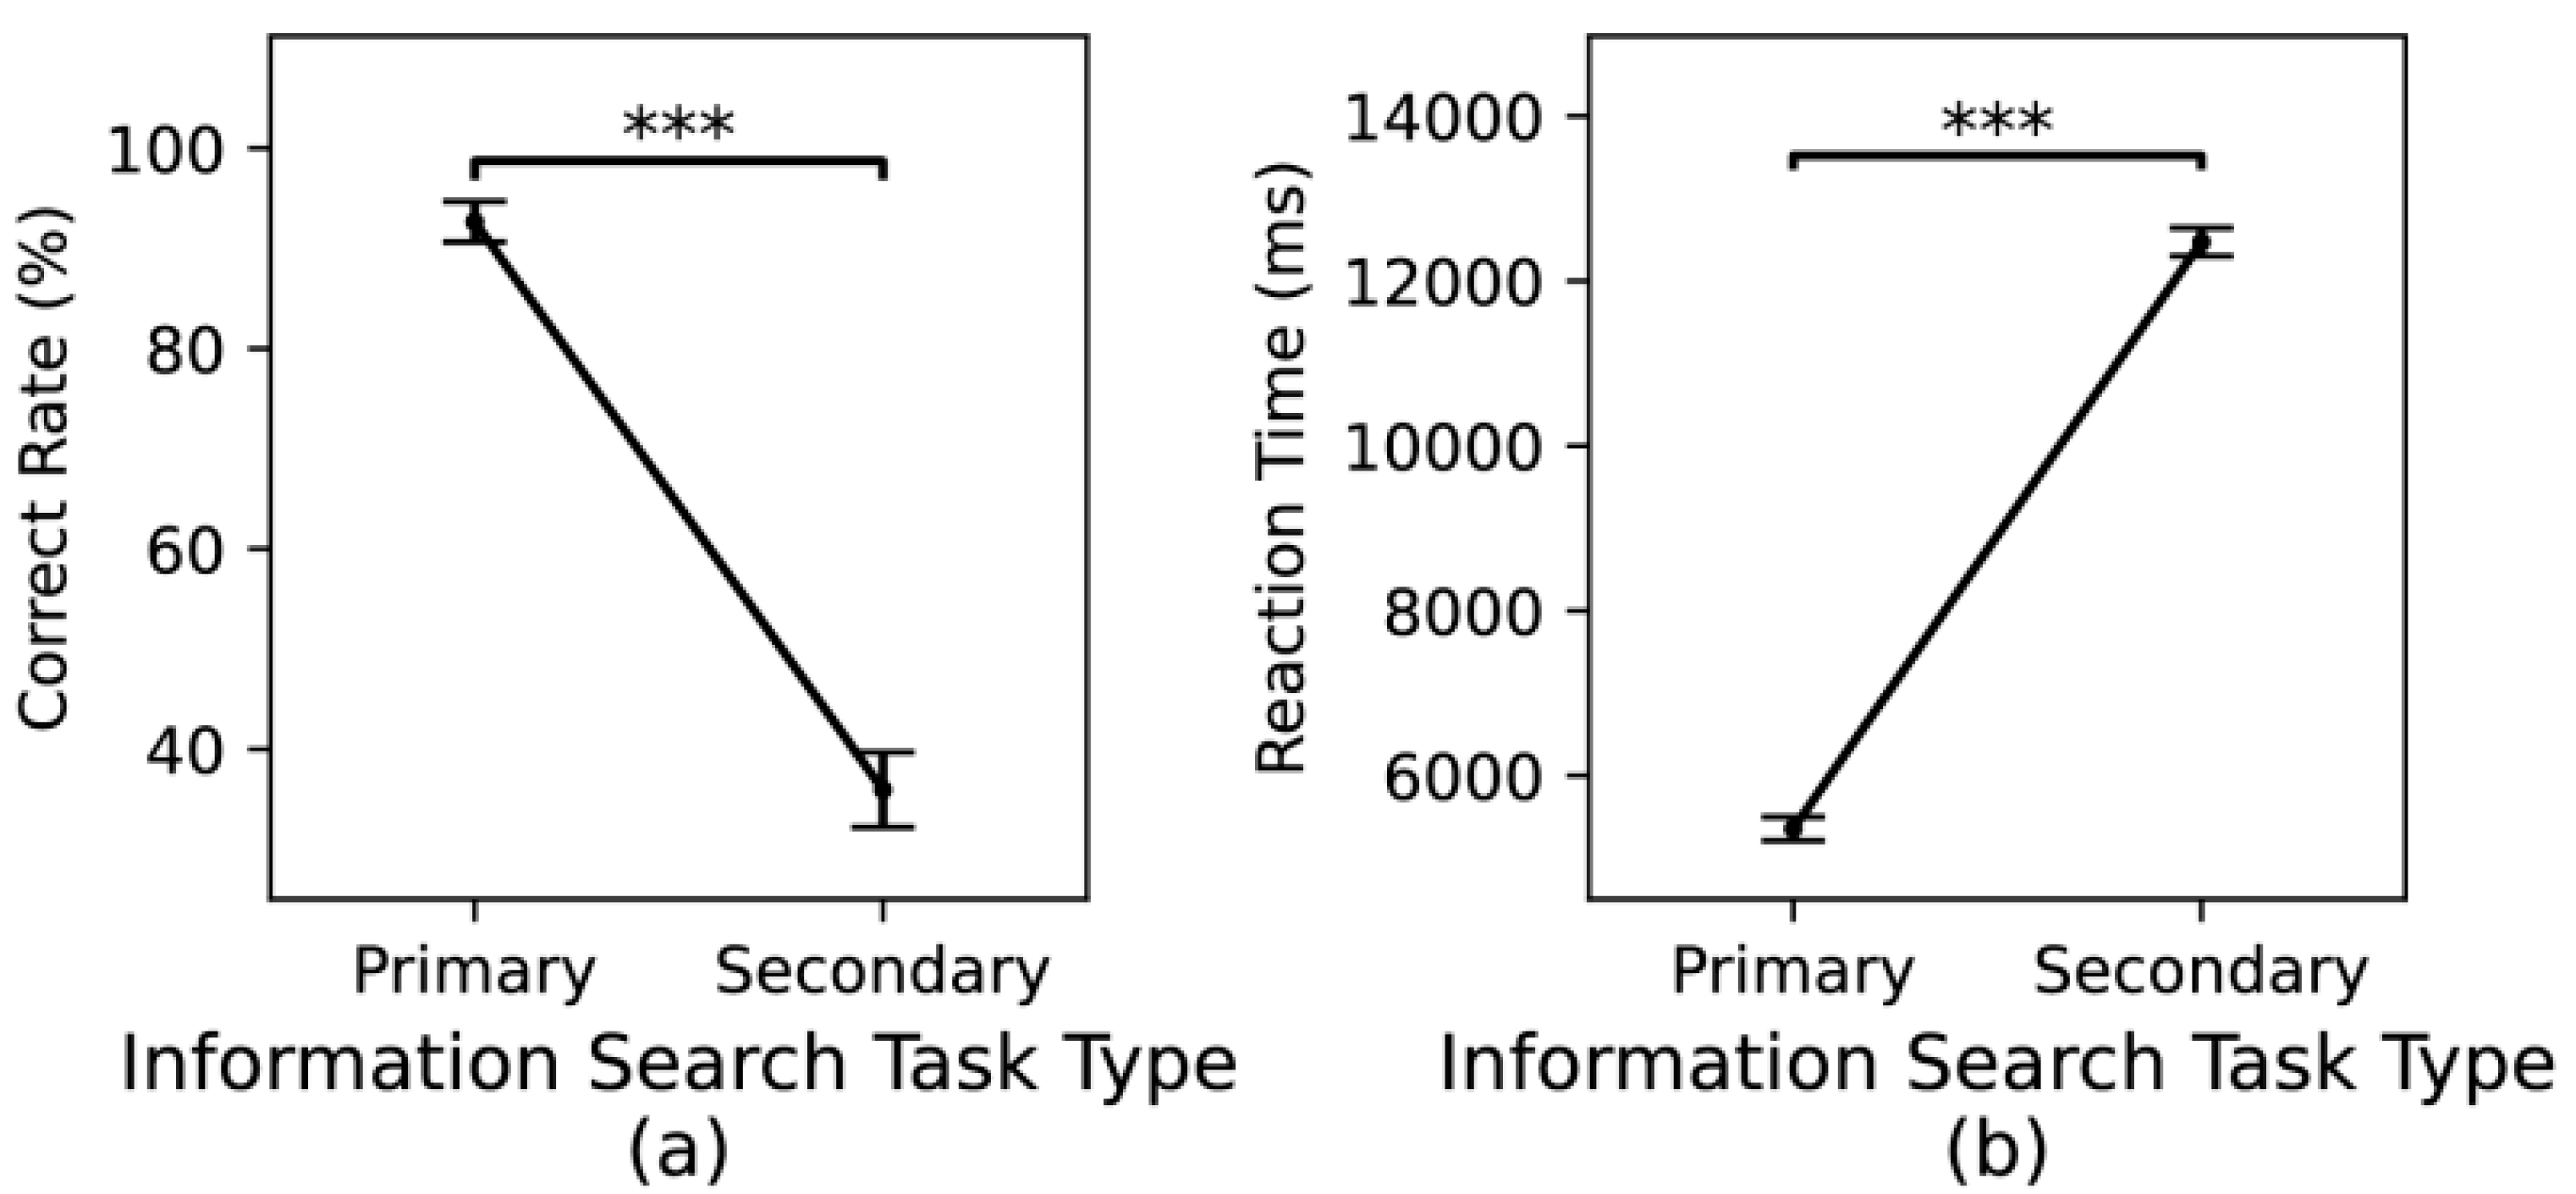
Results indicated that participants’ accuracy in the PI Search Task was significantly higher than in the SI Search Task (F (1, 1278) = 689.2, p < 0.001), and their reaction times were significantly shorter (F (1, 1278) = 2909.4, p < 0.001),as shown in Figure 7. Pairwise comparisons of dual-task performance across 32 different color combinations revealed no evidence that the SI Search Task performed significantly worse than the PI Search Task (i.e., no significantly lower accuracy or longer reaction times under any specific color combination).
Descriptive results indicated that the mean correct rate for the PI Search Task was 92.65% (n = 640). This high accuracy suggests the presence of a ceiling effect, where all participants achieved very high accuracy, potentially reducing data variability [30,31]. Consequently, this study places greater emphasis on differences in reaction times for the PI Search Task.
The results of the Spearman correlation analysis are presented in Table 1.
The ANOVA results for the dependent variables (correct rate and reaction time) in the PI Search Task are shown in Table 2. The findings indicate that for reaction time, both the Hue × Saturation and Saturation × Lightness interactions are statistically significant.
To further examine the significant interaction effect, a simple-effect analysis was conducted. The key results are summarized in Table 3.
In the PI Search Task, under various hue, saturation, and lightness conditions for SI, the results indicated that with 60% saturation, the reaction time at 180° hue was significantly lower than at 150° hue; with 20% saturation, the reaction time at 60% lightness was significantly lower than at 90% lightness; and with 60% lightness, the reaction times at 20% and 40% saturation were significantly lower than at 80% saturation.

3.2. SI Search Task Performance

The ANOVA results for the dependent variables (accuracy and reaction time) in the SI Search Task are presented in Table 4. The findings indicate that for accuracy, significant interaction effects were observed for both the Hue × Saturation and Hue × Lightness interactions. In terms of reaction time, hue, saturation, and lightness each exhibited significant main effects, but no significant interactions were detected among these three factors.
The results of the Spearman correlation analysis are presented in Table 5.
To further examine the significant interaction effects, a simple-effect analysis was conducted. The results are summarized in Table 6.
Under the 60% saturation condition, a hue of 150° produced higher accuracy than a hue of 180°, but also resulted in longer reaction times.
Post-hoc comparisons for saturation revealed that at 20% saturation, reaction time was significantly higher than at other saturation levels. At 60% lightness, using 80% saturation yielded significantly higher accuracy compared to 20% and 40% saturation.
Post-hoc comparisons for lightness indicated that at 80% and 90% lightness, reaction times were significantly longer than at 60% and 70%. Furthermore, under the 20% saturation condition, increasing lightness to 90% led to significantly higher accuracy compared to 60% lightness.

4. Discussion

Although the Landolt C paradigm used in this experiment cannot fully replicate the unique visual information search processes in actual HUD-EVS scenarios, the fundamental nature of visual search—rapidly locating a specific target in a complex environment—remains consistent between Landolt C targets and EVS visual elements. This paradigm is sufficient for evaluating how color-coding affects participants’ attention allocation and the recognizability of visual elements under specific conditions, as supported by previous studies [32,33].
Human information searching typically involves a combination of top-down and bottom-up processing [34]. With limited attentional resources, top-down memory of the target guides accelerates the search, whereas bottom-up target stimuli introduce interference, thereby increasing search time. In this experiment, the independent variables—the HSL (hue, saturation, lightness) attributes of SI—represent varying degrees of bottom-up interference. Given the same top-down memory guidance, participants’ accuracy and reaction time effectively reflect the extent to which these variables influence the recognizability of the visual elements. This is precisely the focus of the present study.

4.1. The Recognizability Advantage of PI

This study shows that participants achieved higher correct rate and shorter reaction times for PI compared to SI, indicating that the selected SI color settings did not compromise the PI’s recognizability advantage. Although the total number of PI targets was lower than that of SI, potentially affecting correct rate and response speed, there was no evidence that any SI color combination undermined PI’s performance. This confirms the effectiveness of the chosen color scheme in emphasizing fewer, higher-priority PI elements in terms of recognizability.
Turning to the effect of hue, although the main effect of hue was significant, a shorter reaction time for 180° hue compared to 150° hue emerged only when SI was presented at 60% saturation. This result suggests that at 180° hue, SI introduced greater attentional interference than at 150°, consistent with the standard luminosity function in human vision [18]. This effect may be attributed to the fact that hues near 555 nm fall within the range of maximum visual sensitivity, leading to relatively stronger perceptual salience even when saturation and lightness levels are held constant, thereby attracting attention more effectively. However, at other saturation or lightness levels, the 150° hue did not show a significant disadvantage, in line with the weak negative correlation (p < 0.3) between hue and reaction time. One explanation is that lightness and saturation exert a stronger influence on cognitive speed and visual preference, thereby reducing the role of hue in determining reaction time [35].
Regarding saturation, its influence on PI recognizability was modulated by the interaction between saturation and lightness. Only at 60% lightness did the 20% and 40% saturation conditions yield significantly shorter reaction times than the 80% saturation condition. Among the tested levels, SI with 80% saturation and 60% lightness resembled PI (with 100% saturation and 50% lightness) the most, reducing color contrast and making the two colors overly similar. This likely hindered PI recognition.
Similarly, the effect of lightness on PI recognizability depended on saturation changes. Only at 20% saturation did the reaction time for 60% lightness prove significantly lower than for 90% lightness. Because 20% saturation differs greatly from PI’s 100% saturation, the influence of lightness becomes more pronounced. The higher reaction time at 90% lightness may stem from increased attentional interference due to a much brighter SI, prolonging visual search and judgment for PI [36]. Since saturation exhibited a significant main effect on Primary Information (PI) reaction time (p < 0.001) with a weak positive correlation, whereas lightness did not show any significant main effect (p = 0.629) or correlation, this study recommends avoiding high saturation levels (e.g., 80%) for Secondary Information (SI). Lower saturation levels appear more conducive to maintaining PI’s recognizability advantage. Regarding the influence of lightness on PI recognizability, we adopt a cautious stance given its non-significant statistical outcome.

4.2. Recognizability of SI

This study indicates that under the 60% saturation condition, SI using a 150° hue achieved higher accuracy than that using 180°, but required longer reaction times. This outcome aligns with the previous section’s analysis, where the 150° hue demonstrated greater attentional interference compared to 180° at 60% saturation. The perceived brightness advantage of the 150° hue may explain its higher accuracy against complex backgrounds, but its hue similarity to the PI color could lead participants to spend more time on searching and identifying the target, a hypothesis that requires further investigation.
This study also underscores the impact of saturation on SI recognizability, with post-hoc comparisons showing that at 20% saturation, reaction time was significantly higher than at other levels. Moreover, only under 60% lightness did 80% saturation yield significantly higher accuracy compared to 20% and 40%, emphasizing the interplay between lightness and saturation. Consistent with previous studies, relatively lower lightness and saturation increased the difficulty of element recognition [20]. At 20% saturation, SI became harder to identify, resulting in longer reaction times. With 60% lightness, the lightness advantage was limited, making the effect of saturation on recognizability more pronounced. Thus, to avoid impairing SI recognizability, it is advisable not to use 20% saturation under 60% lightness.
Regarding the influence of lightness on SI recognizability, the results revealed that at 80% and 90% lightness, reaction times were significantly lower than at 60% and 70%. Under 20% saturation, post-hoc comparisons further indicated that using 90% lightness resulted in significantly higher accuracy than at 60%. This pattern is similar to the effect observed for saturation: lower lightness levels (60% and 70%) made elements harder to identify, leading to longer reaction times. Additionally, 60% and 70% lightness are closest to the 50% lightness used for PI, and this similarity in visual hierarchy may influence reaction times. The disadvantage of 60% lightness was further manifested in accuracy under the lowest (20%) saturation level. Therefore, to avoid compromising SI recognizability, this study recommends not using 60% lightness.
Finally, these results show that, unlike with PI, the influence of saturation and lightness on SI recognizability did not yield a significant three-way interaction, though the overall trend aligns with previous findings. Higher saturation and lightness generally contribute to improved element recognizability [37], yet the anticipated increase in target similarity [38] was not observed for SI’s own recognizability. Despite the 80% saturation value being closest to that of PI, participants still performed significantly better under this condition. This may be due to unexamined color differences among PI, SI, and the background. As SI saturation increases, the reduction in color contrast between PI and SI may be less than the increase in contrast between SI and the background. Future research will explore how color differences among PI, SI, and the background influence recognizability.

4.3. Recommendations for Two-Color Encoding Design of HUD-EVS Basic Information

Further simple-effect analysis revealed no consistent significant patterns for SI hue, possibly due to the influence of the background. Consequently, this study places greater emphasis on the effects of SI saturation and lightness, synthesizing dual color-coding strategies for EVS basic information. These strategies can serve as design references not only for EVS but also for similar AR mobile devices across various domains. The recommendations are summarized in Table 7 as follows:
Overall, under a predefined PI color scheme, using lightness above 60% and a saturation range between 20% and 80% for SI is recommended. Specifically, higher lightness enhances SI elements’ visibility against various textures and color interferences, ensuring they do not fade into the background. Meanwhile, maintaining a saturation range of 20–80% helps avoid two extremes: oversaturation that narrows the color gap between SI and PI, and undersaturation that fails to sufficiently distinguish SI from the background. Consequently, adhering to these guidelines helps preserve PI’s recognizability advantage while maintaining adequate discernibility for SI elements, even against a complex background. This approach not only ensures SI’s recognizability in the face of complex background textures and colors but also maintains the recognizability advantage of PI.

4.4. Limitations

This study focuses on a particular EVS complex background, offering targeted insights for that specific context. The experiment employed a static interface without incorporating dynamic interface conditions. In practical applications, visual elements in dynamic interfaces may be influenced by motion, variation, and interaction, potentially altering the recognizability of PI and SI, and thus yielding different color contrast outcomes compared to static interfaces.
Furthermore, the chosen complex background did not encompass a wider range of more diverse or highly complex backgrounds. Consequently, the current findings primarily reflect the effects of color contrast within one specific context. In real-world scenarios, the diversity of backgrounds, as well as variations in color and lightness, may influence the perception of color contrast in different ways.
Lastly, this study adopted the Landolt C paradigm rather than simulating an actual HUD-EVS interface. Because HUD-EVS interfaces involve unique layouts, dynamic updates, and interactive features, information recognizability and visual search performance may be affected in ways not captured by this experiment. Therefore, these findings are most applicable to the tested conditions, and further research is needed to validate them across more diverse real EVS scenarios.

5. Conclusions

This study employed a Landolt C paradigm under a static complex background to investigate a dual-color coding strategy aimed at optimizing the recognizability of PI and SI in HUD-EVS systems. The results indicate that adjusting the parameters of SI—hue, saturation, and lightness—affects the recognizability of both PI and SI. Certain configurations—such as a saturation that is too low (20%) or too high (80%) combined with 60% lightness—should be avoided to ensure the prominence of PI while maintaining sufficient visibility for SI. The findings offer valuable guidance for developing dual color-coding strategies for EVS basic information under complex EVS background conditions, thereby supporting more robust EVS applications across various scenarios and on different mobile devices.

Funding

This research received no external funding.

Institutional Review Board Statement

Ethical review and approval were waived for this study in accordance with Article 32, Item (2) of the Ethical Review Measures for Life Science and Medical Research Involving Humans, issued in 2023 by the National Health Commission of the People’s Republic of China, together with the Ministry of Education, the Ministry of Science and Technology, and the National Administration of Traditional Chinese Medicine. According to this regulation, ethical approval may be exempted for research that does not harm human subjects, does not involve sensitive personal information or commercial interests, and uses anonymized data. This study met these exemption criteria, as it involved a low-risk behavioral experiment using neutral visual stimuli, collected only anonymized demographic information (age and gender), and did not include any personally identifiable data or biological samples.

Informed Consent Statement

Informed consent was obtained from all subjects involved in the study. Written informed consent has been obtained from the participants to publish this paper.

Data Availability Statement

The original contributions presented in this study are included in the article. Further inquiries can be directed to the corresponding author.

Conflicts of Interest

The author declares no conflicts of interest.

Abbreviations

EVSEnhanced Vision Systems
PIPrimary Information
SISecondary Information
ARAugmented Reality
VSTVideo See-Through
HUDhead-up display
ARTaligned rank transformation

References

  1. Prezas, L.; Michalos, G.; Arkouli, Z.; Katsikarelis, A.; Makris, S. AI-enhanced vision system for dispensing process monitoring and quality control in manufacturing of large parts. Procedia CIRP 2022, 107, 1275–1280. [Google Scholar] [CrossRef]
  2. Trilling, B.; Mancini, A.; Fiard, G.; Barraud, P.A.; Decrouez, M.; Vijayan, S.; Tummers, M.; Faucheron, J.L.; Silvent, S.; Schwartz, C.; et al. Improving vision for surgeons during laparoscopy: The Enhanced Laparoscopic Vision System (ELViS). Surg. Endosc. 2021, 35, 2403–2415. [Google Scholar] [CrossRef]
  3. Ziakkas, D.; Pechlivanis, K.; Dillman, B. Assessment of Pilots’ Training Efficacy as a Safety Barrier in the Context of Enhanced Flight Vision Systems (EFVS). In Proceedings of the 14th International Conference on Applied Human Factors and Ergonomics (AHFE 2023), Francisco, CA, USA, 20–24 July 2023; Volume 83. [Google Scholar] [CrossRef]
  4. WUSA9. NASA Unveils New Supersonic X-59 Plane. 2023. Available online: https://www.wusa9.com/article/news/nation-world/nasa-new-supersonic-x-59-plane-unveiled/507-f33a8db3-376e-454a-af84-35acb6f7ab89 (accessed on 2 February 2025).
  5. Atlas, N. NASA Replaces Cockpit Window on Supersonic X-59 with Video Screen. 2023. Available online: https://newatlas.com/aircraft/nasa-replaces-cockpit-window-supersonic-x-59-video-screen/ (accessed on 2 February 2025).
  6. Wolfe, J.M. Guided search 2.0 a revised model of visual search. Psychon. Bull. Rev. 1994, 1, 202–238. [Google Scholar] [CrossRef]
  7. Van Laar, D.; Deshe, O. Evaluation of a visual layering methodology for colour coding control room displays. Appl. Ergon. 2002, 33, 371–377. [Google Scholar] [CrossRef] [PubMed]
  8. Duncan, J. Visual search and visual attention. In Attention and Performance XI; Routledge: London, UK, 2016; pp. 85–106. [Google Scholar]
  9. Itti, L.; Koch, C. Computational modelling of visual attention. Nat. Rev. Neurosci. 2001, 2, 194–203. [Google Scholar] [CrossRef]
  10. Frey, H.-P.; Honey, C.; König, P. What’s color got to do with it? The influence of color on visual attention in different categories. J. Vis. 2008, 8, 6. [Google Scholar] [CrossRef] [PubMed]
  11. Xiong, D.; Liu, Q.; Guo, X.; Zhang, Q.; Yao, Q.; Bai, Y.; Du, J.; Wang, Y. The effect of one-color and multi-color displays with HUD information in aircraft cockpits. In Man-Machine-Environment System Engineering: Proceedings of the 16th International Conference on MMESE; Springer: Singapore, 2016. [Google Scholar]
  12. Xiao, X.; Wanyan, X.; Zhuang, D.; Wei, Z. Ergonomic design and evaluation of visual coding for aircraft head-up display. In Proceedings of the 2012 5th International Conference on BioMedical Engineering and Informatics, Chongqing, China, 16–18 October 2012. [Google Scholar]
  13. Leykin, A.; Tuceryan, M. Determining text readability over textured backgrounds in augmented reality systems. In Proceedings of the 2004 ACM SIGGRAPH International Conference on Virtual Reality Continuum and Its Applications in Industry, Singapore, 16–18 June 2004. [Google Scholar]
  14. Gabbard, J.L.; Swan, J.E.; Hix, D. The effects of text drawing styles, background textures, and natural lighting on text legibility in outdoor augmented reality. Presence 2006, 15, 16–32. [Google Scholar] [CrossRef]
  15. Lee, H.; Bang, S.; Woo, W. Effects of background complexity and viewing distance on an ar visual search task. In Proceedings of the 2020 IEEE International Symposium on Mixed and Augmented Reality Adjunct (ISMAR-Adjunct), Porto de Galinhas, Brazil, 9–13 November 2020; pp. 189–194. [Google Scholar] [CrossRef]
  16. Cauz, M.; Clarinval, A.; Dumas, B. Text readability in augmented reality: A multivocal literature review. Virtual Real. 2024, 28, 59. [Google Scholar] [CrossRef]
  17. ISO 9241-210:2019; Ergonomics of Human-System Interaction—Part 210: Human-Centred Design for Interactive Systems. ISO: Geneva, Switzerland, 2024.
  18. Gross, H. Handbook of Optical Systems; Wiley-VCH: Weinheim, Germany, 2005. [Google Scholar]
  19. Camgöz, N.; Yener, C.; Güvenç, D. Effects of hue, saturation, and brightness: Part 2: Attention. Color Res. Appl. 2004, 29, 20–28. [Google Scholar] [CrossRef]
  20. Yu, N.; Ouyang, Z. Effects of background colour, polarity, and saturation on digital icon status recognition and visual search performance. Ergonomics 2024, 67, 433–445. [Google Scholar] [CrossRef]
  21. Mertes, C.; Wascher, E.; Schneider, D. From capture to inhibition: How does irrelevant information influence visual search? Evidence from a spatial cuing paradigm. Front. Hum. Neurosci. 2016, 10, 232. [Google Scholar] [CrossRef] [PubMed]
  22. Jung, K.; Han, S.W.; Min, Y. Opposing effects of stimulus-driven and memory-driven attention in visual search. Psychon. Bull. Rev. 2020, 27, 105–113. [Google Scholar] [CrossRef]
  23. Administration, F.A. Pilot’s Handbook of Aeronautical Knowledge; Federal Aviation Administration: Washington, DC, USA, 2009; p. 1602397805. [Google Scholar]
  24. Lin, P.-H.; Chen, H.-J.; Su, K.-W.; Chou, Y.-J. Effects of display technique, background complexity, and target size on visual performance evaluation–A case study using the “Spot The Difference” game. Int. J. Ind. Ergon. 2024, 100, 103555. [Google Scholar] [CrossRef]
  25. Yamin, P.A.; Park, J.; Kim, H.K.; Hussain, M. Effects of button colour and background on augmented reality interfaces. Behav. Inf. Technol. 2024, 43, 663–676. [Google Scholar] [CrossRef]
  26. Sawyer, B.D.; Wolfe, B.; Dobres, J.; Chahine, N.; Mehler, B.; Reimer, B. Glanceable, legible typography over complex backgrounds. Ergonomics 2020, 63, 864–883. [Google Scholar] [CrossRef] [PubMed]
  27. Feng, T.; Zhai, Y.; Yang, J.; Liang, J.; Fan, D.-P.; Zhang, J.; Shao, L.; Tao, D. IC9600: A benchmark dataset for automatic image complexity assessment. IEEE Trans. Pattern Anal. Mach. Intell. 2022, 45, 8577–8593. [Google Scholar] [CrossRef]
  28. Li, Y.; Wang, H.; Niu, Y.; Xie, Y.; Shi, B.; Hu, R. Research on color, luminance and line width of HUD symbols. In Human Systems Engineering and Design II: Proceedings of the 2nd International Conference on Human Systems Engineering and Design (IHSED2019): Future Trends and Applications, Munich, Germany, 16–18 September 2019; Universität der Bundeswehr München: Munich, Germany, 2020. [Google Scholar]
  29. R Core Team. R: A Language and Environment for Statistical Computing; R Foundation for Statistical Computing: Vienna, Austria, 2020; Available online: https://www.r-project.org/ (accessed on 2 February 2025).
  30. Liu, Q.; Wang, L. t-Test and ANOVA for data with ceiling and/or floor effects. Behav. Res. Methods 2021, 53, 264–277. [Google Scholar] [CrossRef]
  31. Zeigler-Hill, V.; Shackelford, T.K. Encyclopedia of Personality and Individual Differences; Springer: Berlin/Heidelberg, Germany, 2020. [Google Scholar]
  32. Gabbard, J.L.; Smith, M.; Merenda, C.; Burnett, G.; Large, D.R. A perceptual color-matching method for examining color blending in augmented reality head-up display graphics. IEEE Trans. Vis. Comput. Graph. 2020, 28, 2834–2851. [Google Scholar] [CrossRef]
  33. Betancur, J.A.; Vargas, H.; Sanchez, C.; Merienne, F. Visual guidelines integration for automotive head-up displays interfaces. Int. J. Interact. Des. Manuf. (IJIDeM) 2024, 19, 2841–2852. [Google Scholar] [CrossRef]
  34. Wickens, C.D.; McCarley, J.S.; Gutzwiller, R.S. Applied Attention Theory; CRC Press: Boca Raton, FL, USA, 2022. [Google Scholar]
  35. Wu, J.-H.; Yuan, Y. Improving searching and reading performance: The effect of highlighting and text color coding. Inf. Manag. 2003, 40, 617–637. [Google Scholar] [CrossRef]
  36. Humar, I.; Gradis, M. The impact of color combinations on the legibility of a Web page text presented on CRT displays. Int. J. Ind. Ergon. 2008, 38, 885–899. [Google Scholar] [CrossRef]
  37. Wilms, L.; Oberfeld, D. Color and emotion: Effects of hue, saturation, and brightness. Psychol. Res. 2018, 82, 896–914. [Google Scholar] [CrossRef] [PubMed]
  38. Humar, I.; Gradisar, M.; Turk, T.; Erjavec, J. The impact of color combinations on the legibility of text presented on LCDs. Appl. Ergon. 2014, 45, 1510–1517. [Google Scholar] [CrossRef] [PubMed]
Figure 1. Experimental apparatus and environment: The participant performed tasks in a uniformly illuminated laboratory (500 lx) with minimal noise (<40 dB). A 27-inch 4 K monitor (60 Hz refresh rate) was used to display the experimental content, and the participant operated solely with a keyboard. The monitor was positioned approximately 55 cm away from the participant to ensure optimal visual comfort and experimental precision.
Mti 09 00046 g001
Figure 2. Parameters of the Landolt C target and the visual perception experimental layout.
Mti 09 00046 g002
Figure 3. Background filtering process and sample materials.
Mti 09 00046 g003
Figure 4. Design of independent variables.
Mti 09 00046 g004
Figure 5. Experimental procedure.
Mti 09 00046 g005
Figure 6. Procedure of a single trial.
Mti 09 00046 g006
Figure 7. Correct rate and reaction time differences between Primary (PI) and Secondary (SI) Search Tasks (*** p  <  0.001).
Mti 09 00046 g007
Table 1. Spearman correlations between independent variables and PI reaction time.
Independent VariablesReaction Time
Hue−0.11 ** (p = 0.006)
Saturation0.147 ** (p < 0.001)
Lightness0.032 (p = 0.428)
** p  <  0.01.
Table 2. ANOVA results for PI reaction time.
SourceReaction Time (p-Value)
Hue<0.001 ***
Saturation<0.001 ***
Lightness0.629
Hue × Saturation<0.001 ***
Hue × Lightness0.258
Saturation × Lightness0.033 *
Hue × Saturation × Lightness0.129
* p  <  0.05, *** p  <  0.001.
Table 3. Simple-effect analysis of the interaction between hue, saturation, and lightness.
Conditioning VariableTarget VariableContrast Resultsp-Value
60% SaturationHue150° > 180°<0.001 ***
20% SaturationLightness60% < 90%0.016 *
60% LightnessSaturation20% < 60%0.02 *
20% < 80%<0.001 ***
40% < 80%0.008 **
Significant results only: * p  <  0.05, ** p  <  0.01, *** p  <  0.001. Note: 1. In the column ‘Contrast Results’, the ‘>’ symbol indicates that the ART-transformed mean of the first condition is higher than that of the second condition. 2. Conditioning Factor refers to the fixed levels under which pairwise comparisons of the Target Factor were conducted.
Table 4. ANOVA results for SI correct rate and reaction time.
SourceCorrect Rate (p-Value)Reaction Time (p-Value)
Hue<0.001 ***<0.001 ***
Saturation<0.001 ***<0.001 ***
Lightness<0.001 ***<0.001 ***
Hue × Saturation<0.001 ***0.366
Hue × Lightness0.01 *0.966
Saturation × Lightness0.2680.651
Hue × Saturation × Lightness0.1890.647
* p  <  0.05, *** p  <  0.001.
Table 5. Spearman correlations between independent variables and SI correct rate and reaction time.
Independent VariablesCorrect RateReaction Time
Hue−0.221 *** (p < 0.001)−0.133 *** (p < 0.001)
Saturation0.119 ** (p = 0.002)−0.175 *** (p < 0.001)
Lightness0.297 *** (p < 0.001)−0.274 *** (p < 0.001)
** p  <  0.01, *** p  <  0.001.
Table 6. Simple-effect analysis of the interaction between hue, saturation, and lightness (significant results only: * p < 0.05, ** p < 0.01, *** p < 0.001).
Conditioning FactorTarget FactorDependent VariableContrast Resultsp-Value
60% SaturationHueCorrect Rate150° > 180°<0.001 ***
Reaction Time150° > 180°<0.001 ***
60% LightnessSaturationCorrect Rate20% < 80%<0.001 ***
Correct Rate40% < 80%0.008 **
/Reaction Time20% > 40%<0.001 ***
Reaction Time20% > 60%<0.001 ***
Reaction Time20% > 80%<0.001 ***
20% SaturationlightnessCorrect Rate60% < 90%0.016 *
/Reaction Time60% > 80%<0.001 ***
Reaction Time60% > 90%<0.001 ***
Reaction Time70% > 80%0.018 *
Reaction Time70% > 90%<0.001 ***
Significant results only: * p  <  0.05, ** p  <  0.01, *** p  <  0.001. Note: 1. In the column ‘Contrast Results’, the ‘>’ symbol indicates that the ART-transformed mean of the first condition is higher than that of the second condition. 2. Conditioning Factor refers to the fixed levels under which pairwise comparisons of the Target Factor were conducted.
Table 7. Dual color-coding design strategies for EVS basic information.
Design PremiseStrategy & RecommendationsDesign GoalExperimental Evidence
PI uses 120° hue, 100% saturation, and 50% lightnessAvoid using saturation below 20% and lightness below 60% for SIEnsure SI’s recognizabilitySuch low saturation or lightness values led to significantly poorer search performance among participants compared to higher values. Insufficient saturation or lightness may fail to guarantee SI elements an adequate level of recognizability, especially against complex backgrounds.
Avoid using high or above 80% saturation for SIMaintain PI’s recognizability advantageWhen SI employs a relatively high saturation level, participants’ search performance for PI deteriorates notably. Increasing SI saturation narrows the color difference between SI and PI, interfering with PI’s recognizability.
Disclaimer/Publisher’s Note: The statements, opinions and data contained in all publications are solely those of the individual author(s) and contributor(s) and not of MDPI and/or the editor(s). MDPI and/or the editor(s) disclaim responsibility for any injury to people or property resulting from any ideas, methods, instructions or products referred to in the content.

