Abstract
In aviation safety, pilots must efficiently process dynamic visual information and maintain a high level of attention. Any missed judgment of critical information or delay in decision-making may lead to mission failure or catastrophic consequences. Therefore, accurately detecting pilots’ attention states is the primary prerequisite for improving flight safety and performance. To better detect the attention state of pilots, this paper takes flight trainees as the research object and the simulated flight environment as the experimental background. It proposes a method for detecting the attention state of flight trainees based on a multi-modal dynamic depth network (M3D-Net). The M3D-Net architecture is a lightweight neural network architecture that integrates temporal image features, visual information features, and flight operation data features. It aligns image and text features through an attention mechanism to enhance the semantic association between modalities; it utilizes the Depth-wise Separable Convolution and LSTM (DSC-LSTM) module to model temporal information, dynamically capturing the contextual dependencies within the sequence, and achieving six-level attention state classification. This paper conducted ablation experiments to comparatively analyze the classification effects of the model and also evaluates the effectiveness of our proposed method through model evaluation metrics. Experiments show that the classification effect of the model architecture proposed in this paper reaches 97.56%, with a model size of 18.6 M. Compared with traditional algorithms, the M3D-Net architecture has better performance prospects in terms of application.
1. Introduction
According to flight accident statistics from the Federal Aviation Administration (FAA) and NASA, only 12% of aviation accidents involve aircraft mechanical failures, whereas approximately 73% are attributed to human factors. Among these human-caused incidents, 67% stem from crew errors, with pilot operational errors constituting the predominant factor, contributing to approximately 51% of all air crashes. Such errors frequently originate from attentional lapses during flight operations, which correlate with diminished situational awareness in the cockpit [1]. Research by Endsley further reveals that 76% of aviation situational awareness failures involve deficits in selective attention, specifically, the inability to accurately perceive critical stimuli [2].
In the booming aviation industry, aircraft cockpit design—particularly the cockpit human–machine interface (HMI)—has grown increasingly sophisticated, while rising automation levels introduce greater diversity and complexity to flight missions [3]. Pilots need process larger volumes of real-time data, including instrument readings and ground control instructions, while simultaneously responding swiftly to hazard warnings or abnormal system signals. A failure to maintain focus or detect critical cues can compromise mission success and even lead to fatal accidents [4]. Consequently, in aviation safety research, enhancing pilot attentional focus has become a cornerstone for ensuring flight safety and performance. To enhance attention, it is first necessary to detect the pilot’s attention state [5]. How to construct a pilot attention state detection model through multi-modal data has become an important issue to be solved urgently.
The main contributions of this paper are as follows:
- (1)
- Innovation in Multimodal Fusion: Unlike methods that rely on a single data source, we deeply integrate temporal facial image sequences, visual gaze information, and flight operation performance data.
- (2)
- Efficient Lightweight Architecture Design: To address practical deployment challenges, we propose a lightweight network architecture. By introducing a Depth-wise Separable Convolution (DSC) and LSTM combined module (DSC-LSTM), the model significantly reduces the number of parameters while efficiently modeling spatiotemporal feature dependencies, achieving a balance between accuracy and efficiency.
- (3)
- Dynamic Temporal Context Modeling: Instead of using static image analysis, this study focuses on dynamic sequence analysis. The DSC-LSTM module effectively captures contextual information in the time dimension, such as changes in facial expressions, gaze behavior, and operational actions, thereby more accurately identifying dynamic fluctuations and shifts in attention.
The main work arrangements of this paper are as follows:
Section 2 mainly presents the research status of attention state detection at home and abroad.
Section 3 elaborates on the data preprocessing methods and introduces in detail the M3D-Net model algorithm.
Section 4 mainly designs experiments on different attention states of flight trainees in the simulated flight environment, and conducts a large number of experiments and data collection. It introduces the training details of the model, and comparatively analyzes the classification effect of the model through ablation experiments. Also, the validity of the method we proposed is evaluated by model evaluation metrics.
Section 5 summarizes the work of this paper.
Section 6 looks forward to the future.
2. Related Work
Traditional attention assessment methods, like questionnaires and behavioral experiments, rely on subjective reports or indirect observations, suffering from limitations such as poor real-time performance and delayed feedback, making it difficult to capture attention fluctuations dynamically [6,7,8]. Recently, researchers have combined physiological signals with AI for more objective and efficient assessment. Yang et al. [9] summarized an electroencephalogram (EEG)-based evaluation system, finding frequency band features correlated with attention. Cong et al. [10] proposed an asynchronous brain-control method integrating attention detection and intention recognition to improve classification and reduce false triggers. Ghaderi et al. [11] linked eye movement data with EEG, showing pupil dilation and EEG engagement changes synchronously, providing a basis for cross-modal assessment. However, EEG is susceptible to environmental electromagnetic interference, and it is necessary to collect data in a shielded laboratory, which limits the practical application scenarios.
The introduction of artificial intelligence technology has significantly enhanced attention classification performance. Eivazi et al. [12] used real-time eye tracking technology combined with a support vector machine (SVM) method to predict the user’s visual attention performance in problem-solving tasks. The study found that eye movement data can effectively distinguish different attention states, and the accuracy of attention classification can reach 87%. Wu et al. [13] designed a Feature Encoding and Convolutional Neural Network (FECNN) to classify drivers’ attention states by optimizing parameters. Zhang et al. [14] proposed a multi-scale spatiotemporal feature fusion method with the Convolutional Long Short-Term Memory Network (ConvLSTM) for driver distraction detection under unsupervised conditions. Du et al. [15] used facial expression, voice, and car signal modal features for distraction detection, and a polynomial fusion layer-based multi-modal fusion technique achieved 81.39% accuracy. Baheti et al. [16] modified VGG-16, studied regularization techniques, achieving 95.54% accuracy with reduced parameters from 140 M to 15 M.
Eye tracking technology has received extensive attention due to its advantages of non-invasiveness and high spatial resolution. There is a close physiological relationship between pupil size and attention. We can indirectly understand a person’s attention state by observing the change in pupil size. [17]. Wickens [18] noted a strong link between attention and eye movements in Applied Attention Theory. Ghaderi’s team [19] found experienced pilots focus on key instruments during simulated takeoff, while novices have scattered gazes. Zhang et al. [20] verified that pupil variability and saccade peak velocity are sensitive attention indicators. Pupil dilation relates to cognitive load and attention demand, affected by task complexity. Privitera et al. [17] confirmed its link to target detection in visual tasks. Yang et al. [21] proposed a 3D scene map visual attention calculation method, but the model needs improvement. Cannavo et al. [22] simulated flight scenarios to evaluate pilots’ attention performance. Xiong et al. [23] integrated gaze, head posture, and eyelid movement features to develop a real-time attention detection model.
In conclusion, existing research still faces challenges. There is relatively rich research on the attention state of drivers, but there are still some deficiencies in the research on the attention state of flight trainees. Although eye movement indicators can provide some evidence related to attention, they can only detect more obvious visual attention shifts and cannot fully detect the attention state. To understand the attention state of flight trainees during the simulated flight process, we propose to use the attention state detection of flight trainees based on time-series images, visual information, and flight performance, construct a lightweight neural network architecture, and achieve accurate classification through multi-modal data fusion and dynamic feature extraction. The system uses a miniaturized glasses-type eye tracker to collect visual information of flight trainees, uses an industrial camera to collect time-series facial images, combines flight operation data to establish an (M3D-Net) architecture model, and realizes six-level attention state classification. We compare with other models and conduct ablation experiments to evaluate the effectiveness of the model.
3. Methods
3.1. Data Preprocessing
This article focuses on the structured processing of simulation experimental data from flight cadets under different attention states. Firstly, a multi-modal data alignment method based on timestamp synchronization is adopted to synchronize time-series image data, visual information data, and flight operation data with millisecond-level precision, where the sampling rate of all modal data in the program reaches 30 Hz. The duration of a single attention behavior is 5 s. Due to the average response latency (126 ± 34 ms) of the flying cadets, we selected the key response window of 1–4 s as the effective data segment. After segmentation, each sample contains image data, visual information data, and operation data, forming a multi-dimensional dataset with spatiotemporal feature alignment. All samples are stored in text format in a structured manner and labeled with metadata tags of six types of attention states.
3.2. Multimodal Representation Learning
3.2.1. MobileNet-V3 Model
MobileNet-V3 [24] is a new generation of lightweight convolutional neural network architecture proposed by Google Research in 2019. Based on inheriting the core design concepts of the MobileNet series, this model achieves performance breakthroughs through innovative and optimization methods. Firstly, it adopts a combined structure of depthwise separable convolution and inverted residual blocks to reduce the number of model parameters and computational complexity while maintaining feature expression ability. Secondly, it introduces an attention mechanism (Squeeze-and-Excitation module) and a new type of nonlinear activation function (h-swish) to effectively increase the response weight of important feature channels. Finally, it employs Neural Architecture Search (NAS) technology to intelligently optimize inter-layer connections, achieving a balance between model accuracy and inference speed.
This paper employs MobileNet-V3 to extract temporal image features. The model demonstrates superior performance in temporal image processing tasks. Its lightweight architecture suits low-power devices and meets real-time processing requirements for mobile applications. Additionally, the hierarchical feature extraction mechanism effectively captures spatial-temporal correlations in video data.
3.2.2. Bi-LSTM Model
Traditional RNNs have problems such as vanishing/exploding gradients in temporal modeling, making it difficult to capture long-distance sequence dependencies effectively. Long Short-Term Memory (LSTM) introduce gating mechanisms (input gate, forget gate, output gate) and cell state to achieve precise control of the gradient flow, thus partially solving the above problems. To further enhance the sequence modeling ability, Bidirectional Long Short-Term Memory Networks (Bidirectional LSTM, Bi-LSTM) [25] use a bidirectional temporal context encoding mechanism to jointly model the hidden states of forward and reverse LSTMs, significantly enhancing the global representation ability of sequence features.
The final hidden state of Bi-LSTM at each time step t is obtained by concatenation or weighted fusion of the bidirectional outputs. We choose to obtain the final hidden state representation of this time step by concatenating the bidirectional outputs.
where and are the forward and backward hidden states, respectively, and α is a learnable weight coefficient.
This article uses the Bi-LSTM model to extract features from two types of heterogeneous time-series data, including visual information features and flight operation features. It mainly extracts flight cadets’ spatiotemporal dynamic features (like gaze movement trajectories, fixation areas, and pupil diameters) and time-series flight operation features (such as altitude, pitch angle, and yaw angle) corresponding to them.
3.3. ConvLSTM Model
ConvLSTM [26] integrates the local feature extraction ability of Convolutional Neural Networks (CNN) and the temporal modeling advantage of LSTM, and is specifically used to process sequential data with spatiotemporal correlations. Compared with traditional LSTM, which only relies on fully connected layers to process vectorized data, ConvLSTM introduces convolutional operations in the time dimension. Its core mechanism is that the input gate, forget gate, and output gate at each time step are all implemented through convolutional layers. This design enables the model to directly process two-dimensional or three-dimensional structured data. While capturing temporal dynamics, it extracts local spatial features in the data through a sliding window mechanism, thus effectively modeling the complex spatiotemporal dependencies in spatiotemporal data. The basic formula for single-step prediction of ConvLSTM is as follows:
where represents the sigmoid activation function, and represents the hyperbolic tangent activation function. is the input at the current time step, is the hidden state at the previous time step, is the memory cell at the previous time step, and , , , , represent the forget gate, input gate, memory cell, output gate, respectively.
For the sake of lightweight design, we replace the standard convolution in ConvLSTM with depthwise separable convolution to reduce the number of parameters. Depthwise separable convolution mainly consists of two processes: Depthwise Convolution and Pointwise Convolution. We use depthwise convolution to extract spatial features with a convolution kernel size of 3 × 3 and padding of 1 to ensure that the spatial dimensions remain unchanged. And we use 1 × 1 pointwise convolution to fuse channel information. Compared with the standard convolution, the number of model parameters is reduced by approximately 75%.
3.4. M3D-Net Model
3.4.1. Multimodal Feature Fusion Module
Before feeding into the DSC-LSTM network, this study employs an attention-based alignment mechanism to enhance semantic correlations between visual and textual modalities. As illustrated in Figure 1, the proposed multimodal feature fusion module facilitates cross-modal information interaction through three key steps: (1) Projecting image and text features into a shared attention space via linear transformations; (2) Implementing multi-head self-attention to compute cross-modal relevance scores, where text features serve as queries while image features act as both keys and values; (3) Generating fused text representations enriched with visual context through attention-weighted summation. This hierarchical fusion strategy effectively establishes modality alignment while preserving original semantic structures.
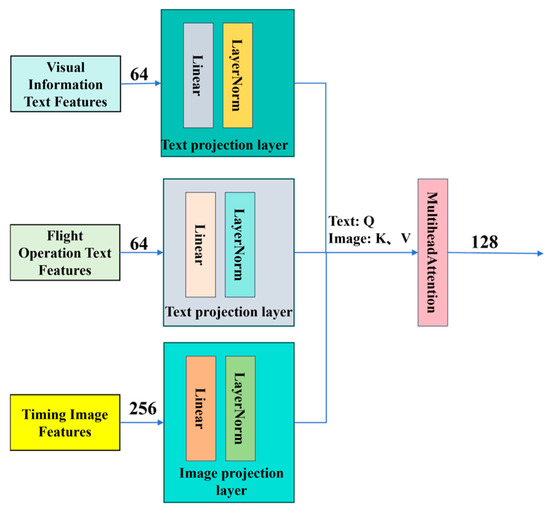
Figure 1.
Multimodal Feature Fusion Module. It integrates text and image features, extracts feature vectors through text and image projection layers, and realizes cross-modal feature interaction and fusion based on multi-head attention mechanism.
3.4.2. DSC-LSTM Module
As shown in Figure 2, the DSC-LSTM module combines the Depthwise Separable Convolution and LSTM neural network units for efficiently processing multimodal spatiotemporal sequence data. By replacing the full convolution operation of traditional ConvLSTM with a 3 × 3 spatial convolution per channel and a 1 × 1 pointwise convolution, the number of parameters is significantly reduced while retaining the gating mechanisms of LSTM to dynamically learn spatiotemporal features and control state updates, ultimately outputting new hidden states h_next and cell states c_next.
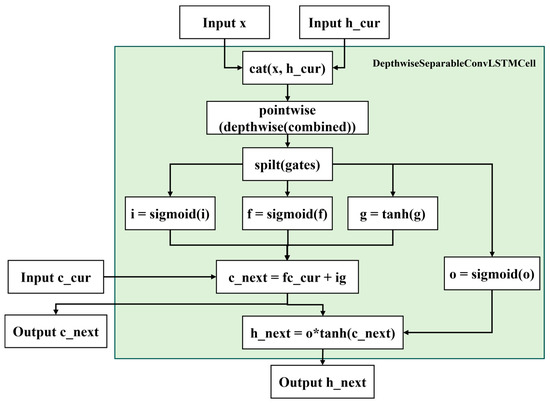
Figure 2.
DSC-LSTM Module. Depthwise 3 × 3 convolutions and 1 × 1 pointwise convolutions retain the LSTM gating mechanism while reducing parameters, dynamically modeling spatiotemporal features and outputting updated hidden (h_next) and cell (c_next) states.
3.4.3. M3D-Net
The M3D-Net architecture of the model proposed in this paper utilizes a multimodal deep learning model framework, as shown in Figure 3, to complete classification tasks by fusing image and text features. It mainly consists of three branches. The first branch processes visual information, text data, and the second branch processes flight operation text data. Both use Bi-LSTM to extract features and further project and reduce dimensions. The third branch processes image data using MobileNet-V3 to extract image features and reduces dimensions through a projection layer. Subsequently, the cross-modal attention mechanism aligns and fuses image and text features to generate a shared spatiotemporal feature representation. Then, the DSC-LSTM module models temporal information and dynamically captures the contextual dependencies in the sequence. Finally, the category prediction is output through a fully connected classification head. This model improves training stability and generalization ability through techniques such as freezing some image network parameters, regularization, and gated forget bias initialization, and is suitable for tasks requiring multimodal collaborative modeling.
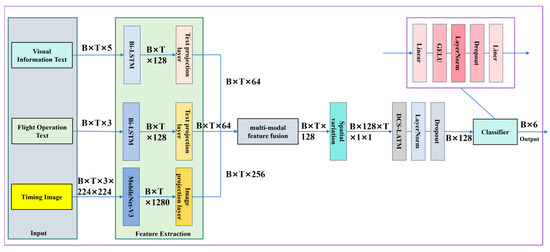
Figure 3.
Architecture diagram of M3D-Net. The Bi-LSTM and MobileNet-V3 networks jointly extract visual-flight features and perform dimensionality reduction, followed by cross-modal attention for multi-source feature alignment and spatiotemporal representation fusion. The DSC-LSTM module subsequently models temporal dependencies through dynamic gating mechanisms.
4. Experiments and Experimental Results
4.1. Experimental Environment and Experimental Personnel
The experimental flight environment employs a six-degree-of-freedom flight simulation platform functioning as a high-fidelity training system. Equipped with DCS World combat flight simulation software, this platform specializes in realistic aerodynamic replication. For visual data acquisition, we utilize a FLIR-manufactured industrial camera (Canadian-made) with 640 × 480 resolution. Gaze tracking is implemented using a miniaturized eye-tracking device developed in-house, whose functionality has been validated through preliminary trials to meet all experimental requirements.
We recruited 10 flight cadets who had undergone long-term simulation flight training and received flight guidance in the laboratory. Their ages ranged from 21 to 35 years old. They were familiar with the flight safety performance assessment standards and procedures and were proficient in flight takeoff and landing tasks. None of the flight cadets had a history of neurological or psychiatric diseases, and they signed an informed consent form before the experiment.
4.2. Dataset
4.2.1. Data Collection
This paper designs six types of attention state detection tasks, as shown in Table 1. They are mainly divided into six tasks: dangerous behavior, distracted flying, normal level, high concentration, fatigue flying, and yawning.

Table 1.
Introduction to Classification Items.
We established the experimental environment and calibrated the industrial camera using Zhang Zhengyou’s chessboard calibration method to obtain rectified images. An integrated experimental platform was then constructed, comprising a flight simulation platform, an industrial camera, and gaze-tracking glasses. Before the experiment, flight cadets were instructed to wear the gaze-tracking glasses, initiate the experimental data acquisition system, register subjects, and conduct a pre-experiment following the simulated five-sided flight scenario. The simulated flight experiment involved a five-sided airway cruise takeoff and landing training task. The task incorporated four waypoints, requiring subjects to depart from runway point A, navigate around four waypoints and five airways, and complete a five-sided flight circuit. The specific requirements for the five-sided flight task are detailed in Table 2. Flight cadets were required to fulfill these task requirements during the takeoff, approach, landing, and cruise phases.
Table 2.
Requirements for the Five-Sided Flight Task.
During the simulated five-sided flight experiment, randomly generated task prompts occur at non-predictable intervals, mandating flight cadets to complete corresponding simulated task experiments upon prompt presentation. As depicted in Figure 4, the experimental timeline diagram delineates six distinct attention state detection task categories. Upon task prompt appearance, the simulation software automatically suspends operations; subsequent prompt disappearance triggers system resumption, enabling flight cadets to perform designated flight training scenarios. The data acquisition system concurrently captures facial images, visual parameters, and flight metrics in real-time while applying task-specific labels to each dataset. Figure 5 outlines the complete experimental protocol schematic. A single experimental session attains completion status only following full execution of a five-sided flight simulation cycle. The experimental time of each group was about 20 min.
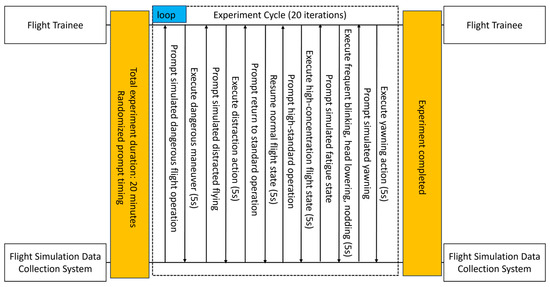
Figure 4.
Experimental process timing diagram. Six types of attention state detection task timing process.
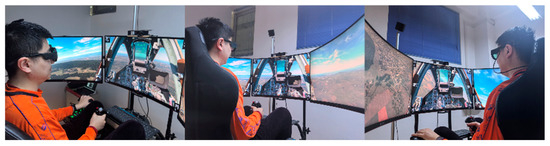
Figure 5.
Experimental Process Diagram.
4.2.2. Visual Display
After data preprocessing, we randomly visualized the gaze paths and gaze heatmaps of flight cadets under six types of attention states. The gaze point diagrams under different attention states are shown in Figure 6a, and the gaze path diagrams under different attention states are shown in Figure 6b.
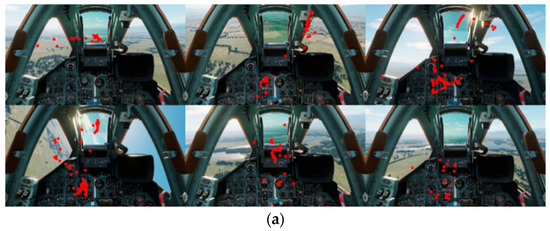
Figure 6.
Gaze diagrams under different attention states. (a) Gaze point (Red dot) diagrams under six different flight flying states. (b) Gaze path (Green line) diagrams under six different flight flying states.
Figure 6a,b show the gaze point distribution and gaze path characteristics under six flight flying states. In the first row, the first picture shows a significant deviation of the flight cadet’s gaze from the task during a dangerous flight, with scattered points and a messy path. The second picture indicates distracted flight, with gaze fixed on irrelevant areas and a lacking dynamic path. The third picture represents normal flight, with evenly distributed gaze points covering key areas. In the second row, the first picture shows a concentrated gaze on relevant areas during highly concentrated flight, with short and frequent path switching. The second picture shows abnormal gaze distribution and a discontinuous path during fatigue flight, along with eye closure or wandering. The third picture shows reduced and sparse gaze points and a broken path during yawning, verifying the negative impact of fatigue. Gaze patterns under different states can be distinguished by features like distribution, regularity, and coverage.
4.2.3. Composition of Multimodal Dataset
The multimodal attention state dataset constructed in this paper finally forms six categories of attention states after standardized preprocessing. Figure 7 shows the sample images of each category in the dataset. This dataset contains a total of 19,044 multimodal heterogeneous time-series samples, with the specific composition as follows:
Figure 7.
Six Kinds of Flight Cadet Behaviors in the Multimodal Dataset.
- (1)
- Temporal facial image modality: It contains 6348 sample units. Each sample is composed of 90 consecutive time-series images, and the temporal image matrix is 90 × 3 × 480 × 640, covering the time-varying features of facial action units, forming processable tensor data. The processed temporal feature matrix is 90 × 3 × 224 × 224.
- (2)
- Visual attention modality: It corresponds to 6348 sets of temporal eye movement feature vectors. The temporal eye movement feature matrix is 90 × 5-dimensional time-series data, including feature parameters such as gaze point coordinates (horizontal coordinate, vertical coordinate), gaze area, gaze duration, and pupil diameter.
- (3)
- Flight operation modality: 6348 sets are collected synchronously. The flight control temporal matrix is 90 × 3-dimensional time-series data, covering key control parameters such as altitude, pitch angle, and yaw angle.
4.3. Model Training
A summary of the M3D-Net model training parameters and configuration is provided in Table 3. In the training preparation stage, we load time-series images, and visual and flight operation texts. To reduce data leakage risk, we shuffle the dataset by label correspondence and divide it into training, test, and validation sets in the ratio of 70:20:10.
Table 3.
Summary of M3D-Net Model Training Parameters and Configuration.
For image data augmentation and standardization, we randomly crop and scale images (retaining 90–100% content) to 224 × 224, flip horizontally with 50% probability, adjust brightness and contrast, convert to tensors, normalize, and standardize to approach zero mean and unit variance per channel. This enhances diversity and ensures neural network compatibility, preventing overfitting and accelerating convergence.
In the model initialization stage, we initialize the M3D-Net architecture, configure the optimizer (AdamW) and learning rate scheduler (OneCycleLR), and employ Focal Loss to address class imbalance. The differentiated learning rates (3 × 10⁻⁵ to 6 × 10⁻⁴) are strategically assigned to modules based on parameter sensitivity disparities, avoiding update conflicts caused by global uniform learning rates. The AdamW optimizer combines adaptive learning rate mechanisms with weight decay to accommodate multimodal parameter heterogeneity. The OneCycleLR scheduler adopts a “warm-up-high-rate-training-cosine-decay” strategy to efficiently explore the parameter space and ensure stable convergence within 20 epochs.
During training, we freeze the parameters of the first 15 layers of the vision encoder and execute 50 training epochs. Model checkpoints are saved based on validation performance, and the optimal model is selected for evaluation. For evaluation, we comprehensively assess model performance through classification reports, confusion matrices, and visualization of training loss/accuracy curves. This evaluation framework quantifies both class-balanced performance metrics and error-type distributions.
4.4. Result Analysis
4.4.1. Performance Metrics
In order to comprehensively evaluate the performance of the method we proposed, this paper adopts accuracy, precision, recall, F1 score and confusion matrix as evaluation metrics.
TP refers to the number of samples correctly classified as positive by the model. FP represents the number of samples incorrectly classified as positive by the model. Precision is defined as the proportion of true positives among all predicted positives. FN denotes the number of samples incorrectly classified as negative by the model. Recall is defined as the proportion of true positives among all actual positives. The F1 score, calculated as the harmonic mean of precision and recall, provides a measure of model performance, with higher values indicating better performance. mPre, mRec, and mF1 represent the average performance metrics across the six attention states.
4.4.2. Experimental Results
Analysis of Model Training Results
The training results of the M3D-Net architecture are shown in Figure 8. The loss and accuracy curves of training and validation demonstrate the dynamic process of model training. The left figure is the loss curve graph of training and validation, and the right figure is the accuracy curve graph of training and validation. From the initial Epochs 1–6, it can be seen that the model learns the data features rapidly; during the middle period from Epochs 6–16, the decline slope slows down, entering the fine-tuning stage. In the later period after Epoch 16, it stabilizes below 0.1, indicating that the model has converged.
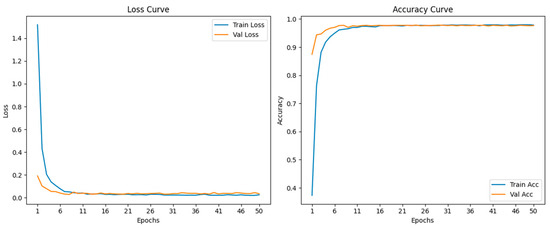
Figure 8.
Model Training Results Figure.
The confusion matrix diagram is shown in Figure 9, clearly demonstrating the performance of the six-class behavior recognition model. The model identifies “Distracted” and “Highly Centralized” relatively accurately, while there are 6 cases where “Normal level” is misjudged as “Distracted”. It is particularly noteworthy that for all categories, the values on the main diagonal, i.e., the correctly predicted values, are significantly higher than those on the non-diagonal. Among them, “RiskBehavior” and “Yawning” maintain a high accuracy rate, with only 2 and 1 minor misjudgments, respectively. The visualization of the confusion matrix intuitively shows that the sample size of “HighlyCentralized” in the dataset is the largest, while that of “Fatigue” is relatively small. Overall, it indicates that the model has reliable classification capabilities.
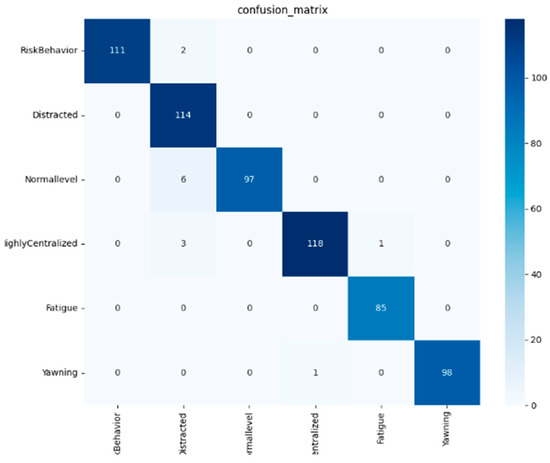
Figure 9.
Confusion Matrix Diagram.
The model training classification report in Table 4 evaluates the performance of the flight cadet simulated flight driving attention state detection model. Overall, the model performs excellently with differentiated characteristics. It is nearly perfect on key safety indicators like dangerous and fatigue flying. For distracted flying, recall rate is 100%, but precision rate is 91%, indicating a 9% false positive risk. For normal level classification, the precision rate is 100%, but the recall rate is 94%, suggesting that about 6% of normal flying may be mislabeled as abnormal. F1 values of all categories exceed 0.95, and recognition of subtle behaviors like yawning and high concentration is highly reliable.
Table 4.
Classification report of model training based on Random Sampling.
LOSO Cross-Validation
Due to significant inter-subject variability in the experiment, we employed Leave-One-Subject-Out (LOSO) to evaluate the robustness of M3D-Net. This approach, referenced from [14], follows a subject-independent testing protocol where two subjects (one male and one female) are used for training, while the remaining subject is held out for testing. Both random sampling and LOSO strategies were adopted to comprehensively assess the generalization capability and performance of the proposed method under different experimental conditions.
As shown in Table 5, the results of the LOSO cross-validation indicate that, compared to the random sampling split, the model’s performance experienced a moderate decline under more rigorous and generalization-demanding test settings. This is reflected in reduced F1-scores across all categories, particularly for critical risk-related behaviors such as “Normal Level” (where the F1-score dropped sharply from 0.97 to 0.87) and “Distracted Flying” (which decreased from 0.95 to 0.86). In these cases, the recall rate saw the most noticeable reduction. These findings suggest that the model has limited generalization capability when encountering data from new subjects not included during training, especially in consistently detecting certain specific behaviors. Nevertheless, the model maintained high performance in categories such as “Dangerous Behavior” (F1 = 0.94) and “Yawning” (F1 = 0.94), demonstrating its robustness in certain tasks.
Table 5.
Classification report of model training based on LOSO.
Ablation Experiment
This paper conducts ablation experiments by comparing different models. As shown in Table 6, multimodal training demonstrates a significant advantage over training with pure time-series images. The VGG19 model trained solely on time-series images achieves a baseline level of performance, while other multimodal approaches that combine time-series images with text show notable improvements. Our proposed M3D-Net method exhibits further enhancements across four core metrics. Multimodal models also achieve a better balance among these metrics, whereas the pure time-series image Vision Transformer(VIT) model shows clear imbalances. These results confirm that incorporating textual information effectively boosts model performance. Through an optimized multimodal fusion mechanism, our innovative approach delivers strong outcomes on key indicators. The size of our trained model is 18.6 M, with 4.65 M parameters, which is 15 million fewer parameters than the MobileNet + BiLSTM + ConvLSTM model. Experimental results have validated the model's performance and its lightweight design.
Table 6.
Model comparison analysis.
5. Conclusions
This paper introduces a flight cadet attention state detection method based on M3D-Net multimodal fusion. The M3D-Net architecture is a lightweight neural network architecture that fuses time-series image features, visual information features, and flight operation data features. It aligns image and text features through an attention mechanism to enhance the semantic association between modalities. The DSC-LSTM module is used to model time-series information, dynamically capturing the contextual dependencies in the sequence to achieve six-level attention state classification. This paper conducts ablation experiments to compare and analyze the classification effects of the model and also evaluates the effectiveness of the proposed method through model evaluation metrics.
In the field of aviation safety, accurate detection of pilots’ attention states constitutes a critical component for ensuring flight safety. Traditional single-modal detection methods struggle to effectively integrate multi-dimensional signals such as dynamic visual information, eye movement patterns, and operational behaviors within flight scenarios, often resulting in delayed or erroneous state detection. This research provides scientific monitoring tools for flight training by enabling timely alerts for attention divergence or fatigue risks, thereby reducing human operational errors and enhancing flight mission safety. In the realm of machine learning, it advances technical innovations in multimodal data fusion and dynamic model design, offering a scalable methodological framework for real-time behavioral analysis in complex environments with cross-domain applicability. The proposed M3D-Net multimodal fusion architecture achieves significant performance improvements through three key innovations:
- (1)
- Temporal-spatial joint modeling: Integrating time-series imagery with flight operation data addresses the partiality of single-modal information.
- (2)
- Attention alignment mechanism: Strengthens semantic associations between visual features and textual instructions, resolving cross-modal feature fusion challenges.
- (3)
- Lightweight DSC-LSTM module: Maintains 97.56% detection accuracy while achieving 18.6 M model size, satisfying real-time computational requirements.
6. Discussion
Compared to existing research, traditional methods often rely on single-modal data such as static facial images, which are prone to misjudgment in complex environments. While multimodal fusion approaches can improve accuracy, they typically come with high computational costs. By integrating Depth-wise Separable Convolution with LSTM structures, M3D-Net achieves efficient fusion of multimodal data and spatiotemporal feature extraction, outperforming most multimodal models in both accuracy and lightweight design. Through dynamic sequence analysis, it more accurately captures the dynamic fluctuations and shifts in attention.
However, when considering real-world aviation applications, several practical limitations require attention. False alarm factors may arise under specific flight conditions: (1) strong light stimulation at high altitudes may cause temporary pupil contractions or squinting that could be misinterpreted as attention divergence; (2) adverse weather-induced aircraft vibrations may affect the stability of image acquisition.
The current study acknowledges limitations regarding simulated environment data and insufficient adaptability to extreme scenarios. Future work will prioritize: (1) Expanding real-flight data collection to cover various illumination and weather conditions; (2) Developing adaptive filtering algorithms to distinguish between environmental interference and genuine attention shifts; (3) Introducing adversarial sample generation techniques specifically designed for aviation scenarios to enhance model robustness. These enhancements will be crucial for deploying the model in safety-critical fields such as aviation, while its application potential extends to other domains like automotive driving and medical monitoring. These efforts will further advance the practical implementation of lightweight multimodal attention detection models in real-world operational environments.
Author Contributions
G.W.: Writing—review and editing, Writing—original draft, Validation, Methodology, Investigation, Formal analysis, Data curation. C.W.: Project administration, Funding acquisition, Formal analysis. Z.C.: Writing—original draft, Validation, Software, Methodology, Formal analysis, Data curation. G.J.: Writing—original draft, Data curation, Funding acquisition. All authors have read and agreed to the published version of the manuscript.
Funding
This project was supported by the General Program of the National Natural Science Foundation of China (No. 52072293; Principal Investigator: Prof. Changyuan Wang).
Institutional Review Board Statement
The experiment described in this paper focuses on eye movement data collection and analysis. It does not involve any clinical procedures or high-risk interventions (e.g., invasive human procedures or pharmacological interventions). According to the regulations of our university and the standards of our field, such non-clinical, low-risk simulation experiments are exempt from formal ethical re-view at the college level. However, the experiment has been conducted under the supervision of the Ethics Committee of Xi’an Technological University. Both the experimental protocol and implementation strictly adhere to academic ethical standards to ensure compliance in data collection and the protection of participants’ rights.
Informed Consent Statement
Informed consent was obtained from all subjects involved in the study.
Data Availability Statement
Due to the confidential nature of the project, only part of the data can be made publicly available. However, the source code for the manuscript has been uploaded to GitHub.
Conflicts of Interest
The authors declare no conflicts of interest.
References
- Cak, S. Effects of Working Memory, Attention, and Expertise on Pilots’ Situation Awareness. Master’s Thesis, Middle East Technical University, Ankara, Turkey, 2011. [Google Scholar]
- Jones, D.G.; Endsley, M.R. Sources of situation awareness errors in aviation. Aviat. Space Environ. Med. 1996, 67, 507–512. [Google Scholar] [PubMed]
- Jia, H.B.; Wang, S.X. The influence of modern cockpit information display methods on pilots’ spatial orientation. Chin. J. Aerosp. Med. 2006, 17, 70–73. (In Chinese) [Google Scholar]
- Wickens, C.D.; McCarley, J.S.; Alexander, A.L.; Thomas, L.; Ambinder, M.; Zheng, S. Attention-Situation Awareness (A-SA) Model of Pilot Error. In Human Performance Modeling in Aviation; CRC Press: Boca Raton, FL, USA, 2008; pp. 213–239. [Google Scholar]
- Li, F.; Liu, Q.; Lu, H.; Zhu, X. Attentional Blink in Pilots and Its Relationship With Flight Performance. Front. Psychol. 2020, 11, 1696. [Google Scholar] [CrossRef] [PubMed]
- Seli, P.; Jonker, T.R.; Solman, G.J.F.; Cheyne, J.A.; Smilek, D. A methodological note on evaluating performance in a sustained-attention-to-response task. Behav. Res. Methods 2013, 45, 355–363. [Google Scholar] [CrossRef] [PubMed]
- Helton, W.S. Impulsive responding and the sustained attention to response task. J. Clin. Exp. Neuropsychol. 2009, 31, 39–47. [Google Scholar] [CrossRef] [PubMed]
- Weaver, B.; Bédard, M.; McAuliffe, J.; Parkkari, M. Using the Attention Network Test to predict driving test scores. Accid. Anal. Prev. 2009, 41, 76–83. [Google Scholar] [CrossRef] [PubMed]
- Yang, W.Y.; Zhang, W.X. Research Progress on Attention Level Evaluation Based on Electroencephalogram Signals. J. Biomed. Eng. 2023, 40, 820–828. (In Chinese) [Google Scholar]
- Cong, Y.P.; Cao, L.L.; Zhang, W.; Zhao, J. An Asynchronous Brain Control Method Combining Attention Detection and Intent Recognition. J. Yanshan Univ. 2023, 47, 121–126. (In Chinese) [Google Scholar]
- Ghaderi, M.; Khalaj, A.B.; Abdessalem, H.B.; Frasson, C. Attention Assessment of Aircraft Pilots Using Eye Tracking. In Augmented Intelligence and Intelligent Tutoring Systems; Frasson, C., Mylonas, P., Troussas, C., Eds.; Springer Nature: Cham, Cham, 2023; Volume 13891, pp. 209–219. [Google Scholar]
- Eivazi, S.; Bednarik, R. Predicting Problem-Solving Behavior and Performance Levels from Visual Attention Data. In Proceedings of the Workshop on Eye Gaze in Intelligent Human Machine Interaction at IUI, Palo Alto, CA, USA, 13 February 2011; pp. 9–16. [Google Scholar]
- Wu, R.Y.; Wang, D.X.; Yuan, H.C.; Gong, P.; Qing, E.Q. Attention State Detection Based on Feature Encoding and Convolutional Neural Network. Chin. J. Biomed. Eng. 2020, 39, 759–763. (In Chinese) [Google Scholar]
- Zhang, Y.; Chen, Y.; Gao, C. Deep unsupervised multi-modal fusion network for detecting driver distraction. Neurocomputing 2021, 421, 26–38. [Google Scholar] [CrossRef]
- Du, Y.; Raman, C.; Black, A.W.; Morency, L.-P.; Eskenazi, M. Multimodal Polynomial Fusion for Detecting Driver Distraction. In Proceedings of the Interspeech, Hyderabad, India, 2–6 September 2018; pp. 611–615. [Google Scholar]
- Baheti, B.; Gajre, S.; Talbar, S. Detection of Distracted Driver Using Convolutional Neural Network. In Proceedings of the IEEE Conference on Computer Vision and Pattern Recognition Workshops, Salt Lake City, UT, USA, 18–22 June 2018; pp. 1032–1038. [Google Scholar]
- Privitera, C.M.; Renninger, L.W.; Carney, T.; Klein, S.; Aguilar, M. Pupil dilation during visual target detection. J. Vis. 2010, 10, 3. [Google Scholar] [CrossRef] [PubMed]
- Wickens, C.D.; Gutzwiller, R.S.; McCarley, J.S. Applied Attention Theory, 2nd ed.; CRC Press: Boca Raton, FL, USA, 2022. [Google Scholar]
- Ghaderi, M. Analysis and evaluation of the Pilot Attentional Model. Master’s Thesis, Université de Montréal, Montreal, QC, Canada, 2024. [Google Scholar]
- Zhang, Y.F.; Wang, Y.C.; Zhang, Q.Y.; Ge, X.L.; Xu, J. Feasibility Study on Pilot Attention State Recognition Based on Eye Movement Indicators. Aeronaut. Sci. Technol. 2022, 33, 39–46. (In Chinese) [Google Scholar]
- Yang, B.; Li, H. A Visual Attention Model Based on Eye Tracking in 3D Scene Maps. ISPRS Int. J. Geo-Inf. 2021, 10, 664. [Google Scholar] [CrossRef]
- Cannavò, R.; Conti, D.; Di Nuovo, A. Computer-aided assessment of aviation pilots attention: Design of an integrated test and its empirical validation. Appl. Comput. Inform. 2016, 12, 16–26. [Google Scholar] [CrossRef]
- Xiong, B.H.; Zhou, H.P.; Huang, J.Z.; Ruan, Y.Q.; Zhou, L.C. An Attention Detection Method Integrating Gaze Detection. Softw. Guide 2018, 17, 31–36. (In Chinese) [Google Scholar]
- Howard, A.; Sandler, M.; Chu, G.; Chen, L.-C.; Chen, B.; Tan, M.; Wang, W.; Zhu, Y.; Pang, R.; Vasudevan, V.; et al. Hartwig Adam Searching for MobileNetV3. In Proceedings of the 2019 IEEE/CVF International Conference on Computer Vision (ICCV), Seoul, Republic of Korea, 27–28 October 2019; pp. 1314–1324. [Google Scholar]
- Huang, Z.; Xu, W.; Yu, K. Bidirectional LSTM-CRF Models for Sequence Tagging. arXiv 2015, arXiv:1508.01991. [Google Scholar] [CrossRef]
- Shi, X.; Chen, Z.; Wang, H.; Yeung, D.-Y.; Wong, W.-K.; Woo, W.-C. Convolutional LSTM Network: A Machine Learning Approach for Precipitation Nowcasting. Adv. Neural Inf. Process. Syst. 2015, 28, 802–810. [Google Scholar]
Disclaimer/Publisher’s Note: The statements, opinions and data contained in all publications are solely those of the individual author(s) and contributor(s) and not of MDPI and/or the editor(s). MDPI and/or the editor(s) disclaim responsibility for any injury to people or property resulting from any ideas, methods, instructions or products referred to in the content. |
© 2025 by the authors. Licensee MDPI, Basel, Switzerland. This article is an open access article distributed under the terms and conditions of the Creative Commons Attribution (CC BY) license (https://creativecommons.org/licenses/by/4.0/).