
Exploring Learning Curves in Acupuncture Education Using Vision-Based Needle Tracking

 , , , and
Abstract
:1. Introduction and Background
2. The Vision-Based Needle Tracking System
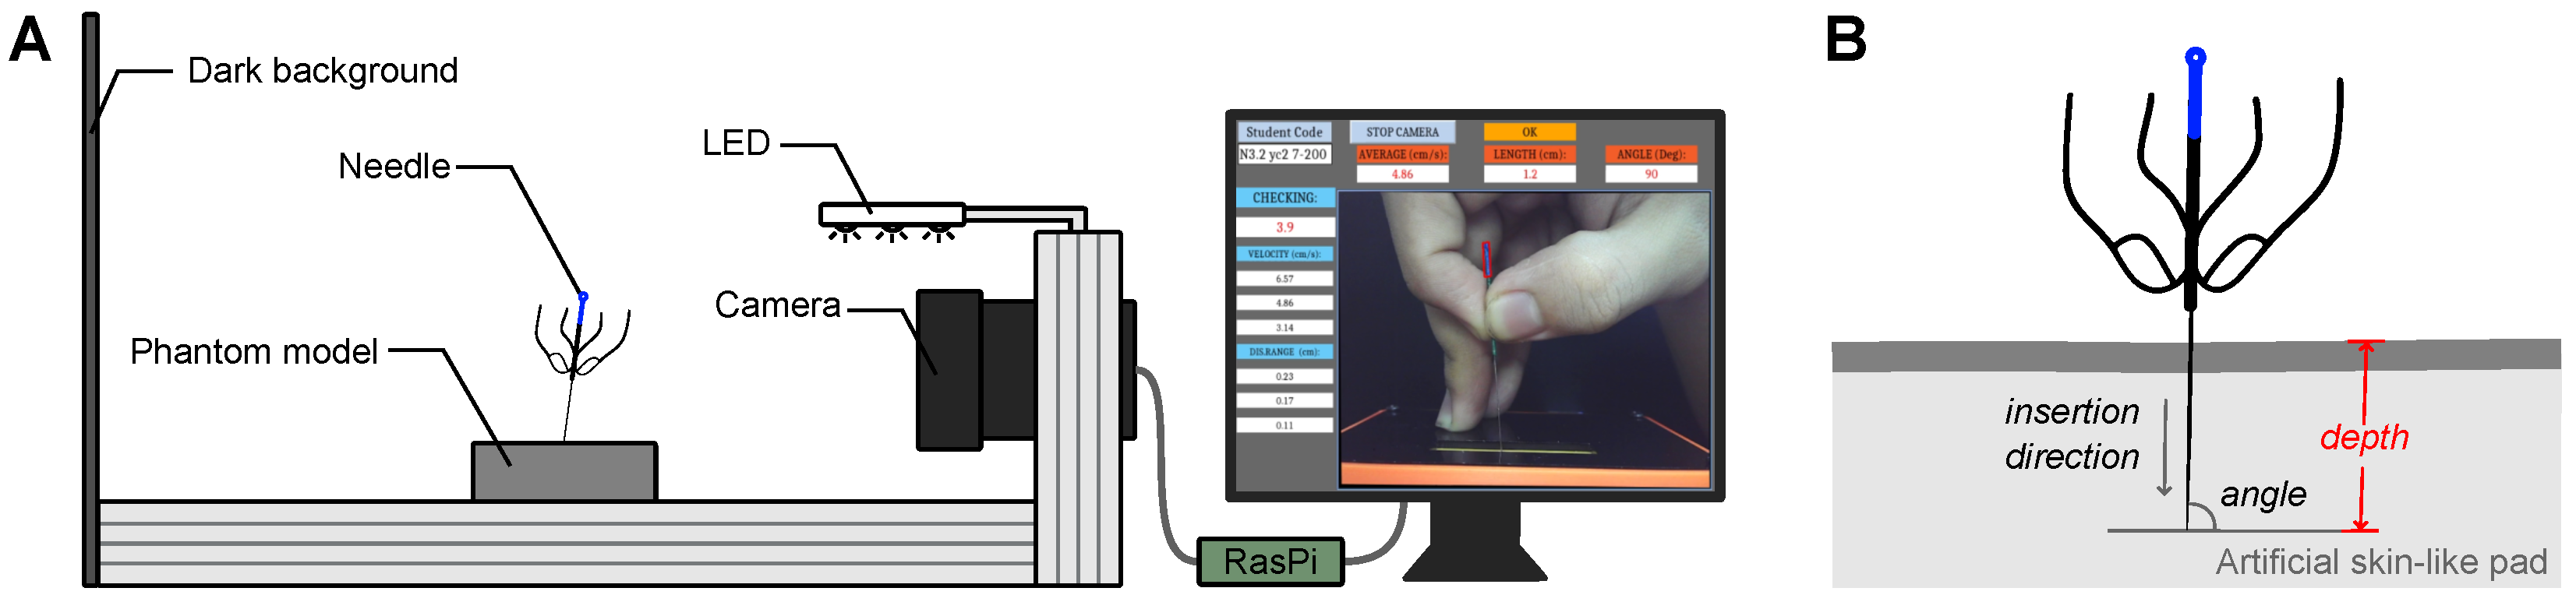
2.1. Hardware
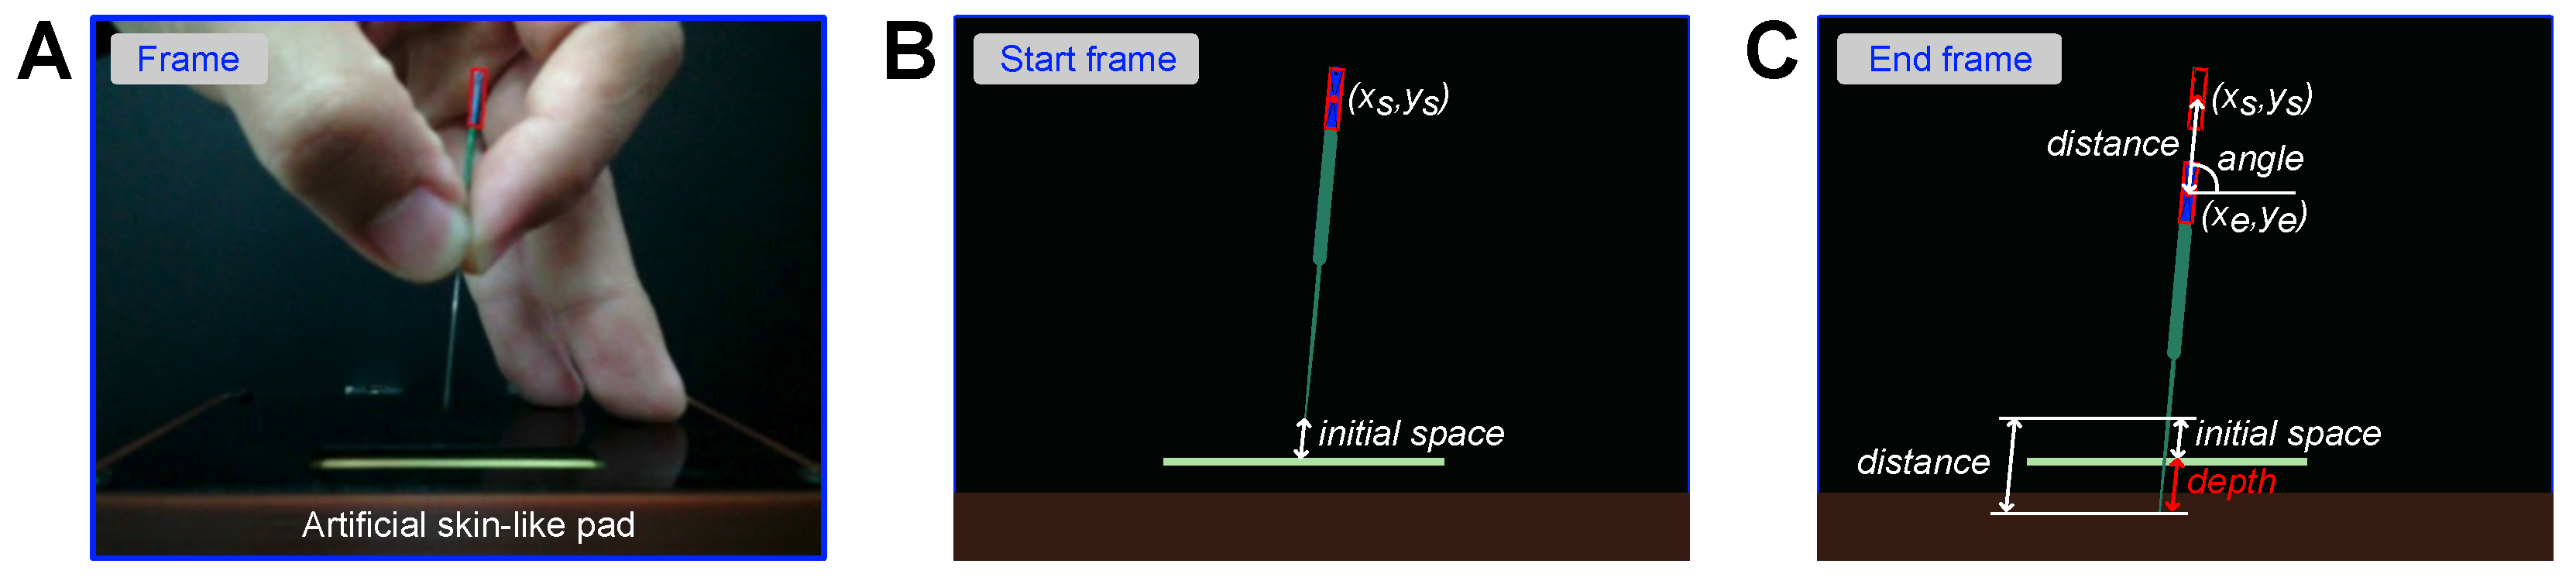
2.2. Software
3. Method
3.1. Acupuncture Training Lesson
3.2. Participants
3.3. Measurement
3.4. Data Analysis
4. Results
4.1. Statistical Analysis
4.2. Visual Analysis
4.2.1. Group-Level Learning Curve with All Individuals
4.2.2. Individual-Level Learning Curves
4.2.3. Group-Level Learning Curve for Individuals with Typical Learning Curves
5. Discussion
5.1. Vision-Based Needle Tracking
5.2. Statistical vs. Visual Analysis
5.3. Individual Differences and Personalized Training
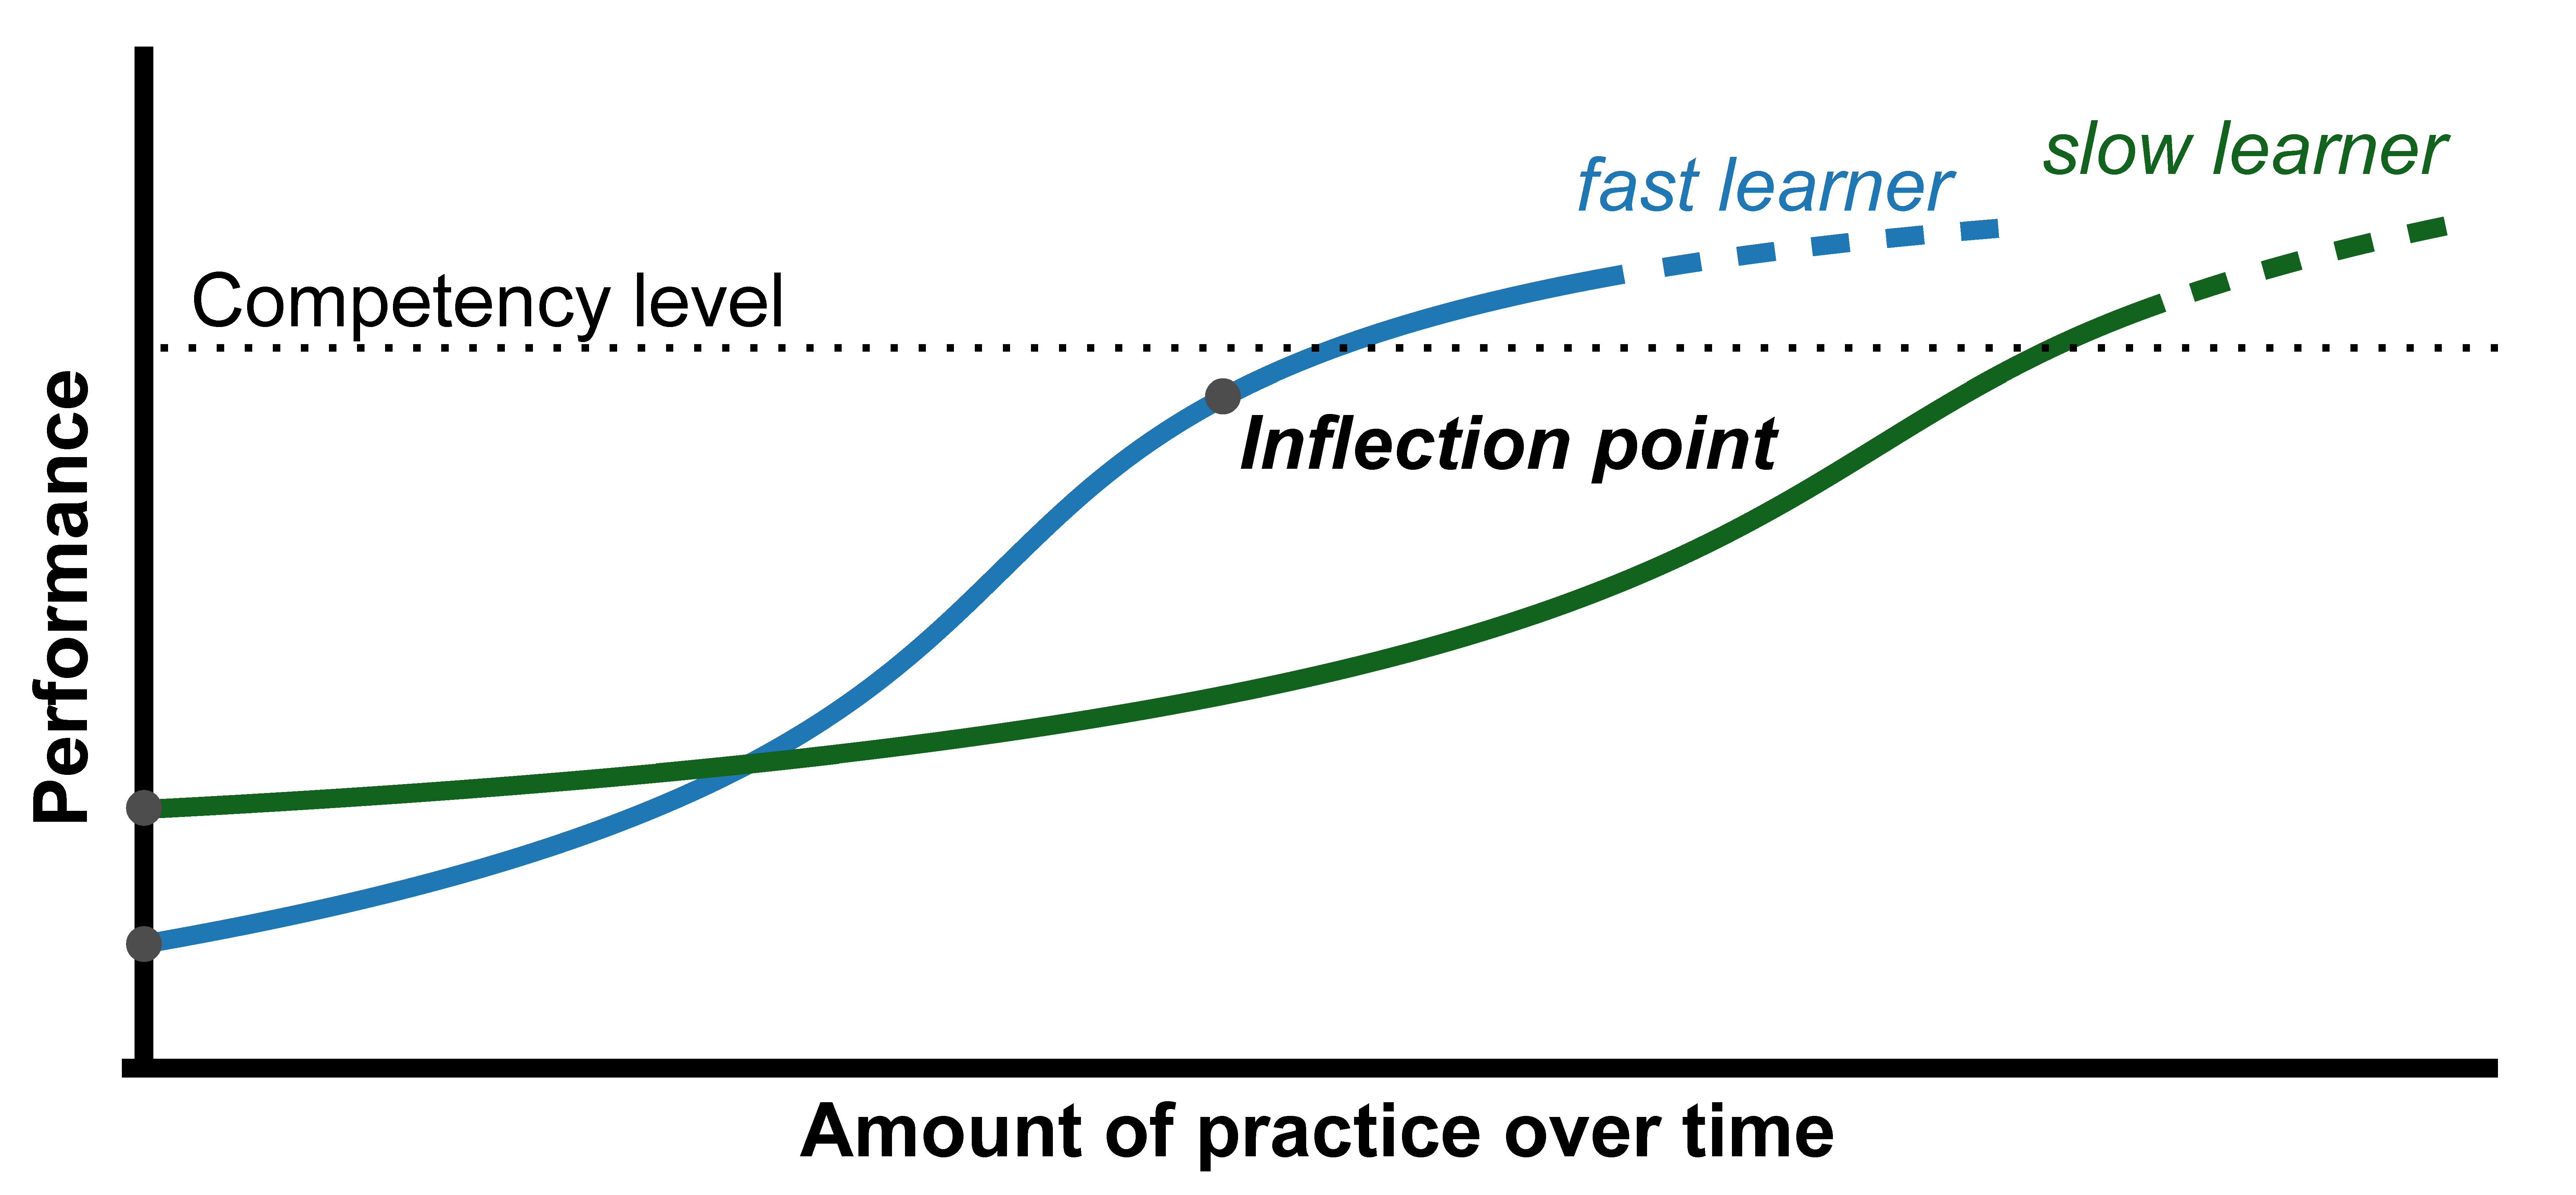
5.4. Beyond the Thurstone Learning Curve
5.5. Limitations
6. Conclusions
Author Contributions
Funding
Institutional Review Board Statement
Informed Consent Statement
Data Availability Statement
Acknowledgments
Conflicts of Interest
References
- Liu, T. Acupuncture: What underlies needle administration? Evid.-Based Complement. Altern. Med. 2009, 6, 185–193. [Google Scholar] [CrossRef] [PubMed]
- Nasir, L.S. Acupuncture. Prim. Care Clin. Off. Pract. 2002, 29, 393–405. [Google Scholar] [CrossRef]
- Ernst, E. Acupuncture—A critical analysis. J. Intern. Med. 2006, 259, 125–137. [Google Scholar] [CrossRef]
- Ma, Y.; Dong, M.; Zhou, K.; Mita, C.; Liu, J.; Wayne, P.M. Publication trends in acupuncture research: A 20-year bibliometric analysis based on PubMed. PLoS ONE 2016, 11, e0168123. [Google Scholar] [CrossRef] [Green Version]
- Chau, N.V.; Hu, D. The effects of traditional Chinese medicine on Vietnamese traditional medicine–Talking about Vietnamese traditional medicinal experts, their books and the current situation. Chin. Med. Cult. 2013, 8, 53–56. [Google Scholar]
- Chavez, L.M.; Huang, S.S.; MacDonald, I.; Lin, J.G.; Lee, Y.C.; Chen, Y.H. Mechanisms of acupuncture therapy in ischemic stroke rehabilitation: A literature review of basic studies. Int. J. Mol. Sci. 2017, 18, 2270. [Google Scholar] [CrossRef] [Green Version]
- Jung, W.M.; Lim, J.; Lee, I.S.; Park, H.J.; Wallraven, C.; Chae, Y. Sensorimotor learning of acupuncture needle manipulation using visual feedback. PLoS ONE 2015, 10, e0139340. [Google Scholar] [CrossRef]
- Li, J.; Grierson, L.E.; Wu, M.X.; Breuer, R.; Carnahan, H. Perceptual motor features of expert acupuncture lifting-thrusting skills. Acupunct. Med. 2013, 31, 172–177. [Google Scholar] [CrossRef]
- Li, N.; Wang, C.; Lv, J. Analysis of factors in refusal to use acupuncture in patients with lumbar disc herniation: A case study of patients in the rehabilitation and acupuncture center of Huaxi Hospital. In Chinese Acupuncture & Moxibustion; Foreign Languages Press: Beijing, China, 2009; pp. 65–67. [Google Scholar]
- Shin, S.G.; Im, I.C. Satisfaction level of clinical practice and related variables for students in the department of radiology. J. Korea Contents Assoc. 2010, 10, 276–284. [Google Scholar] [CrossRef]
- Jang, J.E.; Lee, Y.S.; Jang, W.S.; Sung, W.S.; Kim, E.J.; Lee, S.D.; Kim, K.H.; Jung, C.Y. Trends in Acupuncture Training Research: Focus on Practical Phantom Models. J. Acupunct. Res. 2022, 39, 77–88. [Google Scholar] [CrossRef]
- Lee, I.S.; Lee, Y.S.; Park, H.J.; Lee, H.; Chae, Y. Evaluation of phantom-based education system for acupuncture manipulation. PLoS ONE 2015, 10, e0117992. [Google Scholar] [CrossRef] [PubMed]
- Han, Y.J.; Yi, S.Y.; Lee, Y.J.; Kim, K.H.; Kim, E.J.; Lee, S.D. Quantification of the parameters of twisting–rotating acupuncture manipulation using a needle force measurement system. Integr. Med. Res. 2015, 4, 57–65. [Google Scholar] [CrossRef] [PubMed] [Green Version]
- Lyu, R.; Gao, M.; Yang, H.; Wen, Z.; Tang, W. Stimulation parameters of manual acupuncture and their measurement. Evid.-Based Complement. Altern. Med. 2019, 2019, 1725936. [Google Scholar] [CrossRef] [PubMed] [Green Version]
- Luu, T.; Cao, H.; Pham, D.; Tran, L.; Verstraten, T. Development and validation of a vision-based needling training system for acupuncture on phantom model. J. Acupunct. Res. 2023, 40, 44–52. [Google Scholar] [CrossRef]
- Pusic, M.V.; Boutis, K.; Hatala, R.; Cook, D.A. Learning curves in health professions education. Acad. Med. 2015, 90, 1034–1042. [Google Scholar] [CrossRef] [Green Version]
- Thurstone, L.L. The learning curve equation. Psychol. Monogr. 1919, 26, i-51. [Google Scholar] [CrossRef] [Green Version]
- Davis, R.; Churchill, D.; Badger, G.; Dunn, J.; Langevin, H. A new method for quantifying the needling component of acupuncture treatments. BMC Complement. Altern. Med. 2012, 12, P142. [Google Scholar] [CrossRef] [Green Version]
- Lim, J.W.; Jung, W.M.; Lee, I.S.; Seo, Y.J.; Ryu, H.S.; Ryu, Y.H.; Chae, Y.B. Development of acupuncture manipulation education system. J. Acupunct. Res. 2014, 31, 11–19. [Google Scholar] [CrossRef] [Green Version]
- Tang, W.C.; Yang, H.Y.; Liu, T.Y.; Gao, M.; Xu, G. Motion Video-Based Quantitative Analysis of the ‘lifting-Thrusting—Method: A Comparison between Teachers and Students of Acupuncture. Acupunct. Med. 2018, 36, 21–28. [Google Scholar] [CrossRef] [Green Version]
- Xu, L.L.; Wang, F.; Yang, H.Y.; Tang, W.C. Three-dimensional Finger Motion Tracking during Needling: A Solution for the Kinematic Analysis of Acupuncture Manipulation. J. Vis. Exp. Jove 2021, 176, e62750. [Google Scholar]
- Xu, L.L.; Xie, J.; Yang, H.Y.; Wang, F.; Tang, W.C. Operation Stability Analysis of Basic Acupuncture Manipulation Based on Three-Dimensional Motion Tracking Data. Wirel. Commun. Mob. Comput. 2022, 2022, 1958984. [Google Scholar] [CrossRef]
- Zhang, A.; Yan, X.K.; Liu, A.G. An Introduction to A Newly-developed “Acupuncture Needle Manipulation Training-evaluation System” Based on Optical Motion Capture Technique. Zhen Ci Yan Jiu = Acupunct. Res. 2016, 41, 556–559. [Google Scholar]
- Leow, M.Q.H.; Cao, T.; Lee, S.H.E.; Cui, S.L.; Tay, S.C.; Ooi, C.C. Ultrasonography in acupuncture: Potential uses for education and research. Acupunct. Med. 2016, 34, 320–322. [Google Scholar] [CrossRef] [PubMed]
- Langevin, H.M.; Konofagou, E.E.; Badger, G.J.; Churchill, D.L.; Fox, J.R.; Ophir, J.; Garra, B.S. Tissue displacements during acupuncture using ultrasound elastography techniques. Ultrasound Med. Biol. 2004, 30, 1173–1183. [Google Scholar] [CrossRef]
- Konofagou, E.E.; Langevin, H.M. Using ultrasound to understand acupuncture. IEEE Eng. Med. Biol. Mag. 2005, 24, 41–46. [Google Scholar] [CrossRef]
- Chen, Y.L.; Hou, M.C.; Chang, S.C.; Chuang, K.W.; Lee, P.Y.; Huang, C.C. Development and Evaluation of Inexpensive Ultrasound Using A-Mode and M-Mode Signals to Identify Lung Depth and Avoid Risk of Pneumothorax in Acupuncture. J. Med. Biol. Eng. 2021, 41, 251–259. [Google Scholar] [CrossRef]
- Bradski, G.; Kaehler, A. Learning OpenCV: Computer Vision with the OpenCV Library; O’Reilly Media, Inc.: Sebastopol, CA, USA, 2008. [Google Scholar]
- Chou, P.C.; Chu, H.Y.; Lin, J.G. Safe needling depth of acupuncture points. J. Altern. Complement. Med. 2011, 17, 199–206. [Google Scholar] [CrossRef]
- Lou, X.; Yang, X.; Jiang, S.; Sun, C.; Zhang, R. Study on angle and depth of needle insertion in acupuncture at Zusanli (ST 36). Zhongguo Zhen Jiu = Chinese Acupuncture & Moxibustion 2006, 26, 483–486. [Google Scholar]
- Itoh, K.; Minakawa, Y.; Kitakoji, H. Effect of acupuncture depth on muscle pain. Chin. Med. 2011, 6, 24. [Google Scholar] [CrossRef] [Green Version]
- Krishnamurthy, K.; Selvaraj, N.; Gupta, P.; Cyriac, B.; Dhurairaj, P.; Abdullah, A.; Krishnapillai, A.; Lugova, H.; Haque, M.; Xie, S.; et al. Benefits of gamification in medical education. Clin. Anat. 2022, 35, 795–807. [Google Scholar] [CrossRef]
- Falah, J.; Wedyan, M.; Alfalah, S.F.; Abu-Tarboush, M.; Al-Jakheem, A.; Al-Faraneh, M.; Abuhammad, A.; Charissis, V. Identifying the characteristics of virtual reality gamification for complex educational topics. Multimodal Technol. Interact. 2021, 5, 53. [Google Scholar] [CrossRef]
- Valamis. Learning Curve: Theory, Meaning, Formula, Graphs [2023]. Available online: https://www.valamis.com/hub/learning-curve (accessed on 14 June 2023).


| Components | Model/Manufacturer | Description |
|---|---|---|
| Artificial skin-like pad | Henan Green Medical Tech | Silicon-based |
| Needle | Suzhou Tianxie Acupuncture | Filiform, 50 mm length, handle 1 mm, body 0.3 mm |
| Camera | TD-WC3200 | 1920 × 1080 |
| Computer | Raspberry Pi 4 | Ubuntu 20.4, OpenCV |
| Dark background | Chochen | 3 mm thickness |
| Light | Xiaomi | 1.2 W |
| Data | First 30 Trials | Last 30 Trials | W | p | CL Effect Size | ||||
|---|---|---|---|---|---|---|---|---|---|
| Mdn | M | SD | Mdn | M | SD | ||||
| Group | 0.25 | 0.26 | 0.07 | 0.16 | 0.15 | 0.04 | 10.50 | *** | 0.91 |
| P1 | 0.20 | 0.25 | 0.21 | 0.20 | 0.18 | 0.13 | 158.50 | n.s | 0.60 |
| P2 | 0.30 | 0.34 | 0.25 | 0.20 | 0.22 | 0.18 | 104.00 | * | 0.65 |
| P3 | 0.20 | 0.28 | 0.20 | 0.10 | 0.15 | 0.13 | 114.00 | * | 0.70 |
| P4 | 0.35 | 0.39 | 0.29 | 0.20 | 0.22 | 0.18 | 75.50 | ** | 0.67 |
| P5 | 0.20 | 0.25 | 0.23 | 0.10 | 0.16 | 0.15 | 93.50 | * | 0.67 |
| P6 | 0.10 | 0.19 | 0.24 | 0.10 | 0.10 | 0.11 | 99.00 | n.s | 0.59 |
| P7 | 0.10 | 0.16 | 0.15 | 0.10 | 0.11 | 0.10 | 101.00 | n.s | 0.58 |
| P8 | 0.10 | 0.16 | 0.15 | 0.20 | 0.17 | 0.11 | 185.00 | n.s | 0.46 |
| P9 | 0.10 | 0.21 | 0.20 | 0.10 | 0.08 | 0.08 | 67.00 | ** | 0.72 |
| P10 | 0.20 | 0.32 | 0.31 | 0.10 | 0.16 | 0.17 | 114.00 | * | 0.65 |
Disclaimer/Publisher’s Note: The statements, opinions and data contained in all publications are solely those of the individual author(s) and contributor(s) and not of MDPI and/or the editor(s). MDPI and/or the editor(s) disclaim responsibility for any injury to people or property resulting from any ideas, methods, instructions or products referred to in the content. |
© 2023 by the authors. Licensee MDPI, Basel, Switzerland. This article is an open access article distributed under the terms and conditions of the Creative Commons Attribution (CC BY) license (https://creativecommons.org/licenses/by/4.0/).
Share and Cite
Pham, D.D.; Luu, T.H.; Tran, L.T.C.; Nguyen Thi, H.T.; Cao, H.-L. Exploring Learning Curves in Acupuncture Education Using Vision-Based Needle Tracking. Multimodal Technol. Interact. 2023, 7, 69. https://doi.org/10.3390/mti7070069
Pham DD, Luu TH, Tran LTC, Nguyen Thi HT, Cao H-L. Exploring Learning Curves in Acupuncture Education Using Vision-Based Needle Tracking. Multimodal Technologies and Interaction. 2023; 7(7):69. https://doi.org/10.3390/mti7070069
Chicago/Turabian StylePham, Duy Duc, Trong Hieu Luu, Le Trung Chanh Tran, Hoai Trang Nguyen Thi, and Hoang-Long Cao. 2023. "Exploring Learning Curves in Acupuncture Education Using Vision-Based Needle Tracking" Multimodal Technologies and Interaction 7, no. 7: 69. https://doi.org/10.3390/mti7070069
APA StylePham, D. D., Luu, T. H., Tran, L. T. C., Nguyen Thi, H. T., & Cao, H.-L. (2023). Exploring Learning Curves in Acupuncture Education Using Vision-Based Needle Tracking. Multimodal Technologies and Interaction, 7(7), 69. https://doi.org/10.3390/mti7070069