1. Introduction
Several CAD and computer graphics applications rely on CSG for vector drawing (e.g., Adobe Illustrator Pathfinder tool), conceptual design [
1], sculpting [
2], solid modeling [
3] and machining [
4]. CSG greatly simplifies solid creation as Boolean functions simplify many complex operations, such as constructing profiles, cut outs, adding constructive elements or placing, moving and resizing holes in objects [
5,
6]. CAD widgets with negative features and usability issues have a substantial impact on the design experience of the designer [
6,
7]. Previous work reported that users had difficulty remembering menu items and necessary design conditions [
7]. Moreover, badly designed CAD widgets (i.e., widgets with many input parameters, restrictions and requirements) may constrain the user’s creativity, lead to low performance and excessive expenditure of cognitive resources as the user becomes more focused on operating the CAD package instead of dealing with the task at hand [
7]. Conventional CSG widgets with text buttons or icons require a button per CSG operation. This forces users to fiddle with several buttons and learn different button arrangements that vary among solid modeling tools [
5]. Solid modeling systems have become overly complex as their interfaces comprise many widgets and menu components, leading to high cognitive loads for the user [
7,
8]. Current CSG widgets focus mostly on adding functionality to their tool sets, rather than making those tools more usable [
9,
10,
11]. In fact, studies on CSG widgets are scarce [
12] and do not focus on redesigning widgets for CSG operation selection. In more recent years, several studies have explored the benefits and limitations of virtual reality for CSG modeling, but even in this scenario, the CSG operation widgets are mere translations of their desktop counterparts [
13,
14,
15]. Therefore, we question whether CSG widgets can be redesigned to reduce the effort of selecting the correct Boolean sequence of operations and provide better usability performance.
In this work, we present VennPad, an all-in-one widget that supports seven major CSG operations in a set of four toggle buttons that express the spatial relations between objects. Graphically, VennPad is represented as a two-set-diagram-shaped interface to visually select Boolean operations for CSG modeling, which compiles the maximum number of operations into a minimal set of buttons. A user study with a group of engineering students and professionals was conducted to evaluate whether the proposed widget supports a more natural selection of the operations.
2. Materials and Methods
Following human–computer interaction principles and practices [
16] and previous work on graphical user interfaces [
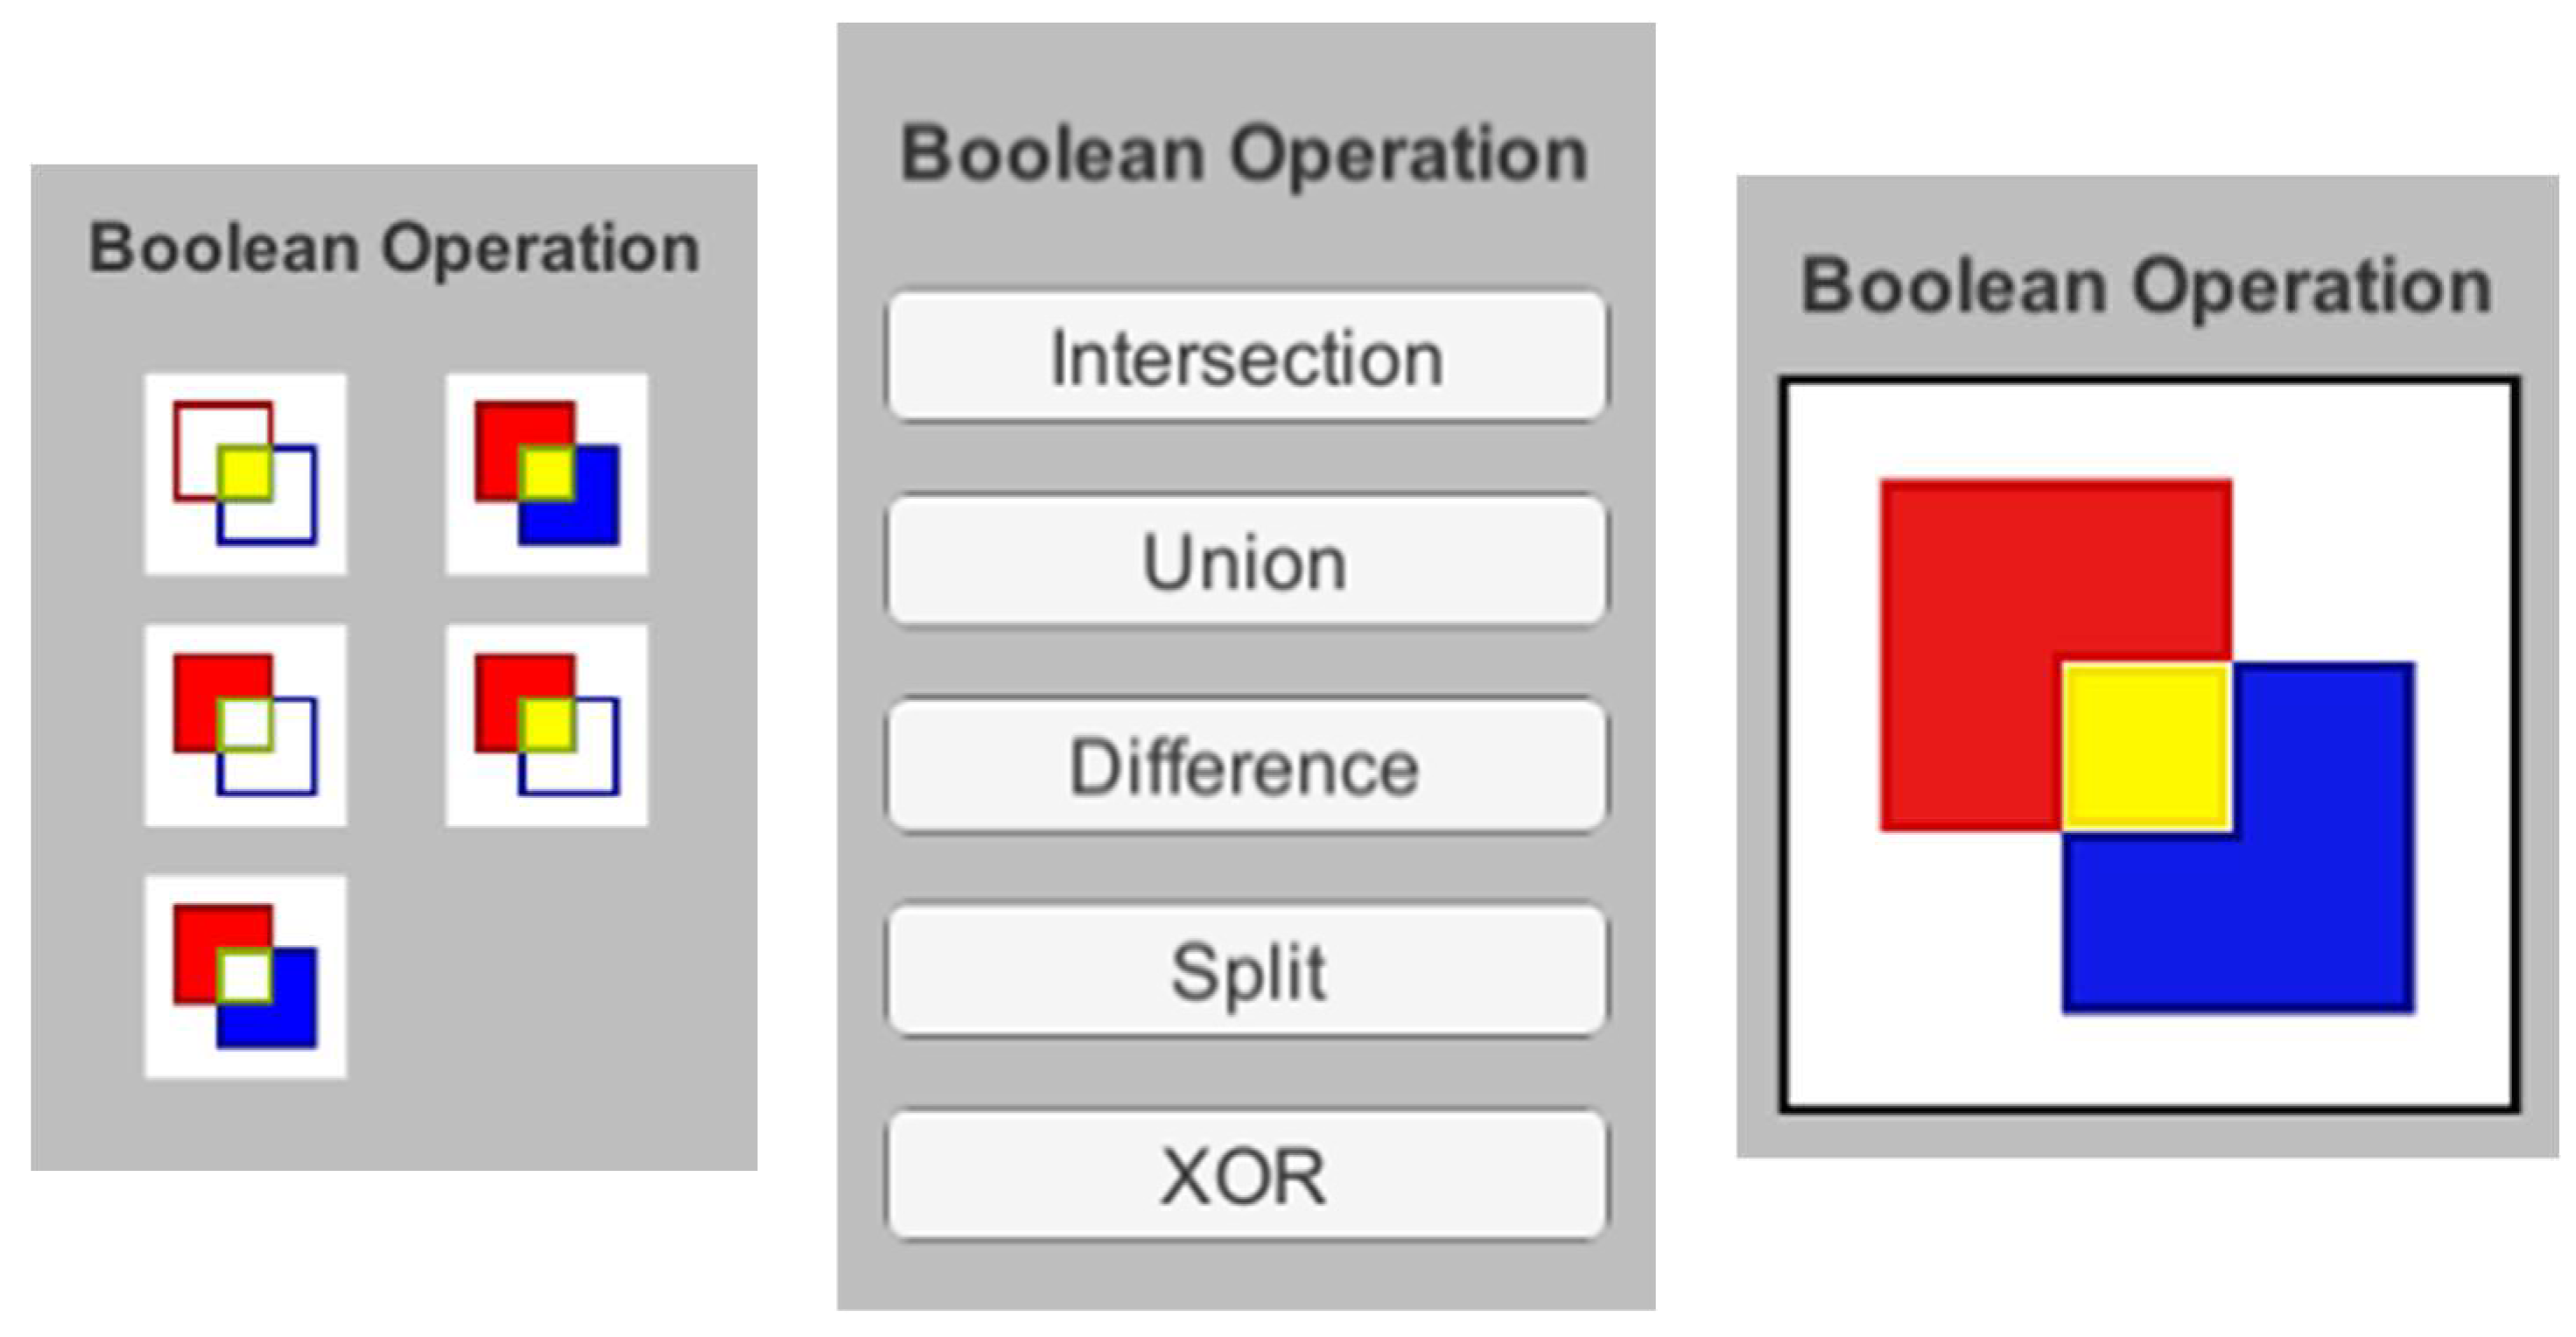
17], we conducted a usability study to compare three types of CSG widget designs: (i) list of buttons with illustrative icons; (ii) list of buttons with text labels; and (iii) a set of 4 colored buttons arranged in a 2-set-diagram-shaped interface, which we named VennPad (
Figure 1). Each widget supported 7 CSG operations: intersection, union, difference A minus B, difference B minus A, symmetric difference (i.e., XOR), split A with B and split B with A, where A and B are two sets (
Table 1). Note that, by usability we consider the effectiveness (if the user is capable of selecting the right Boolean operation), efficiency (how fast the user selects the right Boolean operation) as well as the overall user satisfaction and preferences regarding the interfaces.
A desktop application was developed to display a 3D scene with two selectable meshes along with the widgets. Performance metrics were recorded and qualitative feedback was acquired through questionnaires and interviews.
2.1. Graphical User Interface and Interaction
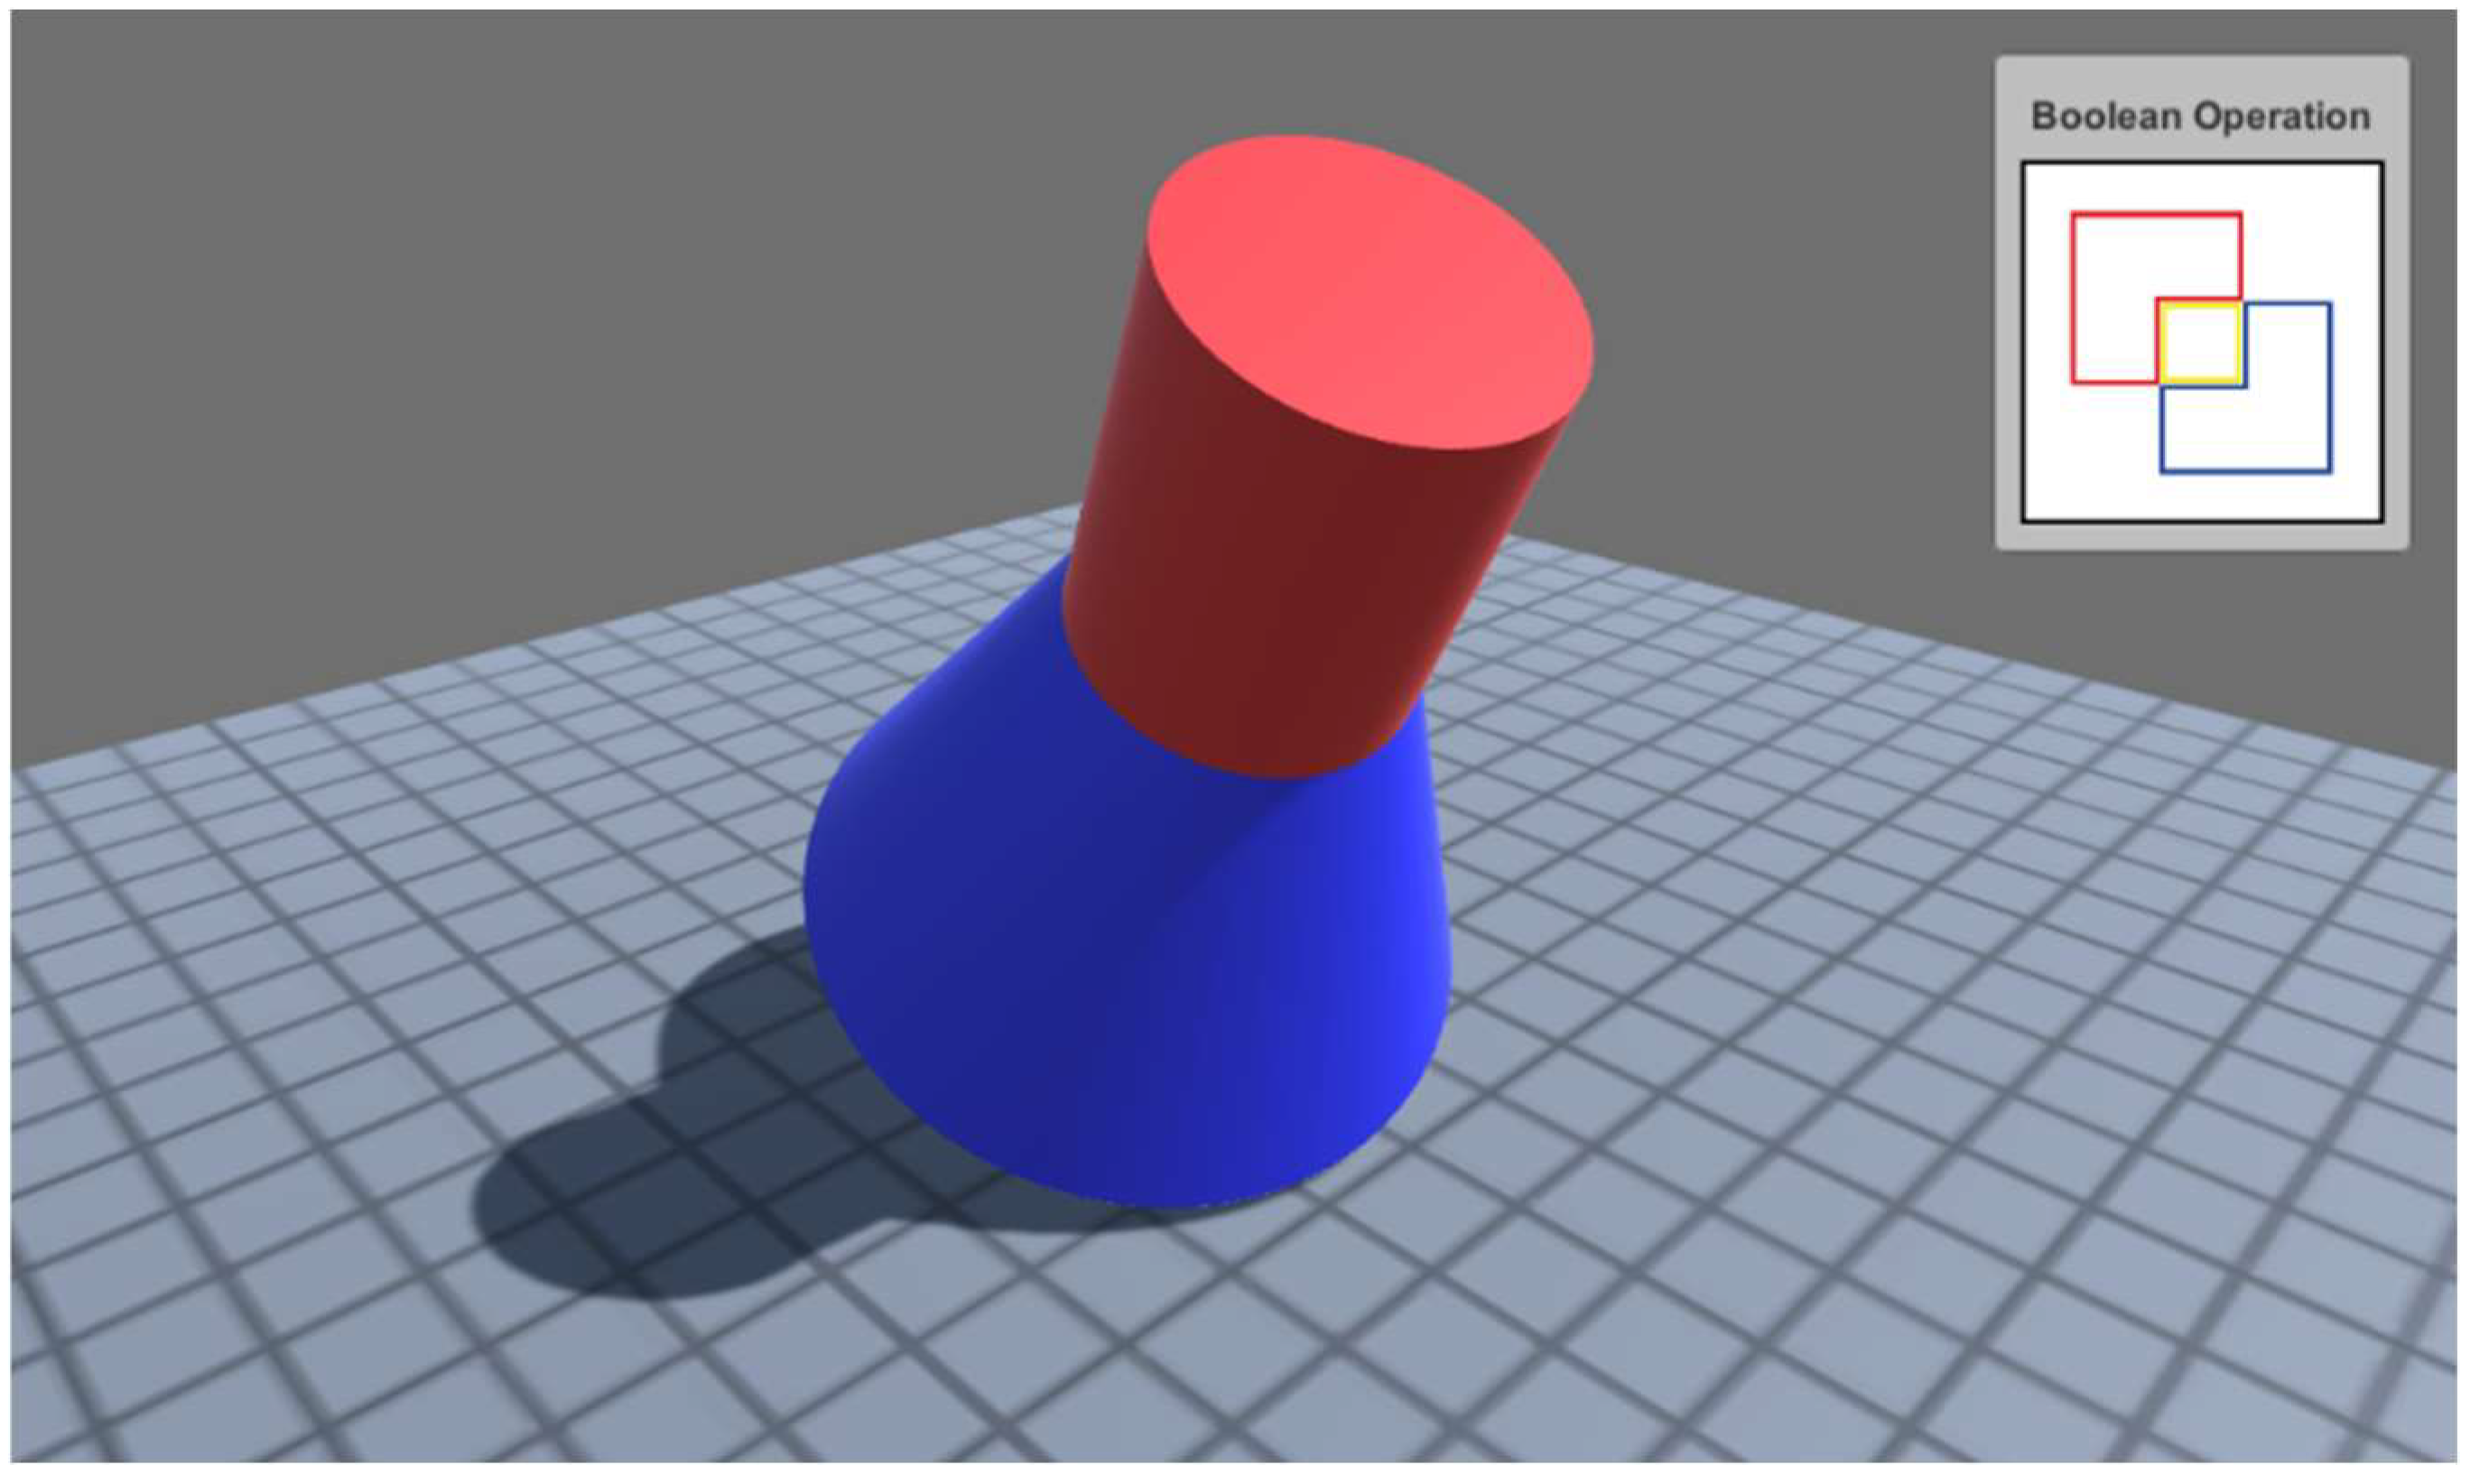
The desktop graphical user interface (GUI) consists of a 3D scene on a reference grid, colored shape primitives and a CSG widget at the top-right corner (
Figure 2). The 3D meshes used were predefined, as well as their possible outputs, and consequently no real CSG processing was required. The application was developed in Unity3D (version 2018.4.20) and coded in C#.
To interact with the GUI, the user can select shape primitives by hovering the mouse over the desired shape and single clicking. Non-selected objects are rendered in grey. As the user moves the mouse cursor over the objects, their color changes to white while the cursor remains on them. When the first object is selected with a mouse click, its color changes to red and the second selected object is shown in blue. The resulting CSG object can then be defined by using the widget to apply the required Boolean operation. After applying the Boolean operation, the resulting shape is shown in yellow, at which point the user is expected to press Enter to end the task. Each widget button is an on/off toggle that is colored for visual feedback, except in the case of the List of Operations widget. Three keyboard commands were also introduced: after being selected, the objects can be deselected by pressing the ‘Esc’ key; to undo an unwanted selection or operation the user can press ‘Ctrl + z’; and pressing ‘Enter’ ends the task and stops the timer. Immediate visual feedback is given to the user by displaying the resulting shapes. By default, all buttons are initialized inactive.
2.2. Conventional CSG List and Icons Widgets
For comparison with the proposed new widget, two conventional-like CSG widgets were also implemented for this study: List of Operations and Icons of Operations (
Figure 1). Both widgets contain 5 buttons and allow users to perform seven CSG operations (
Table 1) as difference and split are object selection order dependent.
2.3. VennPad
Inspired by Venn diagrams [
18] that depict abstract sets as overlapping convex figures, we propose a more suitable graphical representation for 3D modeling Boolean operations using a 2-set diagram. Due to its compact nature, the 2-set diagram can depict seven Boolean operations on a single graphical element with four buttons instead of one button per operation, allowing the user to explicitly select the subsets that build the desired Boolean operation. Three buttons represent each subset (A\B, A ∩ B, B\A) that are filled with a color when selected and are color outlined when deselected. A fourth button was included as a shortcut to evoke the union toggle: if the user clicks the area surrounding the three buttons, the union operation is toggled.
2.4. User Study Procedure and Tasks
To assess whether VennPad can be employed as a generic interface to efficiently apply Boolean operations to 3D CSG models, different pairs of solid shapes were constructed. The five basic operations are intersection, union, difference, split and XOR. Difference and split are not commutative and consequently the participant was required to select the objects in the correct order to obtain the desired result. To assess how easy it is to perceive the selection order with the different widgets, two separate models were defined for each noncommutative operation (difference and split). In one of the models, the participant was informed beforehand of the correct selection order required to obtain the desired result and with the other model this information was not provided, resulting in a total of seven different models. Each participant was requested to perform the operations on each model with all three interfaces. To initiate each task, the users had to click on a ‘Start’ button placed at the center of the screen, which started the timer. The task was completed when the user pressed Enter on the keyboard, after which a splash screen appeared and the timer was automatically stopped. All significant actions taken by the participant such as selection of objects and pressing the widget buttons were automatically time tagged and saved to a log file. Task completion times and participant preferences (or perceived satisfaction) were measured to validate the initial concept.
The tests were conducted with a single participant per session. For the first 6 participants, the tests were carried out in person, one at a time sitting in front of a laptop computer. Due to government-imposed circulation restrictions, the tests with the remaining 9 participants were carried out online via Zoom, with a good internet connection.
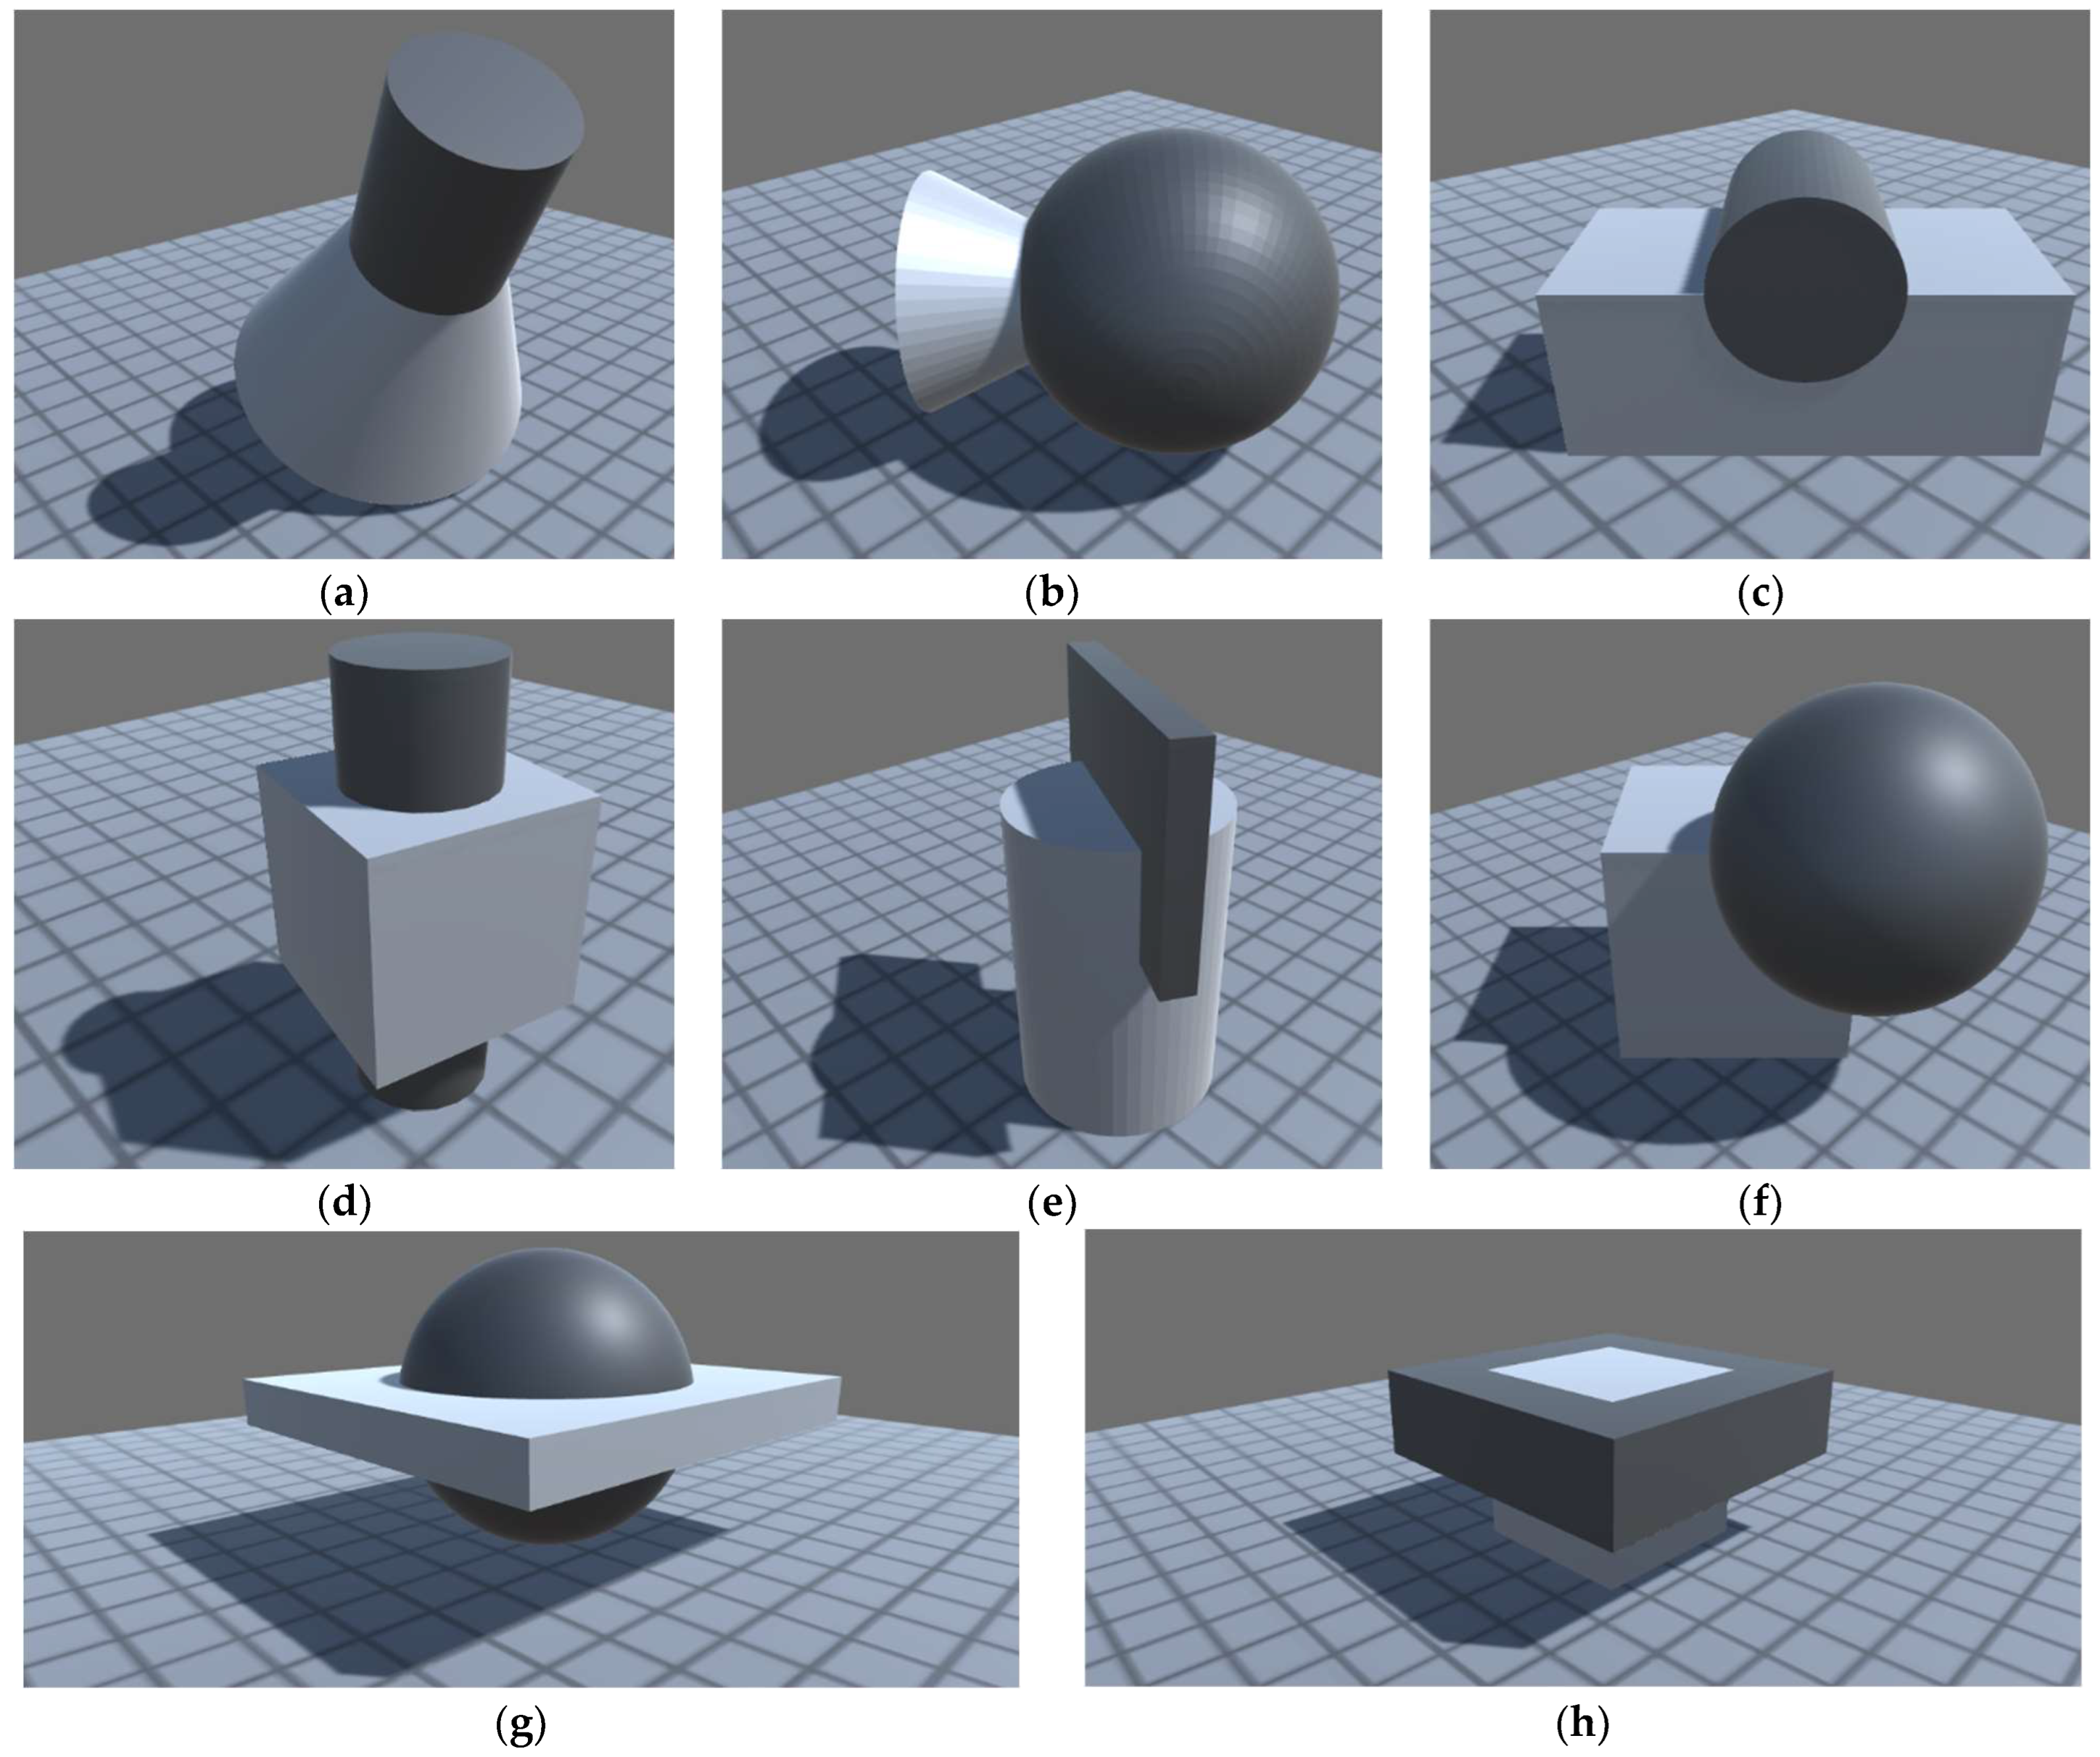
All participants used a mouse (not a touchpad). At the beginning of each session, a short introduction stating the purpose of the study was given to the participants, who were then required to fill out an informed consent form agreeing to the study terms and conditions, a user profile form and a color-blindness test. The user profile information allowed the results to be broken into different groups of users according to their age, level of experience and professional background. The test was divided into seven tasks and in each task the participants were required to apply a Boolean CSG operation to a pair of 3D objects or models using the three different widgets. Before the first timed task the participants were asked to complete a habituation task with a separate model to be familiarized with the graphical user interface. The habituation task consisted of performing four operations (difference, union, XOR and split), each with the three different widgets. The 3D models used for each task are shown in
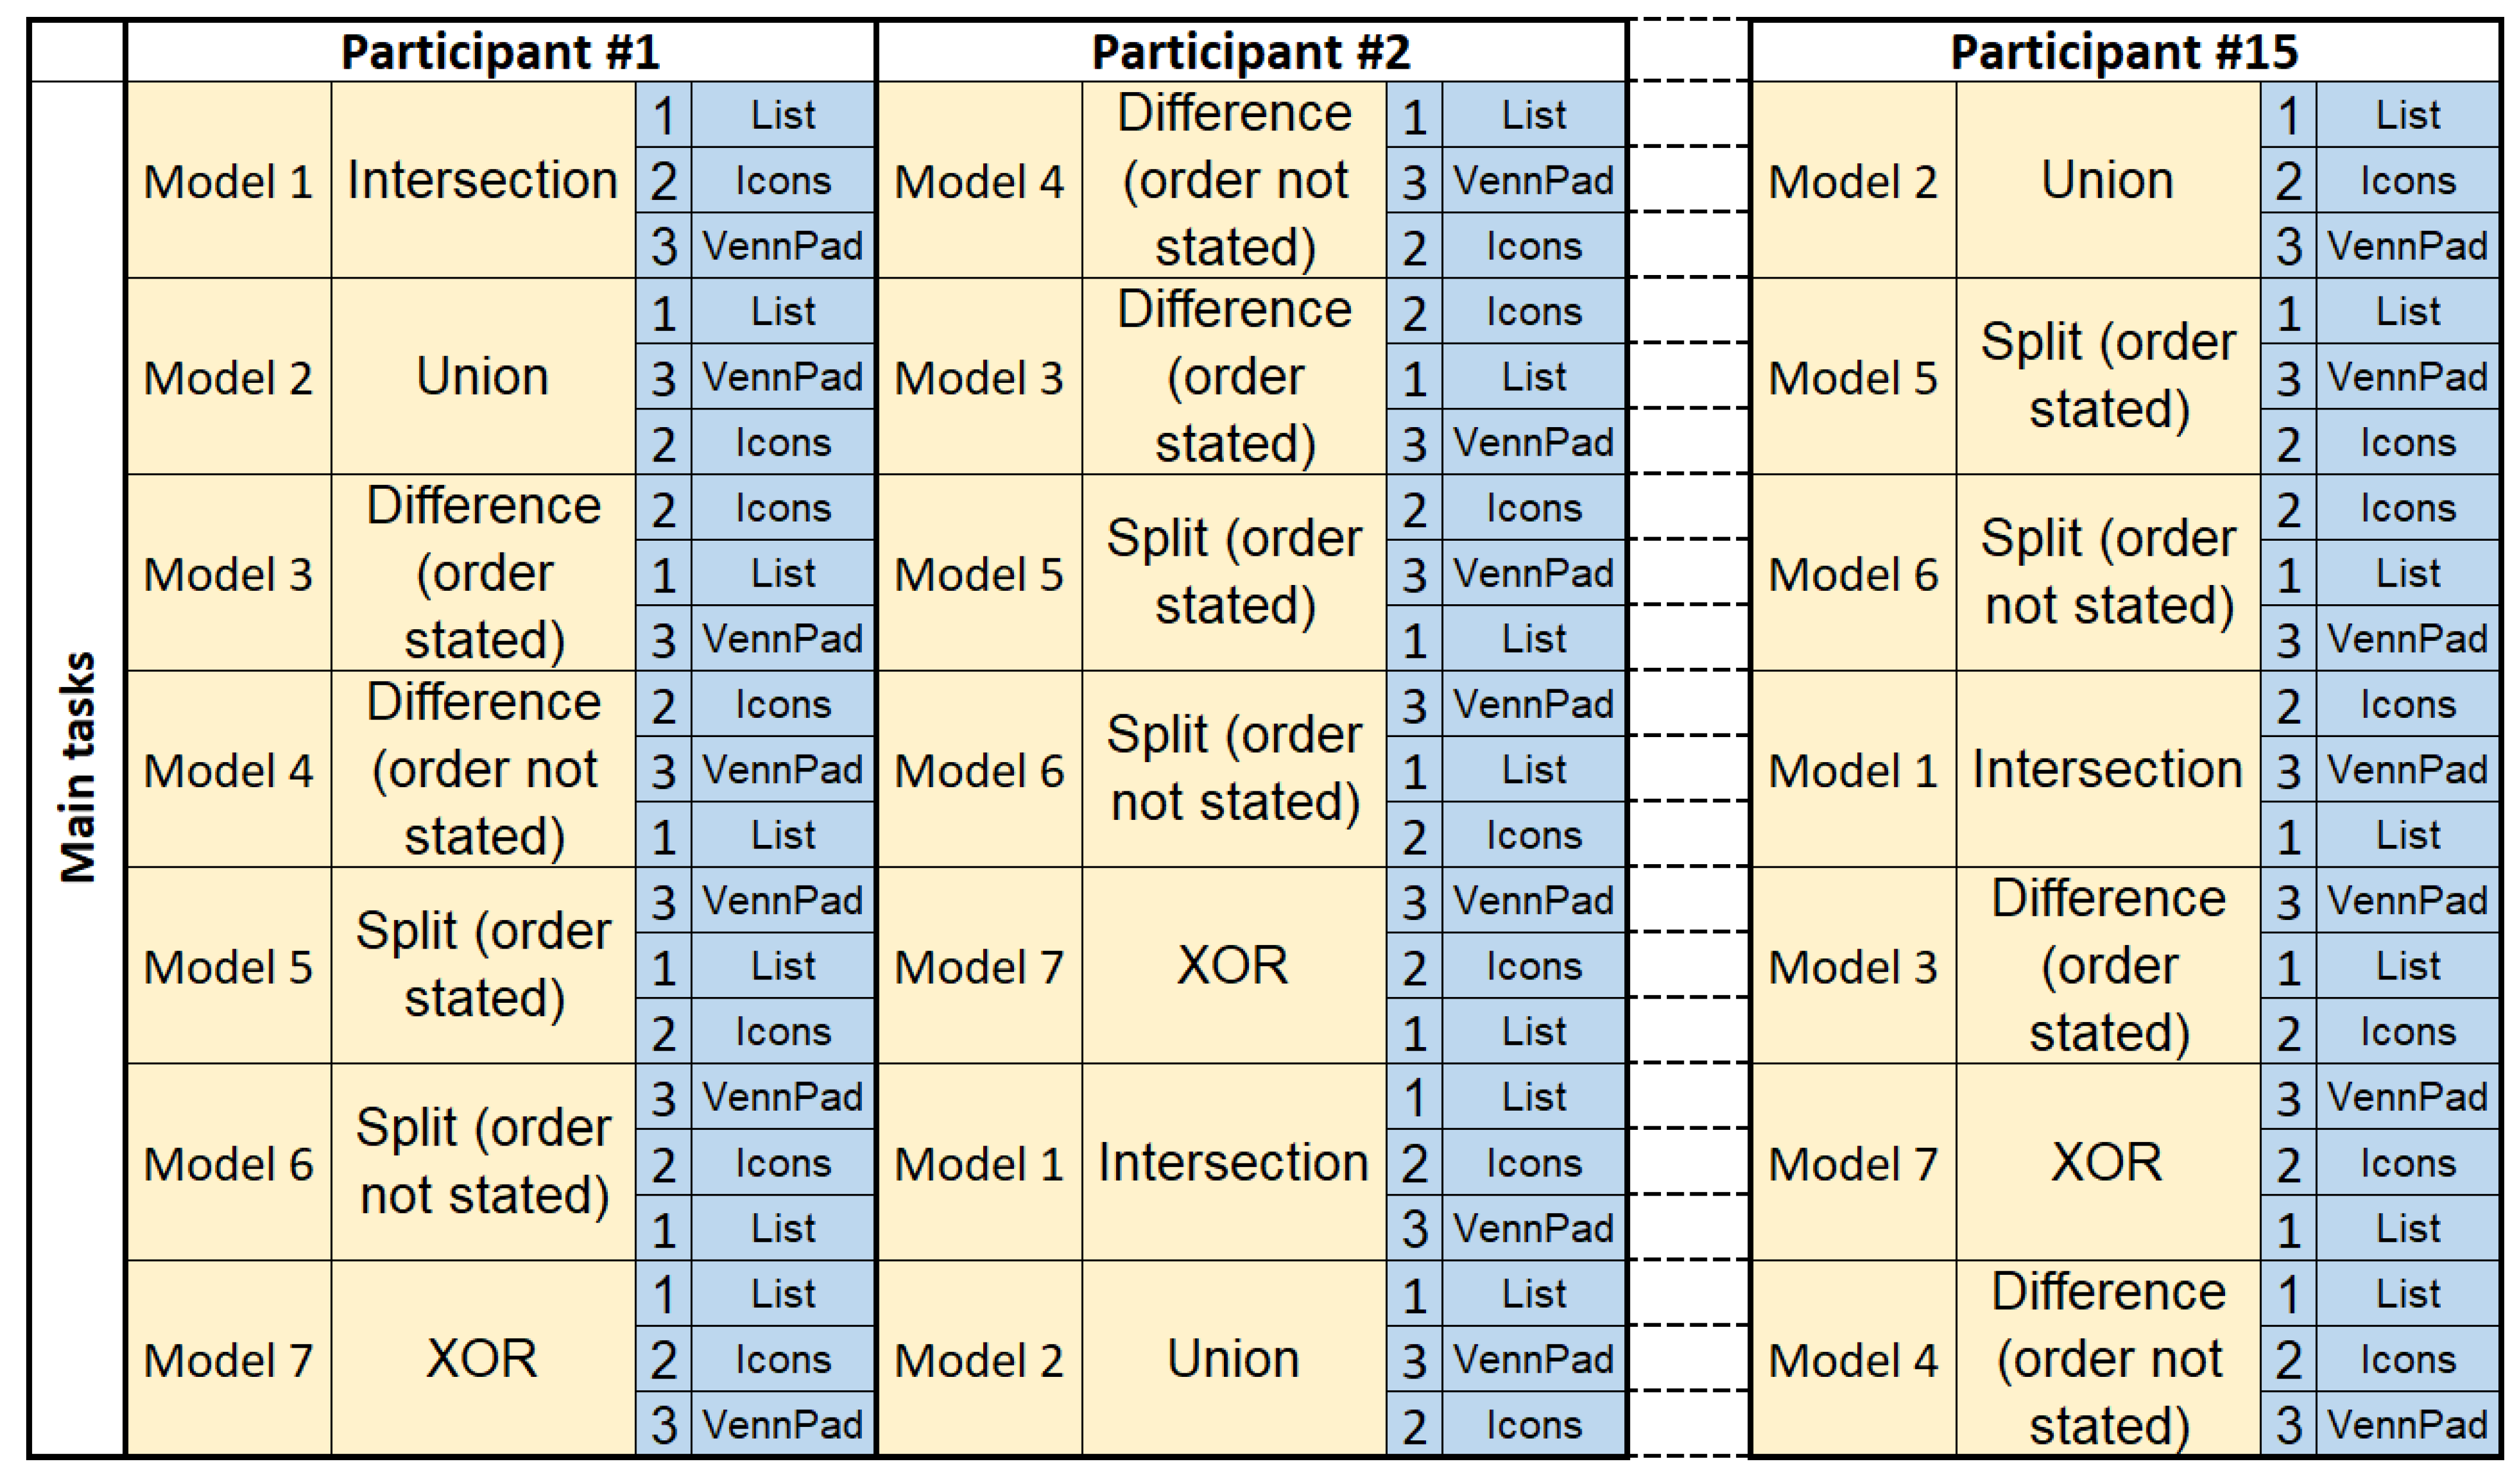
Figure 3. At the end of each task, the participants were required to fill out a form, stating their perceptions regarding the use of each widget. In these forms the participants were asked to rate from 1 to 6 the easiness, coherence of the buttons layout, comfort of use, time taken to learn the widget, recallability and usefulness. Inevitably, for any given participant, the initial tasks require a longer learning time. To try to eliminate the results bias caused by this order dependence, the tasks were put forward in a different order to each participant, laid out using Latin squares permutations (
Figure 4). These predefined permutations ensure an even distribution, in terms of the positions where the tasks are placed in the sequences to be presented to the participants. After the form of the last task was completed, the participants were asked to fill out an additional form to provide a global assessment of each widget.
2.5. Participants
The user study was conducted with a total of 15 unpaid invited participants, 12 male and 3 female, with an average age of 25.9 years old (minimum 19 y.o., maximum 40 y.o., standard deviation 7.4 y.o.). All participants passed a color-blindness test. Regarding academic background, 12 were either undergraduate students or had completed a bachelor’s degree (10 Mechanical Eng., 1 Aeronautical Eng., 1 Computer Science), 2 were Master’s students (1 Mechanical Eng., 1 Biomedical Eng.) and 1 had a doctoral degree in Mechanical Engineering. Regarding the number of years of experience in 3D modeling, 7 reported 2 years of experience, 3 reported 3 years of experience, 2 reported 1 year of experience and the remaining 3 had, respectively, 6, 7 and 20 years of experience in 3D modeling. In terms of frequency of use of 3D modeling systems (e.g., Blender, Maya or AutoCAD), 3 reported to use this type of software more than once per day, 2 reported to use these systems once per day, 3 reported between 1 and 5 times per week, 4 reported less than once per week, 1 reported less than once per month and 2 had never used 3D modeling software. Regarding previous experience of application of CSG Boolean operations with 2D vector drawing systems (e.g., Inkscape, CorelDraw or Adobe Illustrator), 1 reported between 1 and 5 times per week, 5 reported less than once per month and 9 reported to have never used Boolean operations in this context. Regarding the frequency of applications of CSG Boolean operations in 3D modeling systems (e.g., Blender, Maya or AutoCAD), 1 reported to use Boolean operations in this context more than once per day, 2 reported between 1 and 5 times per week, 3 reported less than once per week, 5 reported less than once per month and 4 participants reported to have never used Boolean operations in this context.
4. Discussion
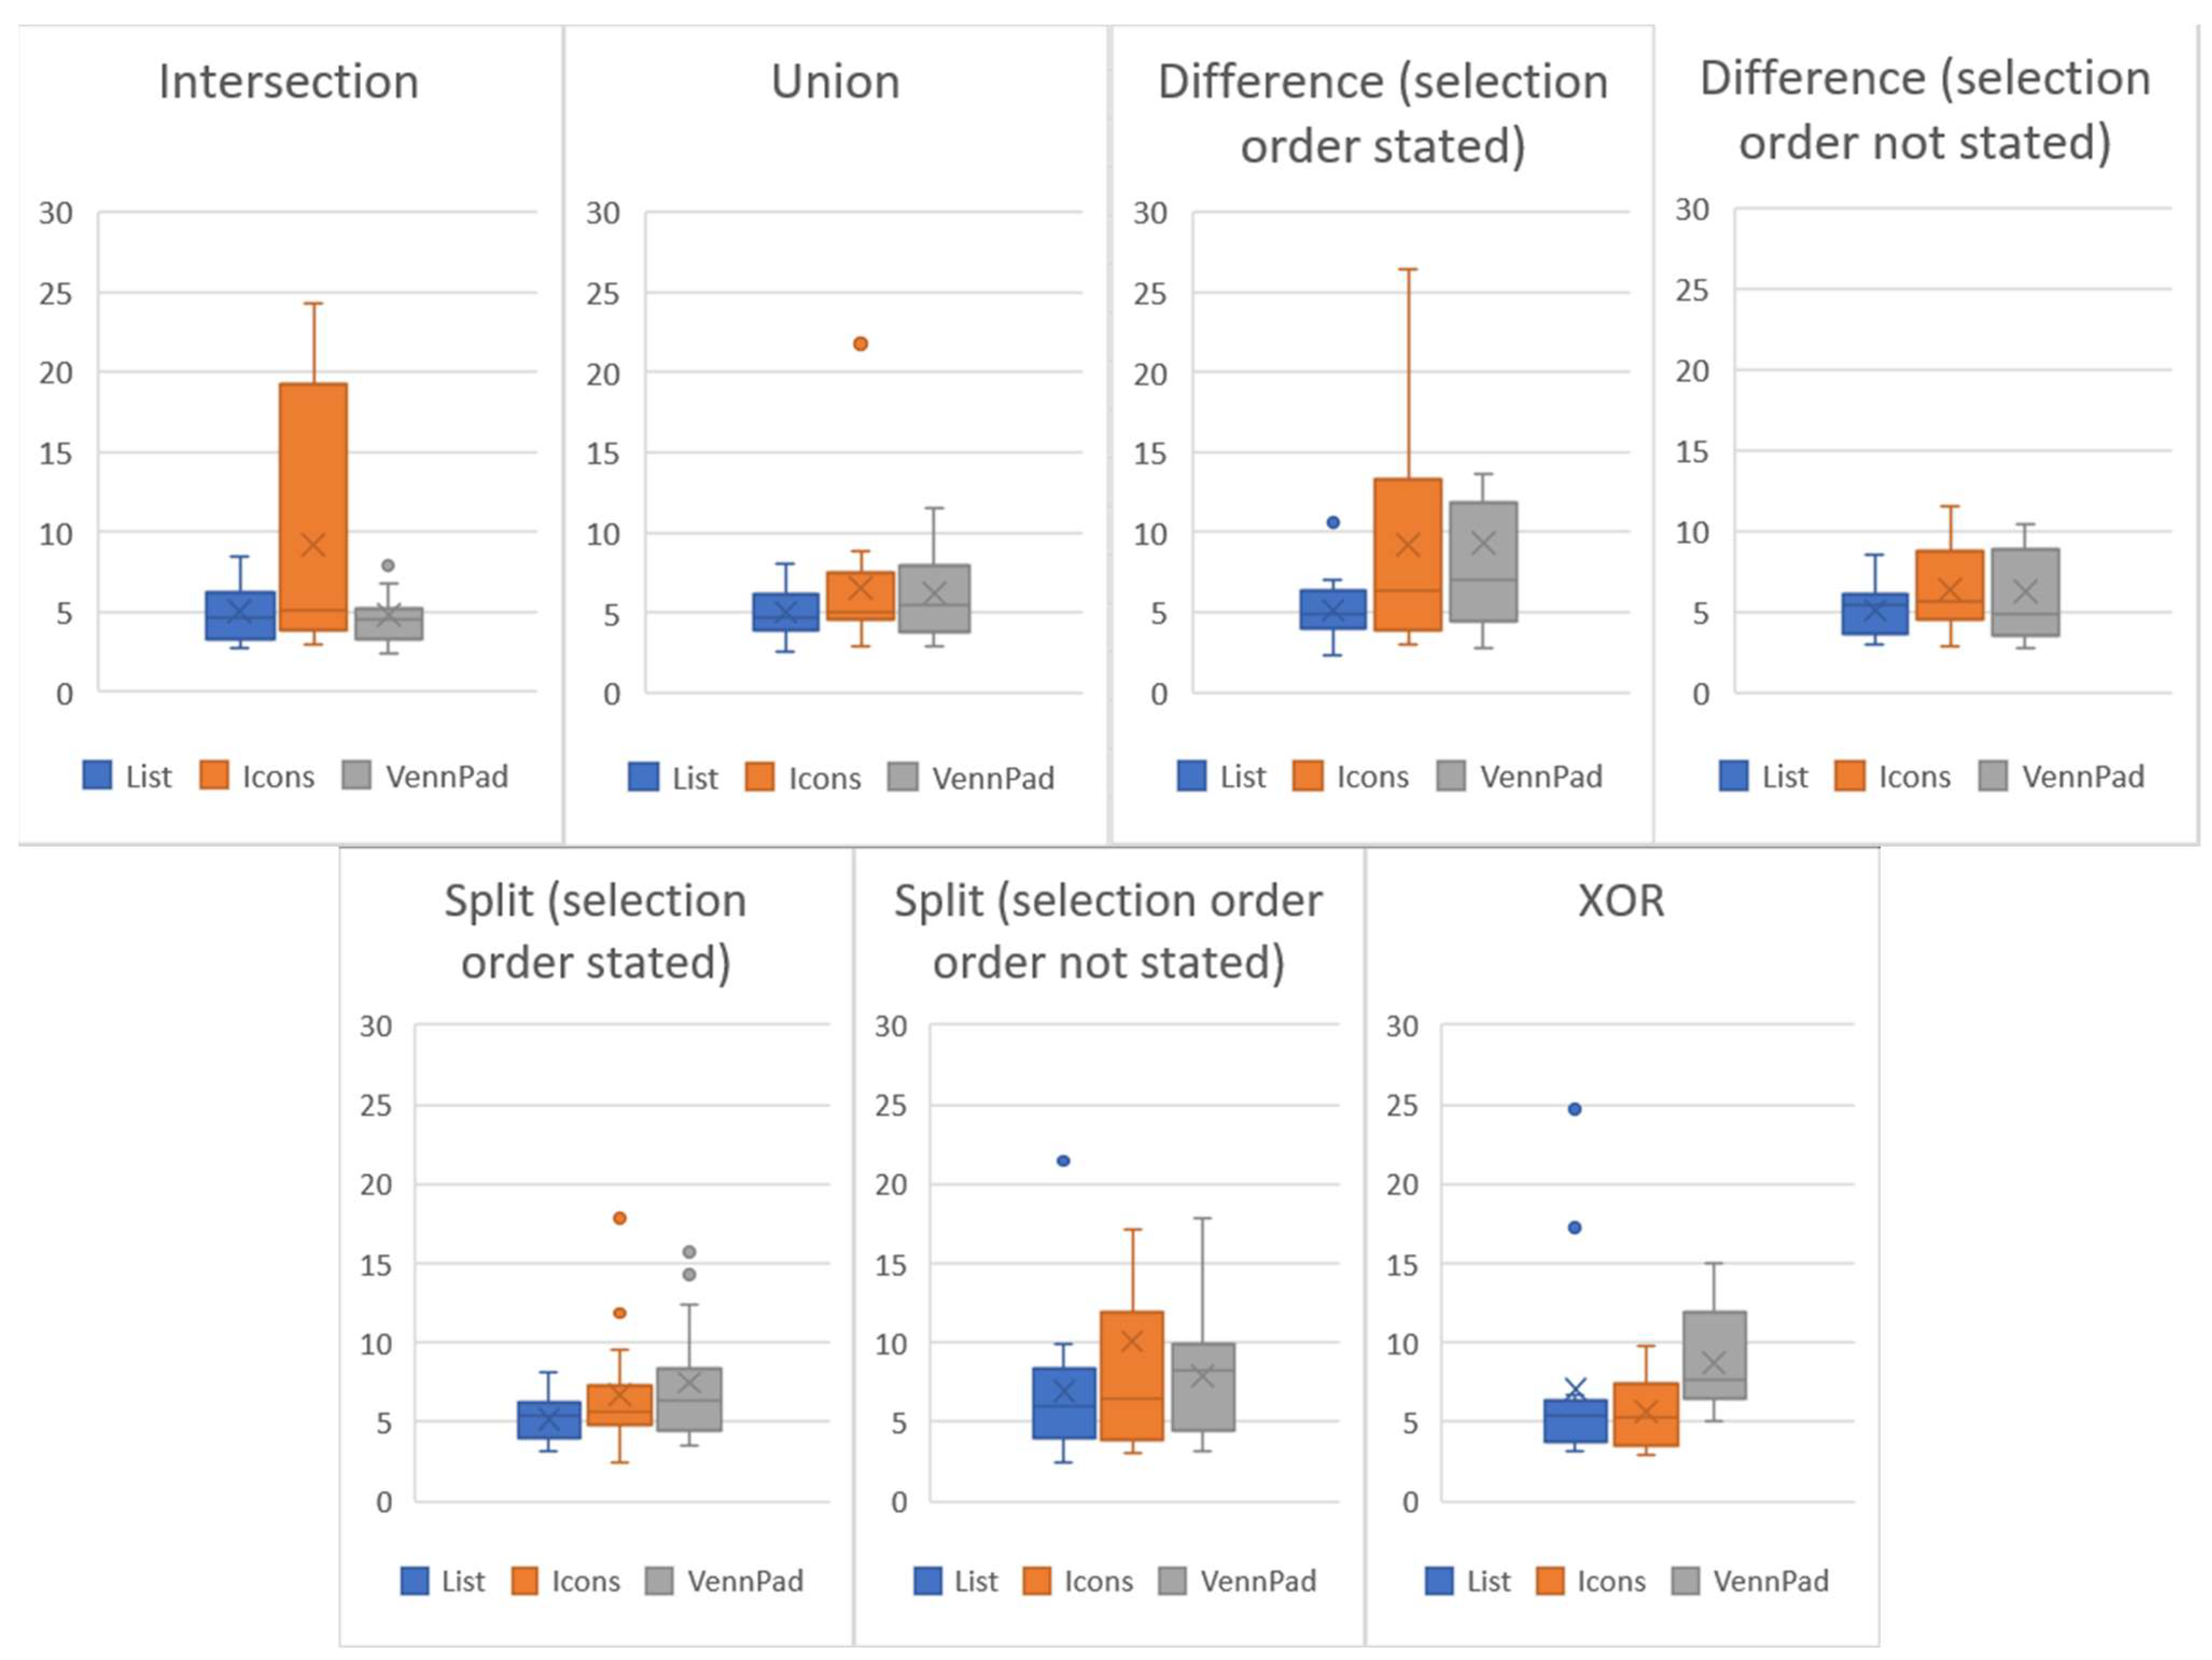
All participants completed the requested operations using the three interfaces with similar completion times and, therefore, all three interfaces were effective. Although one of the main premises in the design of the new interface is to allow for a more familiar interaction, it does require more mouse clicks to perform some operations. For all three interfaces and all five Boolean operation types, the first two clicks are used to select two 3D objects in the correct order, if the order is relevant. For List and Icons, a third mouse click on the button that corresponds to the desired operation completes the task. In the case of VennPad, the number of clicks depends on the operation. To perform an intersection, only the central button needs to be pressed, for union, all three buttons need to be pressed, for a total of five mouse clicks. Difference requires only one button to be pressed, which corresponds to the section that should be retained after the operation is applied. Both split and XOR require two buttons to be pressed on the interface, for a total of four mouse clicks. Since VennPad requires a larger number of mouse clicks, it makes sense to hypothesize that some operations should take longer to complete. In what follows, the usability and potential limitations of VennPad applied to each of the five Boolean operations are discussed, in accordance with the results presented in
Figure 5 and
Table 2,
Table 3,
Table 4,
Table 5 and
Table 6.
Intersection: Requiring the same number of mouse clicks as the two conventional interfaces, VennPad obtained the best median and mean completion times. Although mean completion times are similar for the three interfaces, the median for List is significantly higher than for the other two. This indicates that a significant proportion of users took longer to pinpoint the correct button to press on the interface. Since this is an operation that most users will be familiar with, we can conclude that the longer time taken to complete this operation with Icons can be attributed to a lesser ability of the interface to quickly communicate the desired operation. Although List has the same number of buttons, the information in text form allows for a more immediate location of the correct button, when the operation name is known. Regarding user perception, the three interfaces were rated similarly, but with two small differences. Regarding how easy it is to memorize the operations, Icons achieved a lower score than the other two, which corroborates the longer completion times obtained with this interface. On the other hand, for this operation, the score for VennPad was also slightly below that of List, despite achieving the best completion times.
Union: Despite requiring a larger number of mouse clicks (five) for the operation of union than with the other two, the mean completion time with VennPad was shorter than with Icons. This indicates that a required larger number of mouse clicks does not necessarily mean that the completion time will be longer and the time taken by the user to figure out what buttons to press can be just as important as the time taken to press them. List produced the best times for this operation and, since the operations were requested to the users in both text and verbal form, it is to be expected that the interface with the names of the operations written on the buttons should perform well. Regarding user perceptions, once again, VennPad was slightly more difficult to learn, but Icons had a small disadvantage on how easy it is to memorize the operations.
Difference: One of the expected main advantages of VennPad is that when the selection order of the operands is important, as in this case, the user will be able to simply select the object regions that are to be retained. To try to gage the importance of having a priori knowledge of the correct selection order, two separate models were used, one giving information of the correct selection order to the participant and another without this information, leaving the participants to discover the correct order by themselves. Although it was expected that without information of the correct order, the operation would take longer, this was not the case in every instance. Only with List were the median completion times lower when the order information was provided. For Icons and VennPad, the times were worse when the order was provided. Considering that the case where the order information was not provided corresponds to the real-life situation,
Table 2 shows that VennPad has an advantage with this operation having attained the lowest median completion time, although it has the second-best mean completion time, together with Icons. When the order is not given beforehand, all three interfaces obtained similar results, with small differences on how easy it is to use the interface (Icons worst), layout coherence (List worst) and how easy it is to memorize how to perform the operations (List best). Therefore, VennPad performs at the same level as the other two interfaces for this operation and the lowest median completion time is an indication that the purpose of not requiring the user to grasp the selection order before carrying out the operation was achieved.
Split: For this operation, the final result also depends on the selection order of the operands. It is not as common as the previous three and most users had not seen it before. The required number of mouse clicks with VennPad is four. As with the difference operation, two separate models were used, with and without giving prior information of the correct selection order to the participant. Here, there was a clear increase in completion times when the order was not provided, for all three interfaces. This is probably due to lack of familiarity of the participants with this operation, which caused them to rely on the provided order information to complete the operation. Comparing between interfaces, List had the lowest completion times, but regarding user perception, VennPad was the best in five items out of seven and as good as the other interfaces in the remaining items (comfortable to use, quick to learn), as shown in
Table 5.
XOR: Although most participants were not familiar with this operation, it was easy for them to understand its purpose as well as the required result. The total number of mouse clicks with VennPad is four for this operation and the quickest time was obtained with Icons. The user perception was similar for all three interfaces, with small differences, namely usefulness (List worst) and how easy it is to memorize the operations (Icons and VennPad worst).
After completing the seven tests and filling out the corresponding forms, the participants were asked to answer a final set of questions to assess the overall perception of each interface individually (
Table 4) and compare pairs of interfaces (
Table 5). Although the differences between interfaces are small in the overall assessment, VennPad is the easiest to use, the easiest to identify the required operation and the most comfortable to use. Together with List, it has the most coherent layout and together with Icons, it was the most useful. All interfaces were equal regarding how easy they are to learn and how easy it is to memorize how to perform the operation. In summary, VennPad was perceived to be either the best or on par with one or two of the other interfaces. On direct comparison between pairs of interfaces (
Table 5), VennPad was better than List, with a median score of 5 on all items considered, where 1–3 corresponds to List being the best and 4–6 corresponds to VennPad being the best. VennPad also compared favorably with Icons, with a median score of 5, except for the coherence of the layout, with a median score of 4. In the direct comparison between List and Icons, the former was preferred, with a median score of 5 for coherence of layout and how quick it is to learn how to use the interface. These results show that Icons is the least preferred interface and, considering that both Icons and VennPad communicate the operation in a graphical manner, although the completion times are similar for both interfaces, VennPad is perceived to be the better of the two. Despite List achieving the best completion times, VennPad was also perceived to be the better of the two. The participants also considered that VennPad is a viable alternative to List and Icons with a median (interquartile range) score of 5 (2) in both instances.
To try to corroborate the responses given in the forms and gain further insight into these responses, the participants were subjected to an audio interview, in which the participants were asked to provide several advantages and disadvantages of each interface. As shown in
Table 6, List was mentioned as being more direct and objective because it features the operation names. It was noted that this interface is fast and easy to use when the user is acquainted with the operation and its name. This aspect is in line with the faster completion times that, in general, were achieved with this interface. On the other hand, it was noted that List is difficult to use when the operation names are not known and the lack of graphical information is also a disadvantage. When objects are selected and change color, the corresponding color is not shown on the interface itself and this factor makes the selection order less clear.
In contrast, it was stated that with Icons, it was easy to visualize the final result due to the presence of graphical information. The lack of textual information was considered a disadvantage of this interface.
The high points that were mentioned for VennPad were its simple design, with less buttons than the other two, the way graphical information is shown on the interface itself, which makes it easy to identify the selection order and to visualize the final result, and it does not require the user to know the operation name. It was noted that despite being easier to use after an initial learning period, one of its disadvantages is that, before first contact, the interface does not clearly communicate its purpose and, for this reason, it can initially be less intuitive. It was also noted that some operations can be slower to perform due to a larger number of required mouse clicks, but as previously stated, a direct relationship between completion times and number of mouse clicks was not verified for all operations.
In terms of further improvements to VennPad, the graphical information could be complemented with automatic textual information for any combination of buttons. VennPad could also allow for operations to be selected by dragging the mouse cursor over several buttons, instead of clicking individual buttons. Both suggestions can be easily implemented and would contribute to improving the performance of the new proposed interface.
5. Conclusions and Future Work
Based on the visual metaphor of the Venn diagram, this work proposes VennPad, a CAD widget to apply Boolean constructive solid geometry (CSG) operations. We conducted a user study to compare the usability of the proposed design tool with more conventional widgets, namely, Icons and List of operations. In total, seven CSG operations were considered. Task completion times and participant preferences were reported. The results are operation dependent but, in general, VennPad achieved completion times similar to the other two widgets. A direct correlation was not found between completion times and perceived satisfaction, as there were several instances where despite a longer completion time, Vennpad was perceived to be the best widget. In conclusion, the current version of VennPad can be considered as an initial concept validation.
As future work, we aim to conduct a more in-depth study with visual professionals in different areas (e.g., 3D modelers, visual artists, graphic designers, architects), so that their expertise can shed some light on further design iterations of Boolean operation widgets. This follow-up study will require a larger number of participants to gather more detailed statistical information on the performance of the widgets. Although the original widget design is aimed at 3D solid modeling, the proposed widgets can be easily redesigned to support all 2D vector graphics operations as those made available in the Adobe Illustrator (R) Pathfinder tool (i.e., unite, minus front, intersect, exclude, divide, trim, merge, crop, outline, minus back).


 ,
, 


