Case Report

The Value of Open Data in HCI: A Case Report from Mobile Text Entry Research

Computer Engineering and Informatics Department, University of Patras, 26504 Rio, Greece
Multimodal Technol. Interact. 2022, 6(9), 71; https://doi.org/10.3390/mti6090071
Submission received: 20 July 2022 / Revised: 11 August 2022 / Accepted: 18 August 2022 / Published: 23 August 2022

Abstract

:
For many years, HCI research has been known to suffer from a replication crisis, due to the lack of openly available datasets and accompanying code. Recent research has identified several barriers that prevent the wider sharing of primary research materials in HCI, but such material does, in fact, exist. Interested in the field of mobile text entry research, and largely hindered by the lack of access to participants due to the COVID-19 pandemic, the exploration of a recently published open gaze and touch dataset became an appealing prospect. This paper demonstrates the numerous problems and the extent of required effort related to understanding, sanitising and utilising open data in order to produce meaningful outcomes from it, through a detailed account of working with this dataset. Despite these issues, the paper demonstrates the value of open data as a means to produce novel contributions, without the need for additional new data (in this case, an unsupervised learning pipeline for the robust detection of gaze clusters in vertically distinct areas of interest). Framing the experience of this case study under a dataset lifecycle model intended for ML open data, a set of useful guidelines for researchers wishing to exploit open data is derived. A set of recommendations is also proposed, about the handling of papers accompanied by data, by conferences and journals in the future, Finally, the paper proposes a set of actions for the mobile text entry community, in order to facilitate data sharing across its members.

1. Introduction

In recent years, an increasing number of researchers publicly release data and source codes as accompaniments to their publications. The field of Human-Computer Interaction (HCI) has also made contributions to the global effort of widening access to data and materials, though while calls for open data and more transparency for methods have been ongoing for years, the HCI field is still behind both in terms of availability of source materials, and presented work based on such pre-existing resources. When datasets and other materials are shared, a significant investment of time and effort is required in order to sanitise, anonymise, structure and package all the available resources, as well as any accompanying explanations and instructions. This effort can go unnoticed or be undervalued, but it is this very effort that ensures data sharing is not just a token gesture, but a gift of significant value to the research community.
Open materials allow researchers to replicate studies and reproduce results, or to explore aspects of the data not originally touched upon by the researchers who produced it. It also has high educational value, allowing professors to incorporate these materials into the formal, and informal training of students and postgraduate researchers. The value of open data and materials has become especially visible as HCI research rapidly incorporates advances in Machine Learning, which requires extensive datasets for model development and training purposes. Another aspect of value of open resources has been demonstrated during the COVID-19 pandemic, where HCI researchers, who are largely dependent on user studies for their results, found themselves isolated and unable to access human subjects to partake in experiments. In these circumstances, open data from previous studies has provided opportunities for researchers to revisit previous experiments or to try out new ideas on existing data.
My lab consists of a small team of researchers and students, who have been eager to do work in the cross-section of HCI and Machine Learning, but have been severely hindered through lack of access to human subjects under the COVID-19 context. As a workaround, I decided to test out some of our shared ideas using an independent dataset related to text entry with mobile devices, presented at a major HCI conference [1]. As a faculty member, I undertook the effort of exploring the dataset myself, in order to assess the possibilities and therefore be better able to guide collaborating researchers and students more effectively. The exercise proved more complicated than originally anticipated, despite the richness of the data and information offered in both the enthrallingly written accompanying paper, as well as supplementary guidance included in the dataset.
This paper presents a detailed case report of the experience of working with someone else’s data. No additional new data were collected for the purposes of this paper, but rather the original data from a previous study were solely used to inform the findings reported here. The data relates to human gaze movements while performing a transcription task on a mobile device (smartphone), therefore two sources of data (touch and eye movement) are merged to investigate typing behaviour. The first contribution of this paper is to highlight the issues encountered with the use of shared data, from the perspective of the recipient of such a generous gift to the community, and the extent of effort that may be required in order to exploit open HCI data to enable further research. Through this experience, this case report hopes future researchers who wish to make use of open datasets, can avoid a range of pitfalls by following the guidelines proposed in this paper. For researchers who wish make their data public, the paper proposes guidance on how this could be undertaken so that their data becomes useful, usable and used, as per the classic HCI tenet. It also proposes a range of actions for organisations such as professional societies, journals and conferences, and more specifically the subcommunity of mobile text entry research, in order to foster the increased sharing of data and materials. As I work through the data in this case study, I also highlight some of the challenges in dealing with biometric data effectively, and propose a novel contribution in the form of a pipeline for cleaning, pre-processing and classifying this data without human intervention. This demonstrates that the HCI community’s low adoption of open science practice presents significant missed opportunities for novel and valuable contributions to the field. However, simply releasing material such as data and code, is not enough. To enable these novel contributions, open science material releases need quality management, which must be applied from the initial conception (decision to release material) and continue after release (maintenance and stewardship).

2. Related Work

In this section, I provide a brief background on the topics touched upon in the paper. First, an overview of the paper’s technical interest, namely use of eye movement data in text entry research, is presented. Next, I introduce the current state in open science practices in HCI, as well as pertinent observations from fields where open science practices are more widespread. Finally, this section presents a short discussion on the validity and merit of case-reporting methodology, as used in this paper, before concluding with a summary of related work.

2.1. Gaze Data Use in Text Entry Studies

Traditionally, text entry studies have been based on the collection of keystroke data from participants. In mobile text entry with soft keyboards, it is not uncommon to also collect raw touch data (e.g., for the purposes of statistical modelling, e.g., [2,3]). User behaviour is then analysed based on keystroke and touch dynamics in order to derive either a range of well-known metrics such as WPM, error rate, corrected error rate [4] or to infer and model user behaviours such as error-correction strategies, typing speed variation or the use of intelligent text entry aids [5,6,7,8].
A less common approach to study human behaviour during text entry is through the use of eye-tracking equipment. Text entry behaviour in desktop computer typing has demonstrated interesting results relating to eye movement for the purpose of error checking [9,10] or the identification of user activity during text composition (i.e., thinking, transitioning and typing) [11,12]. In mobile text entry, eye-tracking studies have been rarer. In contrast with desktop computers, mobile text entry involves a less controllable distance between the subject and the screen as participants hold the device at a posture which is personally comfortable. There is also significant mobility in both arm and head body segments during typing. Therefore, therefore it is more difficult to calibrate eye-trackers, and to control recorded results for drift. As a result, such studies have been made with the use of contraptions that keep devices at a fixed position (e.g., [13]) or instructions to minimise participant movement, such as keeping the arms on a table whilst seated [1], although it has recently been shown that AI-driven eye-tracking through use of the device’s embedded user-facing camera could alleviate these issues [14]. Eye tracking in mobile text entry studies has been used to explore the error checking and error correction behaviour of users in only a handful of studies, using a tablet device [15,16] and a smartphone [1]. Two of these studies have also exploited other biosignal and human motor data, such as finger movement and brain activity (EEG) [1,16]. A significant challenge in such studies is to temporally align the data from various sources (touch, gaze and other biosignals), as well as to ensure that a common spatial reference is provided for all related data.

2.2. Open Data Practices in HCI

The push towards open science mandates the open availability of data, comprehensive descriptions of experiments and the source code of any program(s) required to filter, process and analyse the data, even though the concept of how many, and which of these resources should be released to the public remains a topic of debate within communities and researcher teams who wish to share [17]. Early arguments supporting the practice of open data sharing in HCI work were voiced in 2016 with the proposal of a Special Interest Group for transparent Statistics in HCI [18]. Despite reported advances in the encouragement, support for and actual practice of open science in HCI [19], a 2018 study found that under 3% of all papers at ACM CHI’16 and CHI’17 contained links to source code and data [20]. Researchers have been repeatedly calling for increased replication in HCI for at least a decade [21,22,23] but there are low incentives for HCI researchers to engage in such activity, due to a culture of over-emphasis on novelty and a reviewer bias towards statistically significant findings [24]. This presents a significant problem, in which researchers who want to access open data (for their own purposes, or for the purpose of reproducing a study) cannot find data to do so, and even if they do, they would have a hard time publishing the results of that activity. In fact, many researchers who publish at CHI disclosed that a major reason for their reluctance to share data and processing code was that they would see no benefit in doing so [25]. To address the problem, researchers have recently proposed the pre-registration of HCI studies, and for organisations such as the professional societies (e.g., ACM, IEEE), conference steering committees and journal editorial boards, as well as for individual practitioners, to take concrete steps towards providing support for study pre-registration (and consequently data and source code archival [26]). Unfortunately, a recent study found that only a very small percentage of HCI-related journals have clear openness and transparency standards, demonstrating that the community still has a long way ahead in making open data and material sharing mainstream practice [27]. Yet, recent work demonstrates that simple, but carefully designed gamification or reward mechanisms, such as badges to identify core properties of released artifacts, may considerably help in overcoming the barriers of sharing practice for scientific materials [28,29].
The study of open scientific material sharing practices across multiple scientific disciplines has revealed many practical issues, such as varying degree of open data and code sharing in publications [30], low response rates and delayed responses to requests for data release [31] and a range of concerns over data quality and stewardship [32]. The latter term merits further discussion-open material is released, but often there is no steward, no person responsible for ensuring it is available to those who need it, or that questions about the material may be answered as they arise. Open data and code need not just be released, but also to be properly maintained, though this is one of the least desirable tasks in a project’s lifecycle [33]. Often, users of open material releases may face difficulty contacting the primary authors of papers, who are arguably the most knowledgeable persons about the material, since primary authors are often doctoral students who become unavailable or uncontactable after graduation. Even in the case where one can contact a open release’s creator, many of the undocumented details that relate to data generation, sanitation and preparation for release can be lost from memory after publication. There is therefore no guarantee that open data can also become usable data for the purposes of further research, unless they are meaningfully documented, shared and preserved [34]. Such activity, which is peripheral to the release but also essential for the creation of value from it, is oriented towards other human recipients. To this extent, Vertesi and Dourish [35] argue that open data releases imply the existence, or desire to establish social relationships between producers and consumers of the datasets. Therefore, a mere release of data that bears no consideration for the implicit or explicit relationships it enables, fails to realise its potential.

2.3. Case-Study Research

Classically, HCI research has focused on the collection and analysis of empirical data as a main research method. This is evidenced in a study of methods used in 144 HCI papers published in prominent outlets in 2009 [36] and a longitudinal (2013–2017) period at a single HCI-related conference [37]. This emphasis on empirical research is not without problems. As highlighted in [38], much empirical work in HCI suffers from small sample sizes, underpowered experiment designs and inappropriate statistical reporting [38,39,40]. Other research methods such as case-studies and normative writing represent a very small percentage of published work in HCI (<10%), even though in other scientific domains, especially medical science and psychology, case-studies are an indispensable tool for in-depth understanding a complex issue in a real-life context [41].
According to Stake [42], a case study can be intrinsic (following a single entity or phenomenon in order to understand its development), instrumental (focusing on a small group of entities over time) or collective (gathering of data from multiple sources). Intrinsic case studies are also sometimes documented as case reports, in the context of a clinical trial with just one participant (N = 1). Owing to the small number of participants, findings from case studies have been criticised for lack of generalisability compared to quantitative studies based on empirical data, and might therefore be dismissed as “low-value” in some scientific disciplines. However, from an epistemological viewpoint, case studies are powerful methodological tools for scientific innovation through intense and analytical observation of phenomena, since they can act either as (a) precursors to quantitative research, by shaping appropriate research questions and identifying promising directions for empirical data gathering, or; (b) irrefutable sources of evidence for the falsification of prominent theory [43]. Therefore instead of supporting statistical generalisation, as most empirical research in HCI aims to do, case studies are oriented towards supporting analytical generalisation, and it is this type of contribution for which they are mostly suited [44,45]. As such, case studies may contribute to the development of theory through the transferability and comparability of scientific experiences, rather than by means of establishing statistically generalisable findings [46].

3. Motivation and Materials

3.1. Motivation

To place the paper in context, the original motivation for this work was to develop a predictive model for the breakpoints in user attention away from the keyboard, in order to perform error-checking functions, through use of gaze and touch data. The premise was that if such breakpoints could be predicted, as has been successfully done in other cases in attention management [47], we could provide visual cues on the keyboard about the correctness of text that has been input, therefore minimising the need for error-checking glances and reduce text entry frustration, or even improve text entry performance (speed and accuracy). The concept of opportune visual feedback to reduce the need for error-checking was demonstrated in a multimodal feedback soft keyboard in the past [48], where feedback was provided after a word was completed (i.e., after a space or punctuation mark was input). However, error-checking glances could occur at any time, such as when the user is unsure if the correct key has been pressed.
Hindered, as many researchers, by the lack of access to participants due to the COVID-19 pandemic [49], I considered the open dataset released with Jiang et al.’s paper [1] as appropriate for the motivating purpose and began to work with it. Although there was a reasonable idea about how the predictive model could be built, initial exploration of the data did not match expected outcomes. These early misalignments led to wondering about the reliability of the data. As neither the paper nor the dataset release mention anything specific, I had assumed that the dataset would have been curated and sanitised prior to release, but this turned out not to be the case. The next sections describe the detailed account of the experience in investigating this open dataset. In this account, I describe the obstacles encountered in getting to grips with the data, and therefore leave the motivating aim as the subject of another publication. Through this case report, I elicit the transferable and comparable findings on the use of open data in HCI research, and will comment on these Section 6.

3.2. Materials

The dataset was obtained from the researchers’ lab website, following the link mentioned in Jiang et al.’s paper. Despite the fact that the paper mentions the availability of both data and processing scripts, only the data was made available on the website. The data itself is organised in appropriately named comma-separated files, and is accompanied by a data dictionary (readme file) which describes how the data is organised and describes the data held in each field. All data was subsequently analysed using a Python 3.8.9 environment and the necessary modules for data analysis (pandas, matplotlib, numpy, scikit-learn, all latest versions at the time of writing).
For this paper, neither the published version nor the publisher’s website offers information on who the corresponding author is. The primary author was a Ph.D. student at the time of publication and, at the time of writing of this paper, is mentioned as an alumnus (http://xrenlab.com/members accessed on 10 August 2022). A web search did not readily provide a current email or other contact details. It is therefore unclear thus who the primary creator or maintainer of the dataset is. Therefore, this open data release presents an example commonly identified in related literature—openly available data with no discernible originator, maintainer or steward. Thus, the experience of working with it is similar to that of a researcher who either cannot find the right person to contact about the data, or whose requests for information are not replied to, or where responses may arrive late, therefore hindering research progress or causing data to be abandoned.

4. Engagement with an Unfamiliar Open Dataset

Before proceeding, it should be specified that for the purposes of this paper, only the data from Jiang et al. that related to one-finger typing were used. The dataset release contains further data for two-finger typing, but its analysis is not included here, since the points raised in our work are adequately highlighted by this subset.

4.1. Identifying and Addressing Data Quality Issues

Starting the examination of the dataset in order to ensure its integrity and suitability for use, the first problem encountered was a mismatch in typing and gaze data available for each phrase typed by participants. For some phrase typing trials, the corresponding gaze data were missing and vice versa, therefore the analysis includes only those trials for which both types of data were available. Further inspection of the gaze data revealed problematic values in the (x, y) coordinates (gazes recorded at positions outside the device’s physical bounds) and the recorded trial time which included records with negative time values (about 1% of the gaze dataset). No issues were encountered within the typing dataset. For the gaze dataset, the negative trial time problem was addressed by removing all such entries, assuming these were instances recorded before the start of the actual trial. Dropping negative trial time and unmatched data resulted in a reduction of the gaze dataset size from 275,707 records down to 152,700.
A visual inspection of the out-of-bounds gaze problem is shown in Figure 1. The dataset coordinate system places the top-left corner of the screen at coordinates [0,0] while the bottom-right corner has the coordinates [1439,2559] (Samsung Galaxy S6 with a screen of 1440 × 2560 px). Therefore to preserve the expected mental mapping for the purposes of visualising the data (i.e., to produce graphs which are not upside-down), all vertical coordinates were multiplied by −1, resulting in a labelling of the Y axis in the plot between [0,−2560]. This is simply undertaken for illustration purposes and does not affect processing results in any other way.
The first observation from the 2D histogram of gaze points in Figure 1 (top), is that there exist two distinct clusters of gaze activity, around the keyboard area at the bottom and text editing area at the top. The keyboard area cluster is evidently more dense, demonstrating that most of the users’ time is spent looking at the keyboard. It is also situated somewhat to the right of the keyboard area coordinates, leaving parts of the keyboard area unvisited. The text editing area cluster is also located just beneath (and not directly over) the text editing area. These observations are a cause of concern, since one would expect the gaze clusters to better match the bounds of the two areas of interest on the screen (keyboard and text editing area), so before proceeding, I will explain how these issues were addressed.

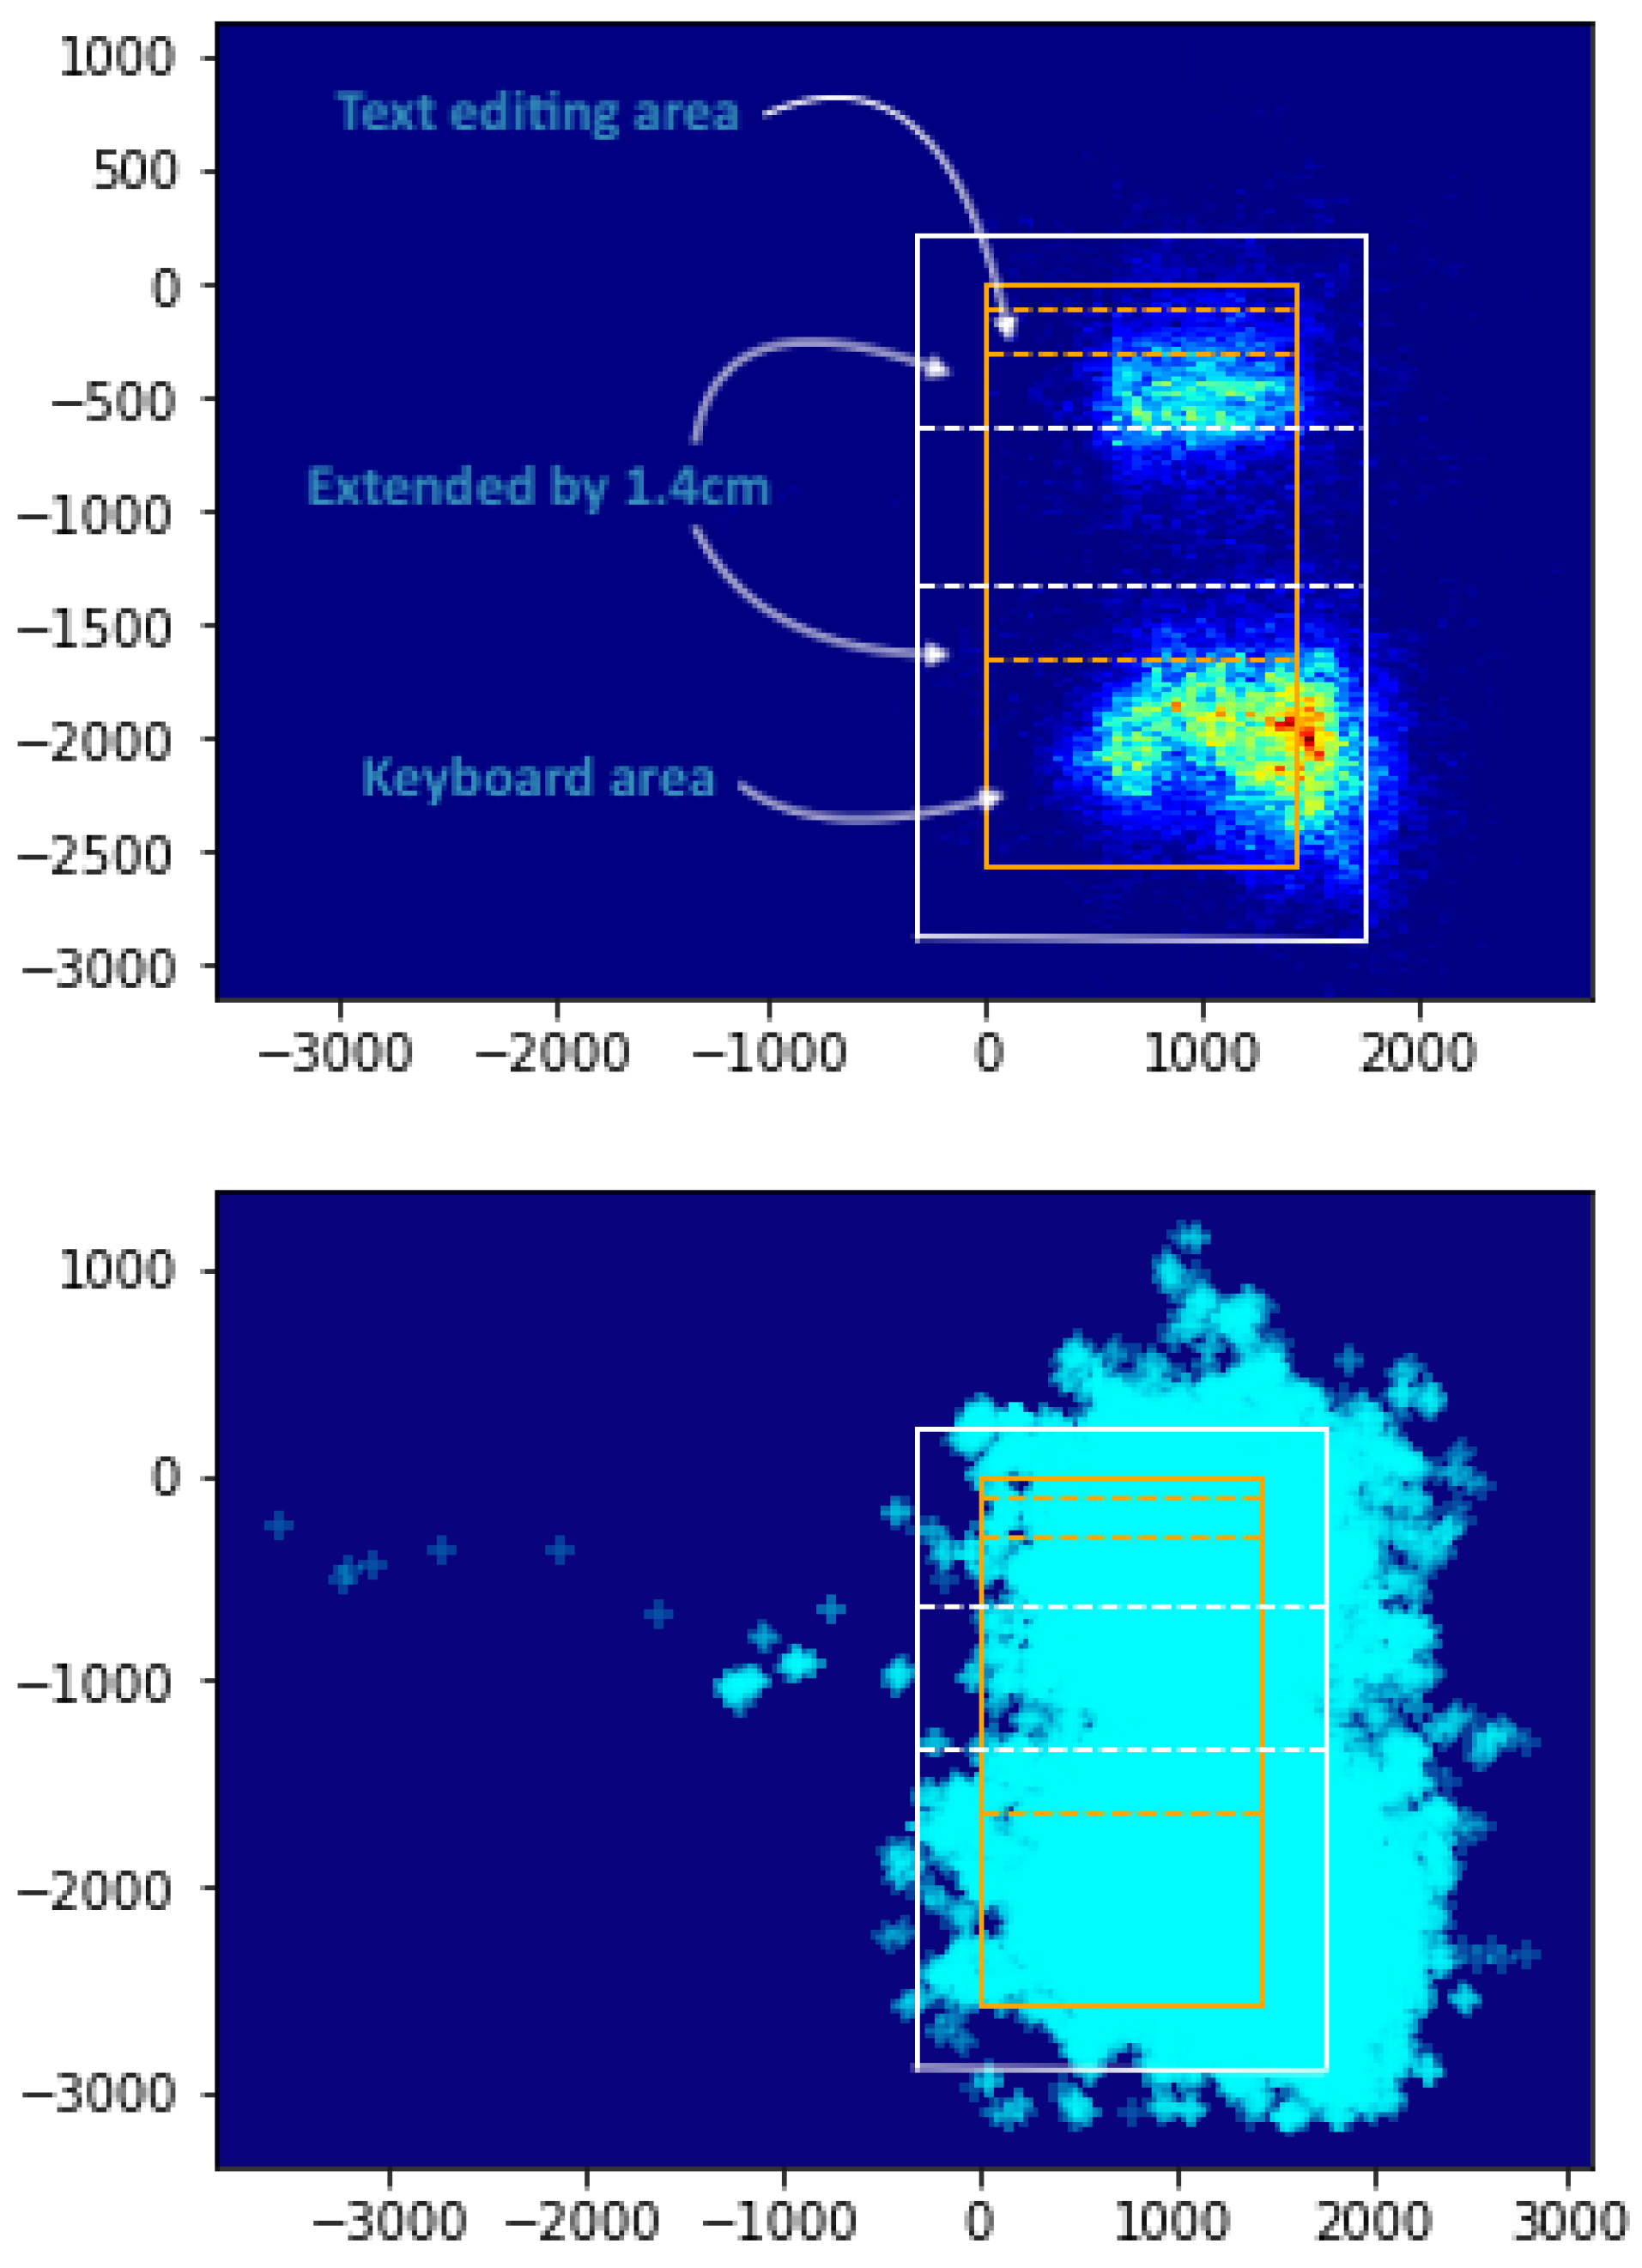
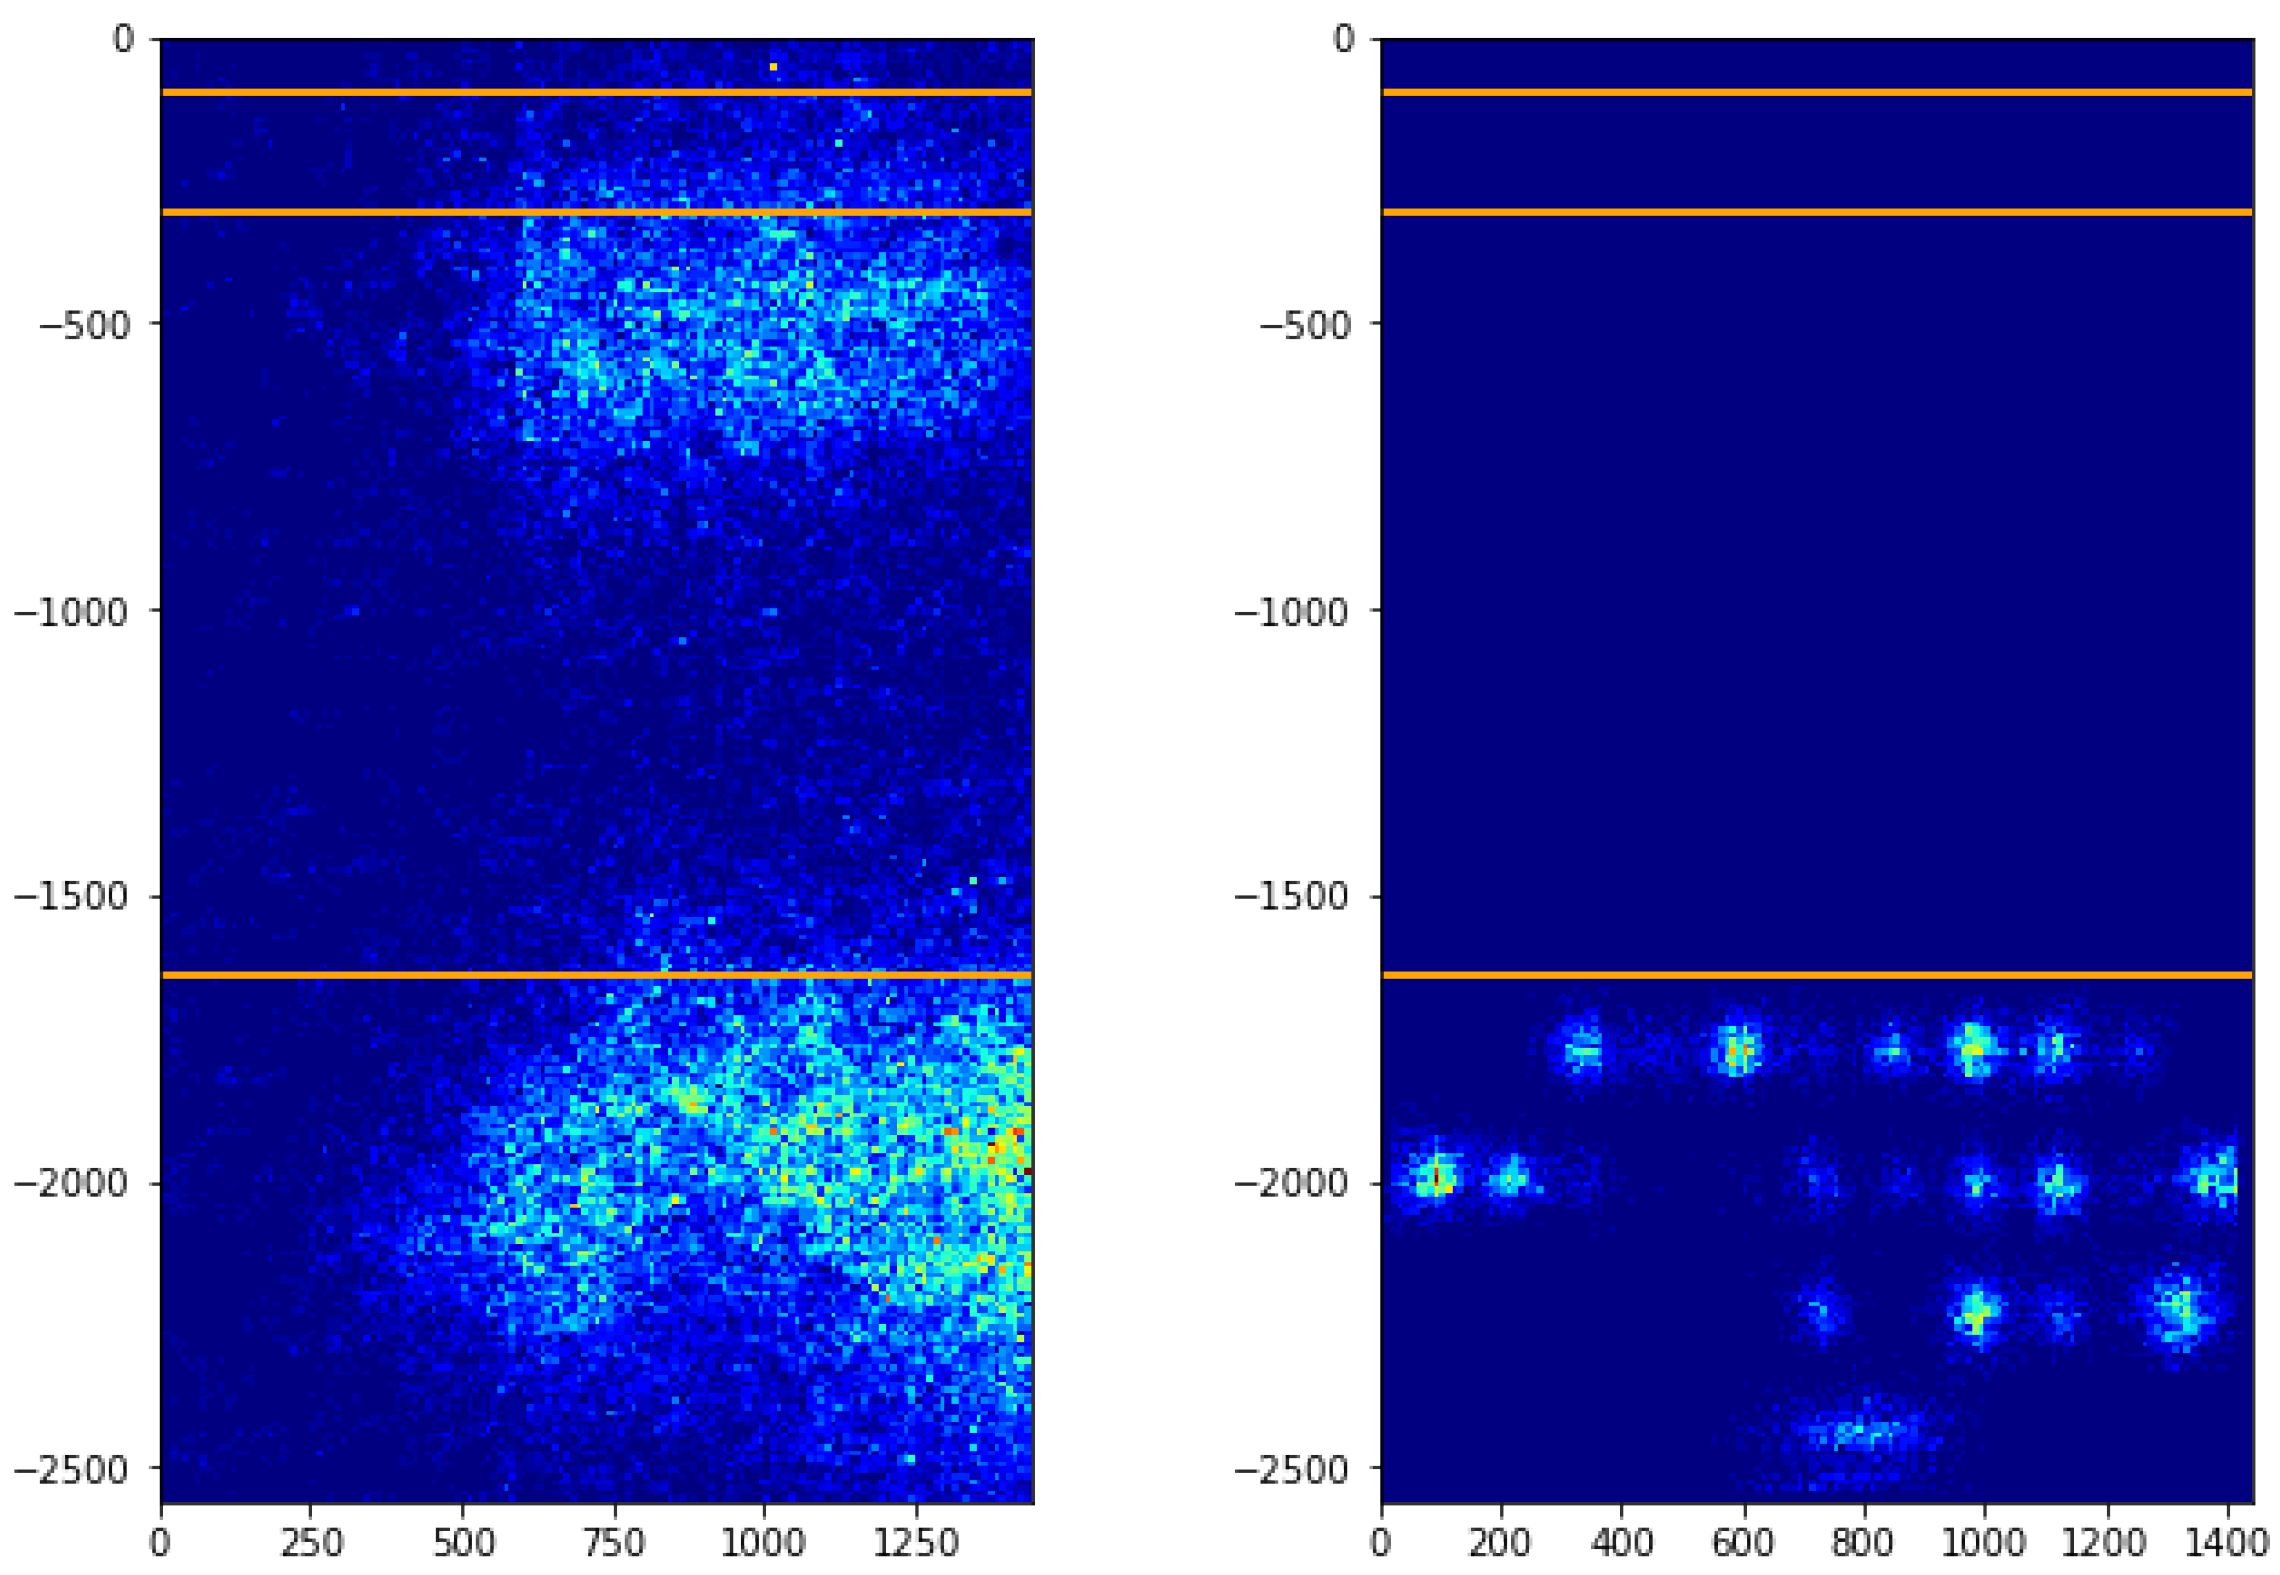
4.1.1. Keyboard Area Gazes

We can see in Figure 1 that a large proportion of the gaze points are outside the bounds of the device area. Some of this is explainable due to eye tracker inaccuracy (initial calibration and drift over time), the fact that the human foveal vision field is enough to cover a point of interest without the eye necessarily resting precisely on that point, or even participants glancing outside the device as they type or pause to think. However, when comparing the keyboard area gaze cluster to the plotting of touch data, one can definitely notice the misalignment between what could rationally be expected (i.e., gaze points largely correlating to the areas where touches are made) and the recorded data values. This is evident in Figure 2 (left), where we see no visual coverage over the left-most keys on the keyboard, which are frequently visited by touch.
A solution that excludes these out-of-bounds gazes could be problematic, since it would result in significant data loss. To mitigate the problem of data loss due to these inaccuracies, in Jiang et al.’s paper, it is mentioned that the boundaries of the keyboard and text editing area were expanded by 1.40 cm in all directions. Based on the device screen physical dimensions (≈63.51 mm × 112.9 mm) and pixel density (≈226 ppcm), this translates to an additional 317 pixels in each direction. The size of the extended area is shown in Figure 1 (top). This is a rather generous increase—in fact, it means that the total area being used to consider gaze coordinates as being “on-device” is 74.21% larger than the area covered by the actual device screen. Without this area expansion, only 70.24% of the gazes fit the screen device bounds. As a result of this expansion, 93.47% of gaze points data could be included in any analyses by Jiang et al.
However, this approach does not solve the issue of misalignment of eye and touch data. As the gaze points seem evidently skewed to the right, it would arguably be sensible to transform the gaze coordinates by shifting them horizontally to the left, since this skew can be reasonably attributed to eye-tracker inaccuracies and mis-calibrations. A linear search with displacement values in the range [100 px, 800 px] in steps of 10 px revealed that the optimal value is at 460 px, with optimality here defined in terms of the percentage of data that fits inside the device boundaries. At this displacement value, 91.15% of the gaze points fall within the screen bounding coordinates. An execution of the k-Means clustering algorithm on the data setting k = 2 (upper and lower screen areas) divided the dataset into upper and lower screen gazes. Breaking down the results of this transformation across the clusters, there is an improvement in fitting from 89.95% to 95.67% of the raw data from the upper area into the device bounds, and from 65.61% to 95.11% of the data from the lower screen area. The result of the shift is shown in Figure 3. After applying the coordinate transformation, 139,179 entries’ gaze points are considered as valid for use. As shown in Figure 4, the transformation results in a significantly more plausible coverage of the keyboard area. Further assurance of the correctness of the transformation comes from visual inspection of the results, as shown in Figure 5.

4.1.2. Text Editing Area Gazes

We turn our attention to the text editing area gaze cluster issues. The first observation is that the text editing area gaze cluster is concentrated in the screen space just below the text editing area, as shown in Figure 4. This is explainable since it has been shown that the vertical shift in non touch-typing on desktop keyboards often falls below the actual position of the text editing area [9]. Notably, after the horizontal coordinate transformation of the dataset, the text editing area gazes do not span the whole width of the text editing area, but appear to cover approximately 3 / 4 of the available screen space, starting from the left (see Figure 4 right). This can be attributed to the effect of the actual screen space taken up by inputted text, which, of course, depends on the length of the phrases in the trial set. The bounding box areas of all phrases in the phrase set are shown in Figure 6.
Since the precise font sizes in pixels were not available in Jiang et al.’s paper, an appropriate font size was estimated, based on the visual proportions demonstrated in the paper’s accompanying video at https://userinterfaces.aalto.fi/how-we-type-mobile/ accessed on 10 August 2022. From this exercise, we note that in fact, the maximum phrase length (calculated at 1041 px, 72.29% of the available screen width) explains this concentration of the gaze cluster to the leftmost 3 / 4 of the screen (shifted gaze data upper cluster horizontal coordinate m e d i a n = 720.41 px, Q 1 = 400.61 px, Q 3 = 1000.91 px, 78.70% of gazes between x = [ 0 , 1041 ] ). Based on the above observations, and that the horizontal shift brought > 95 % of the gaze data into the upper part area of the screen bounds, it seemed unnecessary to make any other transformation adjustments to the text editing area gaze data. The correspondence of the gaze cluster horizontal coordinates with the screen coordinates of the text being input, provides further assurance that the transformation step taken earlier was correct.

5. Replication of Results

5.1. Identifying Attention Shifts

Having addressed the encountered quality issues of the dataset, we now focus our attention to one of Jiang et al.’s paper’s contributions, namely gaze shifts between the keyboard and text editing area during text entry. This was a key interest to our own motivation, which was to develop a predictive model for the breakpoints in user attention away from the keyboard. In [1,6,15] it is demonstrated that users will adopt various error-checking (or proof-reading) strategies, which require that they shift their attention from the soft keyboard area, where attention is kept for most of the time, to the text editing area. Much less is known about the decision points at which users shift their gaze.
To illustrate this gaze-shifting behaviour, we can plot a user’s typing timeline along with their gaze, as shown in Figure 7. The plot shows the user’s keypresses as blue dots along the X (time) axis, while the Y axis shows the vertical component of the screen coordinates where the keypress was recorded. From this plot, we can see where the user made a decision to shift their gaze upwards. There are five such instances in Figure 7, including a final “check” after having typed the last letter and before proceeding to the next sentence.

5.2. Quantifying Gaze Shifts

Jiang et al. provide a significant discussion on the effect of upwards gaze shifts and present a range of quantitative results. Manual inspection of all user timelines to identify shifts would be impractical (and error-prone) therefore an automated method is needed. We assume that Jiang et al. must have devised some algorithmic approach to addressing this problem, but the paper offers no insight as to what this was, or any metrics on its effectiveness. The issue was approached in two ways, firstly with a threshold-based approach, and then with a clustering method, as will be explained next.

5.2.1. Threshold-Based Gaze Shift Identification

To investigate these attention shifts, the starting point was to determine a vertical coordinate threshold T, above which all gaze points would be classed as gazes to the text editing area. The keyboard height was estimated to be about 36% of the screen size based on the graphics in Jiang et al.’s paper, therefore approximately 923 px in actual height. The text editing area was estimated to be approximately 305 px tall including the phone’s status bar at the very top of the screen. The threshold was thus set to 971 px, since this is the half-way vertical point in the dead area between the text editing area and the keyboard. In Figure 7, this threshold is shown as a red dotted line. Visually, this threshold seems to correspond well to the division of gaze clusters in the 2D-histogram as per Figure 8.
To detect gaze shifts, the dataset was transformed to derive keypress event dyads, i.e., sequences of two adjacent keypresses in the event timeline for each target phrase. In contrast with the traditional notion of bigrams, these dyads can contain not only characters, but also the space or backspace events. A sentence completed after N typing events (including space and backspace events), will contain N-1 dyads. To assess whether a gaze shift from the keyboard to the editing area took place, within the timeframe spanned by a dyad, the following process is defined. First, we extract the gaze data time series that corresponds to the timeframe spanned by the dyad’s keypress timestamps. Next, we iterate through the gaze data points and return the index of the first gaze point with a vertical coordinate value greater than a threshold T. If this index is greater than zero, this means that there is an upwards gaze shift in that dyad timeframe.
This detection method identified 1,992 upwards gaze shifting events. The results for one user (id = 120, 19 phrases) were manually inspected, counting the upwards gazes as could be seen in the user’s timeline plots. This ground truth (80 shifts) was compared with the results of the threshold-based classification (62 shifts), meaning that a significant number of gaze shifts was being misclassified by this method, at least for one user, and therefore a better approach was clearly needed.

5.2.2. Cluster-Based Gaze Shift Identification

The threshold-based approach’s performance can be attributed to the static definition of the threshold. While the definition seems visually appropriate for the user cohort as a whole, it doesn’t account for individual user circumstances and behaviours, or possible calibration drift after a few trials for the same participant. A different processing pipeline to identify upwards gaze events was therefore considered. For the gaze data related to a particular trial, a DBSCAN clustering algorithm is ran first, on two features: gaze timestamp (trial time) and gaze vertical position, with parameters m i n _ s a m p l e s = 2 , e p s = 300 , which were derived empirically. An example of the results of this clustering is shown in Figure 9. Next, we calculate the mean vertical coordinate for each of these clusters and run a k-Means clustering on the means with k = 2 , to distinguish between gazes in the upper and lower parts of the screen. Finally we take the mean vertical coordinate of each of these two clusters and assign the cluster with the smallest mean (closer to zero) as the upper area gaze cluster. This process allows us to count the periods in which the user’s eye was in the upper part of the screen, therefore equivalent to the number of times the user’s eye shifted upwards. A visual example of this process is shown in Figure 9 and the complete algorithm is given as Algorithm 1 (a Python implementation is openly provided, please see Section 7).
Algorithm 1: Cluster-based gaze shift detection algorithm.
Mti 06 00071 i001
This process identified 2719 upwards gazes, an additional 36.5% over the threshold method. The results for the same user as before (id = 120, 19 phrases) were manually inspected. The cluster-based method identified 82 shifts, two more than the ground truth data. An inspection of these two instances revealed that the problem rests in the lack of gaze data between subsequent periods in which the user’s gaze was in the upper part of the screen. This is demonstrated in Figure 10, where the gaps in the gaze data show how the algorithm is led to believe these are two distinct clusters, instead of one (as counted in our manual inspection). In retrospect the algorithm’s output is more objective—although the data seems to belong to a single cluster, we cannot be sure the user did not in fact gaze down and back up in that space of time, to look for the next key to press. To examine whether this might present an overestimation problem, we examined the inter-sample time differences for gaze data ( m i n = 33.333 ms, m a x = 4800.00 ms, x ¯ = 39.165 ms, σ = 60.558 ms). The tight dispersion around the mean ( 95 % c . i . = 0.318 ms) is also demonstrated by the fact that 96% of the data is between the minimum+0.001ms, therefore, at the very worst, we could expect an overestimation of upwards gaze shifts in the order of 4%. We therefore believe that the cluster-based algorithm for detecting the number of upwards gaze shifts is reliable.

5.3. Replicating Study Results

Having addressed the problem of identifying instances of upwards gaze shifting, I sought to replicate some of Jiang et al.’s findings in order to see if the previously described gaze-shift detection methods could approximate the un-described methodology in Jiang et al. For this purpose, the average number of upwards gaze shifts in sentences that contained error correction (i.e., sentences where the Backspace key was pressed at least once) and those that had no error corrections, were examined. The next sections present results with both methods of upwards gaze identification for comparison. For the replication, I chose to focus on the relationship between upwards gazes and the presence of error-correcting behaviour in a sentence, since this aspect did not involve co-analysis of other data (i.e., hand movement).

5.3.1. Frequency of Gaze Shifting per Sentence

Jiang et al. cite a gaze shift mean x ¯ = 3.95 , σ = 1.5 per sentence. With the threshold method, a comparable gaze shift mean x ¯ = 3.69 , σ = 2.29 is found. However, with the cluster-based method, a considerably higher gaze shift mean x ¯ = 5.04 , σ = 2.54 is found.
Considering the breakdown of these findings across sentences with and without error correction, Jiang et al.’s paper does not explicitly mention precise values, but the related figure shows that the mean number of gazes to the text editing area is <5 ( x ¯ S E C 4.8) for sentences with error corrections and <3 ( x ¯ S N E 2.6 ) for those without. Results from the independent work in this paper verifies Jiang et al.’s finding that sentences that contain error corrections have, on average, more gaze shifts to the upper area of the keyboard, with both gaze classification methods. Using the threshold-based method, mean values are at x ¯ S E C = 4.21 , σ = 2.44 (with errors) and x ¯ S N E = 3.01 , σ = 1.87 (no errors), while the cluster-based method shows mean values at x ¯ S E C = 5.73 , σ = 2.63 (errors) and x ¯ S N E = 4.13 , σ = 2.11 (no errors). It is reasonable to conclude that the differences in handling of the raw data led to generally similar, but not quite the same results (Figure 11). The cluster-based method for detecting upwards gazes proposed in this paper suggests that glancing behaviour is more frequent than originally reported by Jiang et al., even in cases where no mistakes are being made.

5.3.2. Gaze Ratio on Keyboard

Another related metric presented in Jiang et al.’s paper is the ratio of gazing spent in the keyboard area. The paper states this was calculated as the duration of gazing at the keyboard, divided by the total trial time, but it offers no insight as to how such periods were identified and measured. I adopted here a slightly different approach, which is to count the number of gazes in the upper/lower areas. Since the inter-gaze timings were found to be more or less identical, this proxy metric is a direct equivalent. Jiang et al.’s paper cites a keyboard gaze time ratio mean x ¯ = 0.70 , σ = 0.14 . With the threshold method, a comparable keyboard gaze time ratio mean was found ( x ¯ = 0.723 , σ = 0.140 ) and similar findings were obtained with the cluster-based method x ¯ = 0.699 , σ = 0.155 .
As before, Jiang et al. do not provide exact values for the breakdown across sentences that contain error corrections and those that do not. From the related figure, the mean number of keyboard gaze time ratio is <0.70 ( x ¯ S E C 0.65) for sentences with error corrections and at around 0.75 ( x ¯ S N E 0.78 ) for those without. Using the threshold-based method, we find mean values at x ¯ S E C = 0.733 , σ = 0.138 (with errors) and x ¯ S N E = 0.710 , σ = 0.143 (no errors), while the cluster-based method shows mean values at x ¯ S E C 0.667 , σ = 0.155 (errors) and x ¯ S N E = 0.740 , σ = 0.145 (no errors), as shown in Figure 12.
Interestingly, it was impossible to reproduce Jiang et al.’s original findings with the proposed thresholding method, but it was possible with the cluster-based method. However, it was found that a smaller percentage of time is actually spent on the keyboard in sentences that contain no errors than was originally proposed. This could be attributed to the fact that more upwards gaze shifts were uncovered in such sentences than originally proposed as well.

5.3.3. Correlation of Gaze Shifts and Errors in a Sentence

Finally, I examined the presence of correlations in the number of upwards gaze shifts and the number of errors made in any sentence. A Spearman’s ρ correlation test, due to the distribution of errors which did not meet normality criteria, showed that a strong and statistically significant correlation can be uncovered with both the thresholding ( ρ = 0.434 , p < 0.001 ) and the cluster-based algorithms ( ρ = 0.510 , p < 0.001 ), as can also be seen in Figure 13.

6. Discussion

Having completed the account of the experience in working with this open dataset, we now turn to the discussion and conclusion of this report. First, aspects from the technical contribution arising from this work will be discussed. Next, I will focus on the comparison of our experiences to those distilled from other computing disciplines, examining them through the lens of open-data practice and theory inspired by engineering. Further, the transferability of findings in these other disciplines to HCI will be outlined. Finally, this section discusses the transferable experiences from this case experience, to the mobile text entry community, and also to the wider HCI community.

6.1. Technical Contribution

Through this work, a technical contribution is made, in demonstrating how biometric data (eye gaze) could be better processed for identifying discrete, vertically separated areas of interest (AOIs) during text entry analysis. The paper presents an algorithm based on unsupervised machine learning techniques (clustering with DBSCAN and k-Means), which is able to better cope with the individual circumstances of participants and potential calibration drift during the experimental use of eye trackers. This method is arguably more robust that the simple practice of statically defining AOI boundaries and, hopefully, it can be used by other researchers in work investigating mobile HCI using eye tracking, and not just text entry. The source code for the implementation of our algorithm in Python is openly provided in Section 7.
A limitation of this contribution rests in the fact that for this case study, the two AOIs were vertically spaced with a significant distance. In the future, it would be interesting to explore how this algorithm might behave under less ideal circumstances (e.g., when the text editing area is placed near the top of the keyboard, as is normal in many commercial smartphone implementations). Nevertheless, the outcome serves to illustrate the opportunities for novel contributions, which are missed due to the low adoption of open science practices in HCI.

6.2. Applying Open Data Recommendations from Other Domains to HCI

Hutchinson et al. [33] modified a set of seven recommendations for engineering models, originally proposed by Alvi [50], by substituting the word dataset for model. The authors argued that these recommendations equally apply to open datasets, but did not go further than to simply list these recommendations, therefore stopping short of providing any commentary on how they might actually apply to a real-world scenario. Maintaining the original wording of these key considerations, I will next comment on their transferability to this case report’s experience with using data openly shared with the mobile text-entry community. This discourse might more clearly illuminate some of the dangers of working with unfamiliar data. Researchers looking to exploit current, and future open datasets in HCI might thus mitigate these risks, by understanding these key recommendations and how they apply to an HCI dataset.
  • “Treat datasets as guilty until proven innocent”. As the initial exploration of the data revealed, the inaccuracies of the equipment (eye tracker) and participant physical positioning made the raw data unsuitable for use as-is. The dataset paper made reference to these issues, but the extent to which they affect the produced data could not have been communicated strongly enough without visualisation. Further, it turned out that the data was not, in any way, sanitised prior to release, and that the lack of promised (but not delivered) processing code made it difficult to determine which, if any, pre-processing needs were needed prior to use. Without this initial exploration, it would have been impossible to identify the rectification steps that needed to be taken.
  • “Identify the assumptions underlying a dataset in writing”. As alluded in Jiang et al.’s paper, though not in an overly overt manner, significant decisions needed to be made in order to decide how to treat data, by exclusion or transformation, and on how the concept of an “upwards gaze” could be quantifiably defined. In order to remove the “guilty” label from the data and the way we treated it, careful justification at every decision point needed to be made, based on statistical data exploration and/or other literature. The preceding account is reflective of this process, which was required in order to get to a stage where data could be actually used.
  • “Conduct independent peer reviews and checks during and after dataset development”. Whilst I am not the creator of the dataset, I was indeed the creator of modifications posed on it. The rationality of the decisions made on how the dataset should be modified were checked with peers who provided good insights and confirmation that they were reasonable.
  • “Evaluate datasets against experience and judgment”. Work on this dataset began by using it “as-is”, perhaps because the data came from a reputable research lab, the paper was published in a highly competitive conference, or because the endeavour started with an exciting idea about how to meet the original aim. The key take-away here is that open datasets are a “wild west”. Peer-review ensures that published papers meet certain quality standards, but the quality of accompanying datasets or code is not reviewed. Given the significant effort required to properly prepare both datasets and accompanying analysis code, and that there is currently next to no benefit for the authors for ensuring this effort is taken, one should err on the side of caution.
  • “Use visualization tools”. Visualisation tools proved to be immensely helpful for understanding the underlying problems with the data, the extent of their effect, and for de-obfuscating the original authors’ assumptions as were presented in the paper. The fact that only two-dimensional data (screen coordinates, or time and vertical coordinate) were needed for the analyses in this paper, significantly contributed to the importance of visualisation in helping to understand the data. More complex datasets might require the co-analysis of k-dimensional data, which can be hard to visualise, unless reduced in dimensionality with techniques such as PCA or tSNE.
  • “Perform sensitivity studies of dataset parameters”. When considering inclusion criteria or transformations to be applied on the original data, it is important to assess, at every step, how the relevant parameters affect the outcome, both in terms of data preservation, and correspondence of data with expected phenomena. The goal should be to minimise data loss, with the assumption that while noise is definitely present in any information signal, the majority of what was captured should be useful information, particularly if it was captured by equipment or methods which are known to be largely reliable under ideal conditions. Simply discarding large volumes of data may lead to future problems in the analysis, such as, in our case, data gaps in the gaze series.
  • “Understand the assumptions and limitations of datasets rather than using them as black boxes”. It is important to have a working knowledge of the methods and equipment used to generate the dataset. First-hand experience is ideally needed, but might be unavailable, particularly for equipment which is uncommonly accessible to researchers. To mitigate the lack of first-hand experience, related work using similar equipment should be sought in literature, and this might be helpful in understanding how data generated from such equipment could suffer from problems.

6.3. Making HCI Datasets Useful, Usable and Used

In [33], a strong argument is made towards the establishment of a framework for the development of datasets to be used in AI/ML research, so that these datasets can be made accountable (Figure 14. This five-phase dataset development lifecycle can lead to improved quality in the final product (considering, of course, the open dataset as an engineered product), by specifying a range of key questions to be addressed at each stage.
After the experience of working with Jiang et al.’s dataset, it is possible to comment on how such a lifecycle framework could be supported by the HCI community at various levels, from the society leadership level (e.g., formally incorporated special interest groups, journal editorial boards, conference steering committees and professional organisations) down to the individual researchers.
  • Dataset requirement specification. HCI researchers who wish to share their data with the community may already be considering questions such as "What properties should the dataset have?" or "Who will it be used by?" when preparing a data release. To improve decisions at this point, I argue that materials released with published papers should be treated as preliminary releases. A formal consultation period in which interested parties could contact them as potential stakeholders should be specified, either as part of the repository infrastructure, or as a promise to the community, in the accompanying paper. It is impossible to foresee all requirements, hence the need for a maintenance stage, but some issues could be easily picked up by experienced community members. For example, while Jiang et al. include a file with the coordinates of each key’s center, the actual dimensions of each key are missing, therefore it is impossible to know if a gaze fell on a particular key area at, or near, the time of touch. Additionally information such as keyboard area size, coordinates of the text editing area, coordinates of the extended device area, font sizes etc., which were not present and had to be estimated from proxy sources (e.g., the paper’s accompanying video), could have been included as requirements.
  • Dataset design. Researchers might address here issues on the operationalisation of the dataset requirements, including questions about data packaging and formats, user anonymity, ethics board approval or lack of human or material resources. The HCI community could help by identifying expert peers who might help with such work. Taking action at this step should address most of the data sharing barriers identified in [25]. As an example, Jiang et al.’s release could have included not just the raw data, but the “cleaned up” versions used in their own analyses, or other data aggregates which might be useful in order to reproduce the paper’s results, assuming that code for this work would not be provided.
  • Dataset implementation. Recipients of the dataset might find themselves asking questions on the design of the dataset, which might well be answered in the accompanying paper (e.g., "How were the data design decisions taken?" or "Why were they done this way?") and not as part of accompanying dataset descriptors. Thus, paper authors should be mindful that such questions might arise during use of their dataset, and pre-emptively work to address them while writing the paper (or, post- peer review). Alternatively, such questions and answers could be enumerated in readme files alongside the data, since often papers are tight for space. Associate chairs, editors and reviewers for such papers should make explicit comment on whether they feel the paper contains enough clarity on how data was pre-processed and sanitised prior to use. In papers such as Jiang et al’s., implementation accounts are limited to readme files which contain brief data descriptors, but more detail about how data was generated, kept, or why it is missing, as seen in our own exploration, would be useful in guiding further work.
  • Dataset testing. Authors might be reluctant to release all the source code for analysing the dataset, as after all properly formatting and commenting code, which is often developed in a “hacky” way for the purposes of a publication, is a significant effort. However, releasing even parts of the processing code, perhaps just enough so that another researcher can verify at least one or some of the findings, could go a long way towards helping the reproduction of the results, or further investigation of the data. We argue that a minimal set of processing code should be mandatorily included with any dataset. Paper chairs or ACs should check that these are readily available to the general public at the time of submission of the camera-ready paper. As noted, it was with some disappointment that we discovered that processing code was not available for Jiang et al.’s paper, even though it was promised in the paper itself.
  • Dataset maintenance. Other questions, particularly those relating to data maintenance, probably go largely unanswered after publication. Ideally, datasets should be immutable, but errors could be discovered by others at any time. Data providers should have a way to incorporate these into the publicly released dataset (e.g., through versioning), as well as to coalesce data processing code or other related materials that the community might offer, alongside their own. A data maintenance plan is important as contact authors are often doctoral students whose academic emails may cease to work after graduation. Replication of the original datasets by other researchers could increase availability and integrity of the data, but ideally the publishing organisations (professional societies and journals) and/or host institutions or companies, should facilitate dataset archival and maintenance as part of services they already offer to authors. With reference to Jiang et al.’s material, the primary author seems to have dropped off the academic radar, so to speak. Open releases should have a clearly labelled contact person and contact details, with at least one alternative contact. Given the release of the data in a static website at the University of Aalto, there is no possibility for versioning, issue reporting or addition of third-party material and resources by other researchers. In this sense, a release through repositiories such as GitHub, Zenodo or OSF would help in alleviating such problems.

6.4. Implications for the HCI Community

In [24], an argument towards the pre-registration of HCI experiments is made, in order to decrease the publication biases and drawer effects in HCI research. The authors argue that strong organisational and steering committee/editorial board support for this is necessary. I agree that this is strongly necessary, in order to facilitate the adoption of the lifecycle model described in the previous section. For the subject of datasets and related material, organisational support not just by journal publishers but also by the professional societies that run the leading conferences in the field would be invaluable. I would add the suggestion that alternations to the handling of papers that come with accompanying source material, are also needed. As discovered in this paper, despite the excellent writing by Jiang et al., many of the authors’ assumptions and decisions while handling the data, remained obscure. This is understandable, since papers focus on the results, rather than details of the technical implementation.
In the current practice and timeframes of reviewing, it would be practically impossible for any reviewer to pick up on emergent open data issues without working on the data themselves. It can be argued that journals and conferences should include a special track for p a p e r + d a t a submissions, in which the authors provide at least some sample analysis code along with their data, and reviewers are allowed additional time for verifying some of the findings, or inspecting the logic by which these findings were derived. To ensure recognition is provided, publishers could assign DOIs to datasets and count them as discrete publications. Various related awards could also be established to promote and encourage compliance (e.g., ’best dataset’, ’high-quality dataset’, ’open science certification’ etc.).

6.5. Implications for the Mobile Text Entry Community

In the context of HCI research, this accountability relates heavily to the credibility of work proposed, and the maximisation of value offered to the community through the release of resources such as data and code. The HCI community may struggle to specify generic frameworks that might fit all types of research practice, but within specific sub-communities (e.g., the mobile text entry community), closer coordination by key researchers could produce a solid framework on which others could follow. The text entry community is well-placed to lead by example, for the following reasons:
  • The target metrics used (e.g., WPM, KSPC, error rates) are common across most papers, and the data needed to derive these is more or less the same (keystroke data). It is plausibly feasible to derive a commonly agreed specification on the format which every text-entry prototype should produce its keystroke data in. Researchers could undertake the responsibility to ensure adherence to this data standard with any prototype they produce.
  • Metadata that describe the experiments could also easily be standardised. Most text-entry research uses the transcription task as its de-facto tool, therefore participant descriptions, condition descriptions, phrasesets and other aspects of experiment design can be standardised.
  • There already exist a range of experimental tools which could help towards the reduction of time needed to adhere to such standards. For example, WebTEM [51] provides a web-based interface in which to run keyboard-independent transcription task experiments in lab experiments, negating the need for applications to do their own logging. For field experiments, Wildkey [3] and ResearchIME [52] are two examples of privacy-preserving smartphone keyboards that could be commonly used. All are maintened by highly active members of the community, who could adapt their code to adhere to these standards.
  • A repository for the registration and archival of experiment data can be easily and quickly developed without formal support from a professional society or publisher. In fact, such a system could be community-administered and self-hosting could attract submissions from authors who publish with other reputable conferences or journals outside leading outlets for related scientific research.

7. Conclusions

While the movement towards open data and code sharing in HCI research is gaining ground, there remain significant barriers to making this practice mainstream. This paper presented a detailed account of the experience of using openly available data, the problems encountered while exploring this unfamiliar dataset, and the strategies used to handle the data appropriately for the purposes of further research. Under the frameworks proposed by [24,33], a set of guidelines for researchers wishing to make use of currently available data is proposed. The paper also makes recommendations about how publications accompanied by data and code might be treated in the future by professional societies and publishers. For the mobile text entry community, which is the focus of much of this work, this paper proposes a set of concrete actions that can be taken either immediately or in the near future, to facilitate the sharing of data between the community, and to produce best-practice guidelines that could serve other HCI communities.

Funding

This research received no external funding.

Data Availability Statement

Data was obtained from the University of Aalto website and are available at https://userinterfaces.aalto.fi/how-we-type-mobile/ (accessed 10 August 2022). The Python implementation of Algorithm 1, as well as code related to the sanitation and transformation of data as described in Section 4 is available at https://github.com/komis1/eyegaze-touch-processing accessed on 10 August 2022. A copy of the sanitised and transformed original data, according to Section 4 and as used in this study, is also available in the same repository as the code.

Acknowledgments

I am immensely grateful to all authors in Jiang et al. [1] for their significant contribution to the field of mobile text entry, and the generous release of their data to the public. Despite use of their work as the focus of this paper, which, in places, includes a critical discussion of errors or omissions in their work, I remain deeply appreciative of their pioneering effort and grateful that it has enabled mine.

Conflicts of Interest

The authors declare no conflict of interest.

References

  1. Jiang, X.; Li, Y.; Jokinen, J.P.; Hirvola, V.B.; Oulasvirta, A.; Ren, X. How We Type: Eye and Finger Movement Strategies in Mobile Typing. In Proceedings of the 2020 CHI Conference on Human Factors in Computing Systems, Honolulu, HI, USA, 25–30 April 2020; Association for Computing Machinery: New York, NY, USA, 2020; pp. 1–14. [Google Scholar]
  2. Yi, X.; Wang, C.; Bi, X.; Shi, Y. PalmBoard: Leveraging Implicit Touch Pressure in Statistical Decoding for Indirect Text Entry. In Proceedings of the 2020 CHI Conference on Human Factors in Computing Systems, Honolulu, HI, USA, 25–30 April 2020; Association for Computing Machinery: New York, NY, USA, 2020; pp. 1–13. [Google Scholar]
  3. Rodrigues, A.; Santos, A.R.; Montague, K.; Nicolau, H.; Guerreiro, T. WildKey: A Privacy-Aware Keyboard Toolkit for Data Collection In-The-Wild. In Adjunct Proceedings of the 2021 ACM International Joint Conference on Pervasive and Ubiquitous Computing and Proceedings of the 2021 ACM International Symposium on Wearable Computers; Association for Computing Machinery: New York, NY, USA, 2021; pp. 542–545. [Google Scholar]
  4. Arif, A.S.; Stuerzlinger, W. Analysis of Text Entry Performance Metrics. In Proceedings of the 2009 IEEE Toronto International Conference Science and Technology for Humanity (TIC-STH), Toronto, ON, Canada, 26–27 September 2009; pp. 100–105. [Google Scholar] [CrossRef]
  5. Banovic, N.; Sethapakdi, T.; Hari, Y.; Dey, A.K.; Mankoff, J. The Limits of Expert Text Entry Speed on Mobile Keyboards with Autocorrect. In Proceedings of the 21st International Conference on Human-Computer Interaction with Mobile Devices and Services, MobileHCI’19, New York, NY, USA, 1–4 October 2019; Association for Computing Machinery: New York, NY, USA, 2019; pp. 1–12. [Google Scholar] [CrossRef]
  6. Komninos, A.; Dunlop, M.; Katsaris, K.; Garofalakis, J. A Glimpse of Mobile Text Entry Errors and Corrective Behaviour in the Wild. In Proceedings of the 20th International Conference on Human-Computer Interaction with Mobile Devices and Services Adjunct, MobileHCI’18, Barcelona, Spain, 3–6 September 2018; Association for Computing Machinery: New York, NY, USA, 2018; pp. 221–228. [Google Scholar] [CrossRef]
  7. Palin, K.; Feit, A.M.; Kim, S.; Kristensson, P.O.; Oulasvirta, A. How Do People Type on Mobile Devices? Observations from a Study with 37,000 Volunteers. In Proceedings of the 21st International Conference on Human-Computer Interaction with Mobile Devices and Services, MobileHCI’19, New York, NY, USA, 1–4 October 2019; Association for Computing Machinery: New York, NY, USA, 2019; pp. 1–12. [Google Scholar] [CrossRef]
  8. Alharbi, O.; Stuerzlinger, W.; Putze, F. The Effects of Predictive Features of Mobile Keyboards on Text Entry Speed and Errors. Proc. ACM Hum. Interact. 2020, 4, 183:1–183:16. [Google Scholar] [CrossRef]
  9. Papoutsaki, A.; Gokaslan, A.; Tompkin, J.; He, Y.; Huang, J. The Eye of the Typer: A Benchmark and Analysis of Gaze Behavior during Typing. In Proceedings of the 2018 ACM Symposium on Eye Tracking Research & Applications, ETRA’18, Warsaw, Poland, 14–17 June 2018; Association for Computing Machinery: New York, NY, USA, 2018; pp. 1–9. [Google Scholar] [CrossRef]
  10. Feit, A.M.; Weir, D.; Oulasvirta, A. How We Type: Movement Strategies and Performance in Everyday Typing. In Proceedings of the 2016 CHI Conference on Human Factors in Computing Systems, CHI ’16, San Jose, CA, USA, 7–12 May 2016; Association for Computing Machinery: New York, NY, USA, 2016; pp. 4262–4273. [Google Scholar] [CrossRef]
  11. Wang, J.; Fu, E.Y.; Ngai, G.; Leong, H.V. Investigating Differences in Gaze and Typing Behavior Across Age Groups and Writing Genres. In Proceedings of the 2019 IEEE 43rd Annual Computer Software and Applications Conference (COMPSAC), Milwaukee, WI, USA, 15–19 July 2019; Volume 1, pp. 622–629. [Google Scholar] [CrossRef]
  12. Wang, J.; Fu, E.Y.; Ngai, G.; Leong, H.V. Investigating Differences in Gaze and Typing Behavior Across Writing Genres. Int. J. Hum. Comput. Interact. 2021, 38, 541–561. [Google Scholar] [CrossRef]
  13. Al-Khalifa, H.S.; Al-Mohsin, M.; Al-Twaim, M.; Al-Razgan, M.S. Soft Keyboard UX Evaluation: An Eye Tracking Study. In Proceedings of the 6th International Conference on Management of Emergent Digital EcoSystems, MEDES ’14, Buraidah Al Qassim, Saudi Arabia, 15–17 September 2014; Association for Computing Machinery: New York, NY, USA, 2014; pp. 78–84. [Google Scholar] [CrossRef]
  14. Valliappan, N.; Dai, N.; Steinberg, E.; He, J.; Rogers, K.; Ramachandran, V.; Xu, P.; Shojaeizadeh, M.; Guo, L.; Kohlhoff, K.; et al. Accelerating Eye Movement Research via Accurate and Affordable Smartphone Eye Tracking. Nat. Commun. 2020, 11, 4553. [Google Scholar] [CrossRef]
  15. Kim, H.; Yi, S.; Yoon, S.Y. Exploring Touch Feedback Display of Virtual Keyboards for Reduced Eye Movements. Displays 2019, 56, 38–48. [Google Scholar] [CrossRef]
  16. Putze, F.; Ihrig, T.; Schultz, T.; Stuerzlinger, W. Platform for Studying Self-Repairing Auto-Corrections in Mobile Text Entry Based on Brain Activity, Gaze, and Context. In Proceedings of the 2020 CHI Conference on Human Factors in Computing Systems, Honolulu, HI, USA, 25–30 April 2020; Association for Computing Machinery: New York, NY, USA, 2020; pp. 1–13. [Google Scholar]
  17. Pasquetto, I.V.; Sands, A.E.; Darch, P.T.; Borgman, C.L. Open Data in Scientific Settings: From Policy to Practice. In Proceedings of the 2016 CHI Conference on Human Factors in Computing Systems, CHI’16, San Jose, CA, USA, 7–12 May 2016; Association for Computing Machinery: New York, NY, USA, 2016; pp. 1585–1596. [Google Scholar] [CrossRef]
  18. Kay, M.; Haroz, S.; Guha, S.; Dragicevic, P. Special Interest Group on Transparent Statistics in HCI. In Proceedings of the 2016 CHI Conference Extended Abstracts on Human Factors in Computing Systems, CHI EA’16, San Jose, CA, USA, 7–12 May 2016; Association for Computing Machinery: New York, NY, USA, 2016; pp. 1081–1084. [Google Scholar] [CrossRef]
  19. Chuang, L.L.; Pfeil, U. Transparency and Openness Promotion Guidelines for HCI. In Proceedings of the Extended Abstracts of the 2018 CHI Conference on Human Factors in Computing Systems, CHI EA’18, Montreal, QC, Canada, 21–26 April 2018; Association for Computing Machinery: New York, NY, USA, 2018; pp. 1–4. [Google Scholar] [CrossRef]
  20. Echtler, F.; Häußler, M. Open Source, Open Science, and the Replication Crisis in HCI. In Proceedings of the Extended Abstracts of the 2018 CHI Conference on Human Factors in Computing Systems, CHI EA’18, Montreal, QC, Canada, 21–26 April 2018; Association for Computing Machinery: New York, NY, USA, 2018; pp. 1–8. [Google Scholar] [CrossRef]
  21. Banovic, N. To Replicate or Not to Replicate? Getmobile Mob. Comput. Commun. 2016, 19, 23–27. [Google Scholar] [CrossRef]
  22. Hornbæk, K.; Sander, S.S.; Bargas-Avila, J.A.; Grue Simonsen, J. Is Once Enough?On the Extent and Content of Replications in Human-Computer Interaction. In Proceedings of the SIGCHI Conference on Human Factors in Computing Systems, CHI’14, Toronto, ON, Canada, 26 April–1 May 2014; Association for Computing Machinery: New York, NY, USA, 2014; pp. 3523–3532. [Google Scholar] [CrossRef]
  23. Wilson, M.L.L.; Resnick, P.; Coyle, D.; Chi, E.H. RepliCHI: The Workshop. In Proceedings of the CHI ’13 Extended Abstracts on Human Factors in Computing Systems, CHI EA’13, Paris, France, 27 April–2 May 2013; Association for Computing Machinery: New York, NY, USA, 2013; pp. 3159–3162. [Google Scholar] [CrossRef]
  24. Cockburn, A.; Gutwin, C.; Dix, A. HARK No More: On the Preregistration of CHI Experiments. In Proceedings of the 2018 CHI Conference on Human Factors in Computing Systems, Montreal, QC, Canada, 21–26 April 2018; Association for Computing Machinery: New York, NY, USA, 2018; pp. 1–12. [Google Scholar]
  25. Wacharamanotham, C.; Eisenring, L.; Haroz, S.; Echtler, F. Transparency of CHI Research Artifacts: Results of a Self-Reported Survey. In Proceedings of the 2020 CHI Conference on Human Factors in Computing Systems, Honolulu, HI, USA, 25–30 April 2020; Association for Computing Machinery: New York, NY, USA, 2020; pp. 1–14. [Google Scholar]
  26. Cockburn, A.; Dragicevic, P.; Besançon, L.; Gutwin, C. Threats of a Replication Crisis in Empirical Computer Science. Commun. ACM 2020, 63, 70–79. [Google Scholar] [CrossRef]
  27. Ballou, N.; Warriar, V.R.; Deterding, S. Are You Open? A Content Analysis of Transparency and Openness Guidelines in HCI Journals. In Proceedings of the 2021 CHI Conference on Human Factors in Computing Systems, CHI’21, Yokohama, Japan, 8–13 May 2021; Association for Computing Machinery: New York, NY, USA, 2021; pp. 1–10. [Google Scholar] [CrossRef]
  28. Feger, S.S.; Dallmeier-Tiessen, S.; Woźniak, P.W.; Schmidt, A. The Role of HCI in Reproducible Science: Understanding, Supporting and Motivating Core Practices. In Proceedings of the Extended Abstracts of the 2019 CHI Conference on Human Factors in Computing Systems, CHI EA’19, Glasgow, UK, 4–9 May 2019; Association for Computing Machinery: New York, NY, USA, 2019; pp. 1–6. [Google Scholar] [CrossRef]
  29. Feger, S.S.; Woźniak, P.W.; Niess, J.; Schmidt, A. Tailored Science Badges: Enabling New Forms of Research Interaction. In Proceedings of the Designing Interactive Systems Conference 2021, DIS’21, Virtual Event, 28 June–2 July 2021; Association for Computing Machinery: New York, NY, USA, 2021; pp. 576–588. [Google Scholar] [CrossRef]
  30. Jiao, C.; Li, K.; Fang, Z. Data Sharing Practices across Knowledge Domains: A Dynamic Examination of Data Availability Statements in PLOS ONE Publications. J. Inf. Sci. 2022. [Google Scholar] [CrossRef]
  31. Tedersoo, L.; Küngas, R.; Oras, E.; Köster, K.; Eenmaa, H.; Leijen, Ä.; Pedaste, M.; Raju, M.; Astapova, A.; Lukner, H.; et al. Data Sharing Practices and Data Availability upon Request Differ across Scientific Disciplines. Sci. Data 2021, 8, 192. [Google Scholar] [CrossRef] [PubMed]
  32. Rouder, J.N. The What, Why, and How of Born-Open Data. Behav. Res. Methods 2016, 48, 1062–1069. [Google Scholar] [CrossRef] [PubMed]
  33. Hutchinson, B.; Smart, A.; Hanna, A.; Denton, E.; Greer, C.; Kjartansson, O.; Barnes, P.; Mitchell, M. Towards Accountability for Machine Learning Datasets: Practices from Software Engineering and Infrastructure. In Proceedings of the 2021 ACM Conference on Fairness, Accountability, and Transparency, FAccT’21, Toronto, ON, Canada, 3–10 March 2021; Association for Computing Machinery: New York, NY, USA, 2021; pp. 560–575. [Google Scholar] [CrossRef]
  34. Feger, S.S.; Wozniak, P.W.; Lischke, L.; Schmidt, A. ‘Yes, I Comply!’: Motivations and Practices around Research Data Management and Reuse across Scientific Fields. Proc. ACM -Hum. Interact. 2020, 4, 141:1–141:26. [Google Scholar] [CrossRef]
  35. Vertesi, J.; Dourish, P. The Value of Data: Considering the Context of Production in Data Economies. In Proceedings of the ACM 2011 Conference on Computer Supported Cooperative Work, CSCW ’11, Hangzhou, China, 19–23 March 2011; Association for Computing Machinery: New York, NY, USA, 2011; pp. 533–542. [Google Scholar] [CrossRef]
  36. Kjeldskov, J.; Paay, J. A Longitudinal Review of Mobile HCI Research Methods. In Proceedings of the 14th International Conference on Human-computer Interaction with Mobile Devices and Services, MobileHCI’12, San Francsico, CA, USA, 21–24 September 2012; Association for Computing Machinery: New York, NY, USA, 2012; pp. 69–78. [Google Scholar] [CrossRef]
  37. Nachtigall, T.; Tetteroo, D.; Markopoulos, P. A Five-Year Review of Methods, Purposes and Domains of the International Symposium on Wearable Computing. In Proceedings of the 2018 ACM International Symposium on Wearable Computers, ISWC’18, Singapore, 8–12 October 2018; Association for Computing Machinery: New York, NY, USA, 2018; pp. 48–55. [Google Scholar] [CrossRef]
  38. Caine, K. Local Standards for Sample Size at CHI. In Proceedings of the 2016 CHI Conference on Human Factors in Computing Systems, CHI’16, San Jose, CA, USA, 7–12 May 2016; Association for Computing Machinery: New York, NY, USA, 2016; pp. 981–992. [Google Scholar] [CrossRef]
  39. Dragicevic, P. Fair Statistical Communication in HCI. In Modern Statistical Methods for HCI; Robertson, J., Kaptein, M., Eds.; Human–Computer Interaction Series; Springer International Publishing: Cham, Switzerland, 2016; pp. 291–330. [Google Scholar] [CrossRef]
  40. Kay, M.; Haroz, S.; Guha, S.; Dragicevic, P.; Wacharamanotham, C. Moving Transparent Statistics Forward at CHI. In Proceedings of the 2017 CHI Conference Extended Abstracts on Human Factors in Computing Systems, Denver, CO, USA, 6–11 May 2017. [Google Scholar]
  41. Crowe, S.; Cresswell, K.; Robertson, A.; Huby, G.; Avery, A.; Sheikh, A. The Case Study Approach. BMC Med. Res. Methodol. 2011, 11, 100. [Google Scholar] [CrossRef] [PubMed]
  42. Stake, R.E. The Art of Case Study Research; SAGE: Newcastle upon Tyne, UK, 1995. [Google Scholar]
  43. Flyvbjerg, B. Five Misunderstandings About Case-Study Research. Qual. Inq. 2006, 12, 219–245. [Google Scholar] [CrossRef]
  44. Hammersley, M.; Foster, P.; Gomm, R. Case Study and Generalisation; Sage: London, UK, 2000; pp. 98–115. [Google Scholar]
  45. Steinberg, P.F. Can We Generalize from Case Studies? Glob. Environ. Politics 2015, 15, 152–175. [Google Scholar] [CrossRef]
  46. Tsang, E.W. Generalizing from Research Findings: The Merits of Case Studies. Int. J. Manag. Rev. 2014, 16, 369–383. [Google Scholar] [CrossRef]
  47. Anderson, C.; Hübener, I.; Seipp, A.K.; Ohly, S.; David, K.; Pejovic, V. A Survey of Attention Management Systems in Ubiquitous Computing Environments. Proc. ACM Interact. Mob. Wearable Ubiquitous Technol. 2018, 2, 58:1–58:27. [Google Scholar] [CrossRef]
  48. Komninos, A.; Nicol, E.; Dunlop, M.D. Designed with Older Adults to SupportBetter Error Correction in SmartPhone Text Entry: The MaxieKeyboard. In Proceedings of the 17th International Conference on Human-Computer Interaction with Mobile Devices and Services Adjunct, MobileHCI’15, Copenhagen, Denmark, 24–27 August 2015; Association for Computing Machinery: New York, NY, USA, 2015; pp. 797–802. [Google Scholar] [CrossRef]
  49. Shah, S.; Jain, A. Impact of the COVID-19 Pandemic on User Experience (UX) Research. In Proceedings of the HCI International 2021—Posters; Stephanidis, C., Antona, M., Ntoa, S., Eds.; Springer International Publishing: Cham, Switzerland, 2021; Communications in Computer and Information Science; pp. 599–607. [Google Scholar] [CrossRef]
  50. Alvi, I.A. Engineers Need to Get Real, But Can’t: The Role of Models. In Proceedings of the Structures Congress, Pittsburgh, PA, USA, 2–4 May 2013; pp. 916–927. [Google Scholar] [CrossRef]
  51. Arif, A.S.; Mazalek, A. WebTEM: A Web Application to Record Text Entry Metrics. In Proceedings of the 2016 ACM International Conference on Interactive Surfaces and Spaces, ISS ’16, Niagara Falls, ON, Canada, 6–9 November 2016; Association for Computing Machinery: New York, NY, USA, 2016; pp. 415–420. [Google Scholar] [CrossRef]
  52. Buschek, D.; Bisinger, B.; Alt, F. ResearchIME: A Mobile Keyboard Application for Studying Free Typing Behaviour in the Wild. In Proceedings of the 2018 CHI Conference on Human Factors in Computing Systems, Montreal, QC, Canada, 21–26 April 2018; Association for Computing Machinery: New York, NY, USA, 2018; pp. 1–14. [Google Scholar]
Figure 1. 2D-histogram (top) and scatter plot (bottom) of raw gaze data, as found in Jiang et al.’s dataset.
Mti 06 00071 g001
Figure 2. 2D-histogram of raw gaze data (left) and touch data (right), showing the misalignment between keyboard areas covered visually and by touch.
Mti 06 00071 g002
Figure 3. Percentage of gaze data within device boundaries after shifting at each linear step (top). The orange line shows optimal shifting at 460 px to the left. Results of the shifting at the optimal point are shown with raw gaze points and 2D-histogram visualisations (left: original data, right: after shift).
Mti 06 00071 g003
Figure 4. Keyboard area covered visually and by touch, in the original dataset (left) and after shifting at the optimal point (right).
Mti 06 00071 g004
Figure 5. Keyboard touches and gazes for a single user, after transformation of gaze coordinates. Touchpoints are colorised according to the corresponding key they were mapped to, while gaze data is show in blue crosses.
Mti 06 00071 g005
Figure 6. Text editing area and phrase set bounding boxes.
Mti 06 00071 g006
Figure 7. Example of a user’s typing and vertical gaze position timeline. The vertical bounds of the keyboard and text editing area are marked with blue lines. The threshold for classifying upwards gazes is shown with the orange dotted line.
Mti 06 00071 g007
Figure 8. Illustration of the threshold set at 971 px (dotted line) separating the main gaze clusters.
Mti 06 00071 g008
Figure 9. Example of the results from the DBSCAN clustering process (multicoloured clusters) and k-Means clustering of the mean vertical coordinate of the DBSCAN clusters (red and blue dots).
Mti 06 00071 g009
Figure 10. Example of gaze clusters in the upper area and missing gaze data between them.
Mti 06 00071 g010
Figure 11. Number of gaze shifts from the keyboard to the text area in Jiang et al.’s paper, and with our two detection algorithms.
Mti 06 00071 g011
Figure 12. Gaze ratio spent on the keyboard area in Jiang at al.’s paper, and with our two detection algorithms.
Mti 06 00071 g012
Figure 13. 2D histogram and regression lines showing the correlation between the number of errors and gaze shifts ina sentence.
Mti 06 00071 g013
Figure 14. A lifecycle model for the production and release of open datasets, adapted from Hutchinson et al. [33].
Mti 06 00071 g014
Publisher’s Note: MDPI stays neutral with regard to jurisdictional claims in published maps and institutional affiliations.

