Article

Developing Dynamic Audio Navigation UIs to Pinpoint Elements in Tactile Graphics

1
Inventivio GmbH, 90402 Nürnberg, Germany
2
Computer Vision for Human-Computer Interaction Lab, Karlsruhe Institute of Technology, 76131 Karlsruhe, Germany
3
Institute of Cognitive Science, Osnabrück University, 49090 Osnabrück, Germany
4
Institute of Neurophysiology & Pathophysiology, University Medical Center Hamburg-Eppendorf, 20246 Hamburg, Germany
*
Author to whom correspondence should be addressed.
Multimodal Technol. Interact. 2022, 6(12), 113; https://doi.org/10.3390/mti6120113
Submission received: 19 October 2022 / Revised: 28 November 2022 / Accepted: 14 December 2022 / Published: 18 December 2022

Abstract

:
Access to complex graphical information is essential when connecting blind and visually impaired (BVI) people with the world. Tactile graphics readers enable access to graphical data through audio-tactile user interfaces (UIs), but these have yet to mature. A challenging task for blind people is locating specific elements–areas in detailed tactile graphics. To this end, we developed three audio navigation UIs that dynamically guide the user’s hand to a specific position using audio feedback. One is based on submarine sonar sounds, another relies on the target’s coordinate plan x and y-axis, and the last uses direct voice instructions. The UIs were implemented in the Tactonom Reader device, a new tactile graphic reader that enhances swell paper graphics with pinpointed audio explanations. To evaluate the effectiveness of the three different dynamic navigation UIs, we conducted a within-subject usability test that involved 13 BVI participants. Beyond comparing the effectiveness of the different UIs, we observed and recorded the interaction of the visually impaired participants with the different navigation UI to further investigate their behavioral patterns during the interaction. We observed that user interfaces that required the user to move their hand in a straight direction were more likely to provoke frustration and were often perceived as challenging for blind and visually impaired people. The analysis revealed that the voice-based navigation UI guides the participant the fastest to the target and does not require prior training. This suggests that a voice-based navigation strategy is a promising approach for designing an accessible user interface for the blind.

1. Introduction

Enabling blind and visually impaired people to perceive and interact with two-dimensional data such as images, graphs, tables, flow charts, formulas, web pages, and floor plans is a complex challenge. Some assistive technologies enable access to text elements and simple information, such as the typical braille readers and screen reader software. Although this technology allows access to text elements, it does not grant access to graphical information presented in standard graphical user interfaces (GUIs). To access two-dimensional data, blind people, rely on tactile printed graphics paired with audio descriptions of the corresponding material. Nevertheless, more than this approach is needed to present more complex graphical data, such as graphics with numerous elements or data that dynamically change by user interactions in real time.
New technologies have emerged to enable the blind community to access complex audio-tactile graphics. Tactile graphics readers and two-dimensional (2D) refreshable braille readers can dynamically present graphics to blind people. Tactile graphics readers combine tactile information of graphics (swell paper and braille paper) with audio feedback. Audio enables information representation dynamically since tactile paper cannot be updated based on the user’s input, while audio can. Two-dimensional (2D) refreshable braille readers or 2D refreshable tactile devices use audio feedback and refreshable tactile pins (raised up and down) distributed on a two-dimensional surface. In the past years, these have received much attention [1,2], especially regarding developing mechanisms to raise and lower the tactile pins. Nevertheless, user interface design in this emerging technology has not yet matured and still faces challenging obstacles, such as information overload, the Midas-touch effect, and audio-tactile synthesis [3,4,5,6,7]. To advance with tactile graphics readers and 2D refreshable braille readers it is necessary to explore and validate key aspects of audio-tactile user interfaces systematically.
A key user interface challenge when interacting with detailed audio-tactile graphics is locating specific tactile elements within a vast number of elements represented in the tactile surface or paper. In a not-alone environment, sighted people, can move the blind person’s finger to the target element. However, when no human support is available, blind people rely on other alternatives. The usual strategy used by blind people is trial and error, exploring each element at a time by perceiving its tactile textures and audio descriptions. This strategy enhances free exploration and autonomy for the user, but it is not ideal in all situations. For more complex graphics with a vast number of elements, the strategy is not ideal since it takes time and effort to find a specific element or detail that the user wants to find in the big cluster of information. For instance, in some graphics, tactile elements might be placed so closely together that they are often perceived as an individual larger element. To avoid user frustration with an overload of information, some tactile graphics might therefore contain less overall information. Another solution would be the use of braille labels for each graphic element. However, braille text is not downscalable and takes up considerable space. Braille writing can be impractical given a high number of elements and a surface with a limited size.
To overcome this problem, we developed dynamic audio navigation user interfaces that use sound cues to guide the user’s hand to a specific element or position in complex tactile graphics. Navigating to a position in the graphic is also important to explore areas of the graphic that do not have a distinguishable tactile representation. Therefore, it can be difficult for the user to guess whether a particular position contains any information. By addressing this challenge, we aim to contribute to developing tactile graphics readers and 2D refreshable braille readers, as both technologies could implement the proposed navigation user interfaces (UIs). With the help of 2 BVI workers from Inventivio GmbH and following a user-centered design approach, we designed three pinpoint navigation UIs. One is based on submarine-radar sonification navigation (sonar-based), one streams audio solely on the coordinate plan x and y-axis of the target element (axis-based), and the last uses direct speech instruction commands (voice-based). These design choices are relevant to the BVI community since sonification, and speech-based UIs are often used in assistive technologies that enhance tactile graphics access for BVI [8,9,10,11]. The three user interfaces were implemented in the Tactonom Reader device of Inventivio GmbH and evaluated with 13 blind and visually impaired participants. Beyond comparing the strategies, we looked for interesting interactions and patterns that indicate how blind participants use audio navigation user interfaces.
In summary, we make the following contributions in this paper:
  • We developed three dynamic audio navigation user interfaces for pinpointing elements in tactile graphic readers and 2D refreshable braille readers.
  • We evaluated the different navigation user interfaces in the form of user studies with blind and visually impaired participants, adding standardization to locate elements in complex tactile graphics.
  • We investigated blind and visually impaired people’s common practices, strategies and obstacles when locating elements in dynamic tactile graphic readers.

2. Related Work

Before designing the navigation user interfaces, we reviewed the previous literature on how assistive technology assists BVI in locating elements in tactile surfaces. As tactile graphic readers are still emerging, it is not surprising that only a few studies have investigated them. For this reason, we extended our literature analysis to other assistive technologies, including touch screens without tactile graphics and 2D braille displays.

2.1. Touch Screens

The most common method for BVI people to locate graphic elements in touch screens is the trial and error strategy. Users explore visual elements individually with touch by requesting additional audio information [9,12] or receiving vibration feedback [13]. However, BVI pointed out that a user interface to pinpoint elements in touch screens would be helpful [9].
Some have implemented extra hardware components to enhance element location in touch screens. Moreover, 3D-printed textural overlays with cutouts on smartphones can allow fast access to elements with audio annotations [14]. However, the user must go through each cutout to find the target. Others have designed software navigation user interfaces to assist BVI in locating elements in touch screens. In [11], the authors developed a user interface that uses four voice commands (top, bottom, left, right) to guide BVI to specific positions on large touch screens. Some did not develop a feature that directly guides the user to one element but a context of the user position in the whole touch screen by using stereo sounds and frequency changes to delineate the x and y position, respectively [15]. Another approach is to use 3D spatial audio [16]. Users would hear the sound associated with the graphic elements through headphones within a fixed radius of the finger’s position. Nevertheless, this approach’s reliability decreases for graphics with more details, overloading users with multiple sounds from several graphic elements.
We also investigated navigation UIs used in other domains, such as aiding blind people in positioning and aiming the camera to a specific position [17,18,19], or guiding the user to the location of other elements in tactile graphics, for instance, QR-codes [20]. These approaches used sonification and speech-based user interfaces.

2.2. 2D Braille Displays

We looked at navigation UIs that help BVI people to find graphic elements in two-dimensional braille readers. Some devices use hardware mechanisms to pinpoint elements in the tactile braille surface, while others use different representations and user interfaces that assist this task. Graille is a 2D braille display with a touch auxiliary guide slider 10 mm above the braille matrix surface [21]. The users insert their finger into the guide slider, and the slider moves on a two-dimensional plane above the pin matrix to the correct element location. Although this method is precise, it is constrained by the hardware mechanism, working exclusively on the Graille device and not being scaled to other technology-family devices. Moreover, the guide slider only allows the insertion of one finger, making it impossible to explore with multiple fingers, which restricts the tactile contextualization for blind users. The HyperBraille project developed user interfaces that enabled zooming-panning operations and different view types for tactile graphics represented in 2D braille displays [22]. The zoom and panning interfaces facilitate the location of elements by representing fewer elements on the tactile surface as the user zooms in on the graphic [23]. The HyperBraille project also developed a highlight operation UI that spotlights an element by blinking the pins around it [24]. The previous UIs facilitate the exploration but do not wholly guide the user’s fingertip to the target element. The zoom UI requires free user exploration to locate elements, and the blinking pin UI implies that the device has a high refreshment rate to allow such an interface, which is not supported for most 2D braille readers [7].

2.3. Tactile Graphic Readers

As with touch screens, the most common method for BVI people to locate elements in tactile graphics is the trial and error strategy. Users explore tactile elements one by one with touch/speech input by requesting additional audio descriptions and reading braille labels. BVI users use this approach in tactile graphic readers [25,26,27,28,29,30,31,32]. However, other tactile graphic readers implemented user interfaces, including hardware and software, to assist in element pinpointing in tactile graphics.
In [33], the authors presented an audio-guided element search using two sounds (axis X and Y) for the TPad system, a tactile graphic reader. The user slides his finger vertically and then horizontally on the tactile graphic. The corresponding sound frequency (X or Y) increases as the user moves closer to the target. Others used sonification UIs inspired by a car parking aid, where audio frequency increased as the user moved closer to the target [34].
Some implemented additional hardware user interfaces to help BVI people to locate elements. In [35], the authors developed a system that uses dynamic magnetic tactile markers that move to specific locations in tactile graphics placed on top of electromagnetic coil arrays. This approach’s limitations are restricted precision in placing markers on the coil array and the impossibility of scaling this technology to other tactile graphic readers. Another navigation interface alternative is to use additional hand-wearable technologies that implement haptic feedback during pinpointing interactions [8,36,37,38]. Some of these technologies were extended and used for sighted people when exploring 3D virtual environments [39,40]. Nevertheless, this technology requires users to wear additional haptic devices on their hands while exploring tactile graphics, which can affect haptic sensitivity and perception negatively.
Thus, we see that approaches to pinpoint elements in tactile graphics are dispersed, not only in tactile graphic readers but in other assistive technologies. Some approaches use specific hardware and additional wearable devices, which makes them not scalable to other technologies. Approaches not dependent on additional hardware are sound-based and split into three groups, sonification UIs, speech instructions-based, and x and y-position sound-based methods. However, there is yet to be a standard on which sound-based navigation UI is more efficient and suitable for BVI people to pinpoint elements in tactile graphics.

3. Methods

3.1. Participants

Thirteen visually impaired or blind adults (six females and seven males) participated in the study. The sample was drawn from the city of Osnabrück and the surrounding metropolitan region of north-western Germany. Only two participants had interacted with the Tactonom Reader or other dynamic audio-tactile graphics displays before the study. The ethics committee of the University of Osnabrück approved the study protocol prior to the recruitment. Participants were recruited with the help of accessible documents and audio recordings that were distributed via mailing lists. Informed consent was obtained from all participants after they had received an introduction about the nature of the study. The selection of participants was based on a general screening questionnaire (Supplementary File S1). As the Tactonom Reader aims to satisfy the needs of users with varying degrees of visual impairments, the inclusion criteria for the study involved having received a medical diagnosis of visual impairment or blindness. Of the thirteen participants, two were blind from birth, eight were gone blind with less than 2% visual acuity remaining, and three were partially sighted with more than 2% visual acuity remaining. Additionally, participation required either an English or German language background. Therefore, all study materials were provided in German and English as accessible documents or audio recordings. The exclusion criteria involved age (under 18), current or past substance abuse, and medical abnormalities that could interfere with the aim of the study. For instance, by impacting the cognitive functions, the sense of touch, or the motor system.
Hiring BVI participants for user studies is challenging. Beyond representing only 3.3% of the population in Europe [41], BVI people have mobility problems and high unemployment rates, which makes it more difficult for them to locate and participate in scientific studies [16,42,43,44]. Hence, the number of BVI participants in this study was necessarily small. Nevertheless, it is necessary to involve users and conduct several usability tests to follow a user-centered design methodology. Although small, the number of participants in this study is already a step forward, yet a large number (or a meta-study) is desirable in the future.

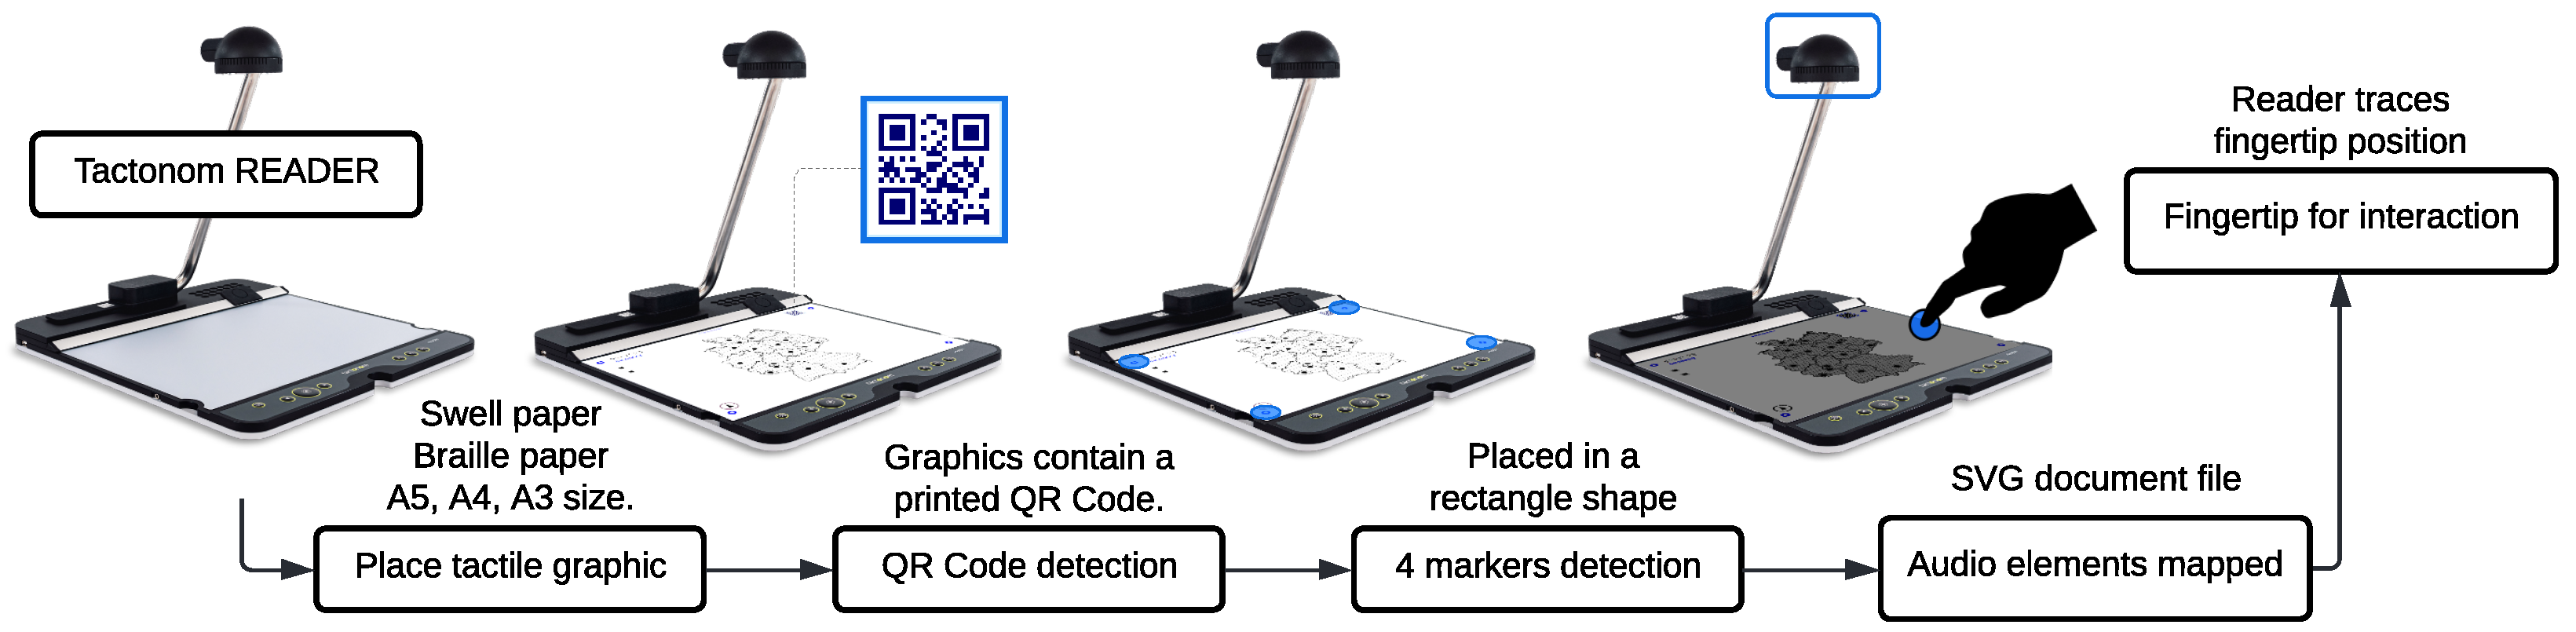
3.2. Tactonom Reader

All audio navigation user interfaces were implemented and tested using the Tactonom Reader device, produced by Inventivio GmbH [45]. The Tactonom Reader is a new tactile graphic reader that combines tactile information in the form of swell or braille paper graphics with pinpoint audio explanations. These are made possible by using RGB camera-based finger recognition. The motivation for developing this technology originates from the desire to make it possible for everyone to access complex graphical data, even in cases where texture and braille text are insufficient to represent all details. For this study, we use version 1 of the Tactonom Reader, launched in 2021. The device weighs 5.3 kg and uses a metallic magnetic surface 29 cm in length and 43 cm in width.
The process control of the Tactonom Reader technology is represented in Figure 1. The Tactonom reader supports tactile paper graphics up to DIN A3 paper size. To access the digital information, each graphic has a QR-Code that is detected by the RGB camera. The digital information is represented in an SVG graphic file containing labeled elements, such as <rect>, <pattern>, <circle>, and <line>, which can have supplementary audio information associated with it. The graphic elements are mapped from the SVG digital to the tactile paper placed on the Tactonom Reader surface using four uniformly placed markers. The RGB camera identifies these markers. Once all the digital information is mapped to the tactile display, fingertip interaction becomes available. The camera detects the user’s highest (y position) fingertip using a combination color-filter threshold with morphological operations. The fingertip interaction works similar to a cursor, enabling selection and “double click” interactions. Some graphics have tactile elements associated with extra supplementary information. This information can be accessed by pointing to the specific element with the fingertip of one hand and pressing a button with the other hand.
To accelerate the development of the Tactonom Reader, an open-source online database was developed in [46]. More than 500 SVG graphics with different languages and topics, such as education, geology, biology, chemistry, mathematics, music, entertainment, navigation, mobility, and others, are included.

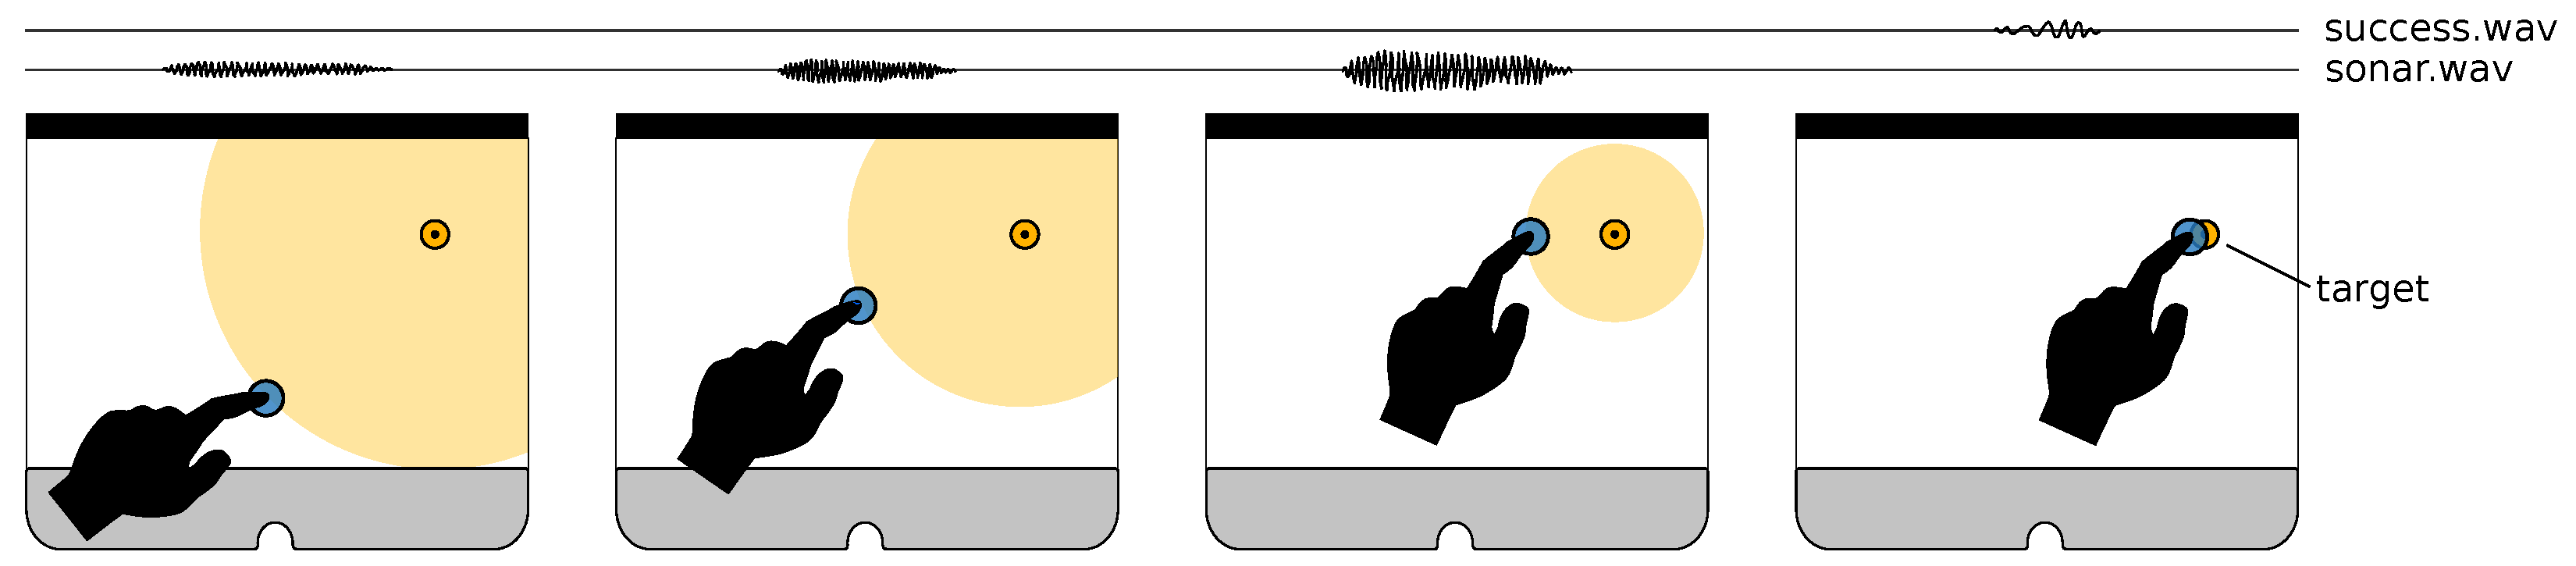
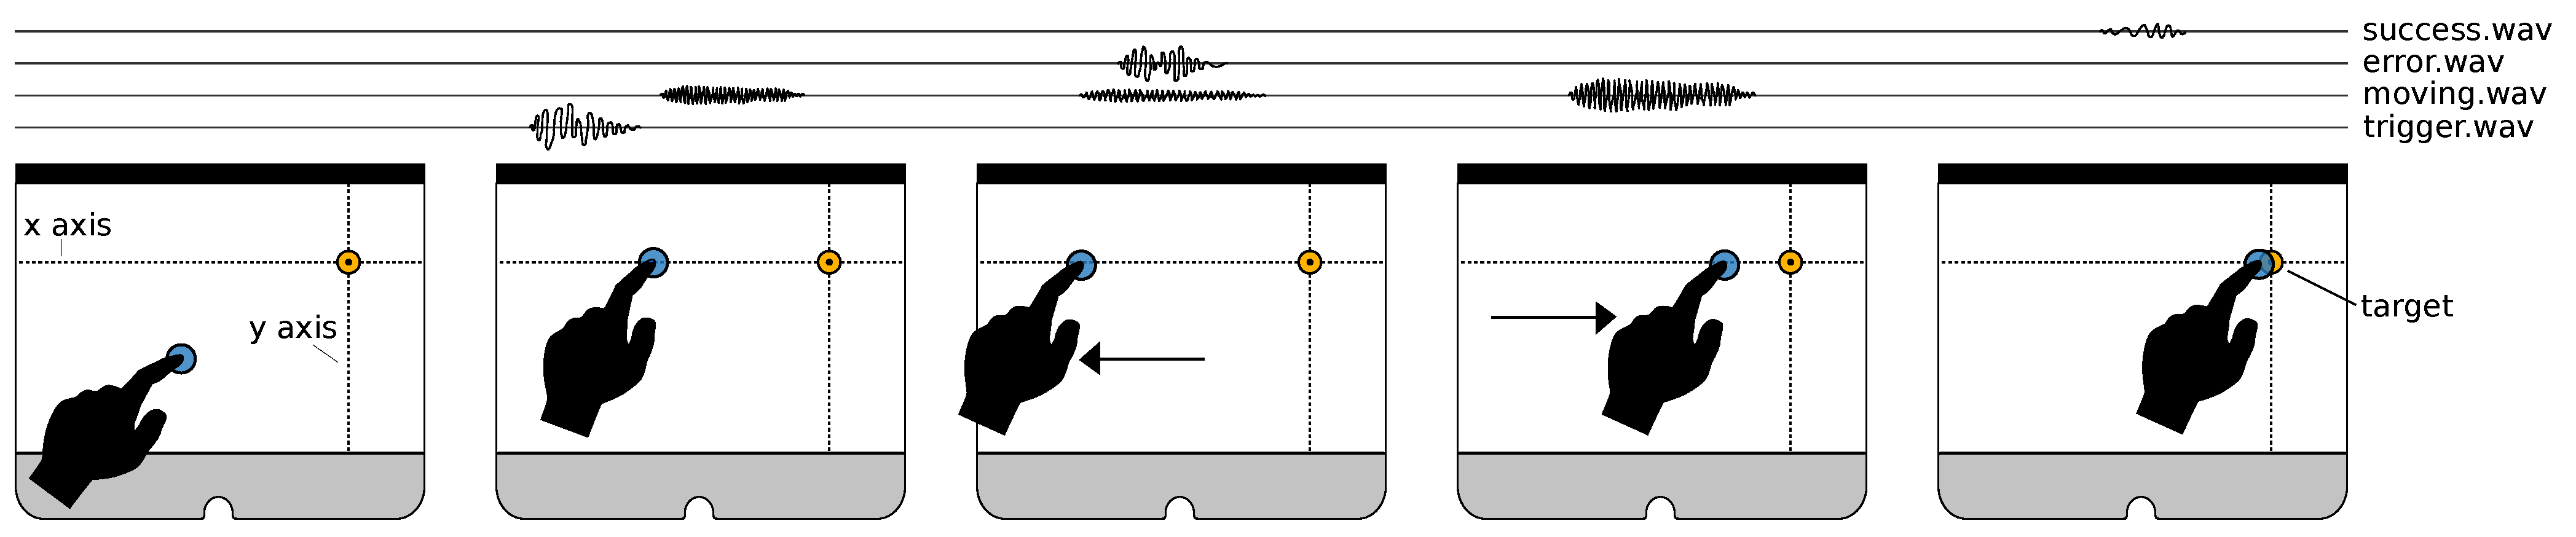
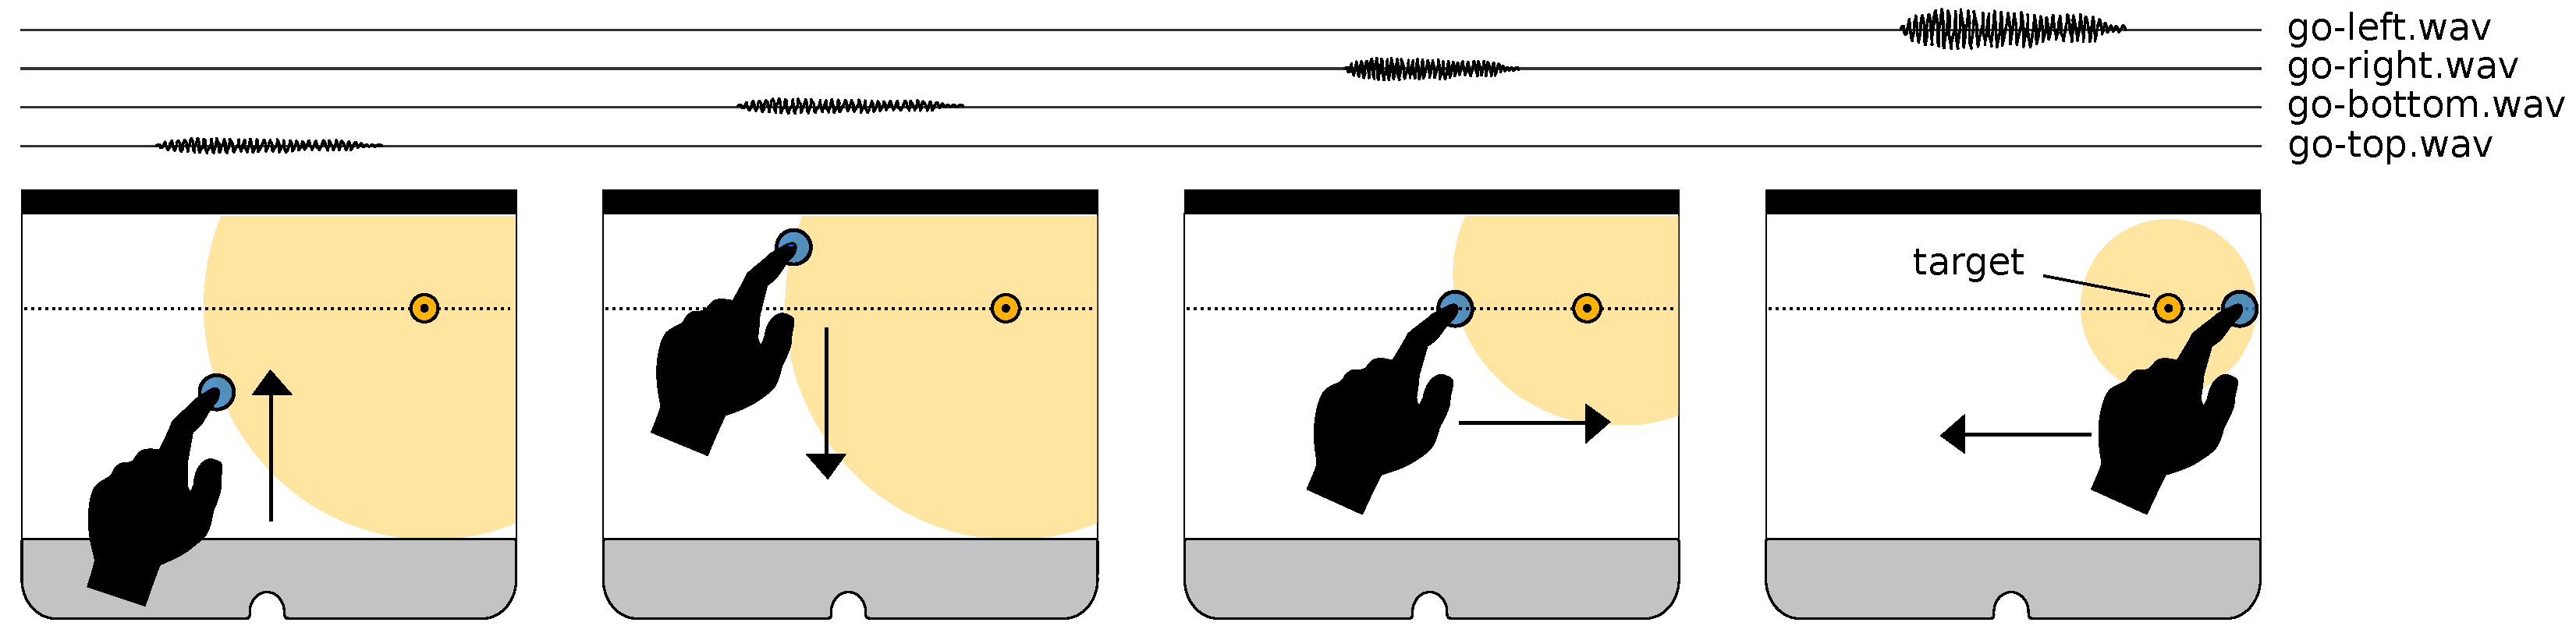
3.3. Navigation User Interfaces
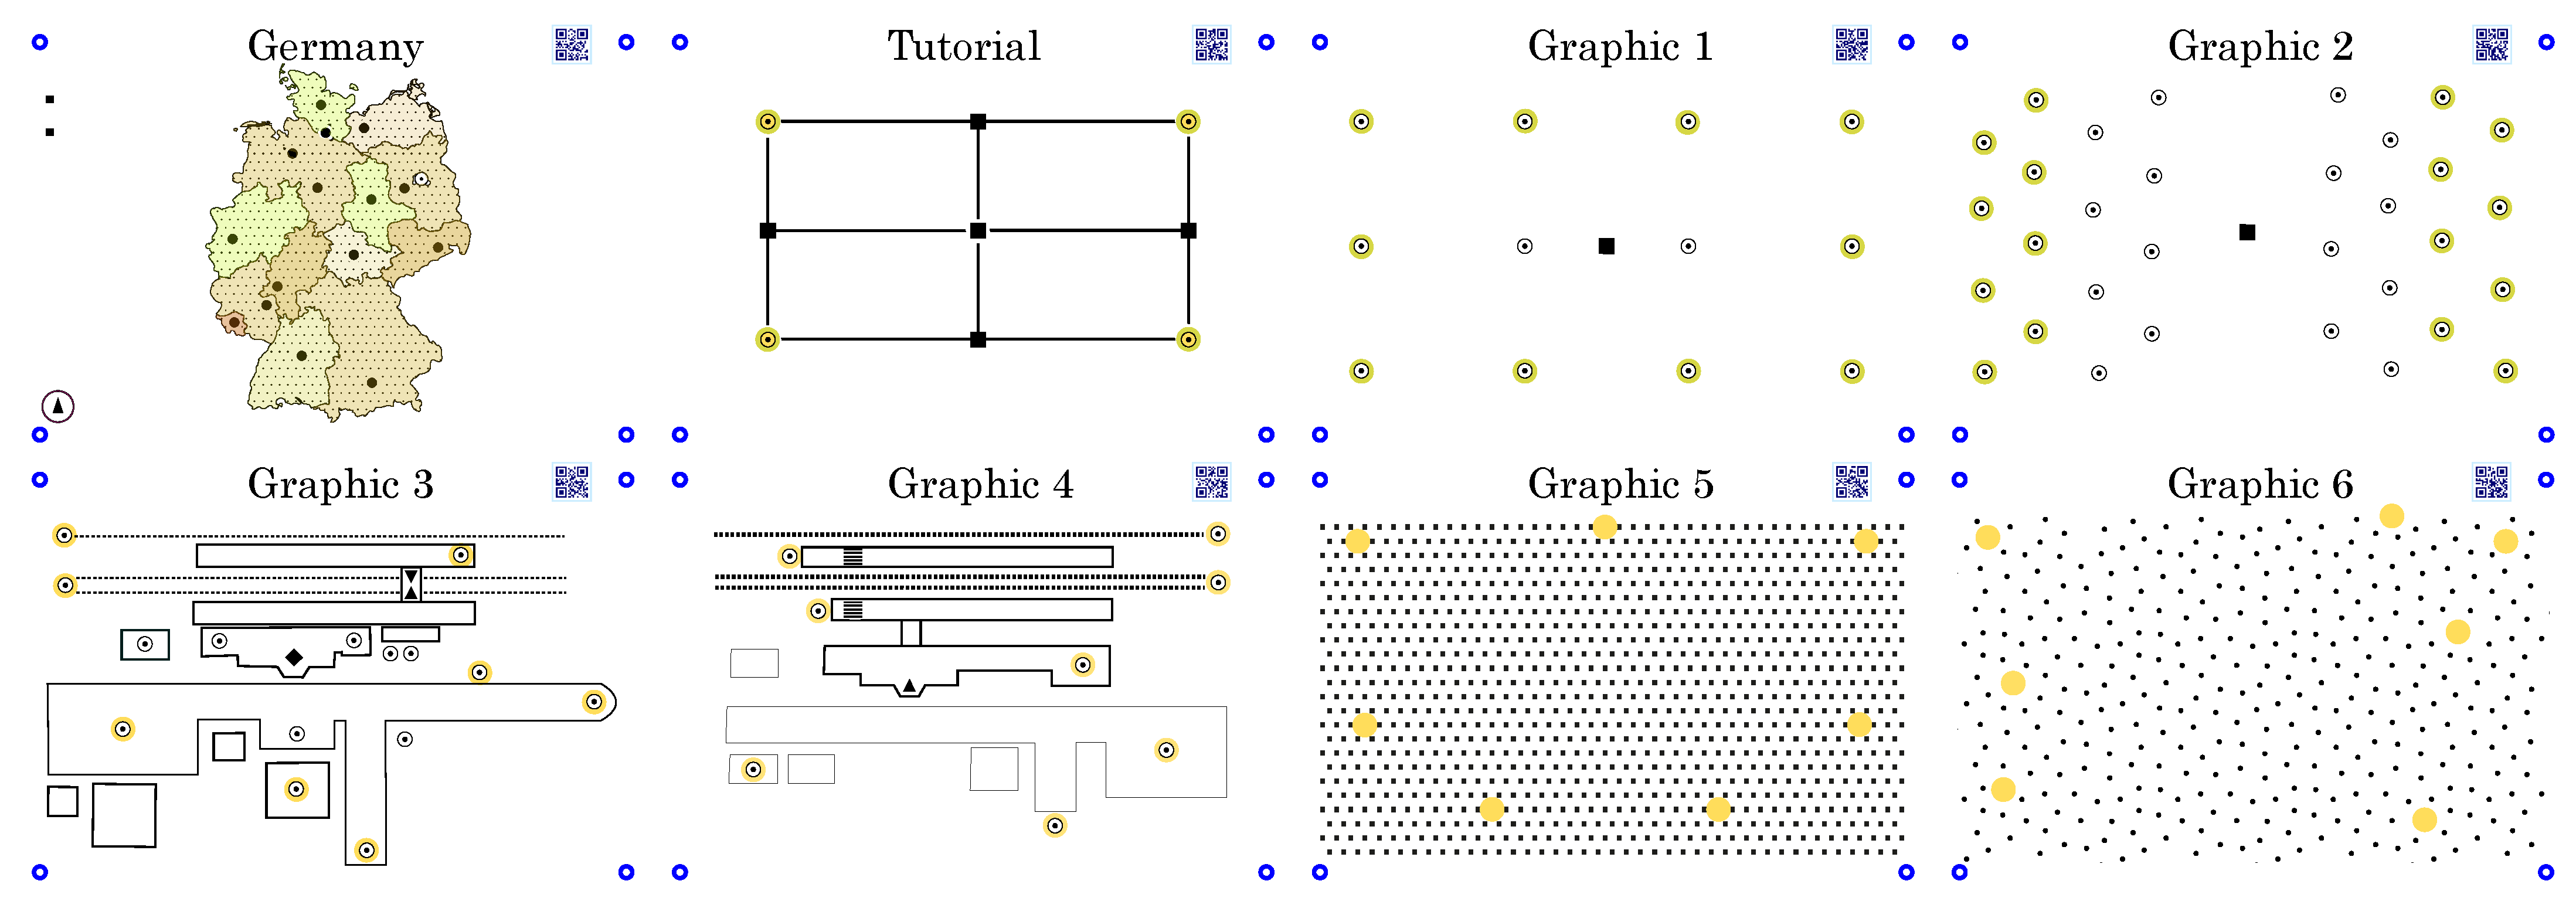
We developed three audio navigation methods, sonar navigation, axis navigation, and voice navigation. For each navigation, we created an extended software module. This software accepts fingertip position as input and uses the BEADS Java library to dynamically change the volume, pitch, and current sound in real-time (output) [47].
The sonar-navigation UI is based on submarine sound navigation. A brief (0.8 s long) background sound is played in a loop with constant frequency if a fingertip is detected. The volume and pitch of this sound are negatively proportional to the distance between the user’s fingertip and the element target in the tactile graphic. The closer the user’s fingertip gets to the target, the higher the volume and pitch of the background sound will be, indicating to the user that he is getting closer to the target element (Figure 2).
The axis navigation UI is based on the x and y-axis of the coordinate plane. In this method, there is no constant background sound being played. The target is positioned digitally on the tactile surface as a point with x and y coordinates in a coordinate plane. The user will only start to hear audio feedback once it reaches this target x or y-axis. If the person’s fingertip is positioned either on the same x or same y coordinates as the target, a “trigger” sound is played. This trigger audio is the same for the x and y axis and is only played once, followed by a brief background sound (0.4 s) that will play in a loop. In this situation, the user has the information that he or she is in the same x or y coordinate as the target. As the user moves on the axis and gets closer to the target, the background sound gets louder and higher in pitch (Figure 3). The volume and pitch of the background sound are negatively proportional to the target distance. Suppose the user gets more distant from the target while maintaining the x or y-axis coordinate, the background sound volume and pitch decrease. If the user’s fingertip leaves the axis coordinate at some point, the background sound is silenced. To make it easier to maintain the axis position, we defined a threshold of approximately 1 cm for minor deviations from the axis position. We also implemented a short “error” sound (0.4 s) when the user moves within the axis but in the opposite direction to the target to have faster responsive feedback that the user is moving his or her hand in the wrong direction.
The voice navigation UI is based on voice instructions commands that indicate in which direction the target is located proportionally to the user’s fingertip position. Four different audio instructions are used to indicate four different directions, “go up”, “go down”, “go left,” and “go right”. These directional sounds are text-to-speech-based audio, and only one is played at a time (Figure 4). To avoid situations where audio instructions are constantly changing, we define a priority in a directional move. This priority was in the bottom-top directional move, meaning that only the audio “go top” or “go bottom” is played. Once the user’s fingertip position is within a threshold (1 cm) between (“up” and “down”), the audio “go left” or “go right” is played. If the user leaves this threshold, the top-bottom directional move retakes priority, and audio “go up” or “go down” is played. The volume of the voice commands is negatively proportional to the distance from the fingertip to the target.
At any point, if the user removes his hand from the tactile surface, hence from the camera view, the audio feedback is silenced independently of the navigation UI activated. Once the user reaches the target, an additional “success.wav” sound is played, and all navigation sounds are silenced and deactivated. All UIs distribute the played sounds in the stereo space. However, as the Tactonom Reader’s left and right speakers are integrated side by side, this panning effect is not perceived. While executing the navigation UIs, the Tactonom Reader does not play any other embedded digital audio information.

3.4. Materials

We designed a set of seven SVG graphics and used three more from the open-source database [46] for this study. Each graphic consists of tactile information (textures on the surface paper) and audio information (speech or sounds) mapped to specific positions on the graphic area. The graphics from the open dataset exemplify contextual domains that the Tactonom Reader can be used for, including a state-distributed German map, a solar system representation, and a train station floor plan.
A tutorial graphic was used to explain and train the navigation UIs, while graphics 1 to 6 were used for testing purposes (Figure 5). We use open-source software Inkscape to design these, which also allows us to create associated labels used as input text for the text-to-speech engine. It is also necessary to generate a QR code in the top-right part of the graphic, as well as four blue circle markers in the four corners of the graphic. An SVG file is produced from Inkscape and uploaded to the online cloud dataset. The graphic is then printed on swell paper using a laser printer and then passed through a heating chamber by using the PIAF (Tactile Image Maker) technology, [48].
The tutorial graphic has four targets represented as tactile circles connected with straight tactile lines. These lines are used as guidelines for the targets’ axis representations to understand the navigation UIs fully. Graphics 1 to 6 are split according to their pattern structure into three groups of two. Graphics 1–2 only include tactile targets in the form of a 3.5 mm diameter circle and a 10 mm diameter outward circumference 1 mm thick. Graphics 3–4 contain simplified train station representations, including more tactile elements beyond the same tactile targets, such as outside buildings, audio points on the platform, train tracks, and streets. The aim of graphics 3–4 is to test if there is any impact on the navigation when the graphic contains other tactile elements. We used train station representations since the mobility and orientation domain is still not as developed as others in this emerging technology [7]. Graphics 5–6 contain a cluster of tactile points distributed through the graphic surface. Graphic 5 has the tactile points uniformly and in straight lines positioned, while graphic 6 has the tactile points randomly positioned. The digital targets in these two graphics are blank spaces and do not have a physical representation, which can happen when targets represent an area and not a point. This information was hidden from users. Graphics 5–6 were designed to evaluate the navigation UIs solely on audio feedback. All graphics are represented in Figure 5, including an example of a context graphic of Germany presented to interested participants after the study.

3.5. Procedure and Design

The usability tests followed a within-subject design where each subject tested the three navigation UIs randomly. The usability test was performed in a single session of about 90 min and each participant was tested individually.
Upon arrival, participants were informed about the nature of the study, and informed consent was obtained through a signature or a verbal agreement in the form of an audio recording. Moreover, they were instructed that they could stop the usability test at every point in time without providing any reasons. Participants were then asked to answer the questions of the general screening questionnaire that was read by the experimenter. Next to validating the in- and exclusion criteria (s. participants), the screening questionnaire involved questions about the participant’s experience with braille writing, tactile maps, and graphics, as well as with single or multi-line braille displays or other related technologies and materials. Subsequently, the exploration stage started, and participants received three minutes to explore the Tactonom Reader with their hands to get used to its dimensions and to support the creation of a mental image of the device. The experimenter simultaneously repeated the study procedure and ensured the participant had understood the task correctly.
Next, a simplified sample graphic was placed on the device with four target positions located on the edges of the graphic. At the same time, one of the three different navigation UIs was selected at random, and the Tactonom Reader was restarted with the correct UI applied. After learning how to control the Tactonom Reader and navigate through its menu, the participants were instructed to select the “navigation” option from the main menu. A single target from the four possible ones was selected at random. Upon confirming their selection by pressing the same button again, the navigation UI was activated, and the trial started. Participants were allowed to repeat the test trials several times for a maximum duration of five minutes. After ensuring the participant understood the procedure, and there were no unanswered questions, the main experiment started. One of the six test graphics (Figure 5) was randomly selected by a computer script placed on the Tactonom Reader. After the device was read in this graphic, the participants could initiate the first trial whenever they were ready by selecting the navigation mode through the main menu, as trained previously. Upon selecting the navigation mode, a random element from the graphics is assigned as the navigation target. A ‘beep’ sound marked the start of the trial. Participants were previously instructed to place their index finger on any position of the device’s surface. The initial position was not fixed to give users freedom and flexibility to use their usual strategies. By following the acoustic feedback of the navigation UI, the users navigated their index finger to the correct target location in the graphic. This procedure was repeated for the remaining five example graphics. After the participant had found all six target locations, one of the remaining two navigation UIs was selected at random, and the Tactonom Reader was restarted. To familiarize themselves with the new navigation UI, the participants were allowed to train for a maximum duration of five minutes using the same sample graphic as before. Then, the second part of the experiment started, and the participant again located six randomly selected target locations in the six test graphics presented in random order. Finally, the procedure was repeated for the remaining navigation UIs.
The final part of the experiment involved an interview that aimed to assess the participants’ user experience. More specifically, it aimed to assess the usability of the Tactonom reader and evaluate how practical the different navigation UIs were in their purpose to guide a blind or visually impaired user to a particular element in tactile graphics. As we additionally tried to answer the question of what other aspects of the Tactonom Reader and the implemented navigation UIs could be improved, the interview was conducted as a semi-structured interview. This allowed the experimenter to ask additional questions in case the participant was reporting an interesting observation next to the general questions that were the same for all participants (Supplementary File S2).

4. Results

In order to analyze and validate the developed audio navigation UIs, we gathered qualitative and quantitative data from user tests and semi-structured interviews. Our goal was to investigate the efficiency and satisfaction of the three navigation user interfaces in pinpoint elements in tactile graphics. We assume that the time it takes to pinpoint an element reflects the efficiency; moreover, the UI preference and score value correlate with user satisfaction. Our study’s hypotheses are:
1-
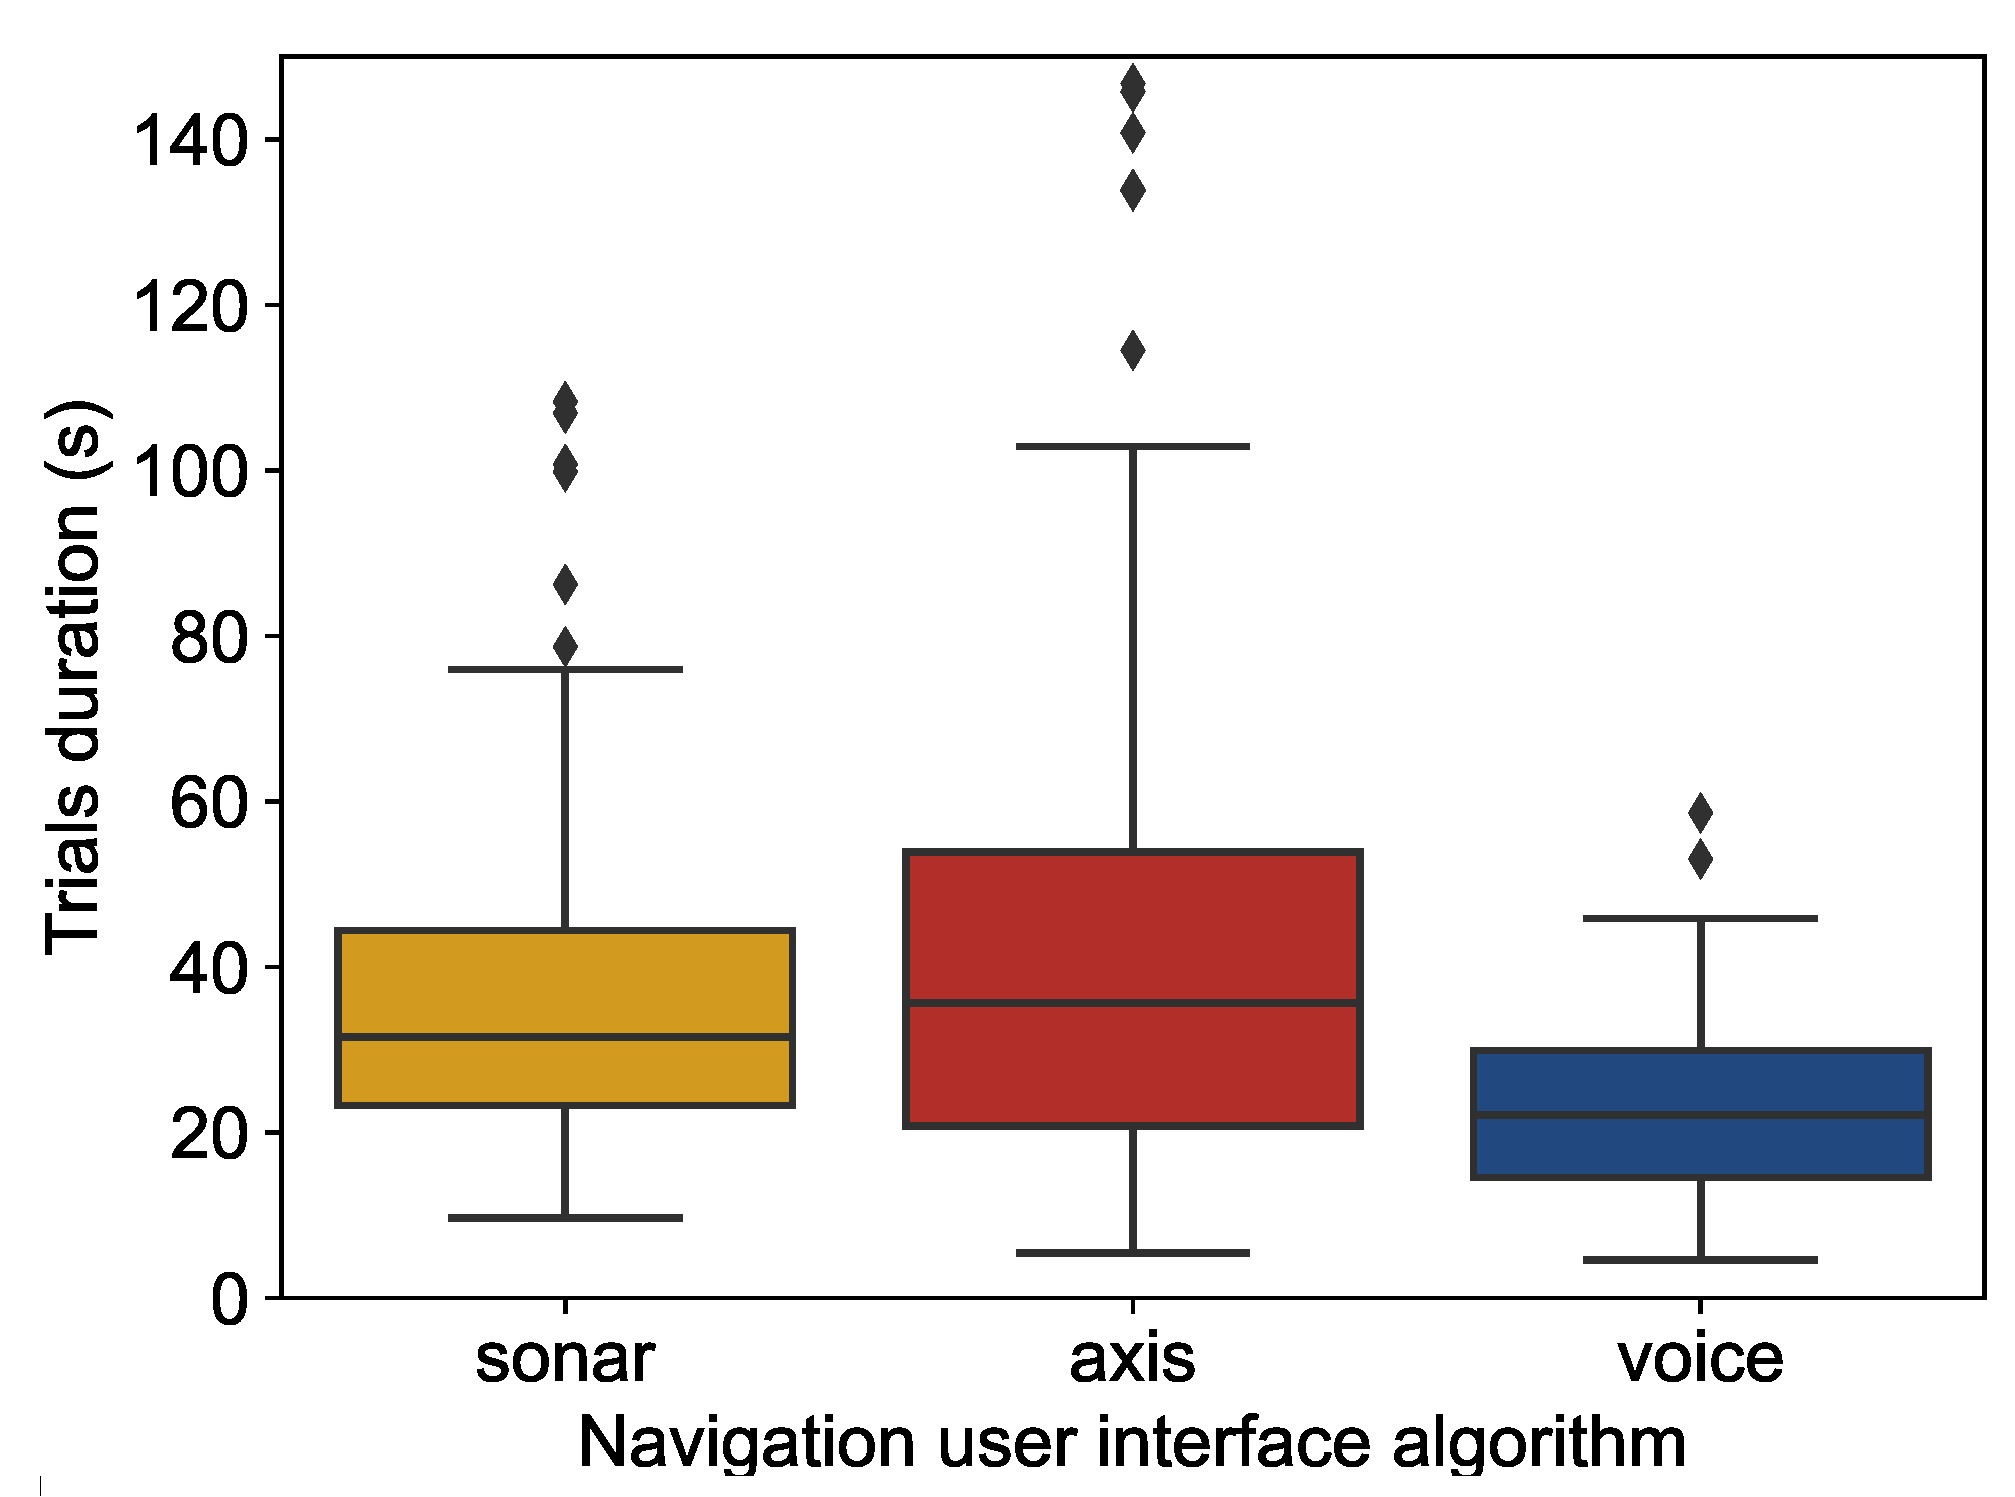
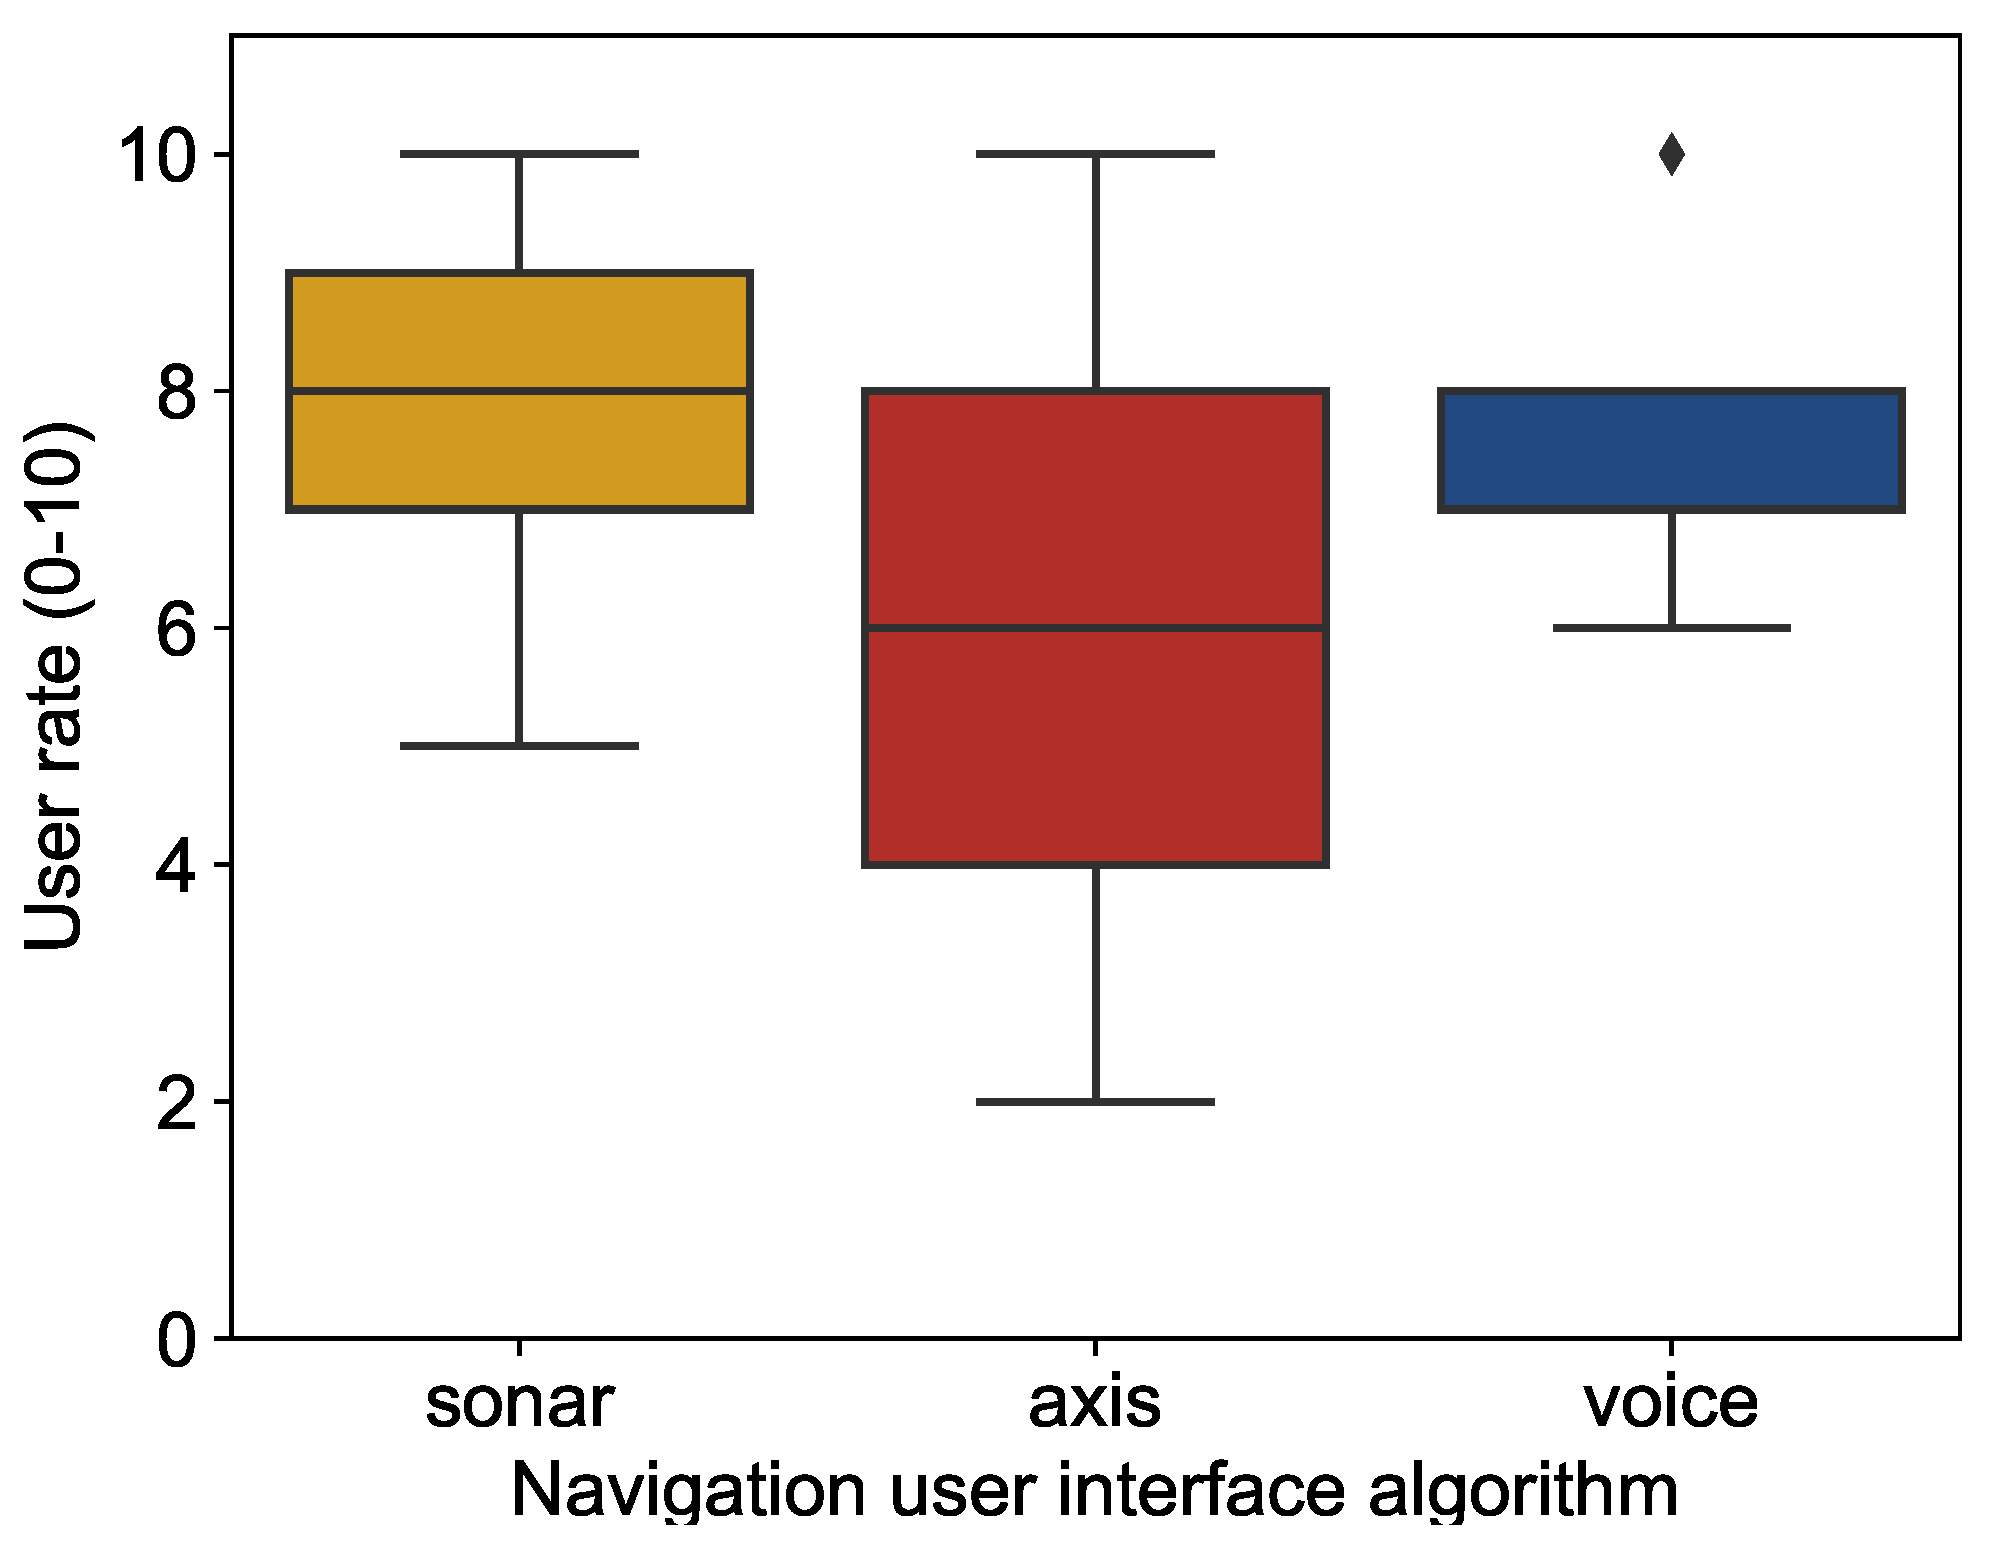
The speech-based and sonar-based navigation user interfaces have higher efficiency and satisfaction than the axis-based navigation user interface.
2-
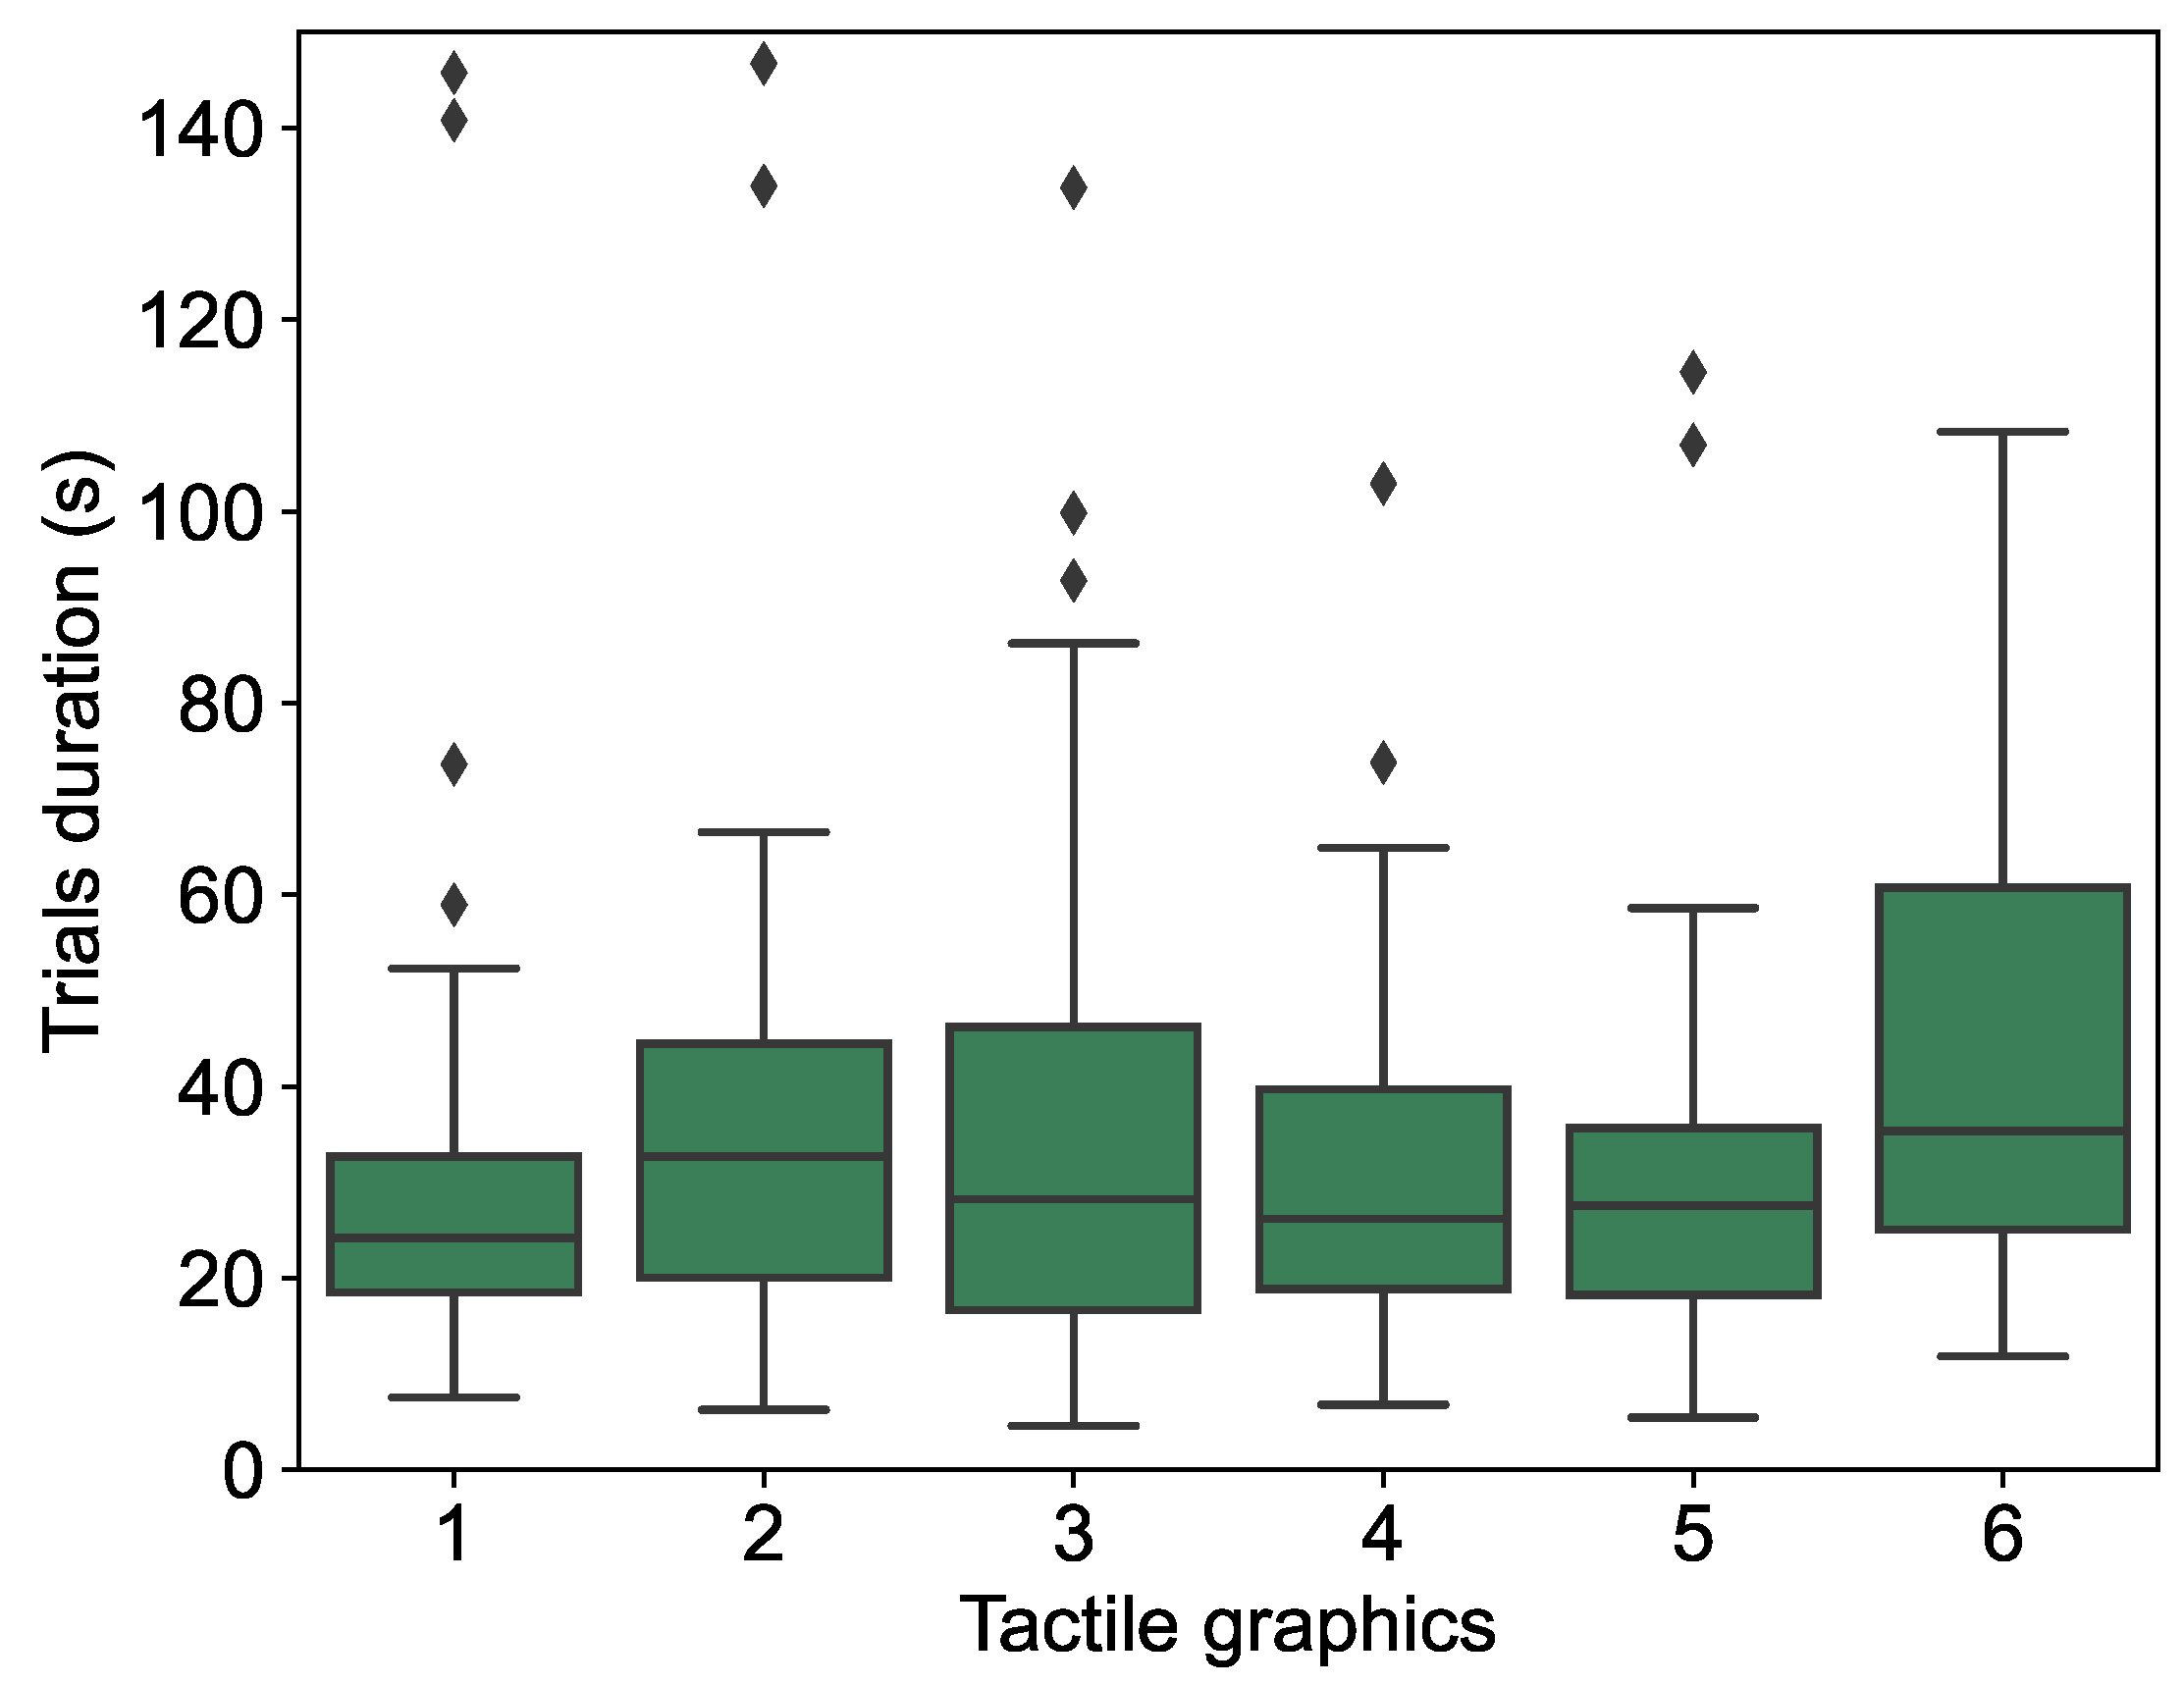
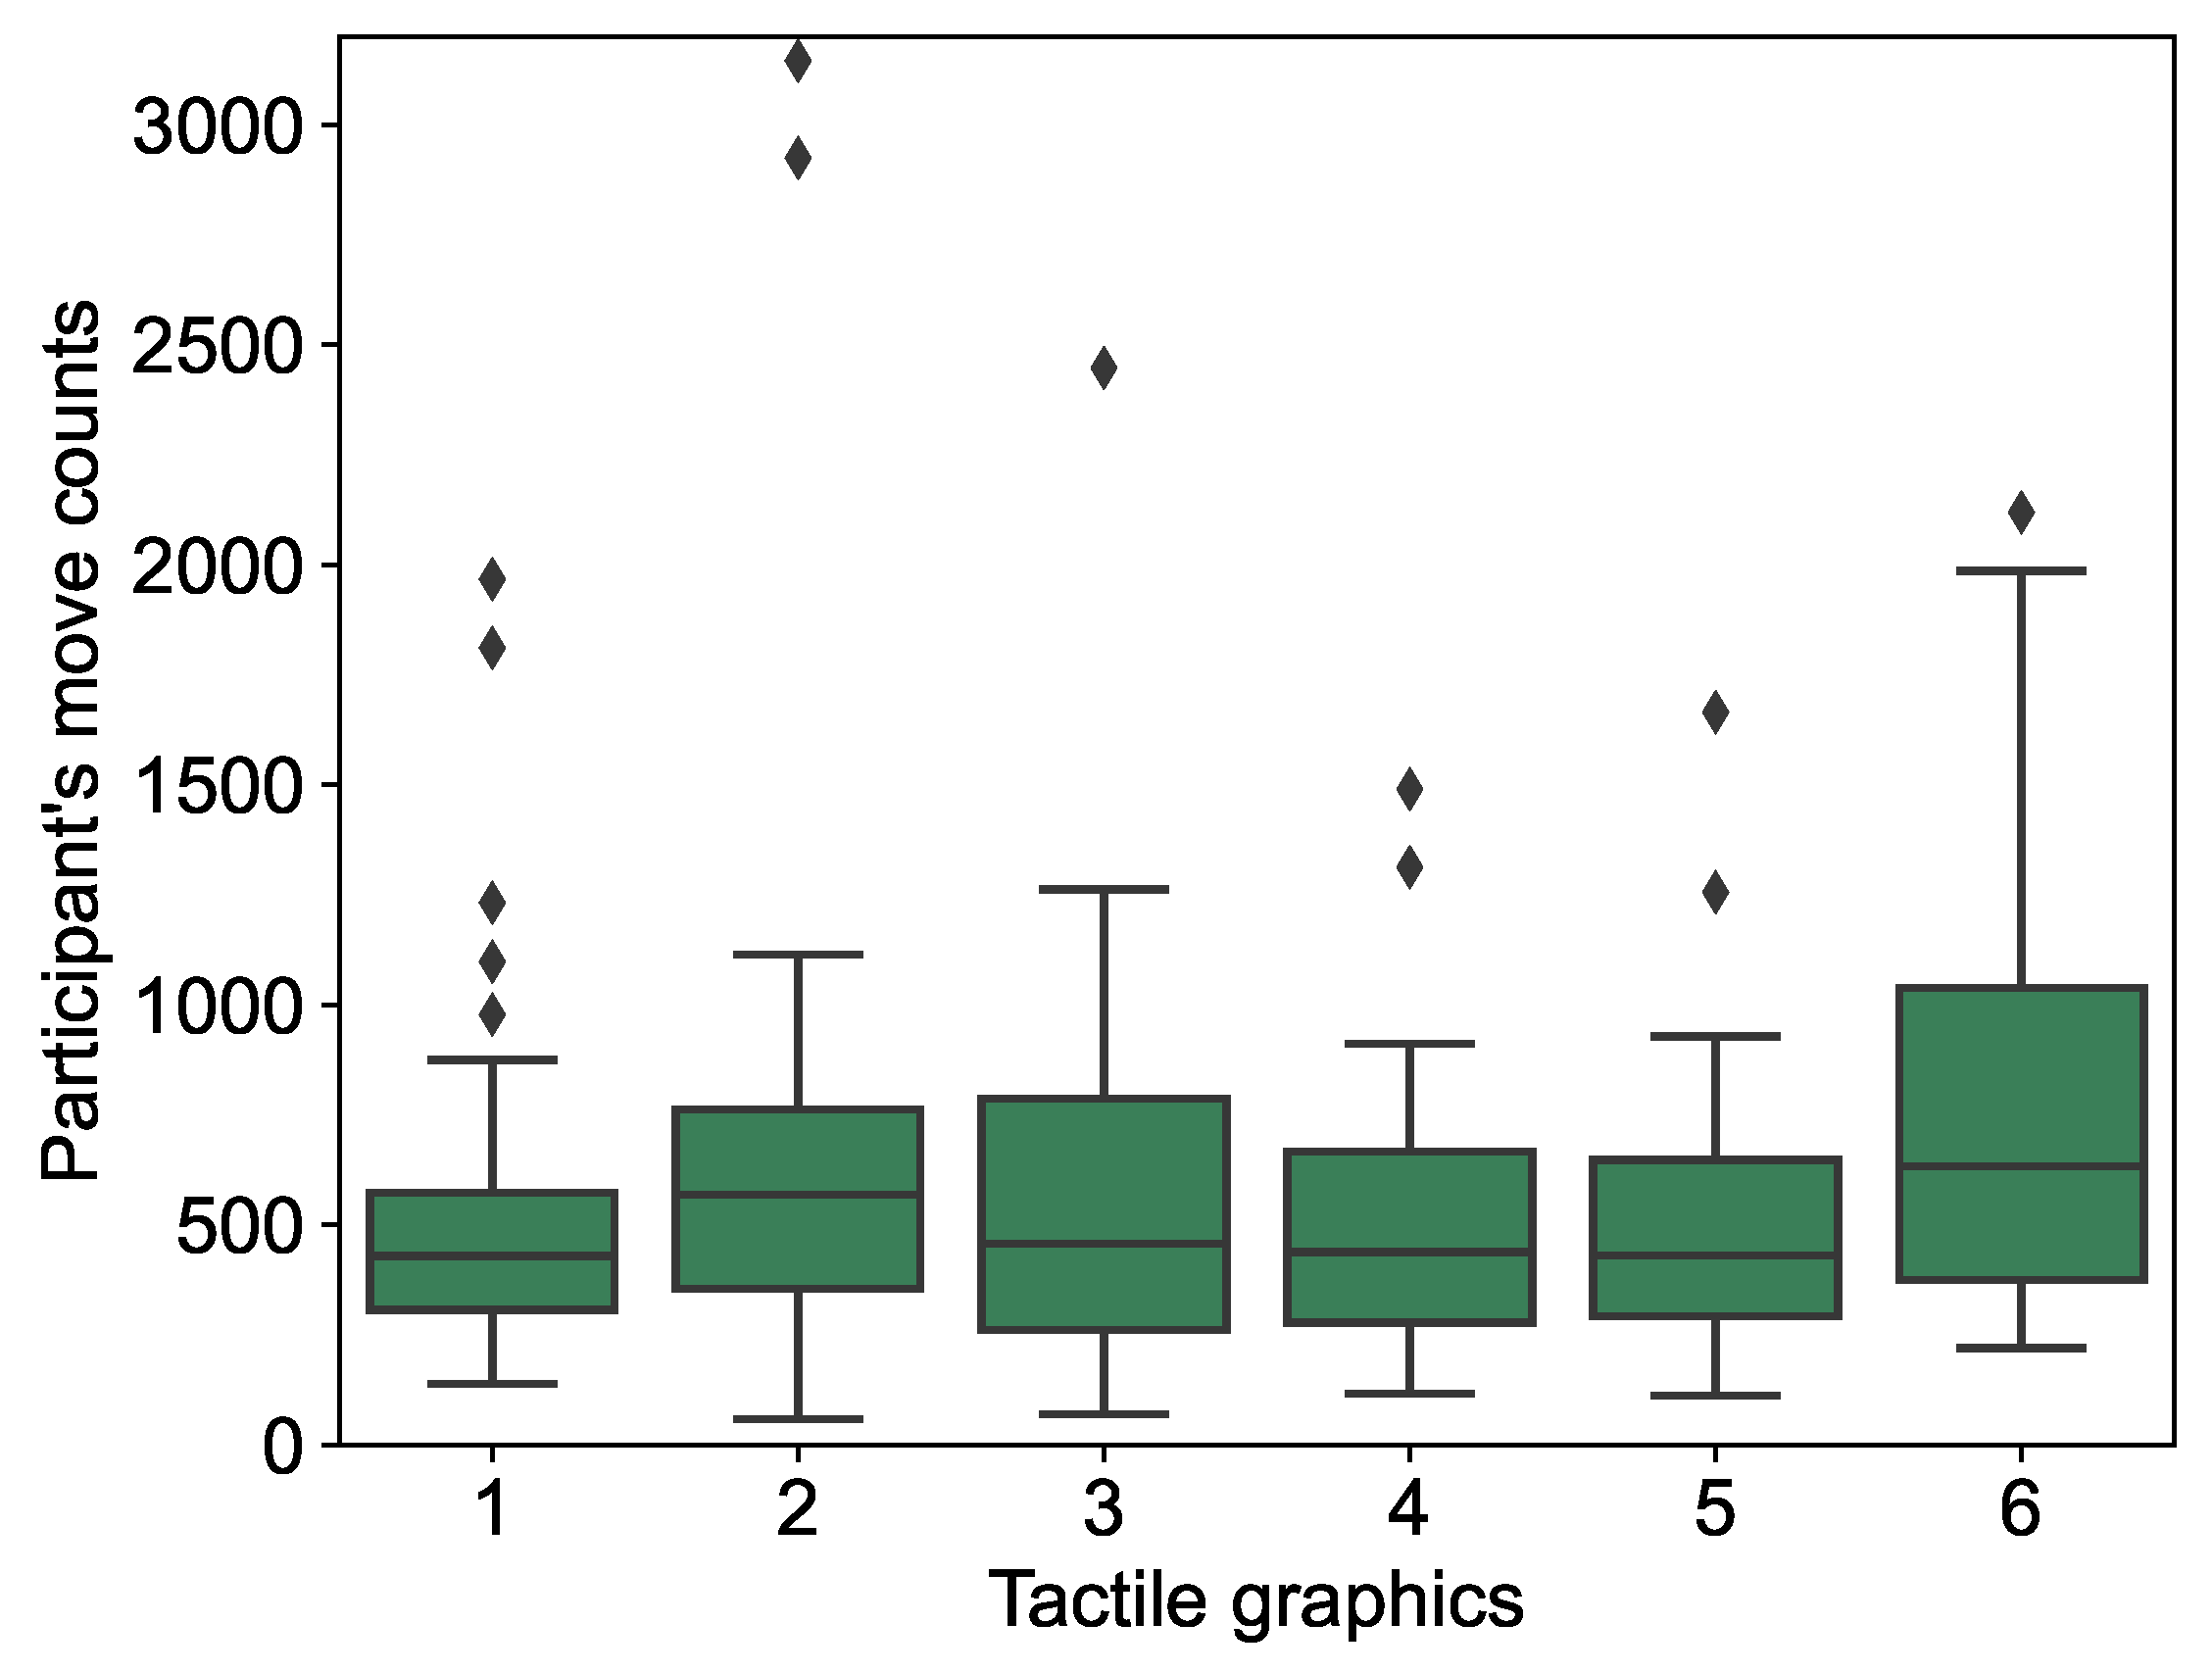
The navigation user interfaces can help BVI to pinpoint elements independently on the type of tactile graphics and targets.
The results are organized into three topics, Section 4.1 presents the dynamic navigation UI comparison, Section 4.2 presents the tactile graphics performance comparison, and Section 4.3 presents the user strategies to locate elements in tactile graphics.

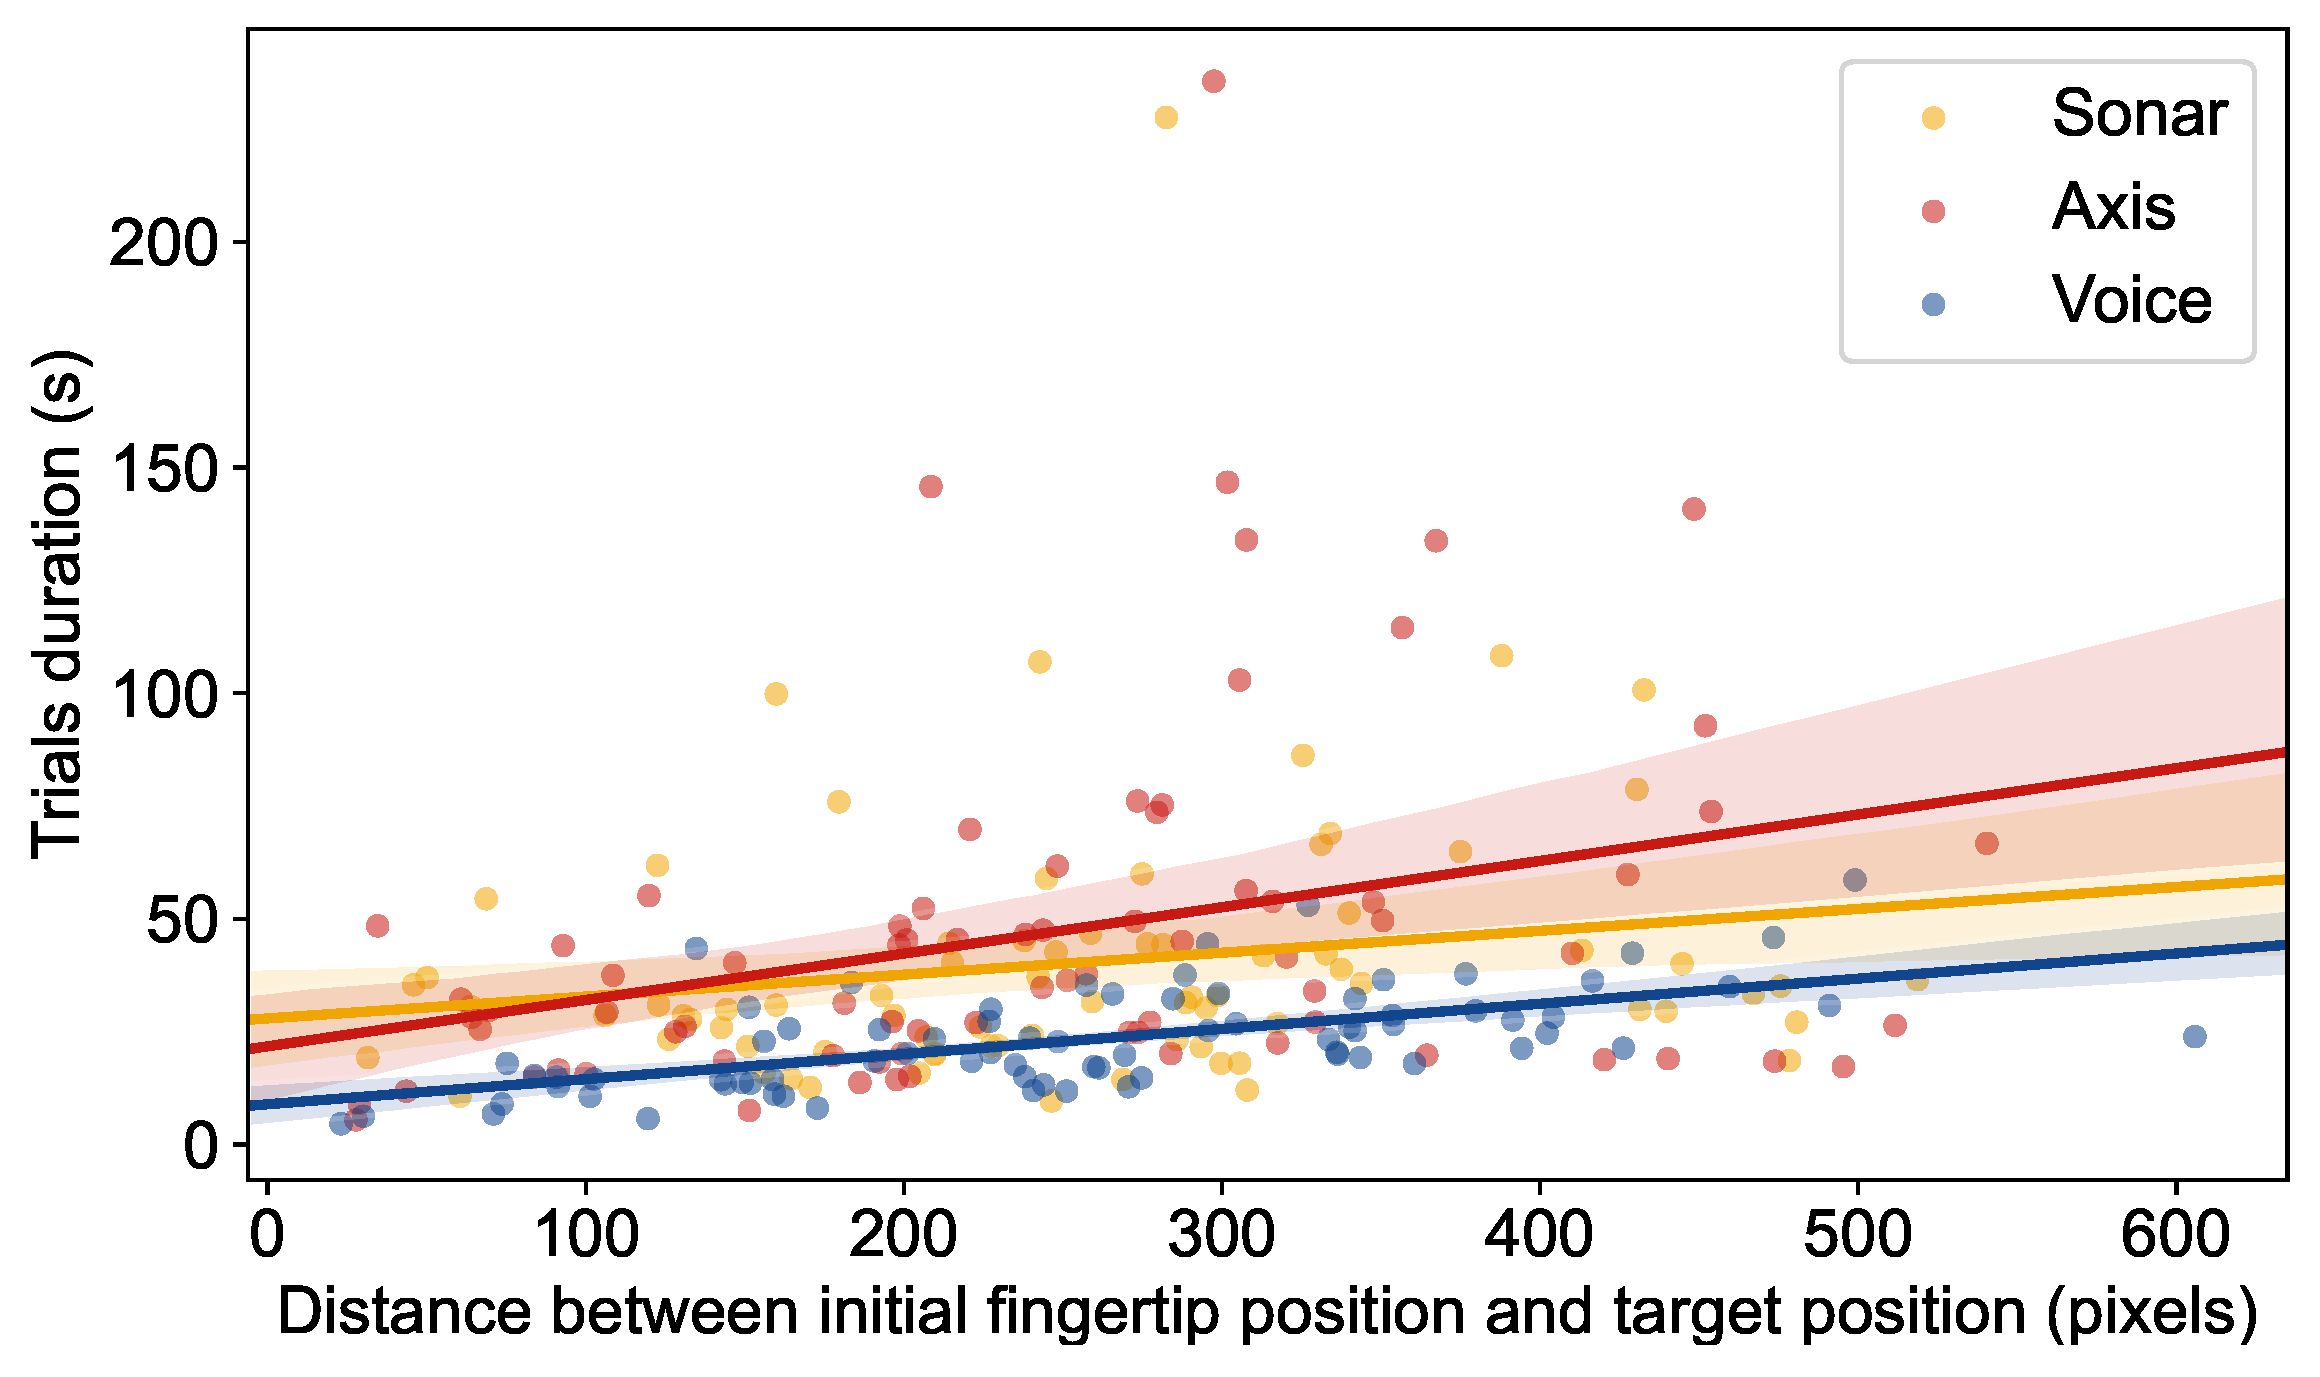
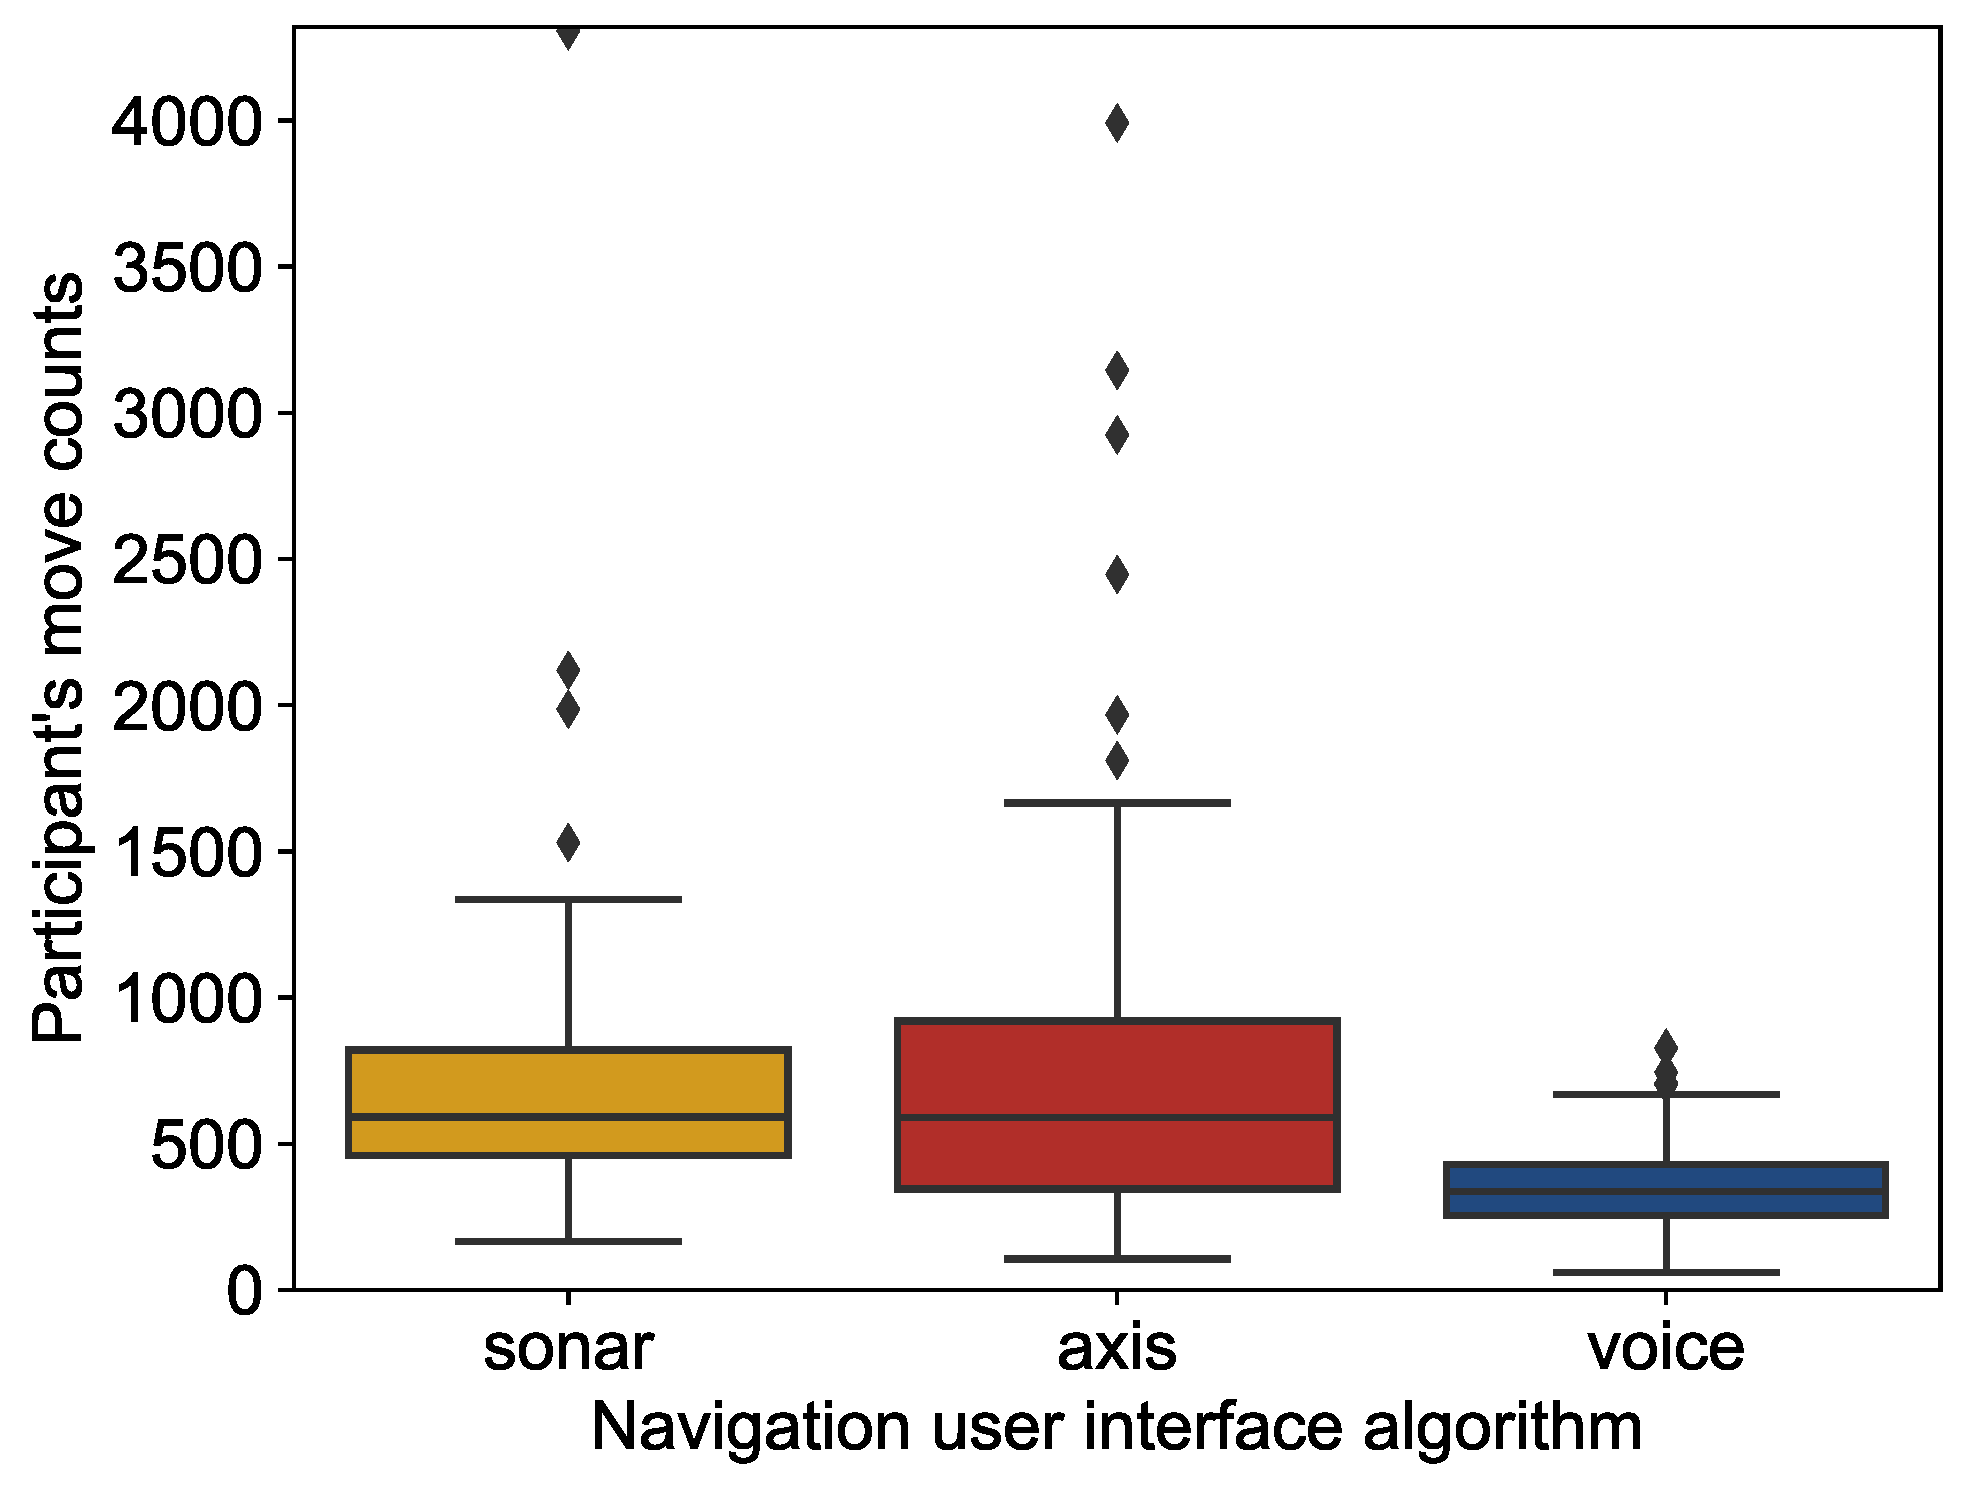
4.1. Dynamic Navigation UI Comparison

For comparing the three different navigation UIs, sonar-based, axis-based, and voice-based, we started by analyzing the total time it took for participants to locate each target element (Figure 6). The average trial time in the sonar-based method was 40.4 s, with a standard deviation of 31.0 s. The axis-based method obtained the highest average trial time of 47.0 s (SD = 39.6). The lowest average time per test belongs to the voice-based method, with 23.3 s and a standard deviation of 11.1. The two longest trials took 235.6 and 226.4 s in the axis and sonar-based UIs, respectively. These outliers were excluded from Figure 6 for viewing purposes. Excluding these two more divergent outliers, the shortest trial navigation was 4.6 s, and the longest took 150.2 s. These data give the first hint at the high performance of the voice-based navigation UI.
As a next step, we correlated the trial times distribution as a function of the distance between the starting point (user fingertip first position) and the final position (target position). This comparison considers the cases where the users would start very close to the target position, making it easier to move to this position earlier than if they would start in a more distant position from the target. For this analysis, we drew a scatter plot graph, differentiating the three navigation UIs in Figure 7. From the scatter plot distribution, one regression line was drawn for each dynamic navigation user interface. The slope of the regression line for the sonar-based navigation UI is relatively flat, i.e., the time needed increases only slowly with the distance to the target. Nevertheless, even by using the distance from the initial to end position as a factor, the voice-based navigation user interface remained the fastest method to locate elements in tactile graphics.
Beyond analyzing the trial duration, we also calculate how many fingertip movements the participants made before achieving the target using the fingertip’s x and y positions collected by the camera (Figure 8). The method with the highest average number of movements was the axis-based method, with 784 movements and a standard deviation of 687 movements. The sonar-based method obtained an average of 734 movements per participant (SD = 553). The lowest average belongs to the voice-based method, with 358 movements per participant (SD = 162). The maximum number of moves per participant was 4306 during sonar-based UI navigation, while the minimum number of moves was only 59 while navigating with the voice-based UI. In agreement with the previous results, the average number of movements was smaller for the voice method and higher for the sonar and axis methods. These results are in line with hypothesis 1. During the interaction, we also observed that users had slower reaction times when interacting with the axis navigation user interface.
In the semi-structured interviews, participants were asked to rate each navigation UI on a scale from 1 (not useful) to 10 (perfect). The voice-based user interface was the highest-voted method with an average rating of 8.0 (SD = 1.31, median = 8.0), followed by the sonar-based with 7.62 (SD = 1.61, median = 8.0). The axis UI had the lowest average rank, with a 5.85 out of 10 (SD = 2.30, median = 6.0). The distribution of the user rating from participants is represented in Figure 9. The observed pattern roughly matches the performance assessed by trial duration, demonstrating the high performance of the voice-based UI. However, it also illustrates that the sonar-based UI user rating was slightly worse than the voice-based UIs.
We also collected qualitative feedback from participants in the semi-structured interviews. Users commented that it was difficult to use the axis mode since it is necessary to move in a straight direction once the axis is found, “If you don’t move your finger in a straight direction, you are out!”. Participants also pointed out the lack of feedback when the finger is not positioned on any axis. “If the device is not playing any sound, we do not know if it is actually doing something or not.”, “The tone should be constant. Otherwise, it might cause uncertainty whether the device (or myself) is functioning correctly.”. 10 out of the 13 participants were unable to navigate in a straight line, leading their fingertips out of the axis area, therefore silencing the audio cues. The participants did not realize that their hand was not moving in a straight direction, finding it confusing, “When you found the signal, and it disappears again, this is causing uncertainty.”, “Sounds were very good, but deviating from the axis was annoying.”. On the other hand, the voice-based method received positive feedback due to its simplicity and ease of learning, “It requires the least cognitive effort”, “You get there faster because he gives the most direct instructions without delay and interpretation!”. Some participants preferred the use of the sonar-based method since it uses pleasanter sounds, while voice instructions are less pleasant to hear and repetitive, “Sonar was a nicer sound! More nice to listen to than ’go up!’ instruction.”, “Was not the fastest, but it didn’t annoy me!”. Participants also pointed out that user preferences depend on which context and type of assistive technology you use, “Who is more into sounds will prefer the sonar UI and who does not, the voice UI.”. Regarding the sonar-based UI, participants also commented on the ability to move diagonally, “It is also possible to navigate diagonally; the audio instructions are very direct and not overlapping.”, “It is more fun, as it is intuitive to use through the sound and allows for all kinds of movement.”. Overall, participants’ statements demonstrated positive feedback on sonar-based and voice-based UIs, while the axis UI received more negative comments.

4.2. Tactile Graphics Comparison

We also compared the six audio-tactile SVG graphics tested by blind and visually impaired participants. To analyze the SVG graphics, we compared the trial time duration distribution and average per graphic in a box plot represented in Figure 10. The graphic with the set of smaller points uniformly spaced between each other (graphic 5) was the graphic with the shortest average time per trial, 31.3 s. The graphic with the set of smaller points unevenly spaced between each other (graphic 6) was the graphic where participants’ guidance interaction lasted longer, with an average time per trial of 51.7 s. Interestingly, the two most divergent trial outliers were sampled in this graphic (not represented in Figure 10 for viewing purposes). However, it is noticeable that all of the graphics, despite their differences, have outliers. Overall, the differences in the durations of the trials in the different graphics appear small, supporting hypothesis 2. Beyond time duration analysis, we compared per graphic the average number of participants’ movements during the interactions (Figure 11). The graphic with the highest average number of moves was graphic 6 with 907 (SD = 890), which was also the graphic with the maximum number of movements, 4306 (These outliers were excluded from Figure 11 for viewing purposes). Graphic 5 had the lowest number of movements per participant (502), which correlates with its average trial duration, which was the fastest of all six graphics. For observing the interactions, we also noticed that users had the impression that the set of tactile points was uniformly displayed in Graphic 6 when it was not. Participants would show signals of confusion but still were able to pinpoint the targets.

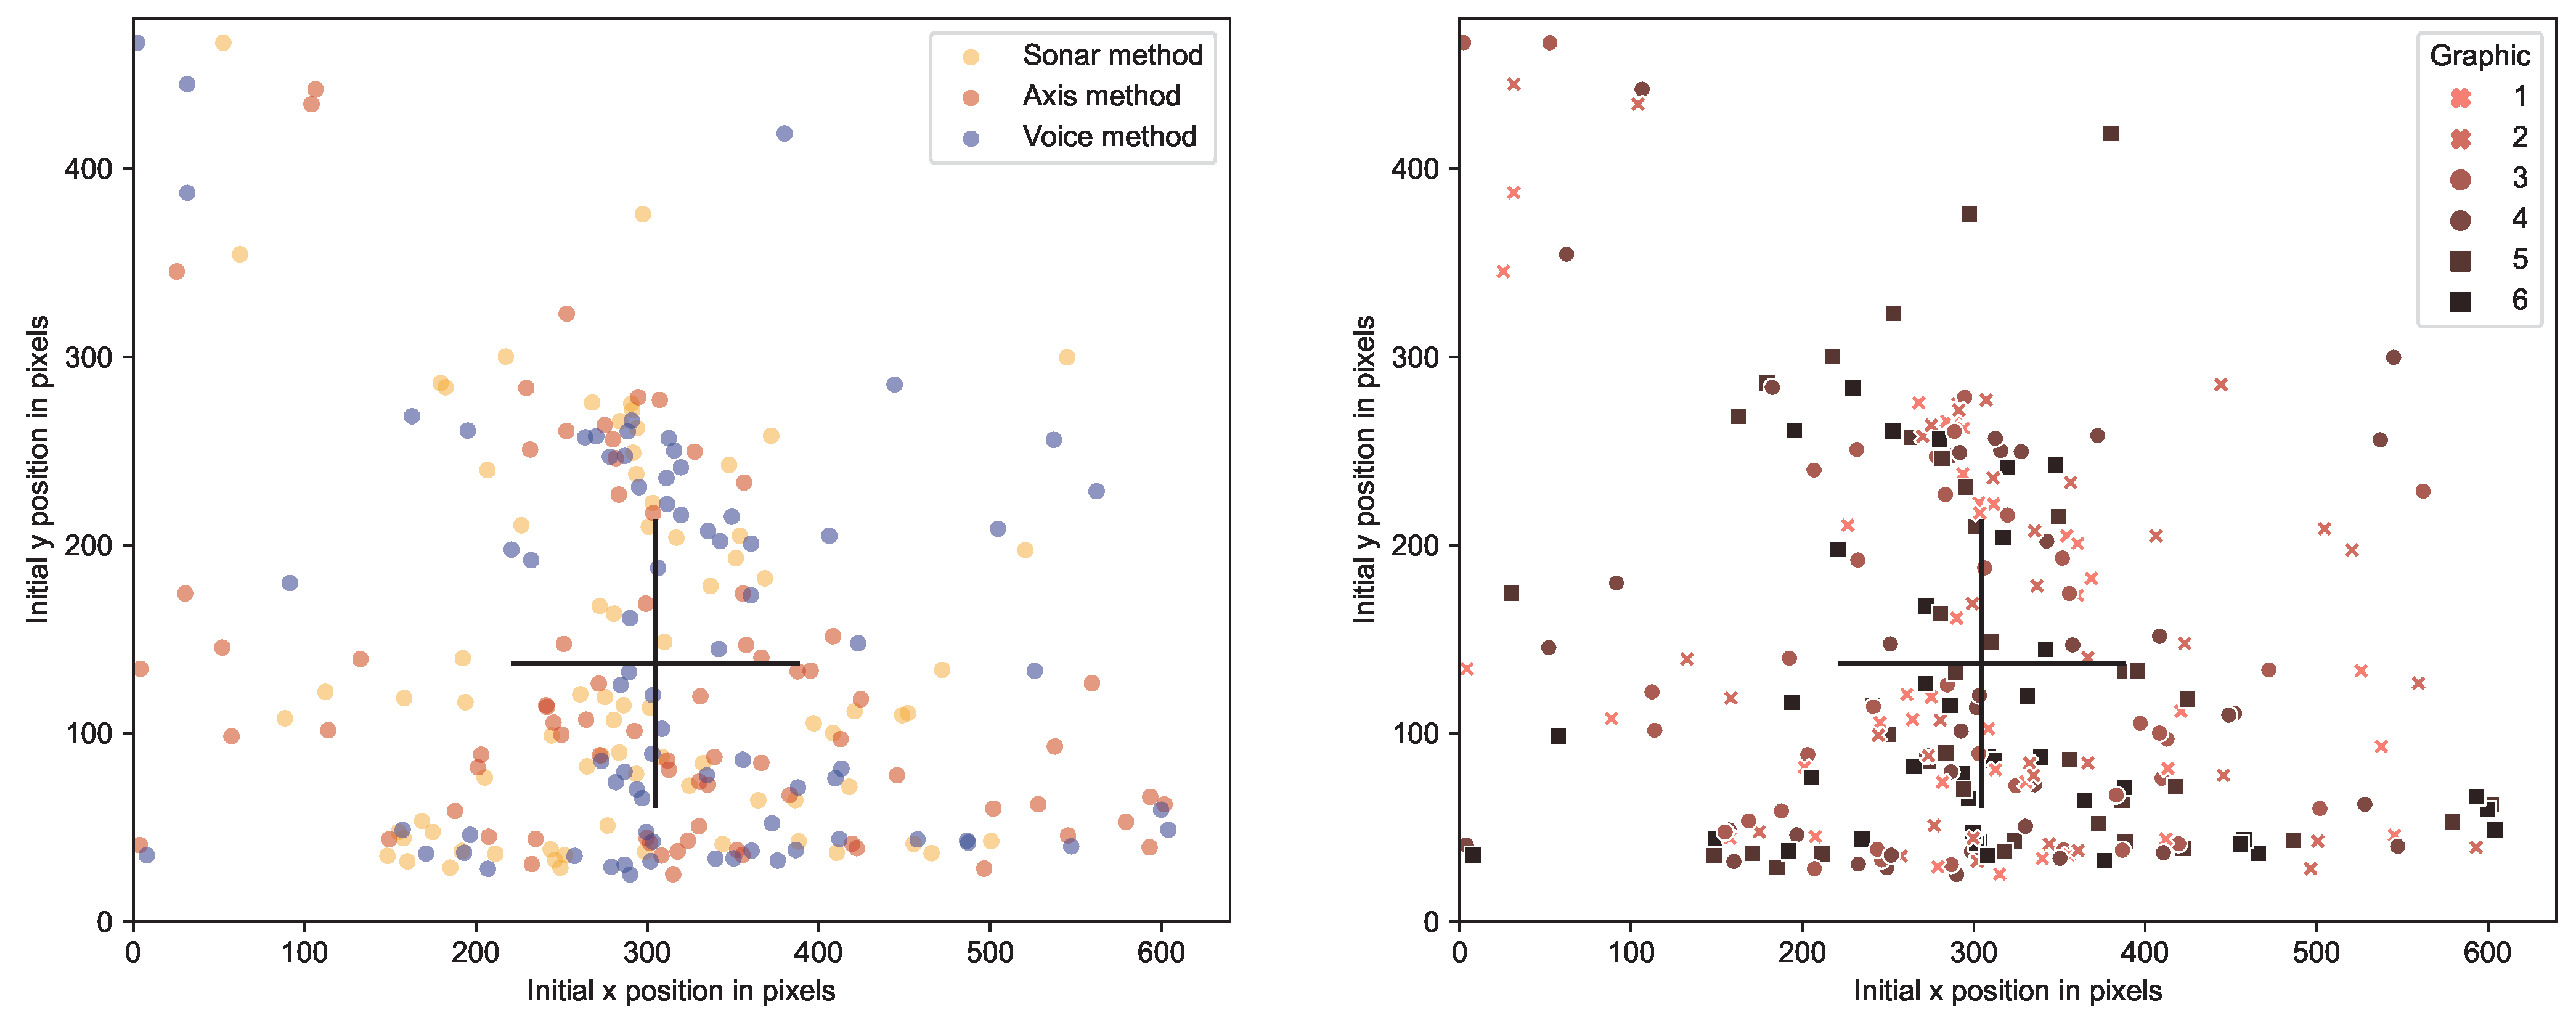
4.3. User Strategies to Locate Elements in Tactile Graphics

Apart from measuring the time per trial, we analyzed the fingertip positions through every trial to identify possible user strategies when using the navigation user interfaces. We evaluated the distribution of the initial user’s fingertip positions in the Tactonom Reader two-dimensional surface x and y coordinates system. Initial fingertip positions are distributed mainly at the center and bottom center of the device. It is noticeable that these choices are independent of the navigation user interface used. We also analyzed the first fingertip positions concerning the trial graphics (1 to 6). As with the navigation UIs, the initial fingertip positions are also independent of the type of tactile graphic. Figure 12 shows the same initial fingertip positions in two plots. The left plot correlates these with the type of navigation UI used, and the right plot correlates with the SVG graphic used. Surprisingly, no systematic adaptation can be seen in the course of the experiment, and the participants use a rather constant starting position.

5. Discussion

During the semi-structured interviews, participants demonstrated interest and found utility in using the audio navigation UIs to find specific elements in tactile graphics, “I would like to use them!”, “Yes, they are totally useful to find the target and can also be applied to various practical examples.”, “Yes, both sonar and voice are very capable of this!”.

5.1. Moving Fingertip in a Straight Direction

From the study results, we conclude that the voice-based navigation user interface was, on average, the fastest, most intuitive, and subjectively preferred method presented to participants. Although the results are clear, the explanation for the efficiency of this method is not straightforward. To understand why the voice-based method had the highest efficiency rate, we can start by comparing the three approaches. The axis-based navigation user interface was not as notable as its two alternatives, with an average user rating of 5.85. While participants were interacting with the axis-based method, they showed slower reaction times, which can most likely be attributed to a more resource- and time-intensive interpretation of the audio signals. However, participants were given short training periods for each method prior to the task. Moreover, the argument that using fewer sounds is related to the performance would not explain why the voice-based method that uses four sounds still performed better than the sonar-based method that only uses one sound. Using the participants’ responses during the semi-structured interview and based on our observations during the participants’ interactions with the device, we identified the major difficulties that participants had while interacting with these methods.
Blind and visually impaired people have difficulties moving their hands and fingertips in a straight direction. The axis method is based on the x and y-axis, which implies that the user should navigate in a straight vertical or horizontal line to the target. If the user at any point leaves this line, the audio output will stop. We detected the participants would typically not follow the line in a straight direction but in a diagonal direction. This diagonal direction would lead their fingertips out of the threshold borders of the x–y axis of the target, therefore silencing the audio cues. The participants did not understand why the sound had stopped since they followed and maintained a straight direction in their mental image.

5.2. The Balance between Performance and User Preferences

If we analyze the trial duration, it is clear that the voice is the fastest method. The sonar method’s average trial duration is more similar to the axis- method than to the voice-based method. Moreover, on average, participants made nearly half of fingertip movements on the voice-based method than on the other methods. Supporting these results, participants reported during the semi-structured interviews that they preferred the voice-based method instructions as being more direct. One explanation is that voice-to-text interpretation is something that we human beings frequently do, hence this UI is easier to interpret than the other alternatives.
Nevertheless, if we then analyze the average user ratings, it is clear that the voice and sonar-based methods’ average is distant from the axis-based method. The voice and sonar alternatives are closer to each other in terms of the average user rating, while in speed, the voice method is isolated from the other alternatives. We would expect to have a user rating where the voice method would be isolated as it was in terms of the average trial duration time. The justification for this similar rate between voice and sonar methods involves the participants’ past experiences with sound-based interfaces and the favoritism of each method. A user interface design solution provides both user interfaces, sonar and voice, which has also been proposed for different navigation UIs in large touch screens [11]. Another factor was that the voice method was faster, but it was repetitive and annoying to use, as some participants pointed out. Lastly, while the voice method was restricted to horizontal and vertical instructions, the sonar-based method allowed diagonal movements, which was a positive feature for some participants.

5.3. SVG Graphics Distinctions

We used six SVG graphics split into three groups according to their distinctive characteristics during the tests. From comparing the performance of the trial per graphic, Graphic 6 stands out for its higher average duration time represented in Figure 10 and higher average number of movements per trial represented in Figure 11. The two most divergent outlier trials were both sampled in Graphic 6. These were cropped out from Figure 10 for viewing purposes. Graphic 6 has a set of tactile points (3 mm diameter) irregularly arranged on the tactile paper surface, and its digital elements are blank spaces with no tactile representation. This increases the graphic difficulty since users solely rely on audio feedback and might not expect a target to be positioned in a blank space. The fact that the tactile information is irregularly dispersed in the tactile paper misleads the user’s direction, especially in the axis-based and voice-based methods, where the users follow the axis direction. For observing the interactions, we noticed that users had the impression that the set of tactile points was uniformly displayed in the graphic when it was not. Users would use the points with the intent of moving in vertical or horizontal lines directions when the irregular points would lead them to diagonal directions instead. This is an interesting insight since it shows us that texture perception and sensitivity are different in sighted and blind people, and tactile graphics design plays an important role in perceiving the correct information. No participant could figure out that graphic number 6 tactile points were not dispersed in vertical and horizontal straight directions. Graphic 5 also has blank space digital targets between a set of tactile points. However, these points are uniformly dispersed in straight vertical and horizontal lines, allowing participants to use these as guidelines to move in the direction of the target location, as observed during sessions.

6. Conclusions

As the majority of participants had never interacted with the Tactonom Reader or other dynamic audio-tactile graphics before, this created an opportunity to receive valuable feedback on the development of this emerging technology and evaluate the intuitiveness of the developed audio navigation user interfaces. The results and discussion concluded that the voice-based navigation user interface is superior in terms of speed of use and user rating. Voice-based navigation feedback also succeeds in other assistive technology domains, such as guiding blind people to properly aim cameras [17]. Nevertheless, the tested UIs, including the voice-based navigation, presented limitations. Blind participants complained about repetitive sounds that were not pleasant to hear, such as the error.wav sound of the axis UI and the text-to-speech sounds of the voice UI. An alternative to improve the voice-based user interface is to use recorded speech or more pleasant and understandable text-to-speech engines. This would be less irritating and better understood by users, as reported in previous studies [49].
Participants showed interest and found utility in using at least one audio navigation UI user interface to locate elements in complex tactile graphics. This concludes that a navigation user interface for tactile graphic readers is helpful for BVI people and should be integrated when designing this technology, as well as 2D braille readers and touchscreen devices. As tactile graphics readers and 2D refreshable braille hardware technology continue to grow, it is essential to define the best user interface standards and extend the technology capabilities and application domains in the lives of blind and visually impaired persons. The software developed in this paper supports an audio-menu module for users to choose an element in the current graphic with one of the three dynamic audio navigation UIs. All UIs can be directly implemented (monitoring fingertip positions from the camera or the touch-sensitive surface) in touchscreen devices, tactile graphics readers, and two-dimensional refreshable braille readers that support audio integration, contributing to the development of this emerging technology user interface.

Supplementary Materials

The following supporting information can be downloaded at: https://www.mdpi.com/article/10.3390/mti6120113/s1, File S1: General screening questionnaire; File S2: Semi-structured interview.

Author Contributions

Conceptualization, G.R. and V.S.; methodology, G.R., V.S. and P.K.; software, G.R.; validation, G.R., V.S. and P.K.; formal analysis, G.R. and V.S.; investigation, G.R. and V.S.; resources, G.R. and V.S.; data curation, G.R. and V.S.; writing—original draft preparation, G.R. and V.S.; writing—review and editing, G.R., V.S. and P.K.; visualization, G.R.; supervision, G.R., V.S. and P.K.; project administration, G.R., V.S. and P.K.; funding acquisition, G.R. All authors have read and agreed to the published version of the manuscript.

Funding

This research was funded by the European Union’s Horizon 2020 research and innovation program under the Marie Sklodowska-Curie grant agreement no. 861166 (INTUITIVE—innovative network for training in touch interactive interfaces).

Institutional Review Board Statement

The study was conducted in accordance with the Declaration of Helsinki, and approved by the Ethics Committee of Osnabrück University (code: Ethik-66/2021, 22 December 2021).

Informed Consent Statement

Informed consent was obtained from all subjects involved in the study.

Data Availability Statement

Data are included in this paper.

Acknowledgments

Special thanks to the Osnabrück branch of the Blind and Visually Impaired Association of Lower Saxony (BVN) for providing the spaces where user tests took place and for contacting the participants.

Conflicts of Interest

Gaspar Ramôa is a software engineer at Inventivio GmbH in Germany. Vincent Schmidt and Peter König declare no conflict of interest. The funders had no role in the design of the study; in the collection, analyses, or interpretation of data; in the writing of the manuscript; or in the decision to publish the results.

References

  1. Bornschein, D. Redesigning Input Controls of a Touch-Sensitive Pin-Matrix Device. Proc. Int. Workshop Tactile/Haptic User Interfaces Tabletops Tablets Held Conjunction ACM ITS 2014, 1324, 19–24. [Google Scholar]
  2. Völkel, T.; Weber, G.; Baumann, U. Tactile Graphics Revised: The Novel BrailleDis 9000 Pin-Matrix Device with Multitouch Input. In ICCHP 2008: Computers Helping People with Special Needs; Springer: Linz, Autria, 2008; Volume 5105, pp. 835–842. [Google Scholar] [CrossRef]
  3. Bornschein, D.; Bornschein, J.; Köhlmann, W.; Weber, G. Touching graphical applications: Bimanual tactile interaction on the HyperBraille pin-matrix display. Univers. Access Inf. Soc. 2018, 17, 391–409. [Google Scholar] [CrossRef]
  4. Bornschein, J. BrailleIO—A Tactile Display Abstraction Framework. Proc. Int. Workshop Tactile/Haptic User Interfaces Tabletops Tablets Held Conjunction ACM ITS 2014, 1324, 36–41. [Google Scholar]
  5. Bornschein, J.; Weber, G.; Götzelmann, T. Multimodales Kollaboratives Zeichensystem für Blinde Benutzer; Technische Universität Dresden: Dresden, Germany, 2020. [Google Scholar]
  6. Crusco, A.H.; Wetzel, C.G. The Midas touch: The effects of interpersonal touch on restaurant tipping. Personal. Soc. Psychol. Bull. 1984, 10, 512–517. [Google Scholar] [CrossRef]
  7. Ramôa, G. Classification of 2D refreshable tactile user interfaces. Assist. Technol. Access. Incl. ICCHP AAATE 2022, 1, 186–192. [Google Scholar] [CrossRef]
  8. Engel, C.; Konrad, N.; Weber, G. TouchPen: Rich Interaction Technique for Audio-Tactile Charts by Means of Digital Pens. In International Conference on Computers Helping People with Special Needs; Springer International Publishing: Lecco, Italy, 2020; pp. 446–455. [Google Scholar]
  9. Goncu, C.; Madugalla, A.; Marinai, S.; Marriott, K. Accessible On-Line Floor Plans. In Proceedings of the 24th International Conference on World Wide Web, Florence, Italy, 18–22 May 2015; International World Wide Web Conferences Steering Committee: Geneva, Switzerland, 2015; pp. 388–398. [Google Scholar] [CrossRef] [Green Version]
  10. Freitas, D.; Kouroupetroglou, G. Speech technologies for blind and low vision persons. Technol. Disabil. 2008, 20, 135–156. [Google Scholar] [CrossRef]
  11. Kane, S.K.; Morris, M.R.; Perkins, A.Z.; Wigdor, D.; Ladner, R.E.; Wobbrock, J.O. Access Overlays: Improving Non-Visual Access to Large Touch Screens for Blind Users. In Proceedings of the 24th Annual ACM Symposium on User Interface Software and Technology, Santa Barbara, CA, USA, 16–19 October 2011; Association for Computing Machinery: New York, NY, USA, 2011; pp. 273–282. [Google Scholar] [CrossRef]
  12. Radecki, A.; Bujacz, M.; Skulimowski, P.; Strumiłło, P. Interactive sonification of images in serious games as an education aid for visually impaired children. Br. J. Educ. Technol. 2020, 51, 473–497. [Google Scholar] [CrossRef]
  13. Poppinga, B.; Magnusson, C.; Pielot, M.; Rassmus-Gröhn, K. TouchOver Map: Audio-Tactile Exploration of Interactive Maps. In Proceedings of the 13th International Conference on Human Computer Interaction with Mobile Devices and Services, Stockholm, Sweden, 30 August–2 September 2011; Association for Computing Machinery: New York, NY, USA, 2011; pp. 545–550. [Google Scholar] [CrossRef]
  14. He, L.; Wan, Z.; Findlater, L.; Froehlich, J.E. TacTILE: A Preliminary Toolchain for Creating Accessible Graphics with 3D-Printed Overlays and Auditory Annotations. In Proceedings of the 19th International ACM SIGACCESS Conference on Computers and Accessibility, Baltimore, MD, USA, 20 October–1 November 2017; Association for Computing Machinery: New York, NY, USA, 2017; pp. 397–398. [Google Scholar] [CrossRef]
  15. Jagdish, D.; Sawhney, R.; Gupta, M.; Nangia, S. Sonic Grid: An Auditory Interface for the Visually Impaired to Navigate GUI-Based Environments. In Proceedings of the 13th International Conference on Intelligent User Interfaces, Gran Canaria, Spain, 13–16 January 2008; Association for Computing Machinery: New York, NY, USA, 2008; pp. 337–340. [Google Scholar] [CrossRef]
  16. Goncu, C.; Marriott, K. GraVVITAS: Generic Multi-touch Presentation of Accessible Graphics. In Human-Computer Interaction—INTERACT 2011; Campos, P., Graham, N., Jorge, J., Nunes, N., Palanque, P., Winckler, M., Eds.; Springer: Berlin/Heidelberg, Germany, 2011; pp. 30–48. [Google Scholar]
  17. Vázquez, M.; Steinfeld, A. Helping Visually Impaired Users Properly Aim a Camera. In Proceedings of the 14th International ACM SIGACCESS Conference on Computers and Accessibility, Boulder, CO, USA, 22–24 October 2012; Association for Computing Machinery: New York, NY, USA, 2012; pp. 95–102. [Google Scholar] [CrossRef]
  18. Tekin, E.; Coughlan, J.M. A Mobile Phone Application Enabling Visually Impaired Users to Find and Read Product Barcodes. In Computers Helping People with Special Needs; Springer: Berlin/Heidelberg, Germany, 2010; pp. 290–295. [Google Scholar]
  19. Götzelmann, T.; Winkler, K. SmartTactMaps: A Smartphone-Based Approach to Support Blind Persons in Exploring Tactile Maps. In Proceedings of the 8th ACM International Conference on PErvasive Technologies Related to Assistive Environments, Corfu, Greece, 1–3 July 2015; Association for Computing Machinery: New York, NY, USA, 2015. [Google Scholar] [CrossRef]
  20. Baker, C.M.; Milne, L.R.; Scofield, J.; Bennett, C.L.; Ladner, R.E. Tactile Graphics with a Voice: Using QR Codes to Access Text in Tactile Graphics. In Proceedings of the 16th International ACM SIGACCESS Conference on Computers & Accessibility, Rochester, NY, USA, 20–22 October 2014; Association for Computing Machinery: New York, NY, USA, 2014; pp. 75–82. [Google Scholar] [CrossRef]
  21. Yang, J.; Jiangtao, G.; Yingqing, X. Graille: Design research of graphical tactile display for the visually impaired. Decorate 2016, 1, 94–96. [Google Scholar]
  22. Prescher, D.; Weber, G. Locating widgets in different tactile information visualizations. In International Conference on Computers Helping People with Special Needs; Springer International Publishing: Linz, Austria, 2016; pp. 100–107. [Google Scholar]
  23. Bornschein, J.; Prescher, D.; Weber, G. Collaborative Creation of Digital Tactile Graphics. In Proceedings of the 17th International ACM SIGACCESS Conference on Computers & Accessibility, Lisbon, Portugal, 26–28 October 2015; Association for Computing Machinery: New York, NY, USA, 2015; pp. 117–126. [Google Scholar] [CrossRef]
  24. Prescher, D.; Weber, G.; Spindler, M. A Tactile Windowing System for Blind Users. In Proceedings of the 12th International ACM SIGACCESS Conference on Computers and Accessibility, Orlando, FL, USA, 25–27 October 2010; Association for Computing Machinery: New York, NY, USA, 2010; pp. 91–98. [Google Scholar] [CrossRef]
  25. Melfi, G.; Müller, K.; Schwarz, T.; Jaworek, G.; Stiefelhagen, R. Understanding What You Feel: A Mobile Audio-Tactile System for Graphics Used at Schools with Students with Visual Impairment. In Proceedings of the 2020 CHI Conference on Human Factors in Computing Systems, Honolulu, HI, USA, 25–30 April 2020; Association for Computing Machinery: New York, NY, USA, 2020; pp. 1–12. [Google Scholar]
  26. Brock, A.M.; Truillet, P.; Oriola, B.; Picard, D.; Jouffrais, C. Interactivity Improves Usability of Geographic Maps for Visually Impaired People. Hum. Comput. Interact. 2015, 30, 156–194. [Google Scholar] [CrossRef]
  27. Fusco, G.; Morash, V.S. The Tactile Graphics Helper: Providing Audio Clarification for Tactile Graphics Using Machine Vision. In Proceedings of the 17th International ACM SIGACCESS Conference on Computers & Accessibility, Lisbon, Portugal, 26–28 October 2015; Association for Computing Machinery: New York, NY, USA, 2015; pp. 97–106. [Google Scholar] [CrossRef]
  28. Brock, A.; Jouffrais, C. Interactive Audio-Tactile Maps for Visually Impaired People. SIGACCESS Access. Comput. 2015, 113, 3–12. [Google Scholar] [CrossRef] [Green Version]
  29. Gardner, J.A.; Bulatov, V. Scientific Diagrams Made Easy with IVEOTM. In Computers Helping People with Special Needs; Miesenberger, K., Klaus, J., Zagler, W.L., Karshmer, A.I., Eds.; Springer: Berlin/Heidelberg, Germany, 2006; pp. 1243–1250. [Google Scholar] [CrossRef]
  30. Landau, S.; Gourgey, K. Development of a talking tactile tablet. Inf. Technol. Disabil. 2001, 7. Available online: https://www.researchgate.net/publication/243786112_Development_of_a_talking_tactile_tablet (accessed on 10 October 2022).
  31. Götzelmann, T. CapMaps. In Computers Helping People with Special Needs; Miesenberger, K., Bühler, C., Penaz, P., Eds.; Springer International Publishing: Cham, Switzerland, 2016; pp. 146–152. [Google Scholar]
  32. Götzelmann, T. LucentMaps: 3D Printed Audiovisual Tactile Maps for Blind and Visually Impaired People. In Proceedings of the 18th International ACM SIGACCESS Conference on Computers and Accessibility, Reno, NV, USA, 23–26 October 2016; Association for Computing Machinery: New York, NY, USA, 2016; pp. 81–90. [Google Scholar] [CrossRef]
  33. Melfi, G.; Baumgarten, J.; Müller, K.; Stiefelhagen, R. An Audio-Tactile System for Visually Impaired People to Explore Indoor Maps. In Computers Helping People with Special Needs; Miesenberger, K., Kouroupetroglou, G., Mavrou, K., Manduchi, R., Covarrubias Rodriguez, M., Penáz, P., Eds.; Springer International Publishing: Cham, Switzerland, 2022; pp. 134–142. [Google Scholar]
  34. Engel, C.; Weber, G. ATIM: Automated Generation of Interactive, Audio-Tactile Indoor Maps by Means of a Digital Pen. In Computers Helping People with Special Needs; Miesenberger, K., Kouroupetroglou, G., Mavrou, K., Manduchi, R., Covarrubias Rodriguez, M., Penáz, P., Eds.; Springer International Publishing: Cham, Switzerland, 2022; pp. 123–133. [Google Scholar]
  35. Suzuki, R.; Stangl, A.; Gross, M.D.; Yeh, T. FluxMarker: Enhancing Tactile Graphics with Dynamic Tactile Markers. In Proceedings of the 19th International ACM SIGACCESS Conference on Computers and Accessibility, Baltimore, MD, USA, 20 October–1 November 2017; Association for Computing Machinery: New York, NY, USA, 2017; pp. 190–199. [Google Scholar] [CrossRef]
  36. Chase, E.D.Z.; Siu, A.F.; Boadi-Agyemang, A.; Kim, G.S.H.; Gonzalez, E.J.; Follmer, S. PantoGuide: A Haptic and Audio Guidance System To Support Tactile Graphics Exploration. In Proceedings of the the 22nd International ACM SIGACCESS Conference on Computers and Accessibility, Vitual, 26–28 October 2020; Association for Computing Machinery: New York, NY, USA, 2020. [Google Scholar] [CrossRef]
  37. Horvath, S.; Galeotti, J.; Wu, B.; Klatzky, R.; Siegel, M.; Stetten, G. FingerSight: Fingertip Haptic Sensing of the Visual Environment. IEEE J. Transl. Eng. Health Med. 2014, 2, 2700109. [Google Scholar] [CrossRef] [PubMed]
  38. Li, J.; Kim, S.; Miele, J.A.; Agrawala, M.; Follmer, S. Editing Spatial Layouts through Tactile Templates for People with Visual Impairments. In Proceedings of the 2019 CHI Conference on Human Factors in Computing Systems, Glasgow, UK, 4–9 May 2019; Association for Computing Machinery: New York, NY, USA, 2019; pp. 1–11. [Google Scholar] [CrossRef]
  39. Tsai, H.R.; Chang, Y.C.; Wei, T.Y.; Tsao, C.A.; Koo, X.C.Y.; Wang, H.C.; Chen, B.Y. GuideBand: Intuitive 3D Multilevel Force Guidance on a Wristband in Virtual Reality. In Proceedings of the 2021 CHI Conference on Human Factors in Computing Systems, Yokohama, Japan, 8–13 May 2021; Association for Computing Machinery: New York, NY, USA, 2021. [Google Scholar] [CrossRef]
  40. Walker, J.M.; Zemiti, N.; Poignet, P.; Okamura, A.M. Holdable Haptic Device for 4-DOF Motion Guidance. In Proceedings of the 2019 IEEE World Haptics Conference (WHC), Tokyo, Japan, 9–12 July 2019; pp. 109–114. [Google Scholar]
  41. EBU. About Blindness and Partial Sight. 2020. Available online: https://www.euroblind.org/about-blindness-and-partial-sight (accessed on 10 October 2022).
  42. Takagi, H.; Saito, S.; Fukuda, K.; Asakawa, C. Analysis of Navigability of Web Applications for Improving Blind Usability. ACM Trans. Comput. Hum. Interact. 2007, 14, 13-es. [Google Scholar] [CrossRef]
  43. Petrie, H.; Hamilton, F.; King, N.; Pavan, P. Remote Usability Evaluations with Disabled People. In Proceedings of the SIGCHI Conference on Human Factors in Computing Systems; Association for Computing Machinery: New York, NY, USA, 2006; pp. 1133–1141. [Google Scholar] [CrossRef]
  44. Madugalla, A.; Marriott, K.; Marinai, S.; Capobianco, S.; Goncu, C. Creating Accessible Online Floor Plans for Visually Impaired Readers. ACM Trans. Access. Comput. 2020, 13, 1–37. [Google Scholar] [CrossRef]
  45. Inventivio GmbH. Tactonom Reader (The Tactile Graphics Reader); Inventivio GmbH: Nürnberg, Germany, 2022; Available online: https://www.tactonom.com/en/tactonomreader-2/ (accessed on 10 October 2022).
  46. ProBlind. ProBlind (Open-Source Tactile Graphics Dataset); ProBlind: Nürnberg, Germany, 2022; Available online: https://www.problind.org/en/ (accessed on 10 October 2022).
  47. Merz, E.X. Sonifying Processing: The Beads Tutorial. 2011, pp. 1–138. Available online: https://emptyurglass.com/wp-content/uploads/2018/02/Sonifying_Processing_The_Beads_Tutorial.pdf (accessed on 10 October 2022).
  48. Piaf Tactile: Adaptive Technology. PIAF Tactile Image Maker; Herpo: Poznań, Poland, 2022; Available online: https://piaf-tactile.com/ (accessed on 10 October 2022).
  49. Petit, G.; Dufresne, A.; Levesque, V.; Hayward, V.; Trudeau, N. Refreshable Tactile Graphics Applied to Schoolbook Illustrations for Students with Visual Impairment. In Proceedings of the 10th International ACM SIGACCESS Conference on Computers and Accessibility, Halifax, NS, Canada, 13–15 October 2008; Association for Computing Machinery: New York, NY, USA, 2008; pp. 89–96. [Google Scholar] [CrossRef]
Figure 1. The Tactonom Reader’s process control.
Mti 06 00113 g001
Figure 2. Sonar dynamic navigation UI.
Mti 06 00113 g002
Figure 3. Axis dynamic navigation UI.
Mti 06 00113 g003
Figure 4. Voice dynamic navigation UI.
Mti 06 00113 g004
Figure 5. SVG graphics used in the study. The yellow elements represent the digitally labeled audio information. The black information represents the tactile information that participants could perceive. The first graphic entitled “Germany” is for contextualization with the new technology. The Tutorial graphic was used to train the audio navigation UIs. The following six graphics were used for testing purposes. The blue markers are not tactile sensitive and only used for mapping the tactile graphic to the digital format. The blue title texts were enlarged for viewing purposes.
Mti 06 00113 g005
Figure 6. Trial duration (s) distribution per navigation UI.
Mti 06 00113 g006
Figure 7. Navigation UI trial time duration (s) in a function of the distance from the initial to a target position (pixels).
Mti 06 00113 g007
Figure 8. Participant’s move count distribution per navigation UI.
Mti 06 00113 g008
Figure 9. User rating on the usability of the navigation user interfaces.
Mti 06 00113 g009
Figure 10. Trial time duration comparison with the six tested SVG graphics.
Mti 06 00113 g010
Figure 11. Participant’s move counts distribution per SVG graphic.
Mti 06 00113 g011
Figure 12. Initial user’s fingertip position in the x–y pixel coordinates (640 × 480) on the Tactonom Reader display. The left plot correlates the x–y position with the type of navigation user interface and the right plot correlates with the SVG graphic used. The black cross represents the center of gravity.
Mti 06 00113 g012
Publisher’s Note: MDPI stays neutral with regard to jurisdictional claims in published maps and institutional affiliations.

