1. Introduction
In Urology, gross haematuria is a common condition with visible blood in the urine. Gross haematuria can be due to various pathologies in the urinary tract, or a result due to bladder and prostate surgery. Continuous bladder irrigation is routinely performed to prevent blood clots from forming in the bladder and causing a blockage. Nurses are required to ensure the continuous flow, monitor the severity of gross hematuria, and to increase or decrease the infusion rate manually when necessary. They must continuously chart the volume of saline irrigation used and also drained from the bladder, ensuring that the volumes are equal. This daunting task is labor-intensive and sometimes causes a lapse in monitoring in a busy surgical ward. Patients often face situations when the irrigation stops as the nurse is unable to replace the solution in time. This situation, in turn, may cause blockage of catheter outflow tubing due to blood clots, causing bladder distension and pain to the patient. Automation would help to simplify this action so that nurses or other medical professionals can concentrate on patients who require more attention.
The other problem in this process is that there is no standardization in analyzing the severity of gross haematuria. Healthcare workers visually inspect the blood-stained urine and interpret the severity based on their clinical experience. The varying interpretations have given rise to misunderstanding and confusion in diagnosis and treatment. Many have developed standardized systems using color differences and visual analog scales. The Hemostick [
1], Haematuria Grading Scale [
2,
3] created visual comparison charts to differentiate different blood concentrations in gross hematuria using different colors of gross hematuria and urine. Sakuma [
4] utilizes the visibility of the Roman Numerical “II” to analyze the severity. There are still limitations in those quantification systems as patients may produce a color of gross haematuria that is not stated in these charts. A better method is needed to standardize and scientifically quantify the analysis of gross haematuria.
The visible light spectrum has been utilized in blood detection. One of the typical applications is photoplethysmography (PPG) [
5,
6,
7]. As hemoglobin would absorb infrared light in PPG, the presence of blood would disrupt or redirect the signal transmission between the near-infrared light receiver, thus calculating the heart rate of the subject. Other noninvasive methods utilize both red light and near-infrared light to detect the presence of blood in certain parts of the body [
8,
9,
10,
11,
12,
13] as hemoglobin in red blood cells allows red color light to be transmitted through the cells. The automatic bladder irrigation created by Ding et al. [
14] has utilized color sensors to detect different blood concentration values to control the rate of saline drip. Based on that, we propose an automatic feedback control system to control saline drip based on blood concentration detected. The system consists of two main components. The first component is a sensor probe that differentiates blood concentration in gross hematuria using the principle of light absorption of blood samples. The second component is a gripper that controls the saline drip-rate via a software program.
The core contributions of our paper are:
- (1)
An alternative noninvasive system to detect blood concentration in gross hematuria;
- (2)
Detecting and quantifying the exact blood concentration real-time using the principle of light absorption;
- (3)
The quantification process reduces human error due to the subjective assessment of individual medical professionals.
This paper is organized in the following sections.
Section 2 focuses on the design of the sensor probe, the gripper, and the feedback control system.
Section 3 discusses the experiments that were done to validate our idea. Finally,
Section 4 focuses on the outcome of the experiments, limitations of the current design, the experiments, and improvements in the future.
2. Materials and Methods
The automated bladder irrigation system consists of two independent systems connected—the sensing probe and the mechanical gripper. The two systems are connected via an Arduino Uno Board, thus creating a feedback control system for automatic bladder irrigation.
2.1. The Sensing Probe
The sensing probe measures the blood concentration in the gross haematuria samples. The sensing probe itself has three components—LED light, Light Dependent Resistor (LDR), and the clip, as shown in
Figure 1. The LED emits light of different colors powered using an external electric source. It can emit different types of color light, primarily red light, blue light, and green light. Modifying the circuit that provides electricity for the LED light enables the LED light to emit different light colors. The LDR is connected to the Arduino Uno Board and converts light intensity measured into voltage. Resistors were placed in the electric circuit between the board and the LDR to prevent overheating and optimize the LDR performance. From the principle of light absorption, varying blood concentration samples blocks different quantity of light, thus identifying different blood concentration values through this method. Finally, the mechanical clip enables the sensing probe to be clipped onto the urinal tube and provides an enclosed environment to measure the blood concentration in gross hematuria and also reduces the noise created from the external environment. The mechanical clip is created using 3D printing, which enables users to customize the gripper based on different equipment or tubing in the urology surgical wards.
2.2. The Mechanical Clip and Feedback Control System
The mechanical gripper controls the rate of the drip of the saline bag, as shown in
Figure 2. Like the mechanical clip of the sensing probe, the gripper is also created using 3D printing so that the users can create the gripper based on the environment in the surgical wards. While the gripper itself is created using Polylactic acid (PLA), the spring of the mechanical gripper is also produced via 3D printing using the soft material called Ninja Flex. The mechanical gripper is controlled by a servomotor. Based on the data received from the Arduino Uno Board, the servo motor controls the angle of movement of the gripper and therefore controls the rate of the saline drip rate by jamming the saline tube fully or partially as shown in
Figure 2. If the sensing probe detected little or no blood in the gross hematuria samples, washout is not required. The gripper will jam the saline tube by gripping it entirely, and no saline water flows to the wound. On the other hand, if high blood concentration is detected in the washout through the sensing probe, the gripper will open the saline tube for saline water to flow through and conduct washout on the wound.
The feedback control system of the automatic bladder irrigation system is controlled using the Arduino Uno Board. By installing preset programs and algorithms, the Arduino Uno Board can send, transmit, and receive data between the two components, as shown in
Figure 2.
3. Results
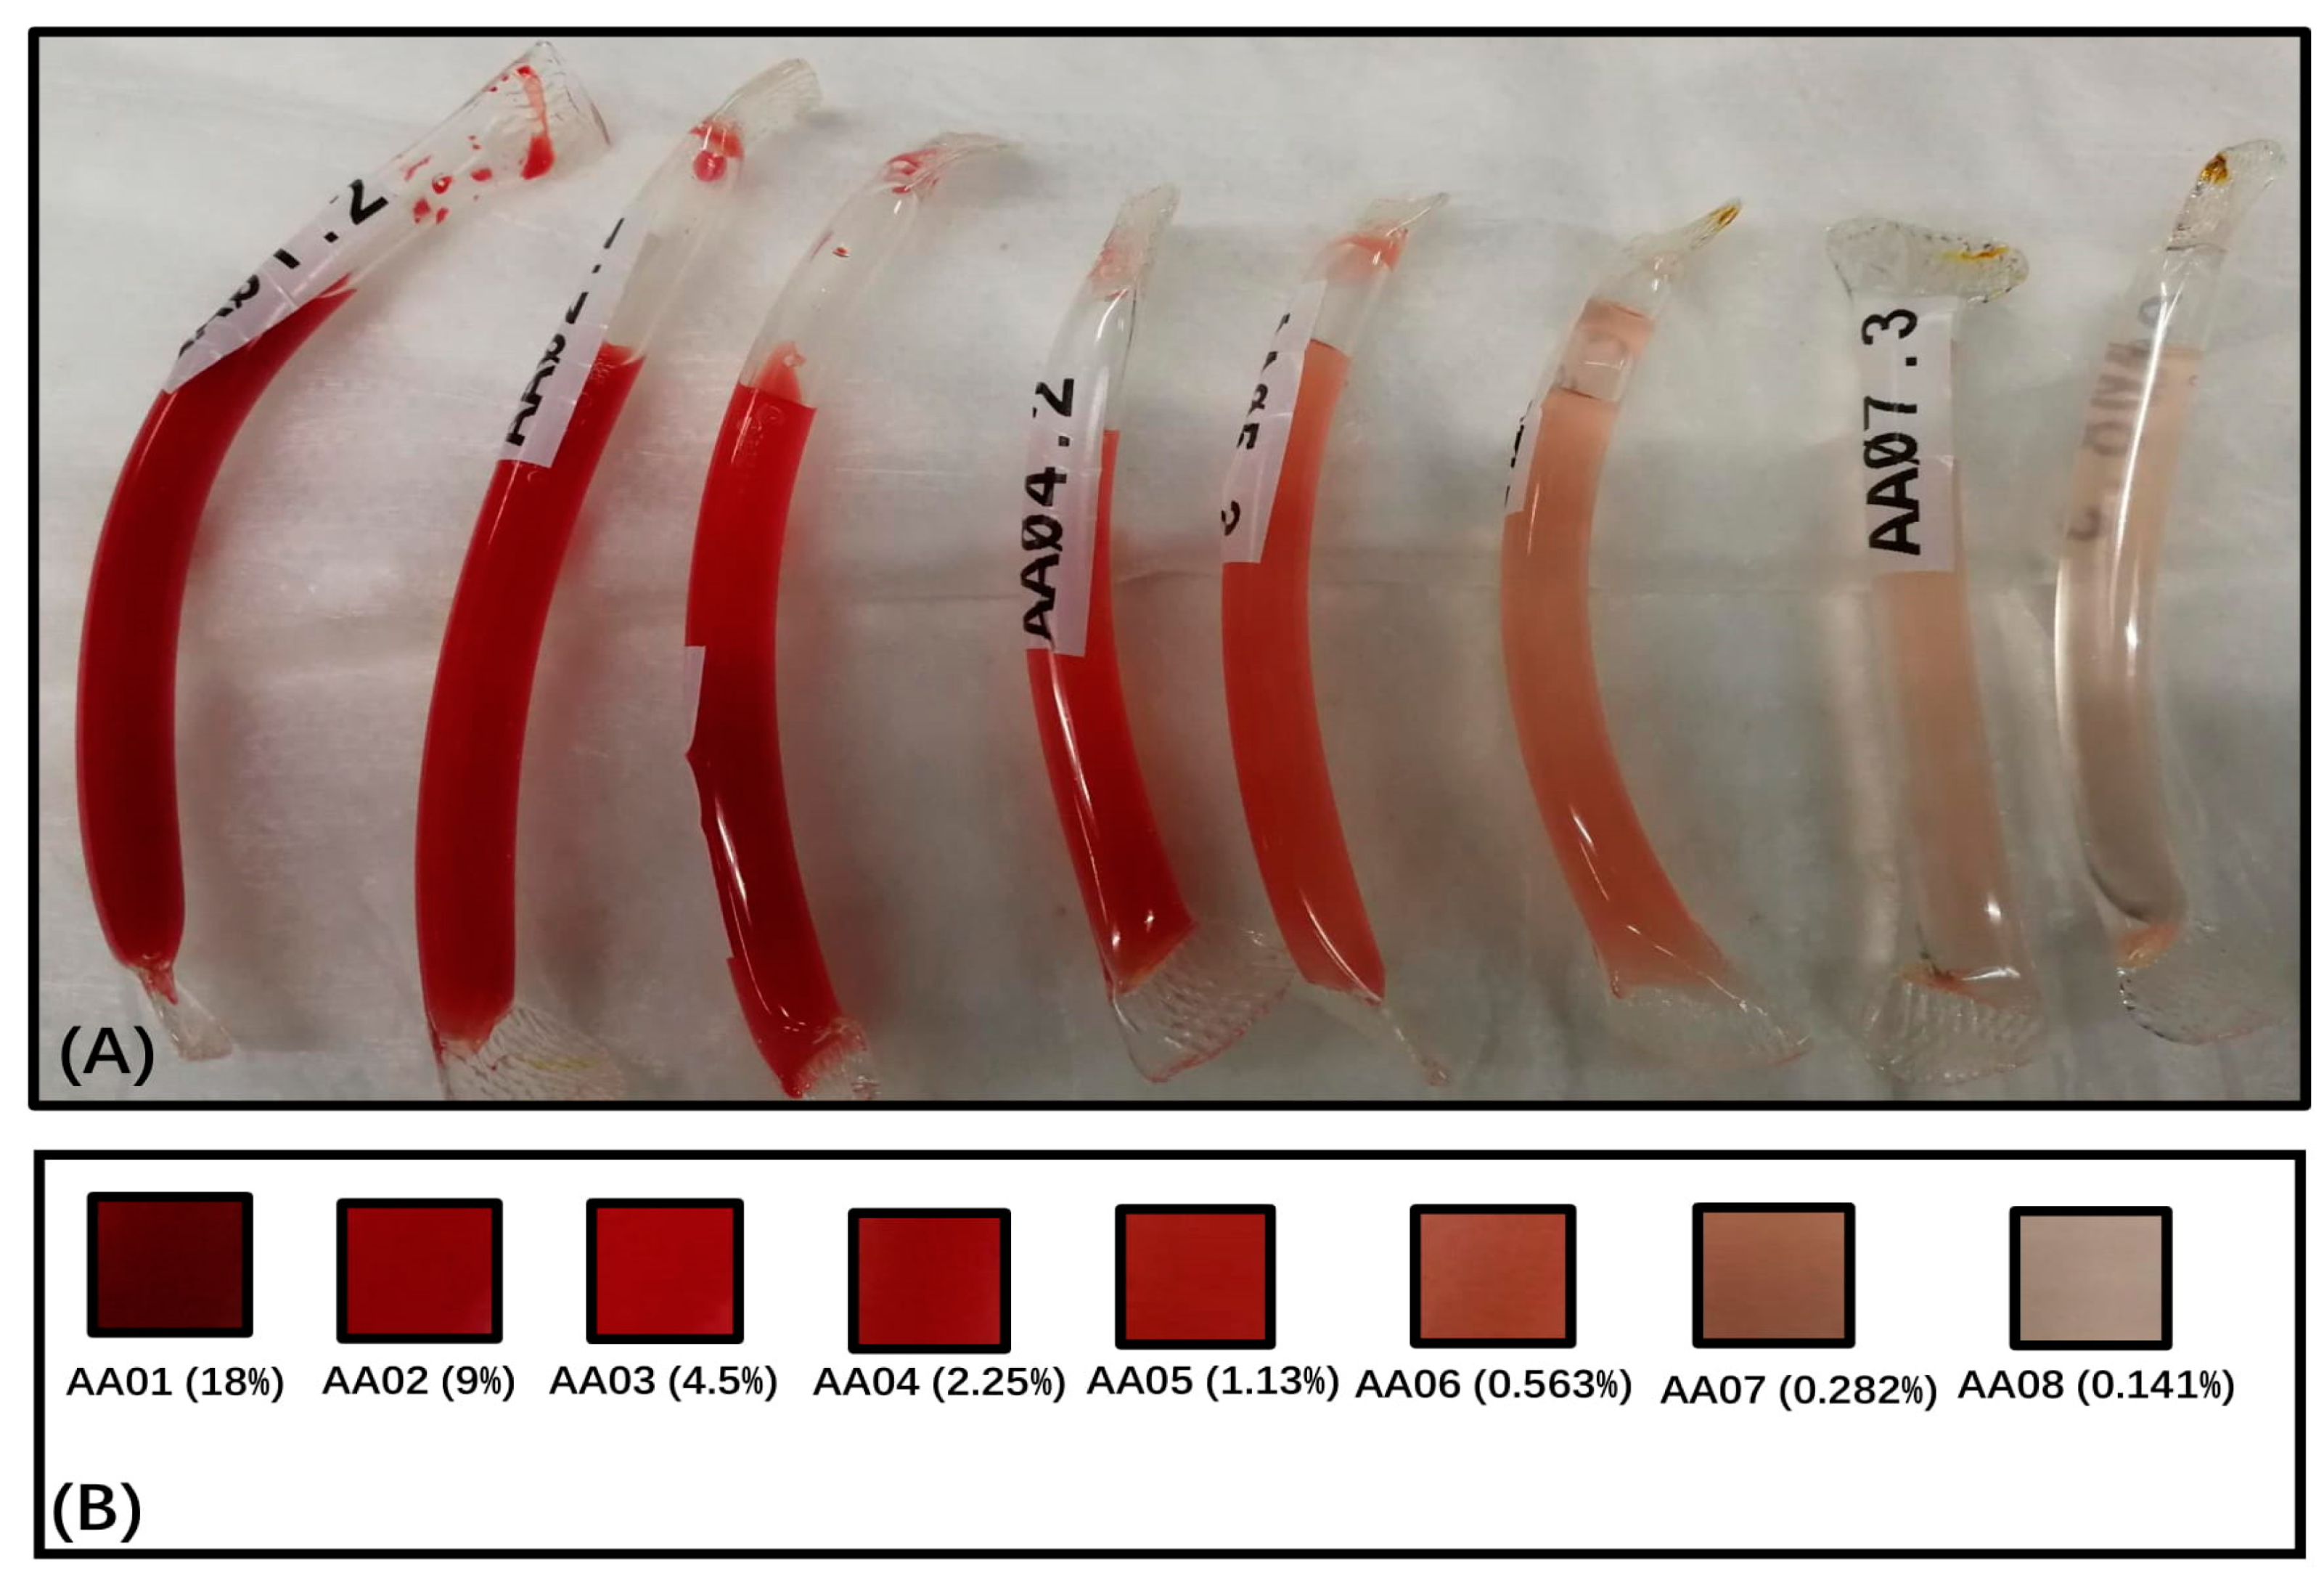
A series of experiments were conducted to validate the feasibility of the idea and focused on calibrating the sensing probe and the mechanical gripper to ensure accurate and optimum performance during operation. Blood samples of different blood concentrations between 0.141 and 18 percent were prepared by mixing it with saline water, as shown in
Figure 3. As the primary purpose of the sensing probe is to measure blood concentration at this stage of this project, pure urine was not added into the sample. The blood concentration of the samples was kept in this range as blood exceeding 18% would look the same while blood concentration less than 0.1% does not make much color difference.
3.1. LED Color Test
This experiment is to identify the color light that can detect a broad range of blood concentration values and differentiate each blood concentration values specifically. Green, blue, and red color light were tested in this experiment to see which color light spectrum was the best to differentiate blood concentration. The resistance of the LDR was kept at 1-kilo ohms. When no blood sample is measured, a high digital value is measured. A drop is shown in the reading when a sample is placed. The capability of the light spectrum is measured based on the voltage difference measured, which represents the amount of light absorbed by the blood. The equation for calculating the voltage reading is as follow:
3.2. Voltage Reading = Analog Reading × (5.0 V/1023)
From the test results, as shown in
Figure 4, the red color light spectrum was the worst compared to the blue and green color light spectrum in measuring blood concentration as it can pass through the hemoglobin in the red blood cell. The difference between each blood concentration value was negligible. On the other hand, the blue color light spectrum and green color light spectrum had comparable performance and were able to detect different concentrations better as the two color spectrums were absorbed by the hemoglobin.
A deoxidized test was also conducted, as shown in
Figure 5. Deoxidized blood (old blood) would have a much darker color as compared to the fresh blood that was extracted out from the human immediately. To see if the sensing probe can differentiate fresh blood and old blood, blood samples were stored for six months and eight months and then compared to see the difference in blood color using the green LED light color. The results have shown that there is a significant difference in the voltage readings between fresh blood and old blood.
3.3. Light Intensity Test
As mentioned earlier in the paper, the mechanical clip blocks out an external light source that affects the accuracy of the measurement and must work properly under different light intensity conditions in the unprotected external environment. This experiment was conducted to see if differing external light intensity would affect the performance of the probe.
As shown in
Figure 6, the probe was modified to black color to block out as much light inference from the external environment and isolated the LDR totally from the external environment. The experiment was then repeated under the same light intensity conditions. The black probe reduces the difference between the measurement under the bright light condition and the two other conditions, producing a much stable result.
3.4. Resistor Value Calibration Test
The resistance of the LDR circuit affects the performance of the component on the range of blood concentration values that can be measured. The experiment was done to find out the range of resistance that will provide the optimum performance for the LDR measuring blood concentration between 0.141 and 18 percent. The experiment was conducted with both green color light, which shows that resistance between 150 and 200 ohms provides the best range of measurements, as shown in
Figure 7. Besides, as shown in
Figure 8, the performance of the three color spectrums remains the same, with the red color spectrum the worst, and both the green and the blue color spectrum are still prominent.
3.5. Gripper Intensity Test
The measurement values of the sensor probe control the angular movement of the mechanical gripper, which will compress the saline tube to control the saline drip-rate, as shown in
Figure 9. Measuring the diameter of the saline tube when it was compressed will determine the flow rate of the saline drip. This experiment validates if a simple feedback control system can be created between the mechanical gripper and the sensing probe.
The diameter of the compressed saline tube was measured after each actuation took when a blood concentration value is read by the sensor probe. An equation has been calculated to find a relationship between the value of the blood concentration and the diameter of the compressed saline tube, as shown in
Figure 10. Different measurements were compared to see the relationship between different measurements. The results have indicated that there is a directly proportional relationship between the voltage measured by the sensor probe and the outer diameter of the saline tube, thus indicating that a simple feedback control system for the automatic bladder irrigation control can be created.
The current presence of urine in a substance or mixture is detected via the presence of urochrome or urobilin that gives the urine its yellow color. The most common method is dipstick test [
15] which analyzes urine composition using chemical means and other noninvasive methods such as Ultraviolet (UV) light whereby the method can be time to consume [
16,
17]. From the results, as shown in
Figure 11, the amount of light intensity detected by the LDR is very negligible. However, the resistance calibration test has shown that the sensing probe can detect different urine concentration once the correct resistance value is set. In other words, the urine concentration in gross haematuria has the potential to affect the accuracy in detecting the blood concentration.
Finding a light color that can identify urochrome in hematuria mixture would provide a cheaper alternative to the urine detection methods. Once the light color spectrum to identify urochrome concentration is found, the next experiment would be conducted to find out if the two light color spectrums can be identified both urochrome concentration and blood concentration in haematuria mixture. If so, the probe design would be improved to hold two different circuit systems rather than the current circuit, which holds only one. If not, more experiments would be done to find out the other light color spectrum that can identify the haematuria mixture.
4. Discussion
Benefits have been observed during the conduct of the experiment. The findings in this project provided a novel method for detecting and confirming the blood concentration values in gross hematuria. The performance of the sensor probe has been validated, and it can be modified into an independent component to detect blood concentration in gross haematuria for real-time analysis. This device enables the monitoring of washout conditions more accurately. Therefore, adequate and correct treatment can be provided in a timely fashion, minimizing the inter-observer variability of gross hematuria and aid in communication between healthcare workers. Besides, the application of the irrigation system allows healthcare workers to quantify gross hematuria with reduced inaccuracy due to personal inspection. Overall, the system allows healthcare workers to optimize saline water bags by controlling their drip-rate based on the blood concentration detected by the sensor probe. Overall workforce time of healthcare workers could potentially be saved due to the increased efficiency and reduction in the need for frequent monitoring using this system.
However, limitations also have been observed, and further improvement must be made on the system, and more experiments need to be conducted so that the system can provide more stable and reducible results. The addition of new components can also enhance the performance of the system. The team would explore and create different gripper designs using more silent Smart Metal Alloys. In the design of sensor probes testing other designs such as light refraction and reflection should be done and compared with the current design. Having more color light spectrum in the sensor probe allows it to detect additional substances or impurities in the samples such as urine and haematuria mixture. With that, the mechanical design of the sensor probe will need to be modified to accommodate a more complex circuit system. Besides, adding a tactile sensor to the saline tube would provide another measurement for the feedback system, ensuring the gripper actuates to the correct position when noise such as friction in the servo motor affects the actuation of the gripper.
In addition, the automation of the bladder irrigation system would help optimize the usage of saline drip. According to the research conducted by Ding et al. [
14], the mean irrigation volume for patients using automatic irrigation (24.2 ± 3.8 L) was significantly lower than that of the patients who use traditional manual irrigation methods (54.6 ± 5.4 L) (
p < 0.05). This scenario is because care personnel or patients’ family members are inclined to regulate the flow rate faster than theory value, which may increase the irrigation volume, therefore causing wastage and unable to prevent complications of bladder irrigation. Compared with the traditional manual bladder irrigation, automatic bladder irrigation decreased the incidence of complications after irrigation. The research [
14] also states that there were no significant differences in irrigation time and hospital stay between patients that use manual irrigation and automatic irrigation, which suggests that the novel irrigation system does not lengthen the time of irrigation and hospital stays of patients.
The proposed approach can identify the level of severeness from the color spectrum of the samples. Still, it has limitations in accurately detecting blood concentration, given a different amount of urine in the mixture. The accuracy potentially affects the efficacy of the method and should be further evaluated in the future. Future experiments would be involved in comparing with current irrigation methods with the different levels of severeness and concentration accuracy detection to enhance the efficiency of the device. Conducting clinical studies in the local context will validate automated bladder irrigation devices’ effectiveness compared to traditional manual irrigation.
Author Contributions
H.R., Q.W. and K.W.C. conceived the concepts and designed the project. Y.H.C. is the mechanical and electrical designer of this research. H.R. is the main supervisor and contributing with Y.H.C. in this research for technical expertise. E.C., Q.W. and K.W.C. are contributing to this research for medical knowledge expertise. All authors contributed to the writing and editing of the article. All authors have read and agreed to the published version of the manuscript.
Funding
NMRC Bedside & Bench under grant R-397-000-245-511 and Master of Clinical Investigator student research project fund, National University of Singapore.
Acknowledgments
This project is in part supported by NMRC Bedside & Bench under grant R-397-000-245-511 and Master of Clinical Investigator student research project fund, National University of Singapore.
Conflicts of Interest
The authors have no financial/commercial Conflict of Interest.
References
- Hageman, N.; Aronsen, T.; Tiselius, H.G. A simple device (hemostick®) for the standardized description of macroscopic haematuria, our initial experience. Scand. J. Urol. Nephrol. 2006, 40, 149–154. [Google Scholar] [CrossRef] [PubMed]
- Lee, J.Y.; Chang, J.S.; Koo, K.C.; Lee, S.W.; Choi, Y.D.; Cho, K.S. Hematuria grading scale: A new tool for gross hematuria. Urology 2013, 82, 284–289. [Google Scholar] [CrossRef] [PubMed]
- Wong, L.M.; Chum, J.M.; Maddy, P.; Chan, S.T.; Travis, D.; Lawrentschuk, N. Creation and validation of a visual macroscopic hematuria scale for optimal communication and an objective hematuria index. J. Urol. 2010, 184, 231–236. [Google Scholar] [CrossRef] [PubMed]
- Sakuma, S.; Fujita, R.; Komiya, H. A novel method for evaluating and expressing the degree of macroscopic hematuria. Int. Urol. Nephrol. 2006, 38, 203–205. [Google Scholar] [CrossRef] [PubMed]
- Allen, J. Photoplethysmography and its application in clinical physiological measurement. Physiol. Meas. 2007, 28, R1. [Google Scholar] [CrossRef] [PubMed]
- Elgendi, M. On the analysis of fingertip photoplethysmogram signals. Curr. Cardiol. Rev. 2012, 8, 14–25. [Google Scholar] [CrossRef] [PubMed]
- Sharma, C.; Pandey, K.; Chowdhury, S.R. A robust noninvasive device for the detection of blood hemoglobin using photoplethysmography. Research Article. Biotechnol. Bioinf. Bioeng. 2012, 2, 573–579. [Google Scholar]
- Abhishek, K.; Saxena, A.K.; Sonkar, R.K. Noninvasive Measurement of Heart Rate and Hemoglobin Concentration Level through a Fingertip. In Proceedings of the 2015 IEEE International Conference on Signal Processing, Informatics, Communication, and Energy Systems (SPICES), Kozhikode, India, 19–21 February 2015; pp. 1–4. [Google Scholar]
- Ding, H.; Lu, Q.; Gao, H.; Peng, Z. Noninvasive prediction of hemoglobin levels by principal component and backpropagation artificial neural network. Biomed. Opt. Express 2014, 5, 1145–1152. [Google Scholar] [CrossRef] [PubMed]
- Kumar, R.; Ranganathan, H. Noninvasive sensor technology for total hemoglobin measurement in blood. J. Ind. Intell. Inf. 2013, 1, 243–246. [Google Scholar]
- Nakabayashi, M.; Ono, Y. Detection of blood flow speed in shallow and deep tissues using diffuse correlation spectroscopy. Adv. Biomed. Eng. 2017, 6, 53–58. [Google Scholar] [CrossRef]
- Patil, S.H.; Ramkumar, P.; Prabhu, G.; Babu, A.N. Methods and devices to determine hemoglobin noninvasively: A review. Int. J. Sci. Eng. Technol. 2014, 3, 934–937. [Google Scholar]
- Saigo, K.; Imoto, S.; Hashimoto, M.; Mito, H.; Moriya, J.; Chinzei, T.; Kubota, Y.; Numada, S.; Ozawa, T.; Kumagai, S. Noninvasive monitoring of hemoglobin: The effects of WBC counts on measurement. Am. J. Clin. Pathol. 2004, 121, 51–55. [Google Scholar] [CrossRef] [PubMed]
- Ding, A.; Cao, H.; Wang, L.; Chen, J.; Wang, J.; He, B. A novel automatic regulatory device for continuous bladder irrigation based on wireless sensor in patients after transurethral resection of the prostate: A prospective investigation. Medicine 2016, 95, e5721. [Google Scholar] [CrossRef] [PubMed]
- Christenson, R.; Tucker, J.A.; Allen, E. Results of dipstick tests, visual inspection, microscopic examination of urine sediment, and microbiological cultures of urine compared for simplifying urinalysis. Clin. Chem. 1985, 31, 448–450. [Google Scholar] [CrossRef] [PubMed]
- Bixler, J.N.; Cone, M.T.; Hokr, B.H.; Mason, J.D.; Figueroa, E.; Fry, E.S.; Yakovlev, V.V.; Scully, M.O. Ultrasensitive detection of waste products in water using fluorescence emission cavity-enhanced spectroscopy. Proc. Natl. Acad. Sci. USA 2014, 111, 7208–7211. [Google Scholar] [CrossRef] [PubMed]
- Virkler, K.; Lednev, I.K. Analysis of body fluids for forensic purposes: From laboratory testing to non-destructive rapid confirmatory identification at a crime scene. Forensic Sci. Int. 2009, 188, 1–17. [Google Scholar] [CrossRef] [PubMed]
Figure 1.
The Light Emitting Diode-Light Dependent Resistor (LED-LDR) Light sensor probe system. An external power source powers the Light Emitting Diode (LED) light. The Light Dependent Resistor (LDR) connects to the Arduino Uno Board records the amount of light intensity received. Both components are kept in a clip as shown in (a,b) and measure the light intensity blocked by the gross haematuria samples in an enclosed environment without any external light interference (c,d).
Figure 2.
The saline drip control system. The gripper mechanical gripper (A) controls the saline drip flow by jamming the saline tube (B). The gripper is controlled using the servo motor. By detecting the amount of light received by the Light Dependent Resistor(LDR), the servo motor actuates to a specified angular position (C).
Figure 3.
The blood concentration samples prepared for the series of experiments as shown in Section (A). The blood samples are prepared in the serial dilution method, whereby the most concentrated blood sample is prepared first and then subsequently diluting the sample by halving the concentration of the blood sample. Section (B) specify the blood concentration in the mixture and its corresponding colours and sample names.
Figure 4.
The LED light color spectrum experiments have shown that red is the worst as it shows an almost constant value for different blood concentrations. On the other hand, the performance of Greenlight Spectrum and Blue Light Spectrum can differentiate different blood concentrations.
Figure 4.
The LED light color spectrum experiments have shown that red is the worst as it shows an almost constant value for different blood concentrations. On the other hand, the performance of Greenlight Spectrum and Blue Light Spectrum can differentiate different blood concentrations.
Figure 5.
The blood concentration samples were kept for around one year were tested using Green Light Spectrum. Experimental results have shown that blood concentration samples more than 4.5 percent have a darker color, indicating that oxidization has occurred in the blood samples.
Figure 5.
The blood concentration samples were kept for around one year were tested using Green Light Spectrum. Experimental results have shown that blood concentration samples more than 4.5 percent have a darker color, indicating that oxidization has occurred in the blood samples.
Figure 6.
The performance of the black probe for both colors is better than that of the white probe, as shown in (A,B). The difference between each blood concentration measurement for the black probe is larger than the measurements by a white probe, indicating that each measurement of the black probe is much more specific and accurate than the white probe.
Figure 7.
The resistor calibration test is conducted to find out the range of resistance would provide better detection. The experiment was conducted with the green color light spectrum, which shows the optimum range of resistance values are between 150 and 220 ohms.
Figure 7.
The resistor calibration test is conducted to find out the range of resistance would provide better detection. The experiment was conducted with the green color light spectrum, which shows the optimum range of resistance values are between 150 and 220 ohms.
Figure 8.
Performance comparisons for different resistance values of 15 ohms (A), 183 ohms (B), and 1 k ohms (C). Despite the change in resistance, results have shown that the performance between the three color spectrums remains the same, with red color light spectrum the worst among the three and the blue and green light spectrum to be equally comparable under the normal light intensity condition.
Figure 9.
Gripper Actuation when blood concentration of 18 percent was detected, as shown in (A,C). The gripper is loosened to allow saline water to flow to wash the bladder. Gripper Actuation is shown in (B,D) when a blood concentration of 0.141 percent was detected. When less in gross hematuria is detected by the sensor probe, the gripper will tighten and reduce the inner diameter of the tube, reducing flow rate, thus saving up saline water when its use is not necessary. The distance between the Servo motor and gripper is 4.6 cm, as shown in (E). The further distance between the gripper and the servo motor would require more force for the servomotor to actuate the gripper. The dimension of Saline Tube is in (F) and measurement of the saline tube using Vernier Caliper (G). As shown in the measurement, the inner diameter of the tube is only 4.6 mm, which means the tube is completely sealed when the outer diameter is measured at 2.0 mm.
Figure 10.
The relationship between Angular Position of Servo motor and Voltage Reading of LDR, as shown in (A). The relationship between Voltage Difference and Outer Diameter, as shown in (B). The relationship between Angular Position of the servomotor and Outer Diameter of Saline Tube, as shown in (C).
Figure 11.
Urine Colour Test.
Figure 11.
Urine Colour Test.
© 2020 by the authors. Licensee MDPI, Basel, Switzerland. This article is an open access article distributed under the terms and conditions of the Creative Commons Attribution (CC BY) license (http://creativecommons.org/licenses/by/4.0/).


