1. Introduction
Nowadays, deceptive behaviors are common in our global society. The most widely used technology for detecting deception is polygraphy; this relies on detecting changes in physiological signals, particularly heart rate and is most commonly used method for lie detection [
1]. Despite claims of 90% validity by polygraphy advocates, the US National Research Council has reported concerns about its effectiveness [
2,
3]. There are some limitations that affect the effectiveness of polygraph in general applications: dependency on professional experts for scoring the data, attachment of sensors to the subjects that limit the length and nature of interview sessions—and which can cause high levels of anxiety in subjects in themselves. All of these drawbacks of polygraphy provide incentives to introduce substitute technologies. From the perspective of physiology, deceptive anxiety leads to spontaneous physiological signs including perspiration, increased heart rate, blood flow changes and so on. According to Cannon, this physiological reaction to acute stress is called the “fight or flight” response [
4]. The methods based on the measurement of these reactions are capable of discriminating between deceptive and truthful behaviors.
To date, a number of studies have investigated the applications of infrared thermal imaging in the fields of computational psychophysiology and recognizing affective states because of its ubiquitous and non-contact capability physiological parameters such as cardiac pulse [
5], respiratory rate [
6], perspiration [
7,
8] and cutaneous and subcutaneous blood flow [
9,
10] have been demonstrated to be estimated non-invasively through this novel technology. Furthermore, there has been a recent interest in monitoring the affective states and emotion monitoring by facial thermal imaging. Some studies compared GSR (Galvani Skin Response) and Thermal Imaging which have the same power in psychophysiological pattern recognition [
11]. Areas of interest in this field are human computer interaction (HCI) with collaborative [
12] and non-collaborative subjects [
13].
Recently, a growing body of research literature has emerged that examines thermal imaging as a functional non-contact technology for monitoring deception [
14,
15]. The theory behind the use of thermal imaging for this purpose is the rapid redirection of blood flow in subcutaneous vasculature due to “fight or flight” responses that lead to sub-cutaneous temperature changes. We can detect these very slight temperature fluctuations with high resolution and high sensitivity thermal camera. The study of facial thermal imaging in a lie detection framework was first carried out by [
16] and concluded that thermal imaging could be an effective substitute for traditional polygraphy in the future. The primary challenge faced by many experiments in this field is the mixed classification accuracy results from different studies. To the best of our knowledge, there is no influential framework for the application of thermal imaging to detect deceptive behaviors. Furthermore, a search of the literature reveals few studies that focus on the comparison of different ROIs on the face for this purpose [
17,
18].
This study aims to contribute to this growing area of research by exploring different machine learning techniques to increase the accuracy of thermal imaging, and identify the best ROIs for discrimination of deception and truthfulness. We collected a dataset by measuring facial thermal imaging, GSR and PPG (photo plethysomography) of 41 subjects in two different protocols (mock crime and best friend) that we named it as THEPHY. Regarding the anatomy of superficial blood vessels on the face, five ROIs including periorbital, forehead, cheeks, perinasal and chin were selected. Moreover, the possible head movements in thermal videos were compensated by tracking the traceable corner points on the face. Six statistical features were employed with four feature reduction techniques to identify the best features (especially the best ROIs) on the face. Four different classifiers were employed, including support vector machine (SVM) with Gaussian and polynomial kernels, linear discriminant analysis (LDA), K- nearest neighborhood (KNN) and decision tree. Our final classification results in the thermal spectrum outperform the other previous studies with the same protocol. Furthermore, based on the feature selection procedure, the temperature changes in perinasal and chin areas are most correlated to the psychophysiological state of deceptive anxiety and could be an effective indicator of deception.
2. Literature Review
The feasibility of non-contact facial thermal imaging for human stress research and especially deception detection was one of the main concerns of recent studies in this field [
19,
20,
21]. In order to validate the usability of this ubiquitous unobtrusive technology, Puri collected thermal videos of the forehead area in addition to oxygen consumption rate (for measuring energy expenditure) of 12 subjects. He showed that there is a high correlation (Pearson correlation = 0.91) between maximum temperature of the forehead area and oxygen consumption rate, which is an indicator of stress [
22]. The perinasal response to stress stimuli was shown to be well correlated with the transient perspiratory response on the fingers [
23].
The effectiveness of this technology for detecting deceptive anxiety by facial temperature measurement was first suggested by Pavlidis. He used a heat transfer model to convert the periorbital temperature to blood flow and reported an 84% accuracy rate with 22 subjects in a mock crime protocol [
16]. Another study collected a larger and more realistic mock-crime interrogation experiment. The periorbital region was targeted again and by using tandem tracking and binary classification, they reported 87.2% success rate in detecting deception [
24]. Polina et al. carried out a larger scale experiment and investigated the feasibility of facial skin surface temperature in two concealed information tests [
25]. They extracted statistical features from the bottom of the right and left eye for 0.3 s before and after the onset of response to each question. The experiments were 91.7% successful in detecting deception with 39 participants. In another relevant study, Warmerlink evaluated the effectiveness of facial thermal imaging on Fifty-one passengers in an international airport departure and found out that the skin temperature of deceptive group elevated during the interview while the innocent group remained constant. [
26]
Although there is sufficient physiological and technical evidence to confirm the relationship of temperature changes to anxiety level, the classification accuracy rates reported by previous research findings are inconsistent and contradictory. As an example, Abouelenien et al. collected a multimodal database for two different scenarios and reported weak results for the accuracy of periorbital thermal features in comparison with physiological and linguistic features. However, they also used cross-scenario learning that leads to better accuracy rate [
19]. Rajoub in other work concluded that deceptive behavior does not generalize well to the whole population on periorbital thermal imaging features [
27]. Using a set of 25 participants, their proposed system was associated with greater success when they used the within-person approach in comparison with between person classifications.
Moreover, there is another inconsistency in finding the facial thermal ROI which is most correlated with arousal level. Dcosta focused on the perinasal area as an indicator of arousal stimulation in the body and reported 80% classification rate to distinguish between 40 subjects in a mock crime scenario [
28]. In order to evaluate the usefulness of the forehead area for lie detection, Zhu collected thermal videos of 38 subjects under interrogation in a mock crime scenario. The results showed that the recovered forehead signal enables 76.3% success rate in deceptive state classification [
29]. A more comprehensive study was performed by Pollina who argues that the cheek area shows a higher accuracy rate in comparison to periorbital and carotid areas in a mock crime scenario with 21 subjects [
17]. Abouelenien in 2016 published a study with their latest dataset and tried to investigate the best ROI on the face for stress recognition purposes. They reported that fusing forehead thermal features and linguistic features could be the best integration in detecting deception [
20]. In a comprehensive study by Panasiti et al. in 2016, they compared periorbital and perinasal area in a voluntary deception framework in ecological condition. The results showed importance of perinasal area in compared with periorbital region for this purpose [
30]. In a recent study, Derakhshan et al. utilized granger causality method to represent the effective connectivity between the five ROIs on the thermal face during a mock crime scenario. They reported the overall redirection of blood flow and temperate from the lower facial areas to the upper parts in deceptive subjects [
31].
To address the above-mentioned issues, our study aims to propose a framework to investigate the effectiveness of facial thermal imaging in comparison with gold standard physiological measurement (GSR and PPG), and also obtain the optimal ROI selection in two deception detection scenarios.
3. THEPHY Dataset
3.1. Participants
Data were collected from 41 graduate and undergraduate students between 20–35 years old, with 21 females and 20 males with a mean age of 24.4 years with standard deviation of 3.5. All participants were Persian native speakers. They were all asked not to use makeup or cosmetics on the day of the experiment. They were also asked to wash their hands and face before reading the instructions.
Furthermore, they were asked to fill in a questionnaire related to their current mental and physiological status, whether they have taken any medication in the past 24 h and asked to report any disease or disorders that may affect their current psychological status. They were also informed not to consume any alcohol, caffeinated drinks or a heavy meal since the night before their appointment. All the experiments were done in the morning to reduce any digestion effects. We also noted their hemisphericity (preferred mode of cognitive processing that is linked to predominant activity of either their left or right cerebral hemisphere) and height/weight information for further investigation. After finishing the interview, we asked them to fill in a self-assessment form in which they scored their stress in each question of our mock crime scenario. The datasets used to support this study are currently under embargo while the research findings are commercialized. Requests for data, from 12 months after initial publication, will be considered by the corresponding author.
3.2. Materials
The following equipment and facilities were used in our experiments:
Standard interview room: The interview room was designed and built specifically for research purposes in this field, with controlled temperature and double walls and double door for sound and heat insulation. The temperature of the room was set to 25 °C.
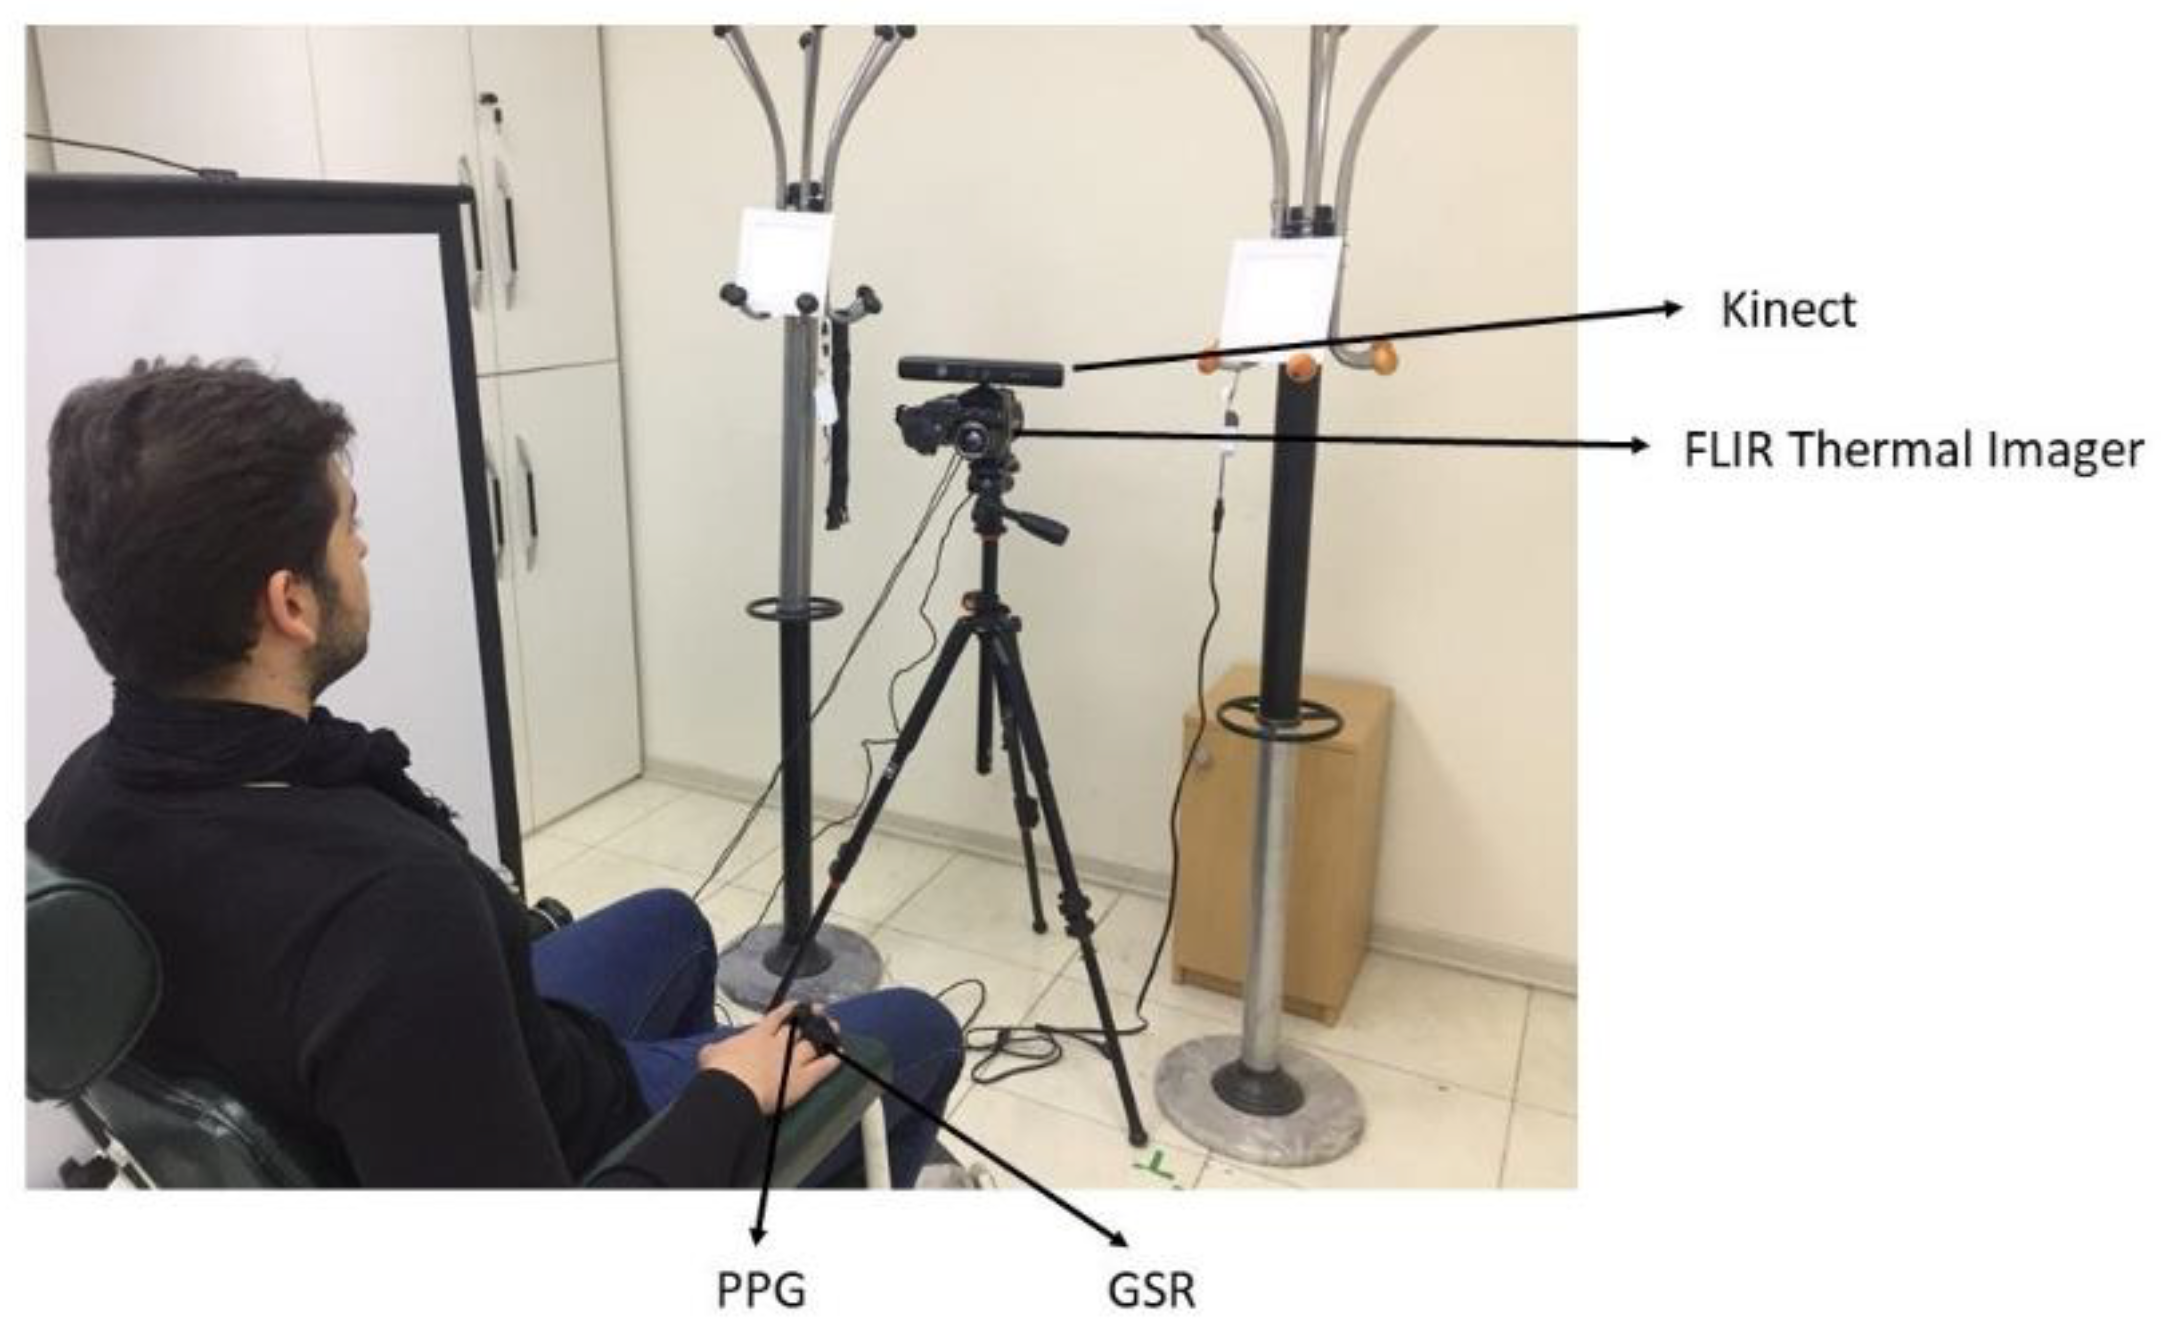
Thermal Imager: we used a FLIR T640 thermal imager which benefited from a 640 × 480 focal plane array of uncooled and stabilized thermal infrared sensor. The frame rate was 10 frames per second which could cover all temperature changes due to SNS (Sympathetic Nervous System) activation that is around 300 ms. Moreover, the thermal sensitivity (NEDT, noise equivalent differential temperature) of the device was 35 mK at 30 °C. The thermal camera was placed in front of subjects at a distance of 1.5 m from their face.
Polygraphy data acquisition system (PsychoRec) with two sensors: GSR (Galvanic Skin Response) and PPG (photoplethysmography) and the embedded software for design and delivery of the questionnaire in CQT (control question test) format.
Kinect visual camera: The resolution of the camera is 640 × 480 and the frame rate is 30 Hz. This data was part of our comprehensive data collection for deception detection purposes that we did not use them in current research and will be investigated in our future contributions.
Crime room: Special room for “mock crime” scenario with two desks, a PC and some drawers. The room had been equipped with a red flash LED to increase the arousal level of participants.
This database has names THEPHY that is a combination of ‘thermal’ and ‘physiological’ words.
Table 1 shows a brief summary of our database content.
Figure 1 illustrates all measuring devices which were used in our experiments. There is a white curtain between the interviewer and subjects in order to reduce visual distraction or visual cues during the interview. The total experiment time including the initial explanation following the deceptive or truthful protocol and the interview room session for each participant was around 20 min.
3.3. Scenarios
“Mock Crime”: In this scenario, the participants were randomly allocated to one of our two groups without their prior knowledge: innocent or deceptive. An instruction was given to each participant and they were asked to read it carefully. After understanding the scenario, each innocent participant must go to the crime room and wait for 5 min and then come back and wait for the interview. The deceptive participants were asked to go to the crime room, try to find the keys, open the drawers and find and take a gold necklace—and that all the steps should be done in 5 min. Then they should come back and wait for the interview. In the interview room, for both groups, they sit on a specific chair and were asked to look towards the thermal camera and not to move their head a lot. They answered a CQT test which consisted of eight questions in three standard types [
32]: Relevant, Control and Neutral questions.
Deceptive individuals are expected to show more pronounced responses to the relevant questions, whereas truthful individuals are expected to show the opposite pattern of responsivity. The experiments were utilized “single blind” in which the label for each participant interviewer was masked from the interviewer that would reduce the bias in asking the questions. Each answer time period was set 20 s to provide enough time for response of autonomous nervous system activation. The overall interview session for each participant was done in 2–3 min.
The English translation of questions set are as follows:
Do you live in Tehran?
Do you intend to answer all the questions honestly?
Have you ever checked your sister/brother’s phone without his/her consent?
Did you enter the office at the back of the building?
Do you have any plan after this interview?
Did you steal the necklace?
Would you be happy if our device does not work properly?
Is there any other question that could make you anxious?
“Best Friend”: This protocol was used based on a previous study in this field [
19] and consists of two parts: truthful and deceptive. All the subjects were asked to do both parts in 30 s each. During the truthful part, they were asked to talk about their “Best Friend” in their life and his/her characteristics, their friendship and also their common memories. As the second part (deceptive) they choose one person in their mind that they hate and talk about him/her deceptively. Some of the participants responded that they do not hate anyone. For this situation, they are asked to think about a celebrity or political person that they do not like and praise him/her.
In the Mock Crime scenario, after a preliminary evaluation of our collected data, one of our participant’s thermal video was found to be corrupted and we had to leave it out from our database. Finally, we had 40 participants in the Mock Crime and 41 subjects in the Best Friend scenarios.
4. Methods
Facial thermal imaging is the main non-invasive method that many researchers utilize for the purpose of detecting emotional and stress reactions [
16,
24,
31]. We used several machine learning techniques to increase the accuracy rate of this technology and to find the ROIs on the face that could be more effective indicators of deceptive anxiety.
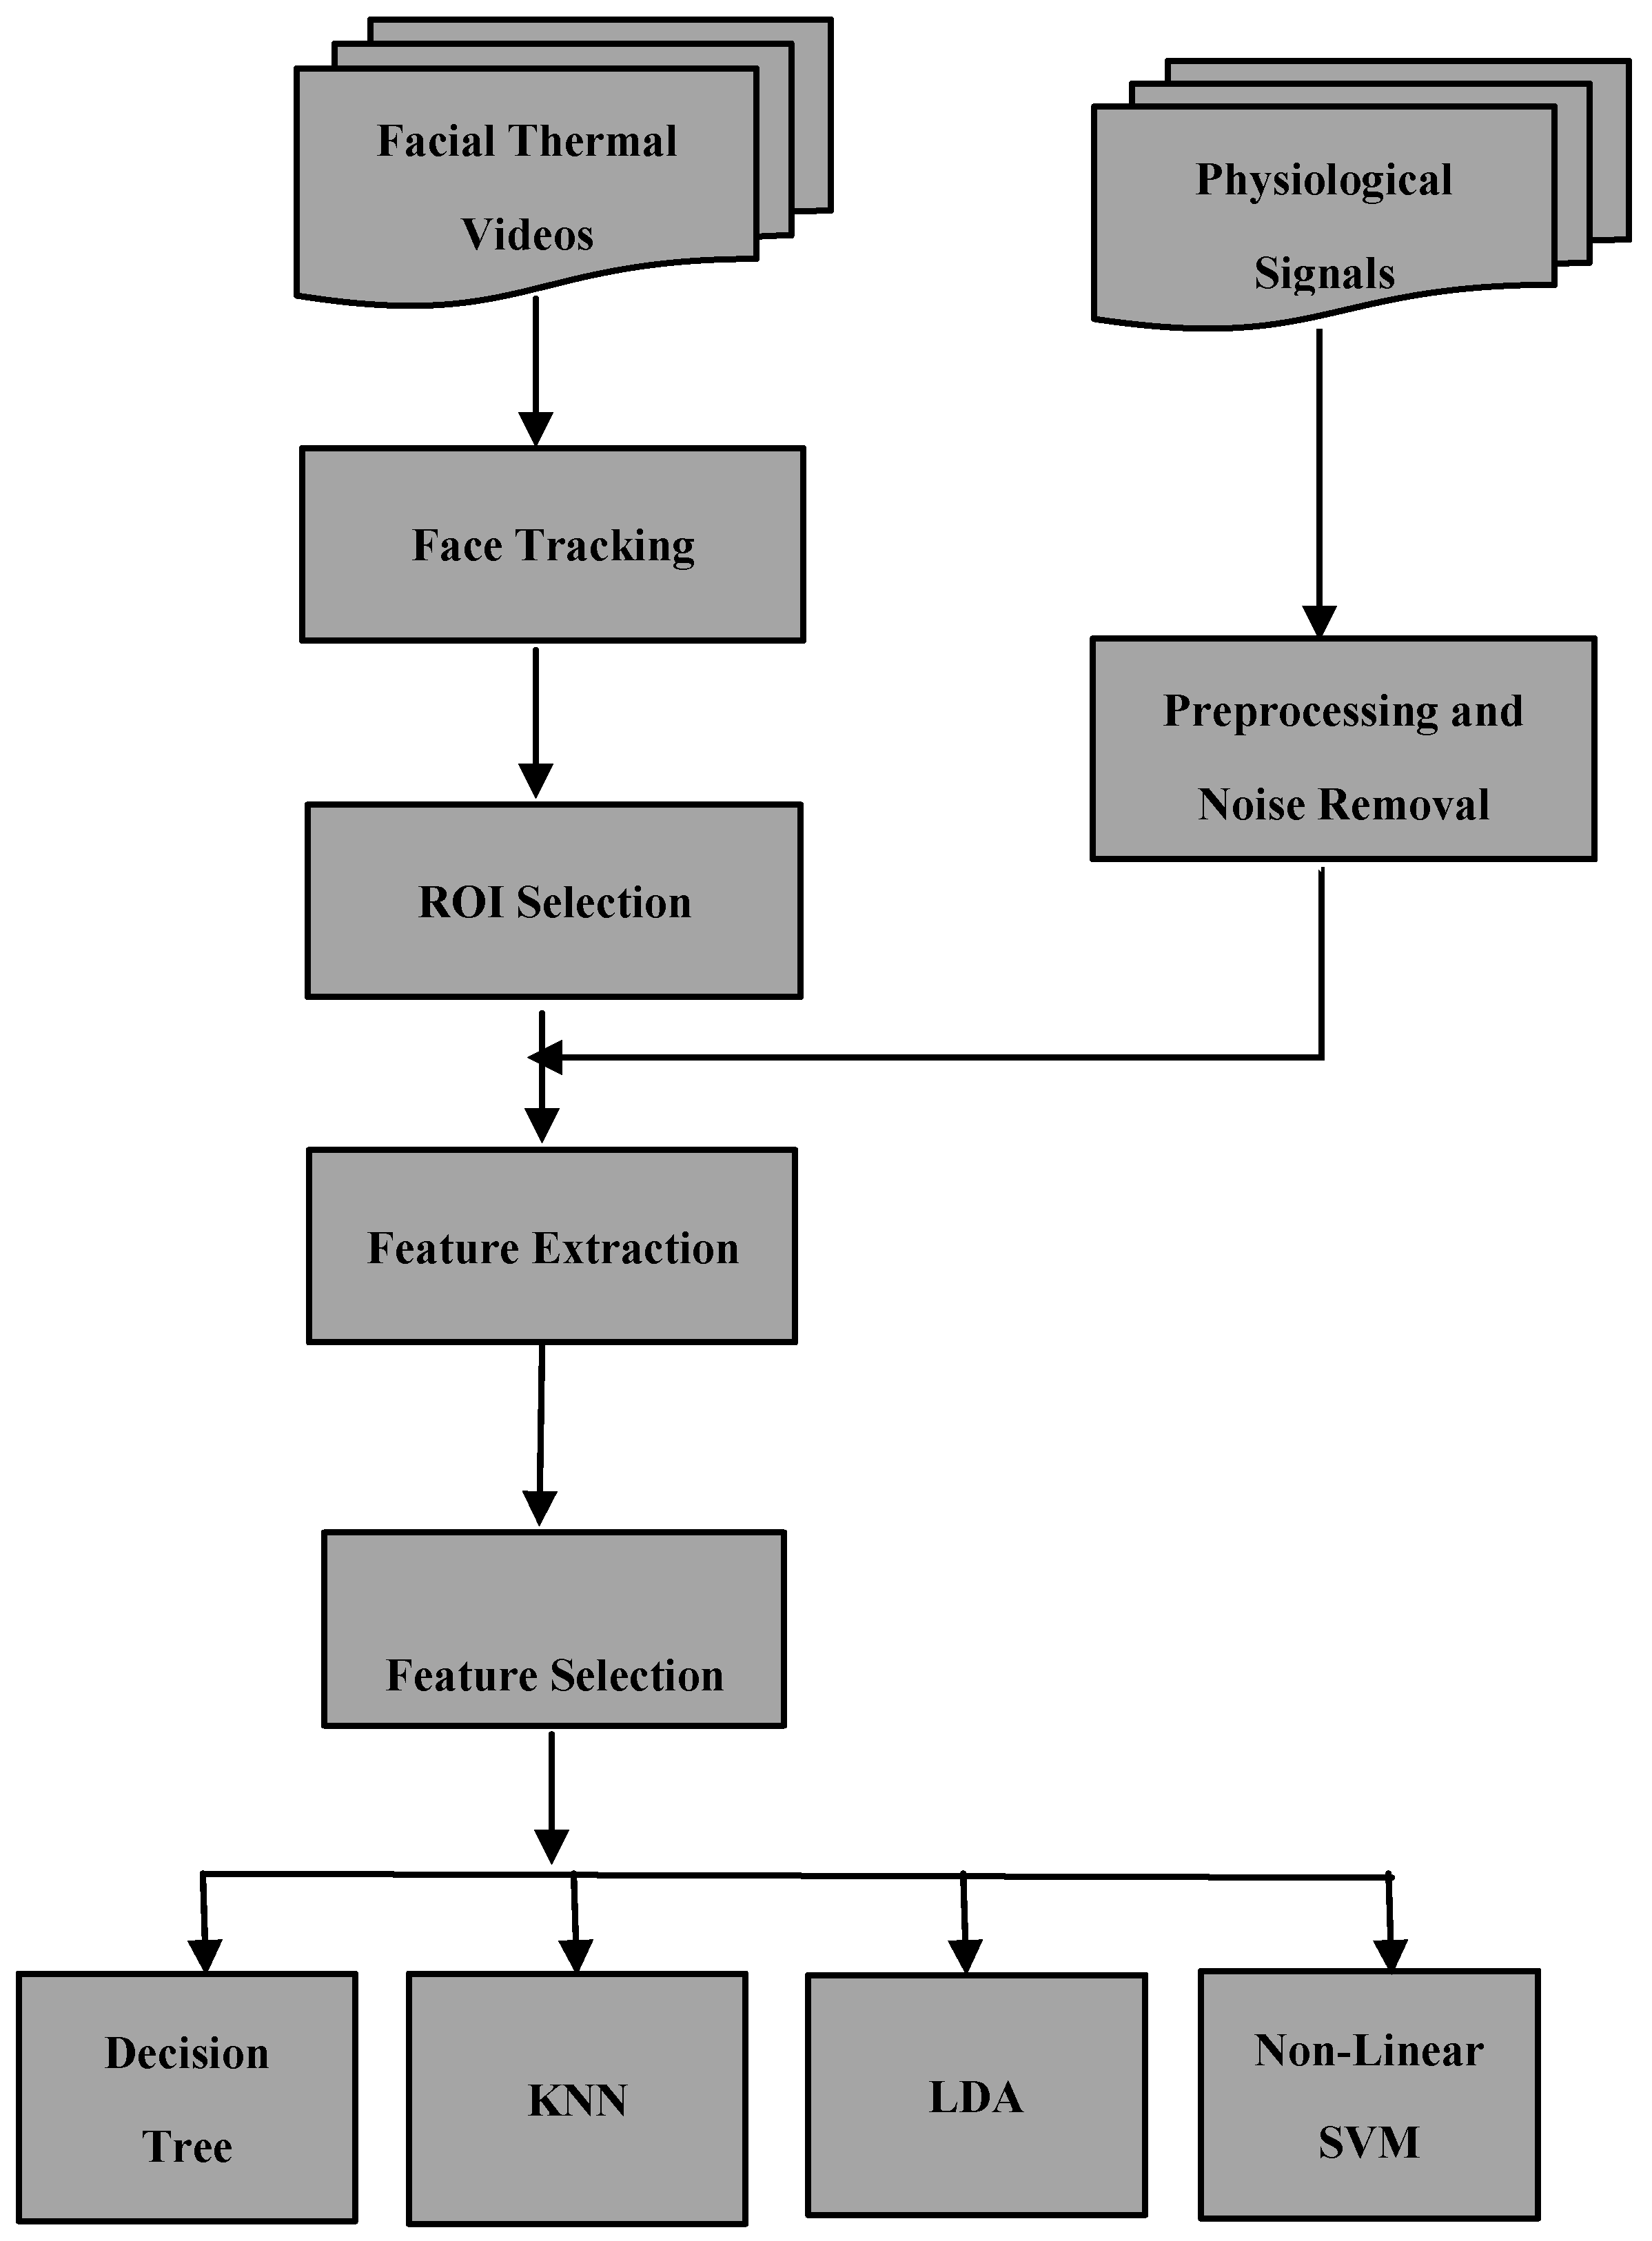
Figure 2 illustrates the overview of the study architecture that was developed and is presented in this paper
First, we prepared our physiological and thermal raw data for extracting the features. Since the nature of these two modalities are different, the pre-processing and noise removal phase of each modality is described separately:
4.1. Physiological Signals
For all the physiological data, we used a bandpass filter degree 30 and cutoff frequency between 1–40 Hz. To reduce the between-participant differences, the data were normalized to [0, 1] by dividing the signal by that participant’s maximum value of his/her GSR or PPG signal from the entire recording session [
33].
4.2. Thermal Videos
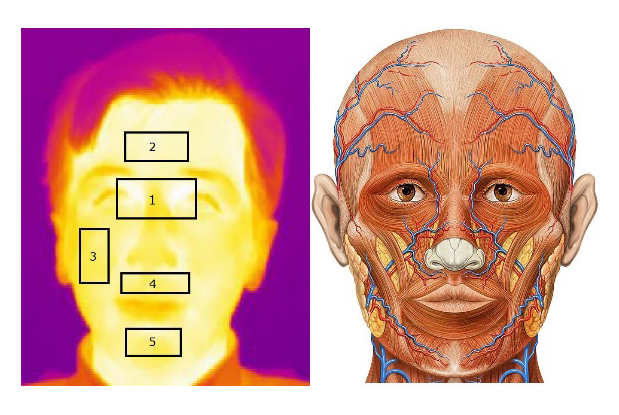
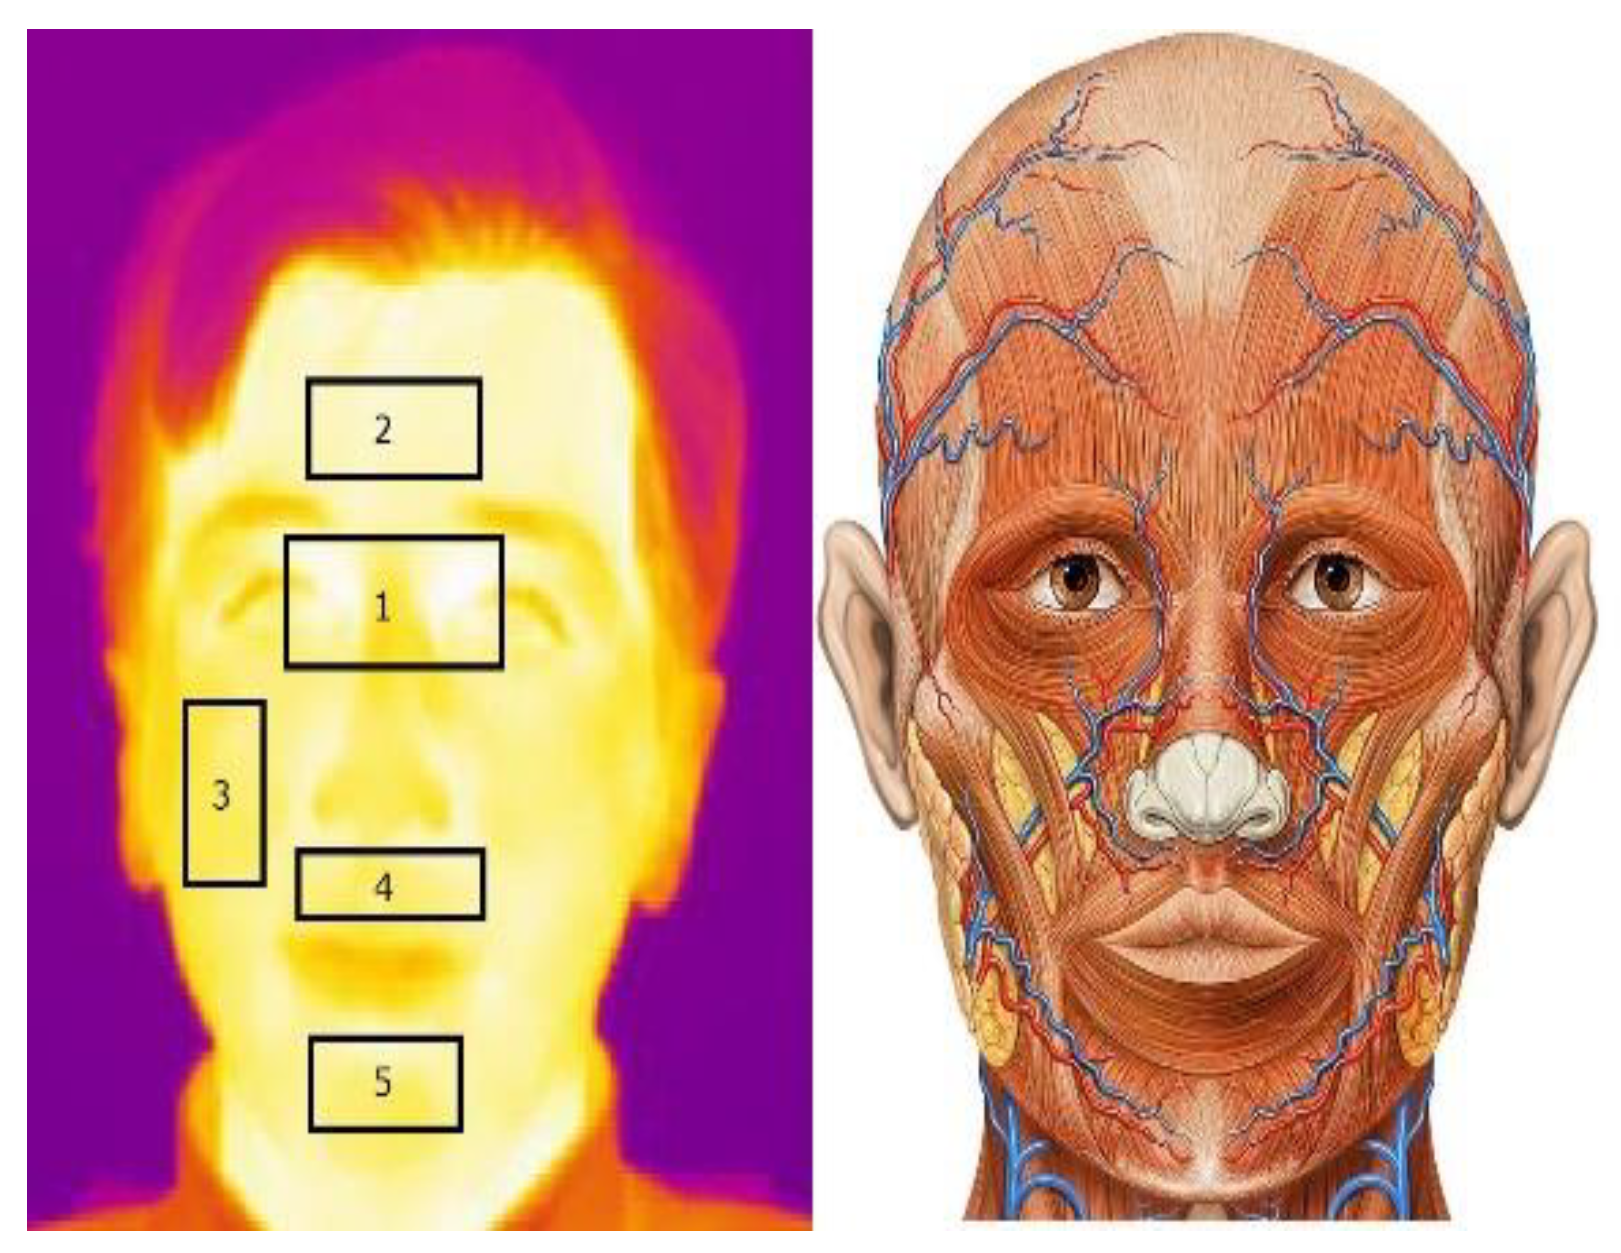
For converting thermal video to thermal time series, we extracted the maximum and minimum values in each frame of the video from the manually selected five ROIs on the face. According to anatomic knowledge, these areas are more influenced by psychophysiological changes because of the underlying vasculature network and skeletal muscle tissue. Furthermore, these thermal ROIs were utilized based on previous publications in this field, which suggested that these regions are most affected by psychophysiological states [
18]. To summarize, we extracted five ROIs on the face and maximum and minimum temperature value of each region would represent every thermal video by ten signals. The illustration of these five regions on the face and the corresponding anatomic image are shown in
Figure 3.
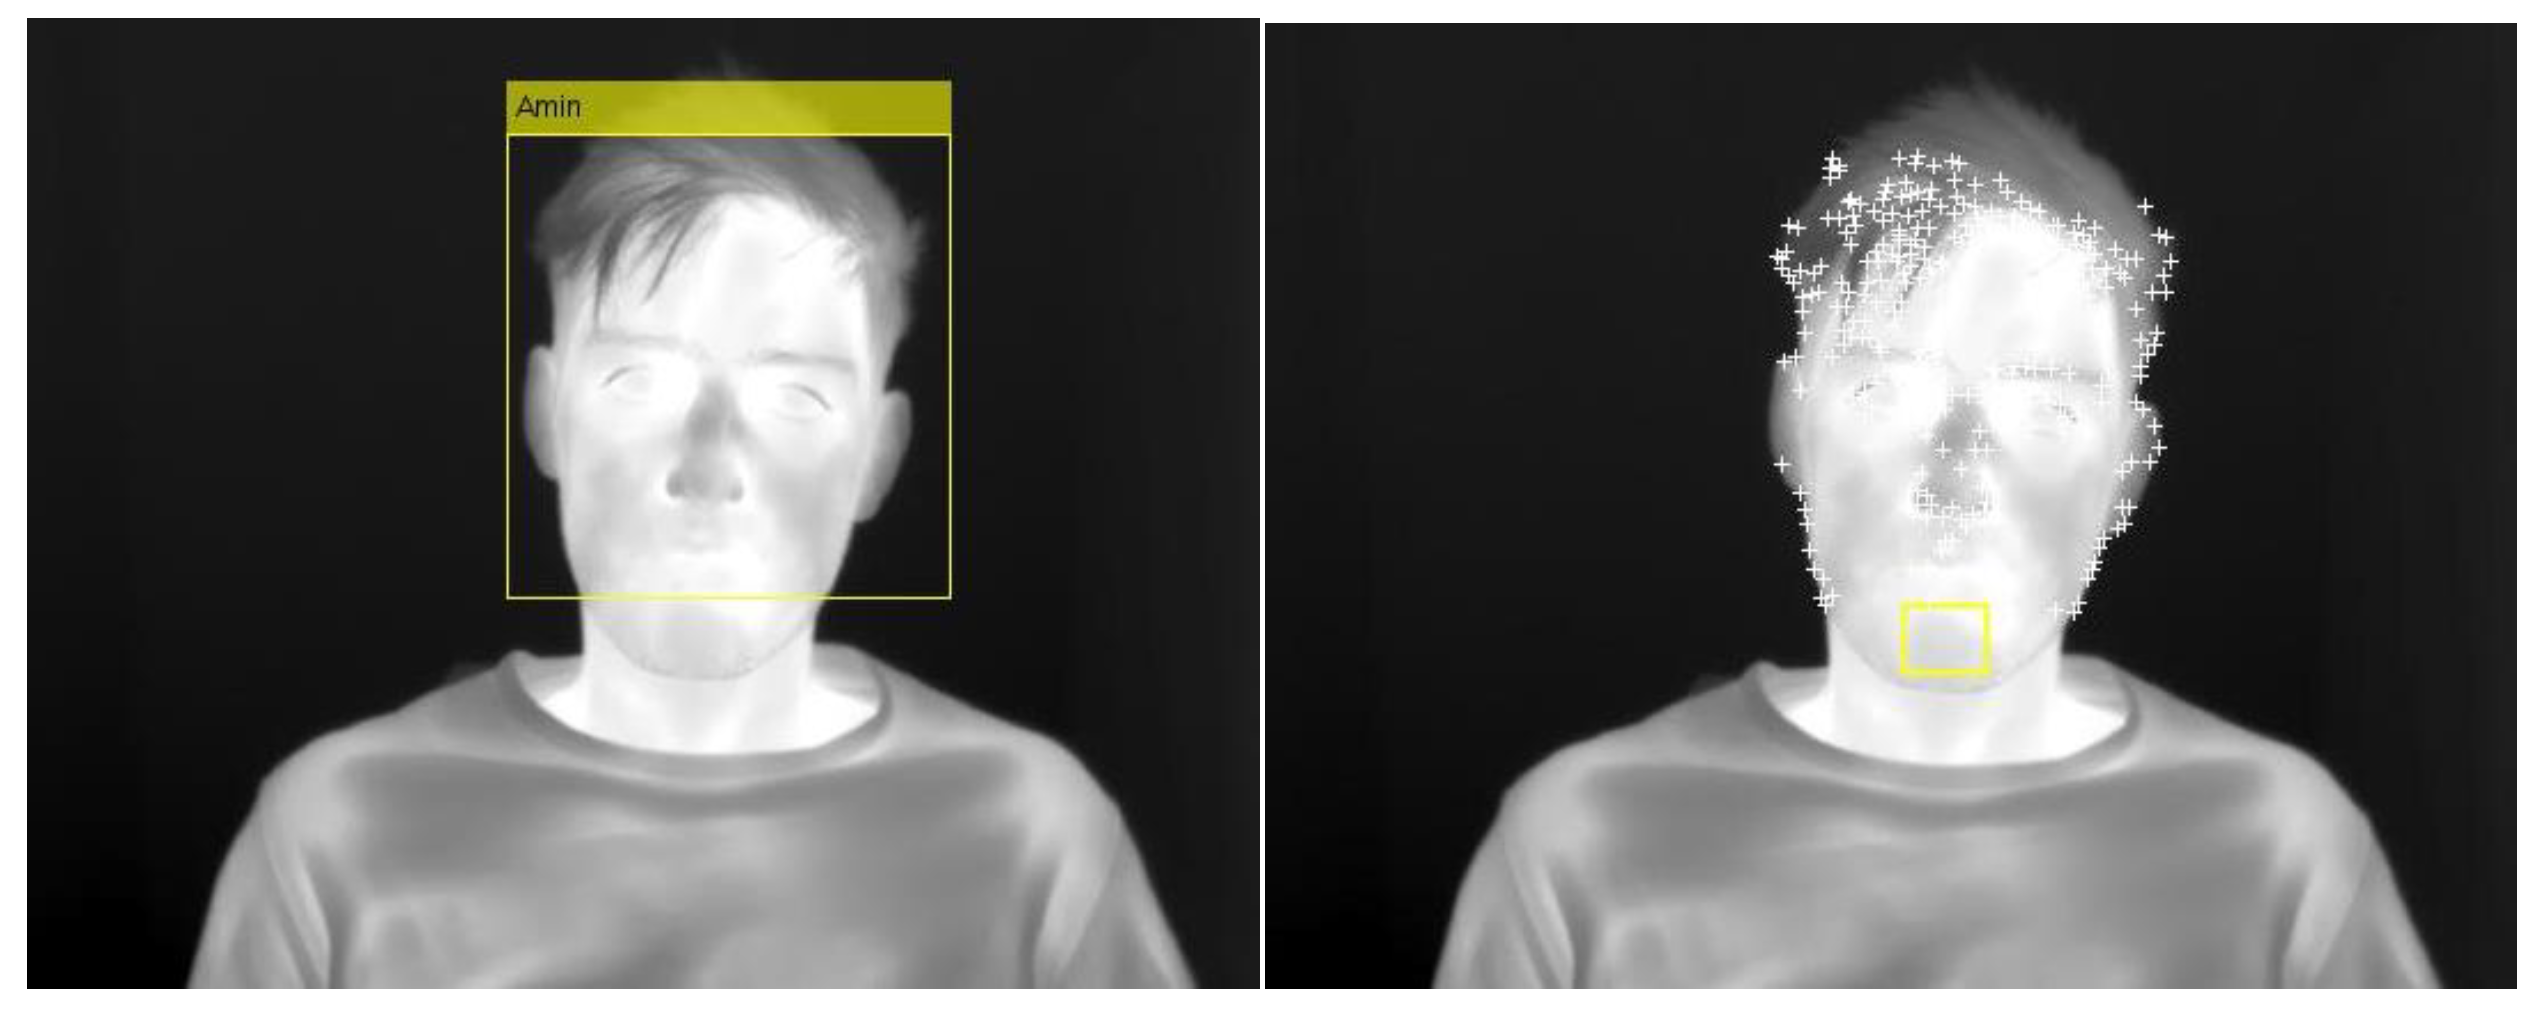
4.3. ROI Tracking
Although we asked the subjects not to move their head and body during the interview, some few natural movements are unavoidable which may impose negative effect on the classification results. In order to compensate for any unwanted head movements during the interview, we employed a thermal face tracker. The Viola–Jones object detection framework was applied on the facial thermal images for segmentation of the face from the background [
35]. Then, we adopted the Kanade–Lucas–Tomasi (KLT) method for finding feature points on the face and tracked them continuously in a thermal video [
36]. In this method, first, we found traceable corner points on the face by using Shi–Tomasi method [
37] and then the detected points were tracked using KLT points’ tracker.
Figure 4 shows this procedure in two steps: face detection and finding feature points.
Then, a smoothing filter was employed to suppress the high frequency components of the thermal signals arising from malfunctions of the tracking algorithm. We applied the rlowess (robust locally weighted scatterplot smoothing) filter, a modified version of the lowess (Locally Weighted Scatterplot Smoothing) method which tries to locate a smooth curve among the data points without requiring any advance specification of the functional relationship between the variables [
38]. In such cases where the data contains outliers, the smoothed values (lowess method) can become distorted and do not reflect the behavior of the bulk of the neighboring data points. To overcome this problem, the loess curve is fitted with a robust estimation procedure that decreases the influence of such outliers.
Figure 5 depicts the performance of rlowess filtering on a thermal signal. As shown, the high frequency peaks and distortion of the thermal signals were removed properly.
4.4. Physiological and Thermal Feature Extraction
Six temporal features, including mean, minimum, maximum, standard deviation, means of the absolute values of the first and second derivatives of the pre-processed signals, were extracted from each question-related GSR, PPG and thermal signal. These features can be computed easily and cover the typical range, gradient and variation of the signals and were effectively utilized in previous studies on similar topics [
39].
4.5. Optimal ROI Selection
One of the main concerns about utilizing facial thermal imaging in emotion research is the selection of appropriate ROIs that are most correlated with the specific emotion. We employed feature reduction methods to identify the optimal ROIs which associate to the psychophysiological state of stress, more effectively. We expect to obtain more benefits by applying feature selection methods to our thermal and physiological feature set, such as reducing the training time, reducing the complexity of the model, improving the final accuracy and reducing the possible overfitting. We compared four common univariate filtering methods for feature reduction, as introduced below:
t-test: Based on the ratio of statistical difference and variability between two classes [
40].
Relative entropy (Kullback–Leibler divergence): Calculate the subtraction of estimated probability distributions (based on the divergence of the probability distribution of the first from the second) by the true probability distribution [
41].
ROC (receiver operating characteristic): A non-parametric test that ranks all features by measuring the area under the ROC curve [
42].
MWW (Mann–Whitney–Wilcoxon): A non-parametric unpaired statistical test and investigate if two independent sample of an observation exhibits on the same distribution [
43].
The results show the successful outcome of employing the above feature reduction techniques specially ROC method in our overall classification accuracy rate. The result of feature selection on our overall accuracy rate for thermal feature set was considerably better than for physiological features.
4.6. Between Person Classification
In order to compare the results before and after the feature selection procedure, first each of the features derived from the thermal and physiological feature set was provided as input to SVM, KNN, LDA and decision tree classifiers to discriminate between deceptive and truthful subjects. For each decision tree, the number of splits is set to 5 and the minimum leaf size set to 7 to minimize the cross-validation loss. We used Gaussian and polynomial kernels for the SVM model and the number of neighbors for the KNN model was set to 5. The recognition rates were obtained by “Leave One Out” cross validation method across the participants. In this case, we put aside one subject and the training process had been done by the classifier with the other subjects. We used the omitted data to test the prediction error. The number of iterations in this strategy is the number of subjects (independent data samples). The overall accuracy was achieved by calculating the average of all recognition rates over all trials.
5. Experimental Results
Table 1 reports the classification results with the above four classifiers on all the different features. The accuracy of each scenario was noted in this table, separately. The best results for “Mock Crime” scenario was 83.8%, 67.7% and 64.5% for thermal, GSR and PPG, respectively. Regarding the “Best Friend” scenario, the best recognition rates were obtained as 62.9% in the thermal spectrum and 66.6% and 79.6% for the physiological signals. In terms of classifiers evaluation overall, decision tree produced better performance in comparison with the other models. Moreover, in terms of comparing different modalities, before feature selection procedure, physiological signals appear to have more discriminatory power than thermal signals.
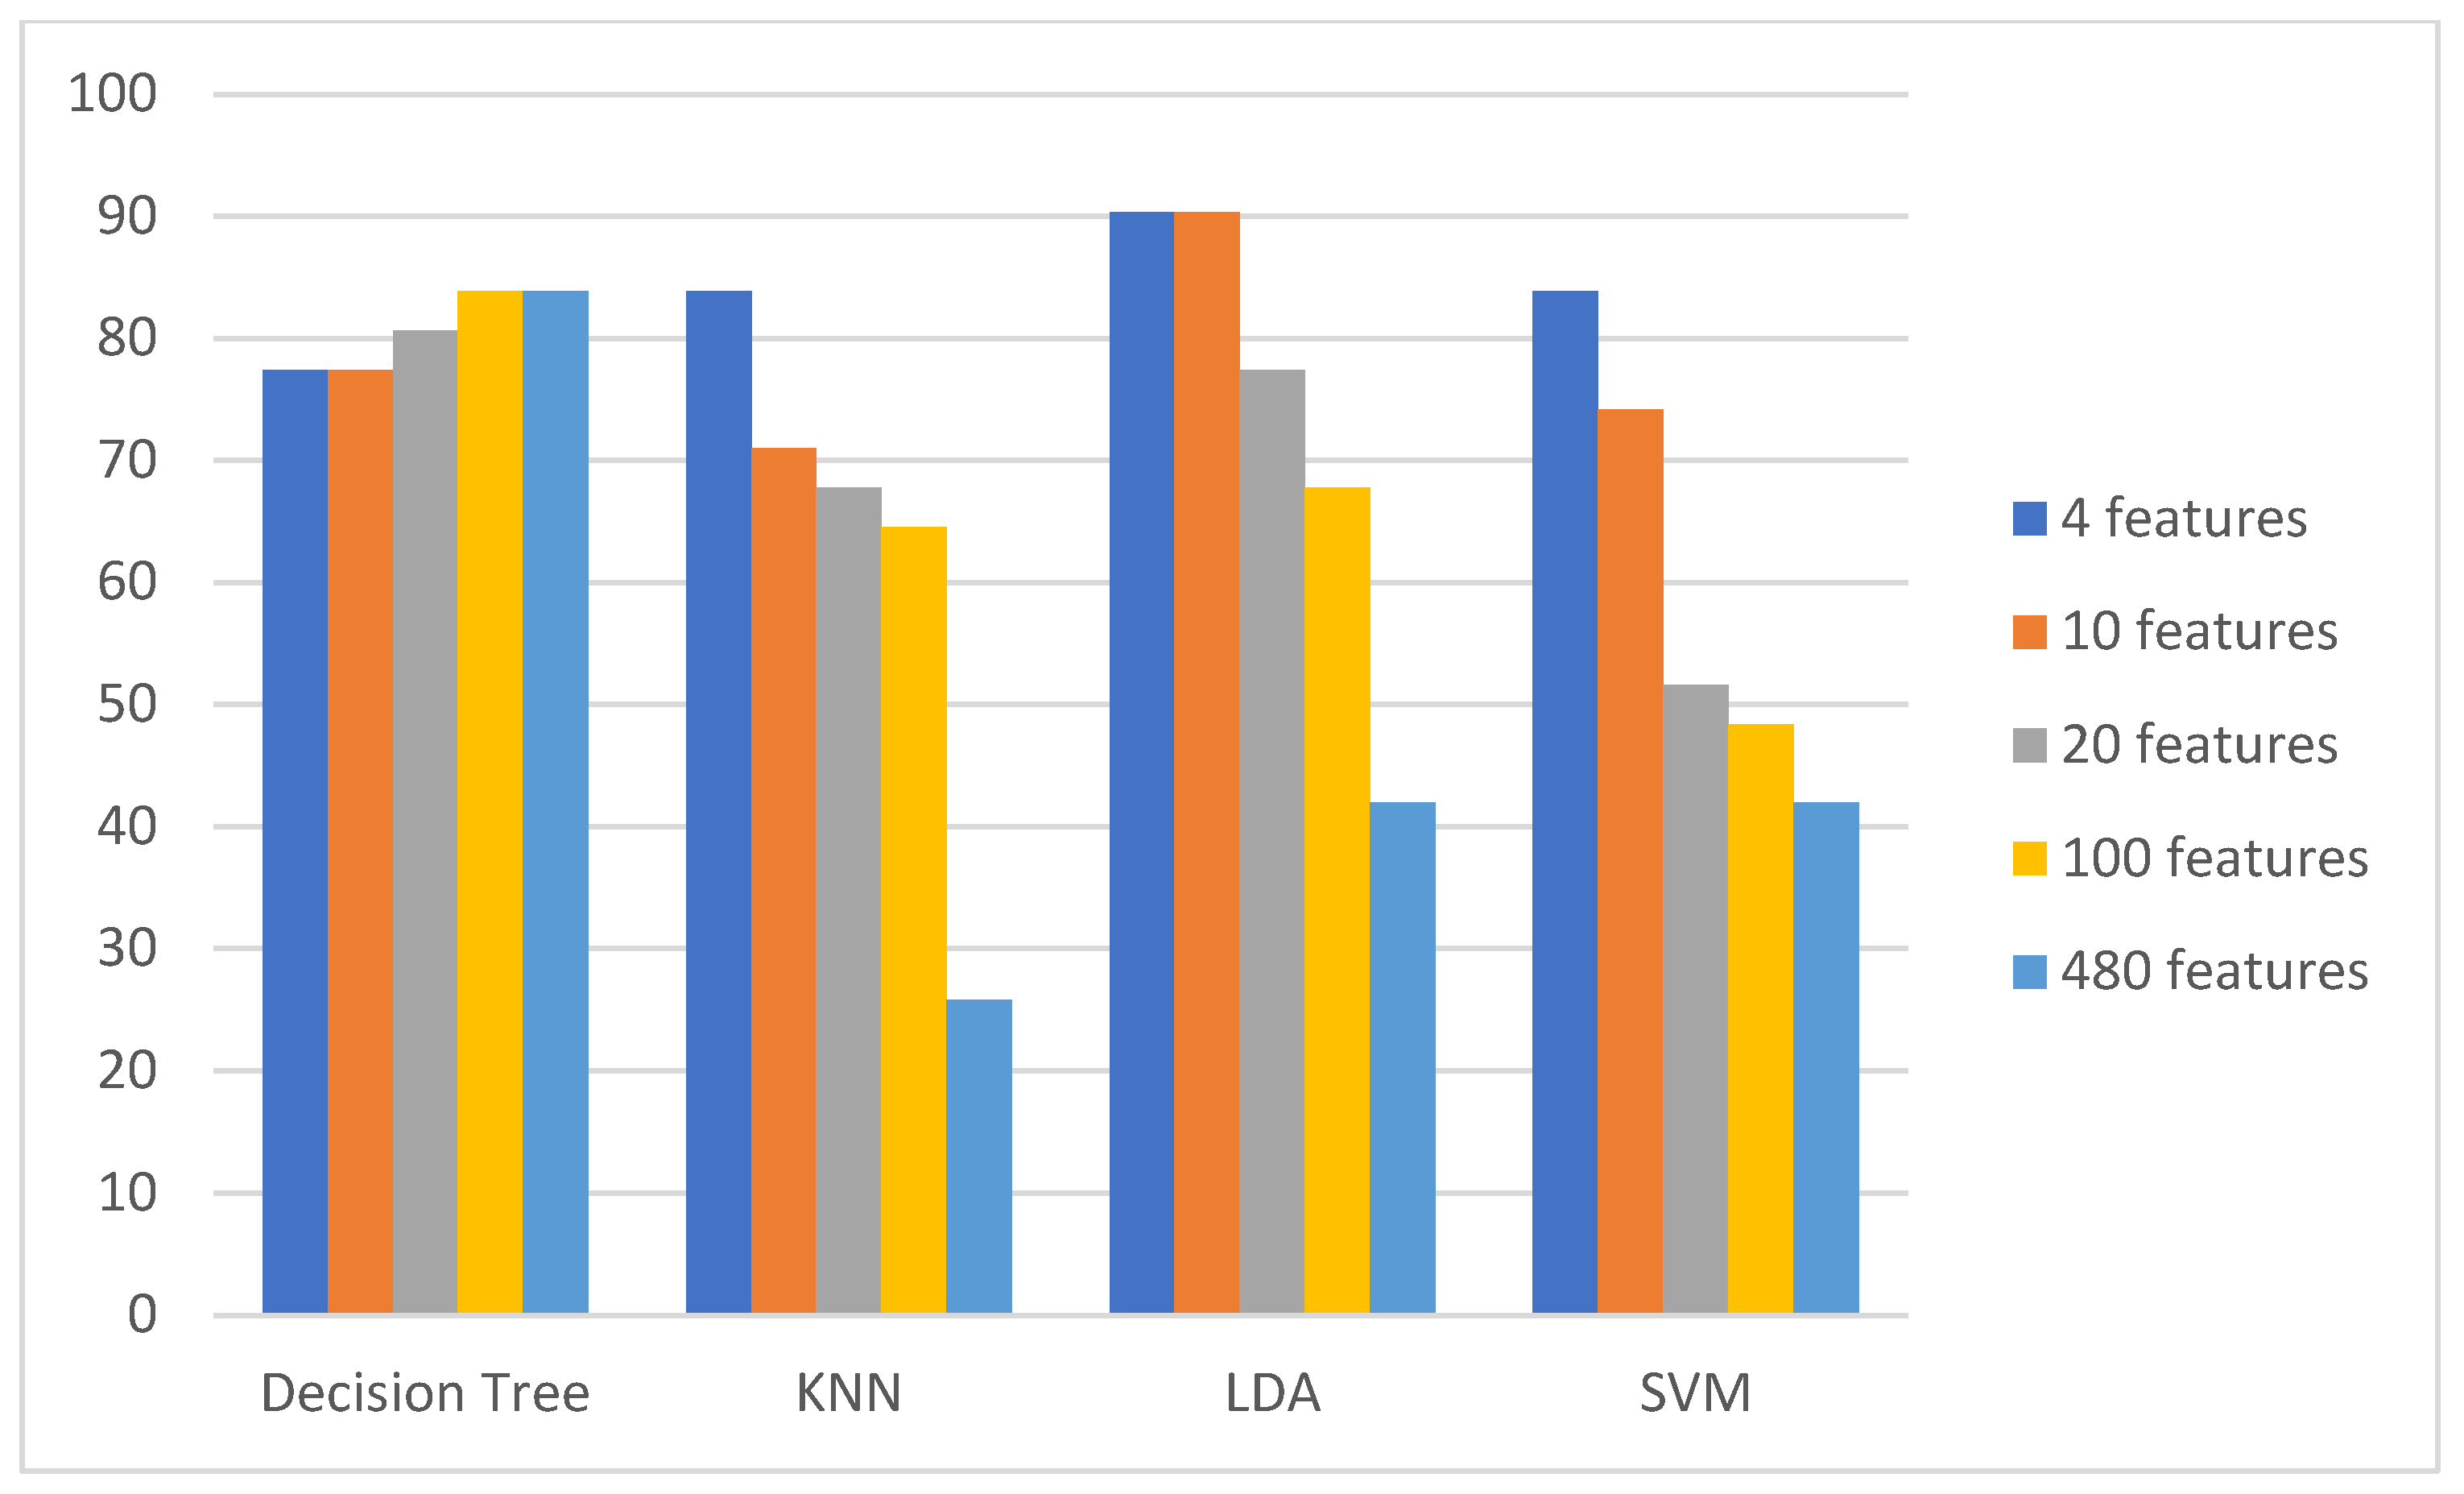
To identify the most correlated ROIs and best temporal features, respectively, we carried out a feature selection approach and examined the recognition rates by the same classifiers as in
Table 2. We selected 20, 10, 4 and 1 best features from the thermal feature set based on four feature ranking techniques including
t-test, relative entropy, ROC and MWW. The results are depicted in
Figure 6 which illustrates the significant improvement of classification accuracy rates by reducing the number of features. The accuracy of thermal modality in Mock crime protocol using LDA classifier increased from 41.9% to 90.3% by utilizing the ROC feature selection method.
Analyzing the results for thermal signals in
Table 3, we may notice that non-parametric criteria (ROC and MWW) achieved better results and could find the features that are linearly separable for the deception detection purpose. Furthermore, we can identify this improvement in other methods, as the accuracy jumped to 80.6% by
t-test. Further, we used the same procedure for the “Best Friend” scenario. In this case, the small difference is observed particularly when employing MWW method that could increase the accuracy from 62.9% to 71.8%. The results show that the mock crime scenario, in comparison to the best friend scenario, was more successful in creating a realistic framework of deceptive behavior.
An interesting result is identifying the optimal features (including ROIs, features and questions) which are most strongly associated with psychophysiological fluctuations in deceptive anxiety. Considering the 10 most valuable features selected by using the ROC method and which achieved more than 90% recognition accuracy rate, we noticed that perinasal and chin ROIs were mostly involved. Furthermore, questions 6 and 7 produced more relevant stress due to the mock crime protocol. The results are reported in
Table 4.
The same feature selection techniques were applied to the physiological signals. As shown in
Table 5, the relative entropy method on GSR signals showed a significant increase in recognition rate from 66.6% to 80.6% by decision tree classifier.
6. Discussion
Although thermal imaging benefits from advantages in comparison with physiological vital signs (especially as a non-contact method for monitoring psychophysiological states), the effectiveness of this technology for this purpose is still contradictory. One of the main contributions of this study was to determine the effectiveness of thermal imaging as a non-contact tool for detecting guilty behaviors in comparison with the gold standard methods. We have used several machine learning techniques to improve the accuracy of facial thermal imaging for this purpose. The results for GSR and PPG showed 70.9% successful classification rate as compared to 90.3% accuracy rate of facial thermal imaging in the Mock Crime scenario. These results are close to 87.2% that was reported by [
24] and 91.7% reported by [
25], who used mock crime for their investigation. Furthermore, we achieved 74.7% for discrimination of deception and truthfulness in the Best Friend scenario and outperforms the 60% accuracy rate that was reported by [
19].
Analyzing the results for thermal signals in
Table 3 which represent the effectiveness of utilization of feature selection methods suggest that non-parametric criteria, especially the ROC method, achieved better results and could find the features that are linearly separable for the deception detection purpose. Furthermore, we can identify this improvement in other methods, as the accuracy jumped to 80.6% by
t-test. Further, we used the same procedure for the “Best Friend” scenario. In this case, the small difference is observed particularly when employing ROC method to increase the accuracy from 62.9% to 74.7%. Our results show that the mock crime in comparison to the best friend scenario was successful in creating a more realistic framework of deceptive behavior.
Another contribution of this study was to identify which ROIs on the face are most correlated to deceptive anxiety. We utilized five ROIs and four feature ranking methods for this purpose. The results of the ROC feature selection model confirm that perinasal and chin areas were most strongly involved in this process. The thermal signature and modulation of respiration as a psychophysiological parameter that is affected by activation of Sympathetic Nervous System can lead to better discriminatory power of the perinasal area. These results contradict some previous studies that showed that the periorbital area contains the most information on thermal faces in deception detection frameworks [
16,
24,
27] and complement those which focused more on perinasal and lower part of the face [
17,
28]. This is the first study that examines these ROIs on the face to identify the most affected regions through deceptive anxiety emotional states.
If we consider the third column of
Table 4 which show the correct performance of mock crime protocol and the interview session we can see that those questions that achieved more discriminatory power (as shown by our employing the feature ranking techniques) are the question that are related to the crime. Question numbers 6, 7 and 8 show up more than other questions in the first 10 ranked questions.
7. Conclusions
Facial thermal imaging is a reliable non-contact method for unobtrusive ubiquitous monitoring of the psychophysiological response to environmental stress stimuli [
44]. The effectiveness of this method can be assessed by comparing with gold standard physiological monitoring methods. In deception detection studies, GSR and PPG are the most accepted measurements that can discriminate between deceptive and truthful behavior, effectively. However, the sensors need to be attached to the body of the subjects and could produce false positive outcomes. We collected THEPHY dataset to examine the performance of facial thermal imaging for this purpose and compares the discrimination result with polygraphy physiological data as the gold standard measurement framework. Utilizing the same machine learning techniques, the final classification accuracy rate for thermal data outperformed the GSR/PPG results.
Further work needs to be done to establish a more unobtrusive, realistic scenario and to increase the number of participants. That would need collaboration between psychology and computer science researchers in a common project. We can suggest the Facial Action Coding System (FACS) should be considered, so as to be able to draw some correlations for specific thermal Action Units (AUs) with deception, and to understand why at a specific ROI, there is greater discriminatory power compared to other ROIs. Considerably more work will need to be done to improve the face and ROI trackers in thermal spectra. We collected Kinect data for this purpose that will be investigated in our future research. These improvements can lead to a reliable unobtrusive ubiquitous framework for non-contact deception detection in the future.
8. Compliance with Ethical Standards
Ethical approval: All procedures performed in studies involving human participants were in accordance with the ethical standards of the local Institution’s Ethical Review Board and with the 1964 Helsinki declaration and its later amendments or comparable ethical standards.
Author Contributions
A.D., M.M. and T.G., A.M.N. wrote the article contributed to the design and implementation of the research, to the analysis of the results and to the writing of the manuscript. All authors have read and agreed to the published version of the manuscript.
Funding
There was no funding for this research.
Acknowledgments
I would like to acknowledge the valuable help of Ying-Hsang Liu, Research Fellow at the ANU Research School of Computer Science for constructive comments on my paper.
Conflicts of Interest
The authors declare no conflict of interest.
References
- Vrij, A. Detecting Lies and Deceit: The Psychology of Lying and Implications for Professional Practice; Wiley: Hoboken, NJ, USA, 2000. [Google Scholar]
- Ekman, P.; Maureen, O. Who can catch a liar? Am. Psychol. 1991, 46, 913. [Google Scholar] [CrossRef] [PubMed]
- Vrij, A. Why professionals fail to catch liars and how they can improve. Leg. Criminol. Psychol. 2004, 9, 159–181. [Google Scholar] [CrossRef]
- Jacobs, G.D. The physiology of mind–body interactions: The stress response and the relaxation response. J. Altern. Complementary Med. 2001, 7, 83–92. [Google Scholar] [CrossRef]
- Garbey, M.; Sun, N.; Merla, A.; Pavlidis, I. Contact-free measurement of cardiac pulse based on the analysis of thermal imagery. IEEE Trans. Biomed. Eng. 2007, 54, 1418–1426. [Google Scholar] [CrossRef] [PubMed]
- Pereira, C.B.; Yu, X.; Goos, T.; Reiss, I.; Orlikowsky, T.; Heimann, K.; Venema, B.; Blazek, V.; Leonhardt, S.; Teichmann, D. Noncontact monitoring of respiratory rate in newborn infants using thermal imaging. IEEE Trans. Biomed. Eng. 2018, 66, 1105–1114. [Google Scholar] [CrossRef]
- Krzywicki, A.T.; Berntson, G.G.; O’Kane, B.L. A non-contact technique for measuring eccrine sweat gland activity using passive thermal imaging. Int. J. Psychophysiol. 2014, 94, 25–34. [Google Scholar] [CrossRef]
- Ebisch, S.J.; Aureli, T.; Bafunno, D.; Cardone, D.; Romani, G.L.; Merla, A. Mother and child in synchrony: Thermal facial imprints of autonomic contagion. Biol. Psychol. 2012, 89, 123–129. [Google Scholar] [CrossRef]
- Marc, G.; Merla, A.; Pavlidis, I. Estimation of blood flow speed and vessel location from thermal video. In Proceedings of the 2004 IEEE Computer Society Conference on Computer Vision and Pattern Recognition, Washington, DC, USA, 27 June–2 July 2004; IEEE: Piscatvey, NJ, USA, 2004; Volume 1, p. I. [Google Scholar]
- Pavlidis, I.; Levine, J. Monitoring of periorbital blood flow rate through thermal image analysis and its application to polygraph testing. In Proceedings of the 23rd Annual International Conference of the IEEE Engineering in Medicine and Biology Society, Istanbul, Turkey, 25–28 October 2001; Volume 3, pp. 2826–2829. [Google Scholar]
- Shastri, D.; Merla, A.; Tsiamyrtzis, P.; Pavlidis, I. Imaging facial signs of neurophysiological responses. IEEE Trans. Biomed. Eng. 2008, 56, 477–484. [Google Scholar] [CrossRef]
- Pavlidis, I.; Dowdall, J.; Sun, N.; Puri, C.; Fei, J.; Garbey, M. Interacting with human physiology. Comput. Vis. Image Underst. 2007, 108, 150–170. [Google Scholar] [CrossRef]
- Aureli, T.; Grazia, A.; Cardone, D.; Merla, A. Behavioral and facial thermal variations in 3-to 4-month-old infants during the Still-Face Paradigm. Front. Psychol. 2015, 6, 1586. [Google Scholar] [CrossRef]
- Merla, A.; Di Donato, L.; Rossini, P.M.; Romani, G.L. Emotion detection through functional infrared imaging: Preliminary results. Biomed. Tech. 2004, 48, 284–286. [Google Scholar]
- Merla, A.; Romani, G. Thermal signatures of emotional arousal: A functional infrared imaging study. In Proceedings of the 29th Annual International Conference of the IEEE Engineering in Medicine and Biology Society, Lyon, France, 22–26 August 2007. [Google Scholar]
- Pavlidis, I.; Levine, J. Thermal image analysis for polygraph testing. IEEE Eng. Med. Biol. Mag. 2002, 21, 56–64. [Google Scholar] [CrossRef] [PubMed]
- Pollina, D.A.; Senter, S.M.; Cutlip, R.G. Hemifacial skin temperature changes related to deception: Blood flow or thermal capacitance? Int. J. Glob. Res. Comput. Sci. 2015, 6, 4. [Google Scholar]
- Ioannou, S.; Gallese, V.; Merla, A. Thermal infrared imaging in psychophysiology: Potentialities and limits. Psychophysiology 2014, 51, 951–963. [Google Scholar] [CrossRef] [PubMed]
- Abouelenien, M.; Pérez-Rosas, V.; Mihalcea, R.; Burzo, M. Deception detection using a multimodal approach. In Proceedings of the 16th International Conference on Multimodal Interaction (ICMI ’14), Istanbul, Turkey, 12–16 November 2014. [Google Scholar]
- Abouelenien, M.; Pérez-Rosas, V.; Mihalcea, R.; Burzo, M. Detecting deceptive behavior via integration of discriminative features from multiple modalities. IEEE Trans. Inf. Forensics Secur. 2017, 12, 1042–1055. [Google Scholar] [CrossRef]
- Derakhshan, A.; Mikaeili, M.; Khalilzadeh, M.A.; Mohammadian, A. Preliminary study on facial thermal imaging for stress recognition. In Proceedings of the 10th International Conference on Intelligent Environments, Shanghai, China, 30 June–1 July 2014. [Google Scholar]
- Puri, C.; Olson, L.; Pavlidis, I.; Levine, J.; Starren, J. Stresscam: Non-contact measurement of users’ emotional states through thermal imaging. In Proceedings of the 2005 ACM Conference on Human Factorsin Computing Systems (CHI), Portland, OR, USA, 2–7 April 2005. [Google Scholar]
- Pavlidis, I.; Tsiamyrtzis, P.; Shastri, D.; Wesley, A.; Zhou, Y.; Lindner, P.; Buddharaju, P.; Joseph, R.; Mandapati, A.; Dunkin, B.; et al. Fast by nature-how stress patterns define human experience and performance in dexterous tasks. Sci. Rep. 2012, 2, 305. [Google Scholar] [CrossRef]
- Tsiamyrtzis, P.; Dowdall, J.; Shastri, D.; Pavlidis, I.T.; Frank, M.G.; Ekman, P. Imaging facial physiology for the detection of deceit. Int. J. Comput. Vis. 2007, 71, 197–214. [Google Scholar] [CrossRef]
- Pollina, D.A.; Dollins, A.B.; Senter, S.M.; Brown, T.E.; Pavlidis, I.; Levine, J.A.; Ryan, A.H. Facial skin surface temperature changes during a “concealed information” test. Ann. Biomed. Eng. 2006, 34, 1182–1189. [Google Scholar] [CrossRef]
- Warmelink, L.; Vrij, A.; Mann, S.; Leal, S.; Forrester, D.; Fisher, R.P. Thermal imaging as a lie detection tool at airports. Law Hum. Behav. 2011, 35, 40–48. [Google Scholar] [CrossRef]
- Rajoub, B.A.; Zwiggelaar, R. Thermal facial analysis for deception detection. IEEE Trans. Inf. Forensics Secur. 2014, 9, 1015–1023. [Google Scholar] [CrossRef]
- Dcosta, M. Perinasal indicators of deceptive behavior. In Proceedings of the 11th IEEE International Conference and Workshops on Automatic Face and Gesture Recognition (FG), Ljubljana, Sloveniam, 4–8 May 2015. [Google Scholar]
- Zhu, Z.; Tsiamyrtzis, P.; Pavlidis, I. Forehead thermal signature extraction in lie detection. In Proceedings of the 29th Annual International Conference of the IEEE Engineering in Medicine and Biology Society, Lyon, France, 22–26 August 2007. [Google Scholar]
- Panasiti, M.S.; Cardone, D.; Pavone, E.F.; Mancini, A.; Merla, A.; Aglioti, S.M. Thermal signatures of voluntary deception in ecological conditions. Sci. Rep. 2016, 6, 35174. [Google Scholar] [CrossRef]
- Derakhshan, A.; Mikaeili, M.; Nasrabadi, A.M.; Gedeon, T. Network physiology of ‘fight or flight’response in facial superficial blood vessels. Physiol. Meas. 2019, 40, 014002. [Google Scholar] [CrossRef] [PubMed]
- Raskin, D.C.; Honts, C.R. The Comparison Question Test. In Handbook of Polygraph Testing; Academic Press: Cambridge, MA, USA, 2002. [Google Scholar]
- Hossain, M.Z.; Gedeon, T.; Sankaranarayana, R. Observer’s galvanic skin response for discriminating real from fake smiles. In Proceedings of the 27th Australasian Conference on Information Systems, Wollongong, Australia, 5–7 December 2016. [Google Scholar]
- Lynch, P.J.; Jaffe, C.C. Medical Illustrations; Center for Advanced Instructional Media, Yale University School of Medicine: New Haven, CT, USA, 2006. [Google Scholar]
- Viola, P.; Jones, M. Rapid object detection using a boosted cascade of simple features. In Proceedings of the 2001 IEEE Computer Society Conference on Computer Vision and Pattern Recognition, Kauai, HI, USA, 8–14 December 2001. [Google Scholar]
- Tomasi, C.; Takeo, K. Detection and Tracking of Point Features; International Journal of Computer Vision: Berlin, Germany, 1991. [Google Scholar]
- Shi, J. Good features to track. In Proceedings of the IEEE Computer Society Conference on Computer Vision and Pattern Recognition, Seattle, WA, USA, 21–23 June 1994. [Google Scholar]
- Jacoby, W.G. Loess: A nonparametric, graphical tool for depicting relationships between variables. Elect. Stud. 2000, 19, 577–613. [Google Scholar] [CrossRef]
- Hossain, M.Z.; Gedeon, T. Classifying posed and real smiles from observers’ peripheral physiology. In Proceedings of the 11th International Conference on Pervasive Computing Technologies for Healthcare, Barcelona, Spain, 23–26 May 2017. [Google Scholar]
- Li, S.; Liao, C.; Kwok, J. Gene feature extraction using T-test statistics and Kernel partial least squares. Lecture notes in computer science. Neural Inf. Process. 2006, 4234, 11–20. [Google Scholar]
- Van Erven, T.; Harremos, H. Rényi divergence and Kullback-Leibler divergence. IEEE Trans. Inf. Theory 2014, 60, 3797–3820. [Google Scholar] [CrossRef]
- Fawcett, T. An introduction to ROC analysis. Pattern Recognit. Lett. 2006, 27, 861–874. [Google Scholar] [CrossRef]
- Kirk, R. Statistics: An Introduction; Belmont: Thomson, GA, USA; Wadsworth, OH, USA, 2007. [Google Scholar]
- Cardone, D.; Pinti, P.; Merla, A. Thermal infrared imaging-based computational psychophysiology for psychometrics. Comput. Math. Methods Med. 2015, 2015, 984353. [Google Scholar] [CrossRef]
© 2020 by the authors. Licensee MDPI, Basel, Switzerland. This article is an open access article distributed under the terms and conditions of the Creative Commons Attribution (CC BY) license (http://creativecommons.org/licenses/by/4.0/).


