Review

A State-of-the-Art Review of Augmented Reality in Engineering Analysis and Simulation

1
NUS Graduate School for Integrative Sciences and Engineering, National University of Singapore, 28 Medical Drive, Singapore 117456, Singapore
2
Mechanical Engineering Department, National University of Singapore, 9 Engineering Drive 1, Singapore 117576, Singapore
*
Author to whom correspondence should be addressed.
Multimodal Technol. Interact. 2017, 1(3), 17; https://doi.org/10.3390/mti1030017
Submission received: 18 July 2017 / Revised: 12 August 2017 / Accepted: 23 August 2017 / Published: 5 September 2017
(This article belongs to the Special Issue Recent Advances in Augmented Reality)

Abstract

:
Augmented reality (AR) has recently become a worldwide research topic. AR technology renders intuitive computer-generated contents on users’ physical surroundings. To improve process efficiency and productivity, researchers and developers have paid increasing attention to AR applications in engineering analysis and simulation. The integration of AR with numerical simulation, such as the finite element method, provides a cognitive and scientific way for users to analyze practical problems. By incorporating scientific visualization technologies, an AR-based system superimposes engineering analysis and simulation results directly on real-world objects. Engineering analysis and simulation involving diverse types of data are normally processed using specific computer software. Correct and effective visualization of these data using an AR platform can reduce the misinterpretation in spatial and logical aspects. Moreover, tracking performance of the AR platforms in engineering analysis and simulation is crucial as it influences the overall user experience. The operating environment of the AR platforms requires robust tracking performance to deliver stable and accurate information to the users. In addition, over the past several decades, AR has undergone a transition from desktop to mobile computing. The portability and propagation of mobile platforms has provided engineers with convenient access to relevant information in situ. However, on-site working environment imposes constraints on the development of mobile AR-based systems. This paper aims to provide a systematic overview of AR in engineering analysis and simulation. The visualization, tracking techniques as well as the implementation on mobile platforms are discussed. Each technique is analyzed with respect to its pros and cons, as well its suitability to particular types of applications.

1. Introduction

Engineering problems are generally mathematical models of physical phenomena [1]. There are various types of typical engineering problems, such as solid mechanics, heat transfer, fluid flow, electrical, magnetism, etc. Almost all physical phenomena, whether mechanical, biological, aerospace, or chemical can be described using mathematical models [2]. Mathematical models use assumptions and appropriate axioms to express the features of a physical system. The solution of a physical problem can be approximated by using engineering analysis and simulation techniques, such as numerical simulation. With the help of advanced computer technology, the computer can process fast and accurate calculation of substantial amounts of data, and enable intuitive result visualization. Scientific visualization can illustrate numerical simulation results graphically to enable engineers to understand and glean insight from their data. There exists a number of numerical simulation software, many of which are based on a WIMP-style (windows, icons, menus, pointers) environment. In the last several decades, the trend of using innovative and intuitive systems to solve engineering problems has become increasingly evident.
Augmented reality (AR) has been studied for several decades and can be combined with human abilities as an efficient and complementary tool to enhance the quality of engineering analysis. An AR system can overlay computer-generated contents on views of the physical scene, augmenting a user’s perception and cognition of the world [3]. AR allows the users to continue interacting with both the virtual and real objects around them. A near real-time interaction with these virtual and real objects enables a user to judge multiple parameters simultaneously and analyze the problem efficiently. A complete AR system should include three main elements, i.e., tracking, registration, and visualization. Development of AR technology with precise information augmentation in real-time is a foreseeable reality that can be used in almost any domain. Over the past decade, AR has undergone a transition from desktop to mobile computing. The portability and propagation of mobile platforms has provided engineers with convenient access to relevant information in situ.
Integrating AR with engineering problems is a concept that has appeared in recent years. The improvement of equipment performance makes data processing and near real-time display possible. AR is capable of providing an immersive and intuitive environment for the user to achieve near real-time simulation results for problem analysis. Many review works have been conducted to summarize the systems in this field. Behzadan et al. [4] summarized a review regarding AR in architecture and construction simulation, and Barsom et al. [5] provided a systematic review on AR in medical and surgery related simulation. Nee et al. [6] reviewed the research of AR applications in manufacturing operations. Although there are many relevant works mentioned in their review, there are no rigorous review papers that focus on AR in engineering analysis and simulation. Therefore, the objective of this paper is to fill up this gap by providing a state-of-the-art summary of mainstream studies of AR in engineering analysis and simulation. The remaining of this review paper is organized as follows. Section 2 provides an overview of computer-aided technologies in engineering applications. A statistical survey is included in this section for reference. Section 3 highlights the research concentration and paucity with a summarized table. Besides, the techniques used for AR-based engineering analysis and simulation are summarized in Section 4. Finally, Section 5 provides a conclusion for this review and discusses the possible trends in this field.

2. Overview of Computer Aided Technologies in Engineering Analysis and Simulation

This section is divided into three subsections. The first subsection summarizes traditional computer-aided engineering analysis and simulation technologies and their limitations. The second subsection introduces the basic architecture of AR-based systems. The last subsection provides a statistical survey on the trend of using AR in engineering analysis and simulation.

2.1. Traditional Computer-Aided Engineering Analysis and Simulation Technologies

Numerical methods can be applied to obtain approximate solutions to a variety of problems in engineering. The use of mathematical methods can be traced back to early 20th century. With the development of computer technologies, developers have released several analysis and simulation software, such as ANSYS, Abaqus, COMSOL, etc. Traditional engineering analysis software including multiple windows incorporating graphical user interfaces, menus, dialog boxes, and tool bars. These software provide powerful solutions to engineering problems; however, these software often require users to spend time learning these the user interfaces of these software packages. Researchers have been working on improving computational efficiency, such as implementing neural networks [7]. Real-time systems enable engineers to observe simulation results as they are calculated [8]. This is a prospering research field considering it could be a very powerful learning tool [9]. In addition to computational performance, interactive simulation approach allows effective learning of behavior of materials [10] and could be used to accelerate the development cycle of a product [11].
Virtual reality (VR) technologies have been employed by researchers to achieve an immersive and interactive environment. Various VR-based visualization and interaction techniques have been developed. VR applications using numerical simulation began in the 90s. Several researchers [12,13] focused on using the VR environment for finite element analysis (FEA) result visualization. Scherer and Wabner [14] proposed a system for structural and thermal analysis. Their method visualizes FEA results with a three-dimensional glyph. Another glyph-based simulation result visualization system was proposed by Neugebauer et al. [15], in which stresses can be displayed using 3D glyphs. Buchau [16] introduced a VR- based numerical simulation system, which integrates a COMSOL Multiphysics solver for efficient computation. The post processing of simulation data plays a vital role, as accurate visualization of simulation data could improve user experience in the VR environment. By using the Visualization Toolkit [17], the computation results can be visualized with the interaction function provided [18,19]. Recently, deformation simulation has been conducted by several researchers [20,21,22]. Some of the studies use artificial neural network (ANN) and other approximation methods [23] to achieve real-time solutions. Interaction methods have been studied to utilize the simulation results provided in a VR environment so as to improve the efficiency of the analysis [24] and the design process [25]. Even though VR systems can provide visualization of the engineering analysis and simulation results in an intuitive and efficient way, there are still limitations. First, establishing a virtual environment with all the information involved is difficult as the detailed physical models and properties of the surrounding objects should be defined precisely. Secondly, there is no physical relationship between a user and the virtual content, such that the user has no influence on the environment. This reduces the immersion feelings experienced by the user. Furthermore, the equipment for an immersive VR-based system is not cost-effective and can cause ergonomic problems, such as nausea during use.

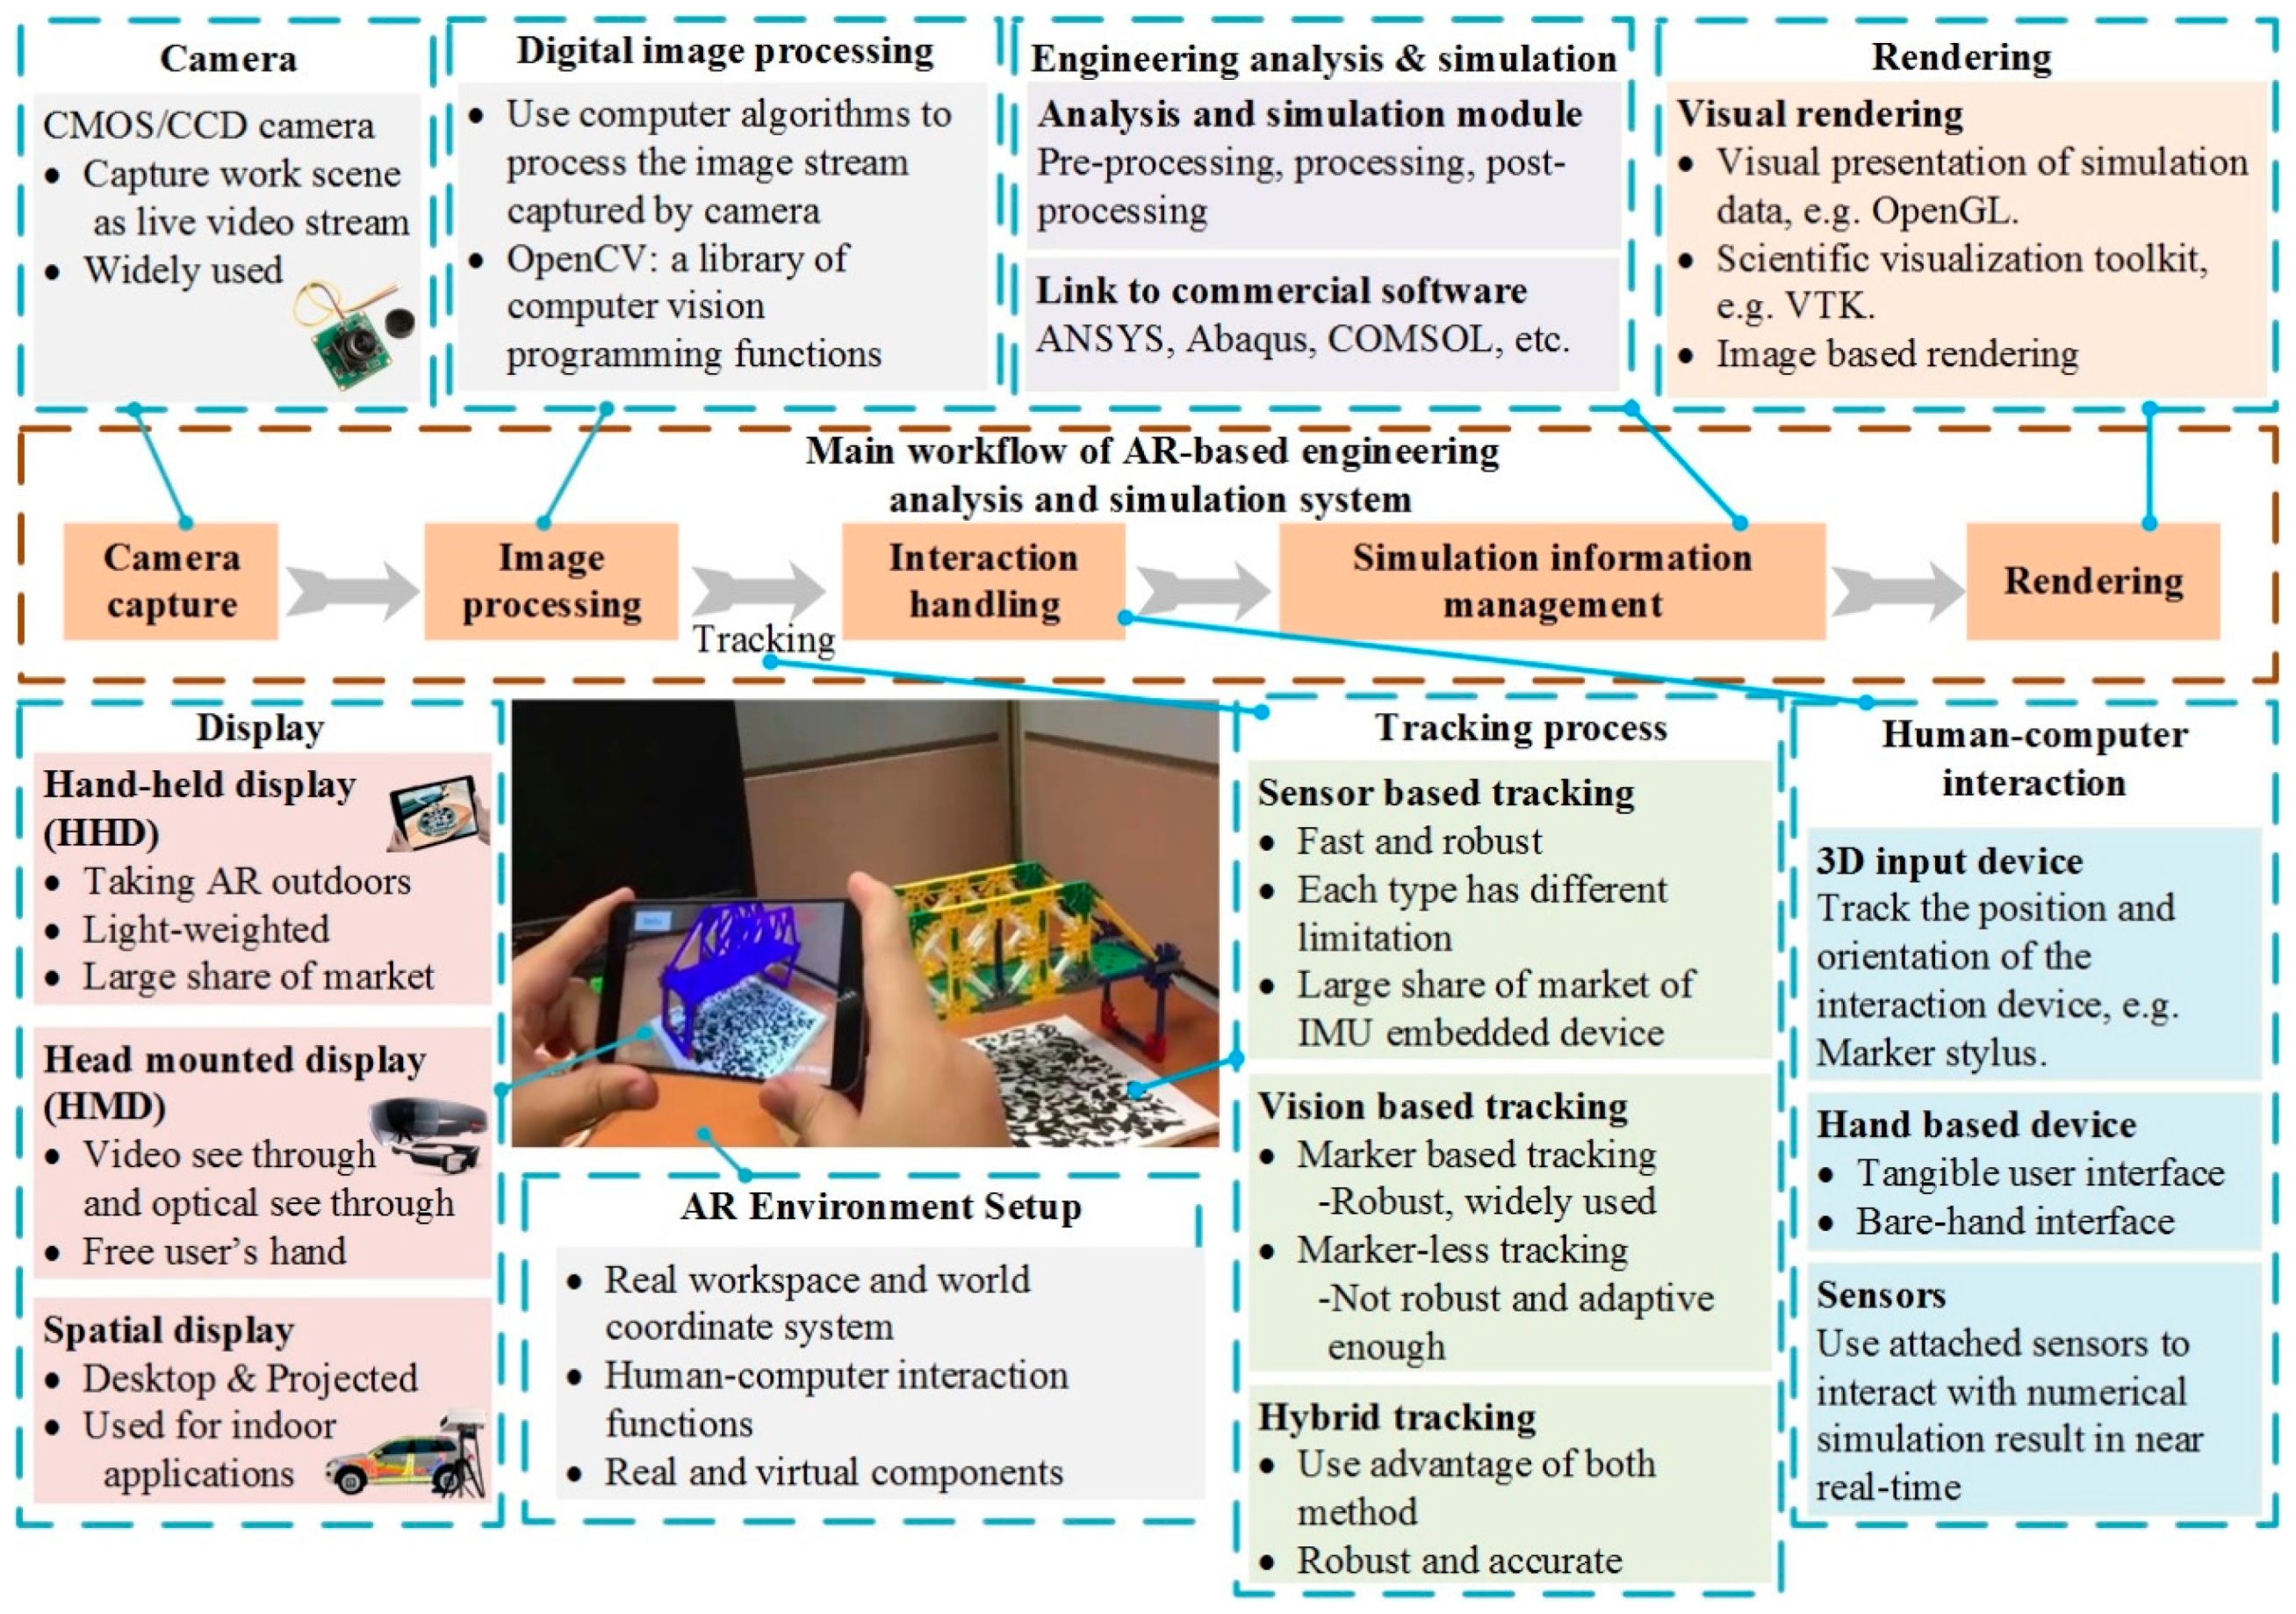
2.2. Basic Architecture in AR based System

The limitation of current software and VR systems comes from the main concern in a user’s daily life, which is towards the surrounding physical world instead of a virtual world. AR technology overcomes those limitations mentioned in Section 2.1 and provides a simple and immediate user interface to an electronically enhanced physical world [26]. AR visualization of numerical simulation results in the physical world can enhance perception and understanding of the dataset [27]. Near real-time update of results in the physical world enables a user to assess the influence of environmental parameters and analyze the problem efficiently. Therefore, AR has become one of the most promising approaches for engineering analysis and simulation. A typical AR-based engineering analysis and simulation system is illustrated in Figure 1.
As shown in Figure 1, the workflow of an AR-based engineering analysis and simulation system consists of five general steps, namely, image capture, image processing, interaction handling, simulation information management, and rendering. For each step, a detailed explanation on the characteristics and classifications is provided. The image captured with a camera is processed using computer vision algorithms for tracking, while engineering analysis and simulation modules generate content for AR rendering. The types of display devices and tracking methods are also summarized in the figure. The majority of AR research is based on visual display due to its ability to provide the most intuitive augmentation to the users. The equipment used for AR display can be classified into three categories based on their relative position to the user and the environment, namely, head-mounted display (HMD), hand-held device (HHD), and spatial display, such as desktop display and projected display. On the other hand, tracking means to determine the spatial properties dynamically at runtime. Current tracking techniques include sensor-based tracking, vision-based tracking and hybrid tracking [28]. Sensor-based tracking is based on sensors, such as magnetic, acoustic, mechanical sensors, etc., and vision-based tracking uses image processing to calculate the camera pose. Sensor-based tracking is fast but can be error-prone [29]. Current advancement of electronic devices has widely promoted sensors, such as inertial measurement unit (IMU), to help sensor-based tracking. Vision-based tracking, on the other hand, is accurate but relatively slow. Current vision-based tracking can be categorized into two methods, namely, marker based tracking [30] and marker-less tracking. The two tracking methods complement each other and researchers have started to develop hybrid methods to achieve a more robust tracking solution. The human-computer interaction can be achieved using additional accessories, tangible user interface, hand gesture, and attached sensors [27].

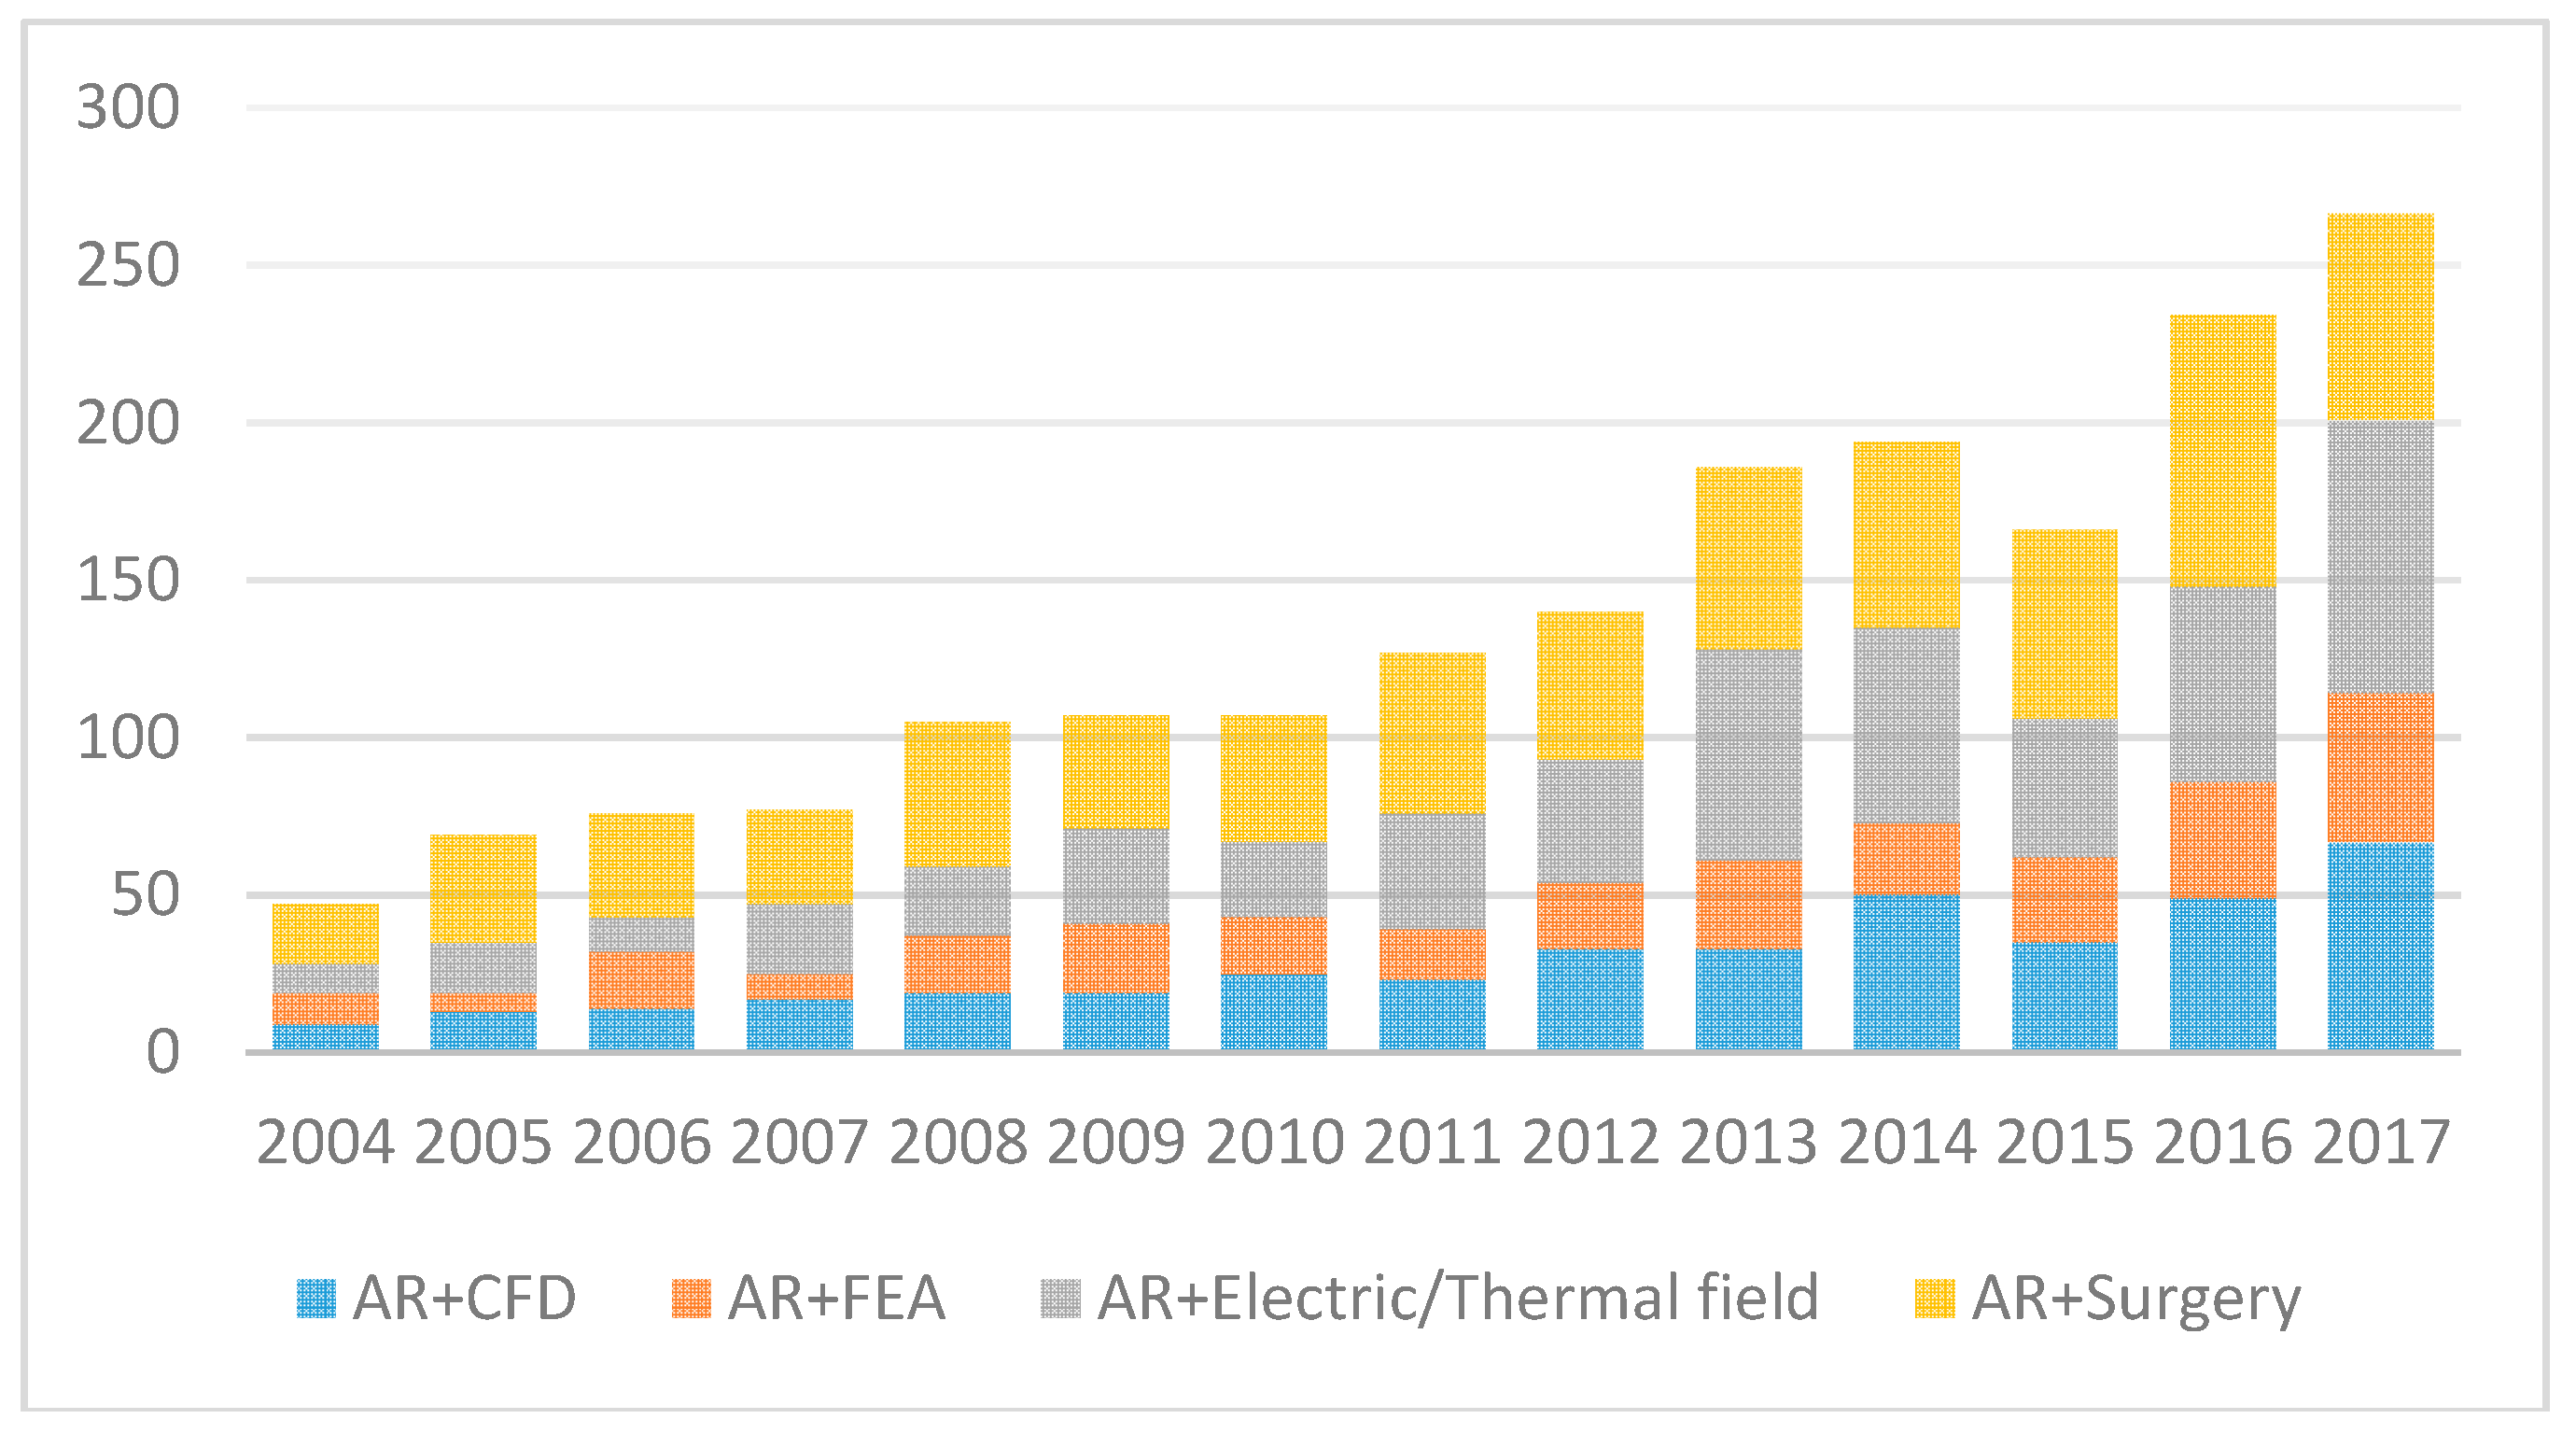
2.3. The Trend of Using AR in Engineering Analysis and Simulation

In this review, the articles were searched from the following online publisher databases, namely, Engineering Village, ScienceDirect, IEEE Xplore, Springer Link, ACM Digital Library, Web of Science, and Google scholar. All selected papers are ranging from 2004 to 2017 and related to AR-based engineering analysis and simulation. Among these selected articles, 48 of them will be discussed in Section 3. Figure 2 shows the research trend of engineering related analysis and simulation in AR. An upward trend can be observed from Figure 2. Four keyword combinations are used to filter relevant articles in ScienceDirect database. The column represents the occurrences of the AR related engineering analysis and simulation articles in the database.

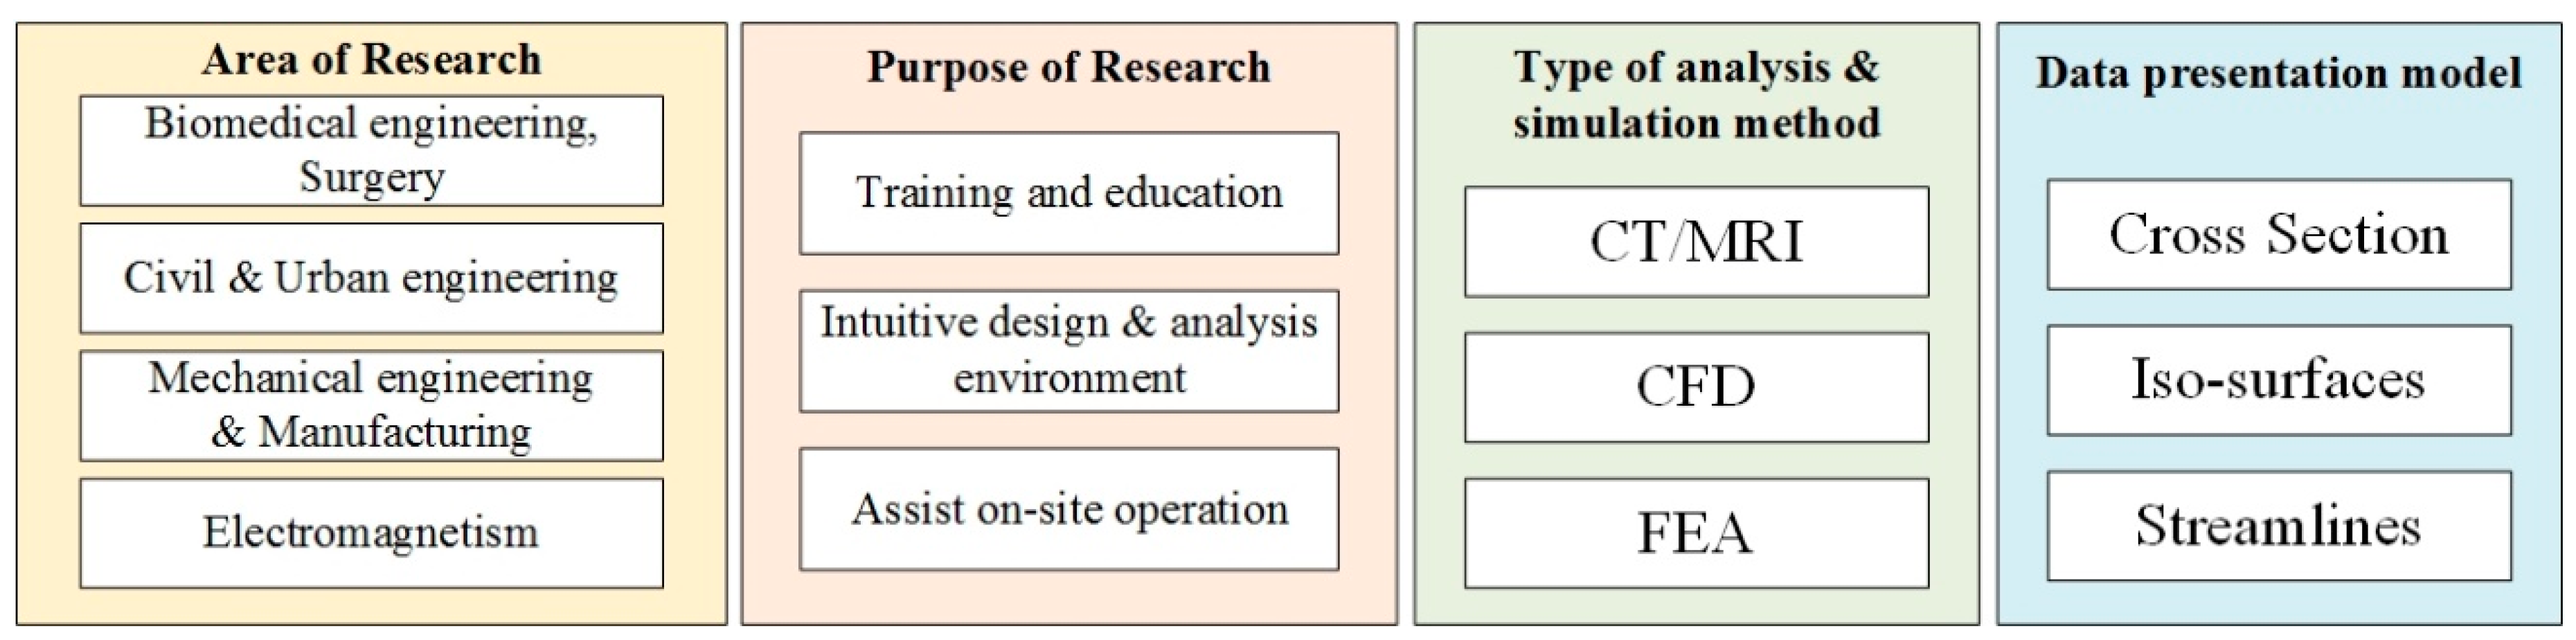
3. Current AR Applications in Engineering Analysis and Simulation

An overview of the research areas and purposes of AR-based engineering analysis and simulation applications is provided in Table 1. Current AR integrated engineering analysis and simulation systems are mainly focused on biomedical, thermal, electromagnetic, civil and mechanical engineering. Selected studies are divided into four main categories, namely, biomedical engineering and surgery, civil and urban engineering, mechanical engineering and manufacturing, and electromagnetism. The tracking methods, characteristics, and limitations of those studies in different categories are discussed and summarized separately in Table 2, Table 3, Table 4 and Table 5.
AR systems have been implemented in biomedical engineering and surgery (Table 2). Computed tomography (CT) and magnetic resonance imaging (MRI) data are normally visualized in an AR environment using image overlay, while a volume rendering method is included to enhance the data exploration experience in [31] and [32]. Superimposing CT and MRI data provides additional information for users in surgery training and real operation. However, current AR-based biomedical engineering and surgery systems mainly serve as an educational tool due to the limitation of the registration accuracy and complex setup. Comparing with CT and MRI data, AR is mainly used in civil and urban engineering to visualize thermal analysis and computational fluid dynamics (CFD) results (Table 3). With AR, civil engineers and urban designers can examine simulated results in the outdoor environment [33,34,35,36] and improve design in the indoor environment [37,38,39]. In the mechanical engineering and manufacturing fields, near real-time result updating with sensor networks [27,40,41,42], image processing [43], and tangible user interfaces [44,45,46,47,48,49,50] (Table 4) are common practices. As can be seen in Table 2 and Table 3, most of the selected studies in these two fields are based on a specific visualization tool instead of image overlay. In electromagnetic field, OpenGL has been widely used to represent the result, such as magnetic streamline patterns. The setup of these systems is normally in a desktop-based environment. Some of the studies [51,52,53,54] allow users to manipulate the position and orientation of the magnet, and examine the variation of the electromagnetic field. After a summary of typical AR engineering analysis and simulation systems, the technologies used in these systems will be discussed in Section 4. The discussion aims to provide a detailed description of state-of-the-art AR technologies in engineering analysis and simulation.
Table 6 summarizes the features and limitations of most of the AR-based engineering analysis and simulation systems. Selected studies use different visualization methods, such as image overlay, OpenGL programming, and special software kit, to visualize volumetric data and numerical simulation results. A relatively stable tracking and registration module is also included. However, the clear majority of current systems have some common limitations as well. Most of the AR systems are designed for one specific scenario only, such as in laparoscopic surgery [59]. Besides, the virtual contents are mostly pre-calculated and hardcoded in the systems. Moreover, selected studies support only one platform, instead of multi-platforms. The lack of scalability restricted the application range of these systems. In addition, most of the studies use AR as a visualization tool, and the possibility of interacting with the simulation results is neglected.
Figure 3 summarizes the research areas, research purposes, analysis and simulation methods, and data types encountered in current AR-based engineering analysis and simulation systems. With the development of computer technology, AR can be utilized to facilitate engineering analysis and numerical simulation in both visualization and interaction. Tracking is one of the basic components of an AR system, Table 7 shows the tracking techniques used in selected studies. Tracking techniques can be divided into three categories, namely, marker-based tracking, marker-less tracking, GPS and sensor fusion based tracking. Besides, the result updating ability is one of the research trends in recent years. Table 8 summarizes the simulation result updating methods in selected studies. Some of the reported studies, such as [32,43,46,70,74,75], used pre-defined simulation results. Pre-defined result based systems limit the function and are not flexible and scalable. In addition to pre-defined simulation results, result updating can be achieved in three different methods. First, users can update the result through manual input. Second, the parameters can be updated by using the computer vision techniques. For example, the deformation of tissues [58] and elastic objects [43] can be tracked and analyzed with image processing. Third, the integration of sensor networks and solution modules [27,41,42,46] enables near real-time result update, which provides more possibilities for AR-based systems. Sensor networks normally consist of three parts, namely, sensor nodes, gateways, and client processing software. Real-time load data can be captured using sensor nodes and processed with client software. Appropriate sensors should be selected and installed depending on the different conditions of the applications.
The popularity and portability of phablet devices have promoted the development of mobile AR platforms for outdoor and on-site engineering tasks, as shown in Table 9. Most reported AR systems are still developed for indoor applications [41,43,74,77]. Outdoor AR systems could serve as a tool to assist in important decisions without constraining the user’s whereabouts to a specially equipped area. Some of the selected studies are based on a client-server network model for visualization of simulation data [33,34,35,36,38,39,40,45,47,48,55,60,69,75]. However, due to limited device capabilities, mobile AR platforms still require further development for engineering analysis and simulation. The technologies to be developed for mobile AR systems include visualization and interaction methods. A detailed discussion on the techniques used for AR-based engineering analysis and simulation is summarized in Section 4.

4. Techniques Used for AR Applications in Engineering Analysis and siMulation

Different from common AR applications in other fields, AR applications in engineering analysis and simulation require robust tracking and visualization performance. The characteristics of engineering scenarios (e.g., lighting variation, poorly textured objects, marker incompatibility, etc.) have posed difficulties to most of the AR techniques available [78]. This section aims to provide a discussion on the techniques used for AR applications in engineering analysis and simulation.

4.1. Tracking

Tracking in AR technology refers to dynamic sensing and measuring of the spatial properties. Most reported researches used the marker-based tracking method. Marker-based tracking has been widely used ever since ARToolKit was available [30]. The advantage of marker-based tracking is computationally inexpensive and it can deliver relatively stable results with a low-resolution camera. In the research reported by Weidlich et al. [70], the FEA result is superimposed on a black-and-white fiducial marker that is pasted on the machine. Huang et al. [41,42] implemented a tracking system based on multiple markers. The multi-marker setup enhances the stability of the tracking performance by providing a wider range of detection. However, marker-based tracking intrudes the environment with markers and for engineering applications, visual cluttering introduced by artificial markers should be avoided.
Marker-less tracking aims to use natural features to determine the camera pose. The natural features are captured in every frame without relying on the previous frames. The interest points in the frame are represented by descriptors [79], which can be used to match with the descriptors in the tracking model. The research community has devoted significant efforts to feature detection. Shi [80] stated that the right features are those features which can be matched reliably. In the engineering scenario, it means the working area around the interest points should be visually distinct and sufficiently textured. Different interest point detectors have been evaluated by researchers all over the world [81,82]. A descriptor should be created after the interest point has been selected. Descriptors should capture the texture of the local neighborhood, while being relatively invariant to changes in scale, rotation, illuminations, etc. The comparison of different descriptors has been provided [81,83,84]. Recently, natural feature tracking was also implemented in outdoor tracking. In outdoor tracking, the natural feature based method has been enhanced with additional measures, such as built-in sensors in phablet devices, to make the solution robust and scalable. Koch et al. [85] proposed a distributed mobile AR tracking framework for industrial applications. Ufkes et al. [86] presented an end-to-end mobile AR tracking pipeline with a near 30Hz testing frame rate. Recently, Yu et al. [87,88] provided a hybrid solution for tracking planar surfaces in an outdoor environment with a client-server architecture. Similar tracking systems based on a client-server framework have also been proposed [89,90,91]. The impact of outdoor mobile AR based tracking technology is summarized in [92]. Outdoor tracking must address the additional challenge of searching a large localization database. With the rapid development of phablet and HMD devices, future work should investigate the integration of current techniques on handheld and HMD devices in order that the mobile AR systems can adapt to complex outdoor scenes.
Current mobile devices, such as smartphones and tablets, are equipped with an array of sensors, including global positioning system (GPS), wireless networking, and IMU sensors. GPS estimates the 3D position of the users. However, the accuracy of the measurement can vary from 1m to 100m. Higher accuracy can be achieved with differential GPS (DGPS), which uses an additional correction signal from ground stations. In addition to DGPS, real-time kinematics GPS (RTKGPS) further improves the accuracy by measuring the phase of the signal. For smartphones and tablet devices, the accuracy of the embedded GPS is normally within the range of 1m to 5m. Wireless network, such as WiFi, Bluetooth, and mobile network, can also be used to determine the position. Wireless network based tracking is achieved by using the identifier assigned by the base station. The tracking accuracy of wireless network based methods is determined by the strength of the signal. IMU sensor based tracking uses magnetometer, gyroscope, and accelerometer to determine the position of the users. This sensor fusion technique is normally combined with optical tracking and GPS in outdoor use.

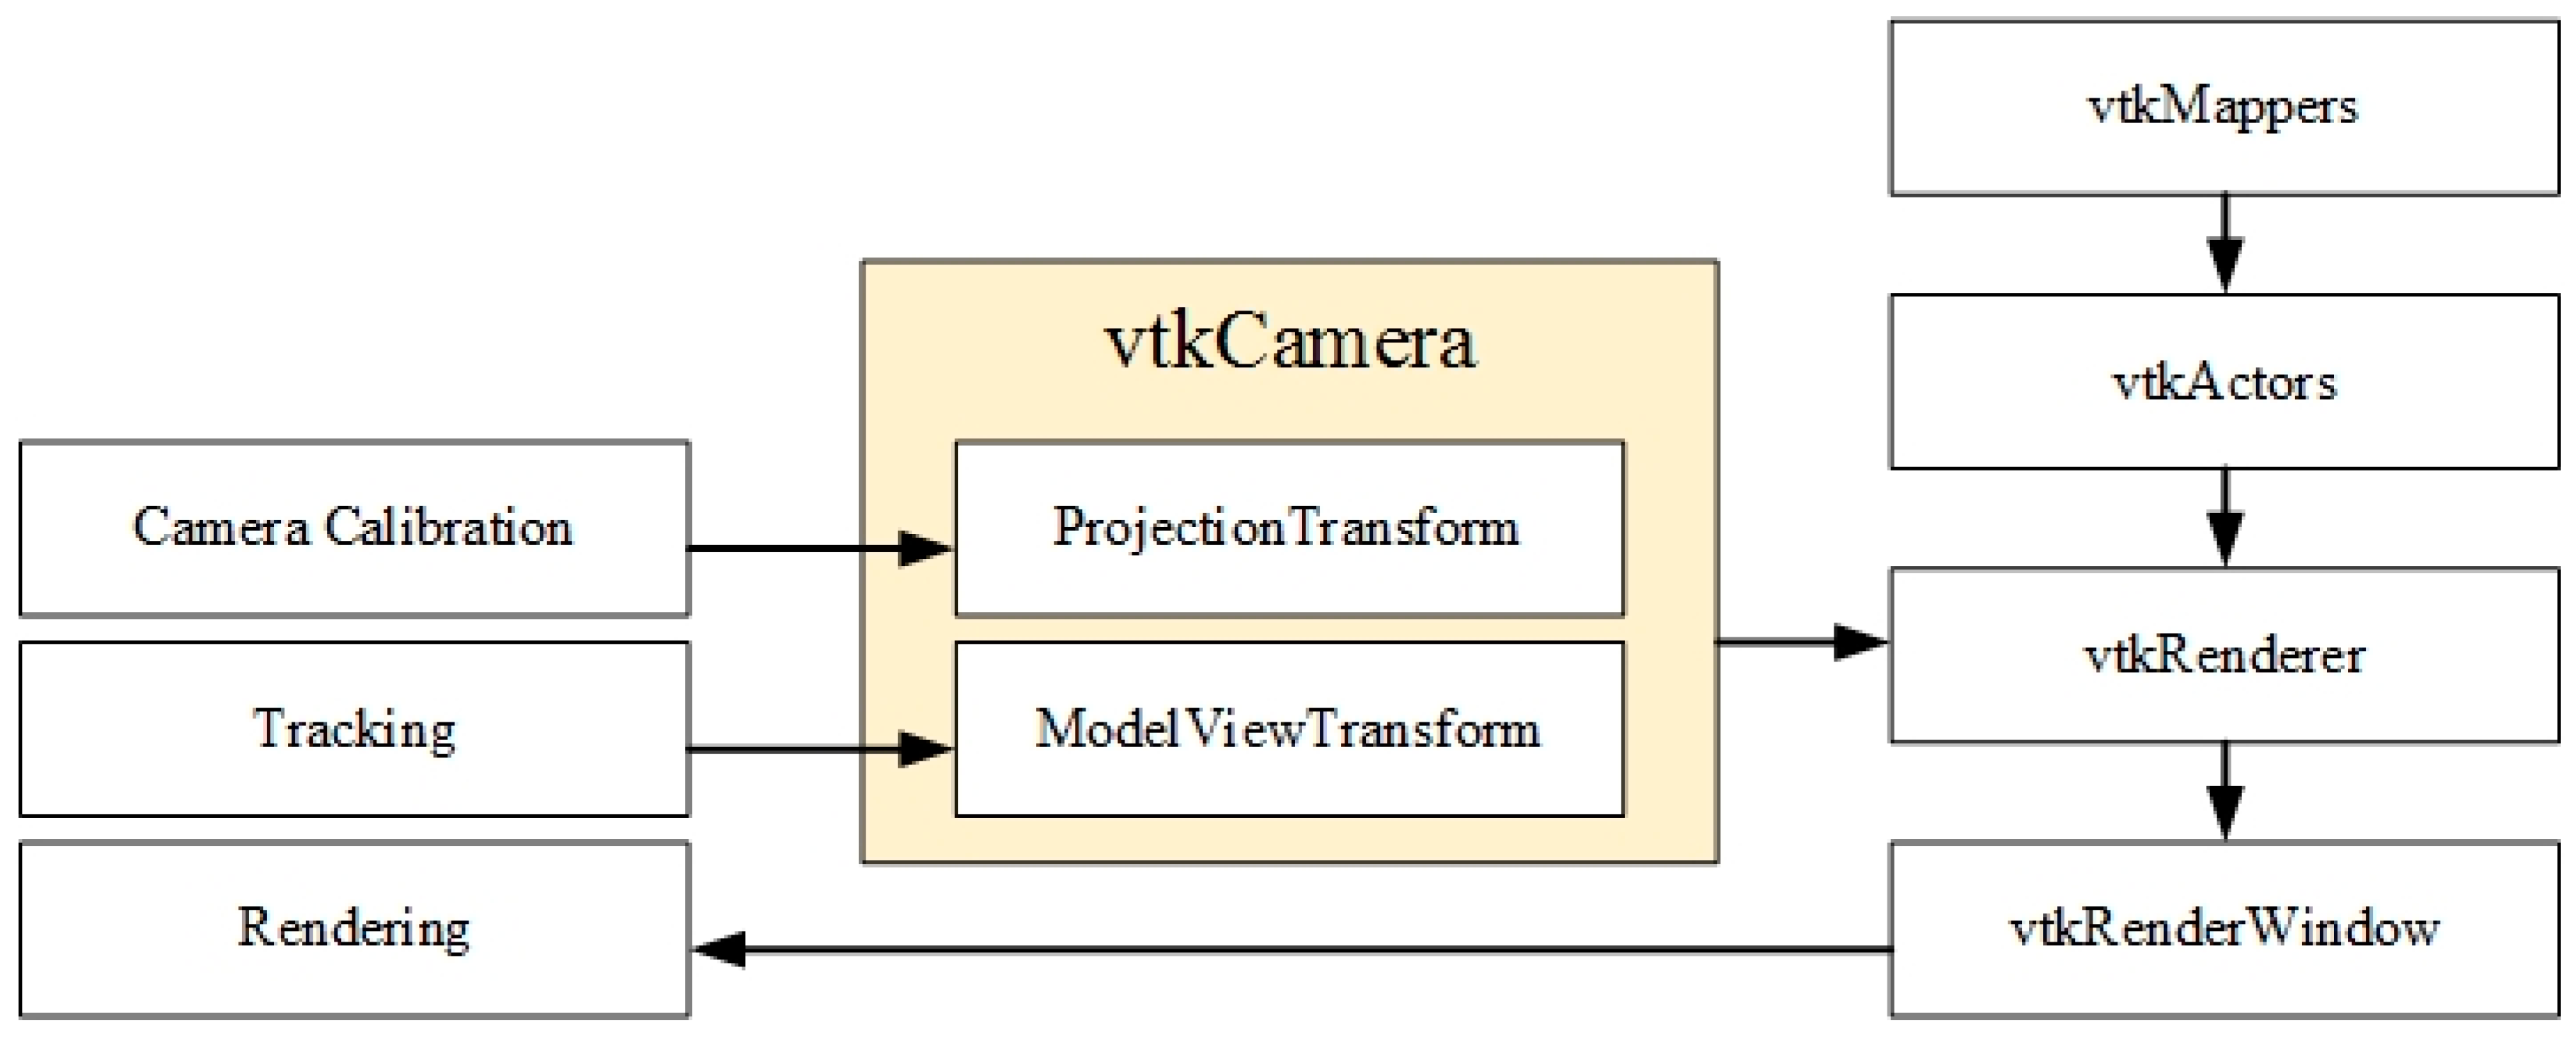
4.2. Result Visualization

Visualization for AR-based engineering analysis and simulation is different from conventional AR visualization primarily due to the special data types involved. Volume rendering of simulation data in an AR environment can be realized using two methods, namely, (1) convert data into readable format, and (2) integrate visualization tools. One of the common visualization methods used in surgery and biomedical engineering is image overlay. As mentioned by many researchers [59,61,62,77], data is rendered with a viewport-aligned slicing image. A 2D textured representation is generated based on a user’s viewport and superimposed on the real scene. Helfrich-Schkarbanenko et al. [93] described an image-based method, in which numerical simulation results can be transferred to a remote mobile device for visualization. Similarly, the method proposed by Moser et al. [94] allows low-resolution rendering and basic interaction function using an image-based method on mobile devices. Anzt et al. developed a finite element package called Hiflow3 [95]. With the support of this package, the simulation results of urban wind flow can be visualized on mobile devices using the image-based method. Instead of using 2D representation, the data format can be converted using data conversion software to be visualized in the AR environment. Figure 4 illustrates the data conversion procedure for analysis and simulation data in AR. Simulation results are transferred to a data conversion software, such as Blender and Paraview, and converted into the vectored graphic format. The vectored graphic format can be imported into the AR development platform for rendering. However, one disadvantage of this method is all simulation data must be pre-defined in the system.
Visualization Toolkit (VTK) [96] is an open-source library with various supporting visualization algorithms and interaction methods. These visualization algorithms and interaction methods have been widely implemented into visualization tools, such as ParaView, Mayavi, VolView, etc. Bruno et al. [97] presented a system named VTK4AR. This system integrates basic VTK functions into an AR environment. The CAD model and CFD streamlines can be augmented on real models. VTK4AR offers enormous convenience to related research on scientific visualization of numerical simulation results. Huang et al. [27,41,42] used VTK in an AR-based structural analysis system. The interaction functions provided by VTK were utilized in this system to support volume slicing and clipping. De Pascalis [98] presented a remote rendering method for mobile devices. The simulation results are generated in the polygon file format (PLY), also known as standard triangle format. The PLY format file can be rendered remotely via VTK. However, the scalability of the system is restricted as only pre-defined PLY files can be visualized. Scientific visualization of volumetric data on mobile devices is still an untapped research area as compared with desktop-based visualization. Figure 5 illustrates the approach of integrating the VTK with AR in current studies [41]. The visualization pipeline consists of several parts, namely, vtkMappers, vtkActors, vtkRenderer, vtkCamera, and vtkRenderWindow. The images grabbed by a camera is rendered as virtual objects by using the vtkRenderWindow and vtkRenderer. The vtkActors represents the physical representation of the data in the rendering window. In order to register vtkActors in the world coordinate system, the fundamental AR camera information is transferred into vtkCamera.

4.3. Interaction and Collaboration

A core function of AR is the ability to explore the data interactively. Interaction methods in AR are manifold due to the diversity of AR applications. Basic AR interaction methods include tangible user interface, body tracking, gestures, etc. Apart from basic interaction methods in AR, the interaction in engineering analysis and simulation fields normally refers to modification of parameters. These modifications can be performed virtually, or physically. In the systems reported by Huang et al. [41,42] and Issartel et al. [71], the users can use a stylus to perform various interactions, such as add virtual loads on a 3D structure. Similarly, Valentini and Pezzuti [50] implemented a mechatronic tracker to manipulate virtual beam deformation in the AR environment. A sensor network can be used to update the parameters physically. For example, the system by Huang et al. [41,42] included a force sensor network to acquire load data. The coordinate transformation and load allocation are performed for load conversion. The study proposed by Clothier and Bailey [63] used FBG sensors to measure the strain on a bridge, and augmented approximate stress distribution on the structure. An intuitive volumetric data exploring method could help users understand the results efficiently. In the work by Issartel et al. [71], a slicing method is proposed for a mobile AR system based on a handheld device; the users can use the phablet as a plane to perform slicing function. Similarly, Huang et al. [42] described a stylus-based slicing and clipping method, in which a user can create data slices or clips at different locations and manipulate each slice or clip for evaluation. Another intuitive interaction method was proposed in a project AR Sandbox. [99], where the real-time computation results of the water flow under different landscapes can be projected. A user can change the landscape directly in the sandbox, and the depth camera generates the corresponding simulation model.
Another feature of AR is its use as an effective means for communication among engineers, designers, etc., to achieve good collaboration. Collaborative AR enables multiple users to experience an augmented scene simultaneously. The collaborative feature of AR can generally be classified into two sharing modes, namely, co-located collaboration and remote collaboration. Both modes have significant potential for enhancing collaboration among multiple users working on projects [100]. In a shared space, virtual contents can be visualized together with the corresponding co-located users. Fuhrmann et al. [101] proposed an AR system for exploring 3D surfaces collaboratively. A shared space setup enables users to establish an individual view on virtual contents. Handheld displays are used in the TRANSVISION system [102] for sharing virtual contents on a table. In the work reported by Broll et al. [37], a co-location collaborative system is proposed for urban design. Dong et al. [103] described a collaborative visualization method for engineers, where their system supports CAD model display. However, these studies require HMD and handheld devices for collaboration. An interaction method which uses dynamic spatial projection for content rendering has been proposed [104]. The projection-based AR allows users to collaborate without holding any device. In remote collaboration, off-site users can see the scene being captured and transmitted, and video streaming is the primary mode of live transmission in remote collaboration. In Boulanger’s work [105], an AR tele-training system allows remote users to share the view of local users. In the work reported by Shen et al. [106] and Ong and Shen [107], a system was described for remote users to view a product model from different perspectives. On-screen annotation allows remote experts to look at the work scene from any viewpoint and annotate the scene using corresponding tools [108].

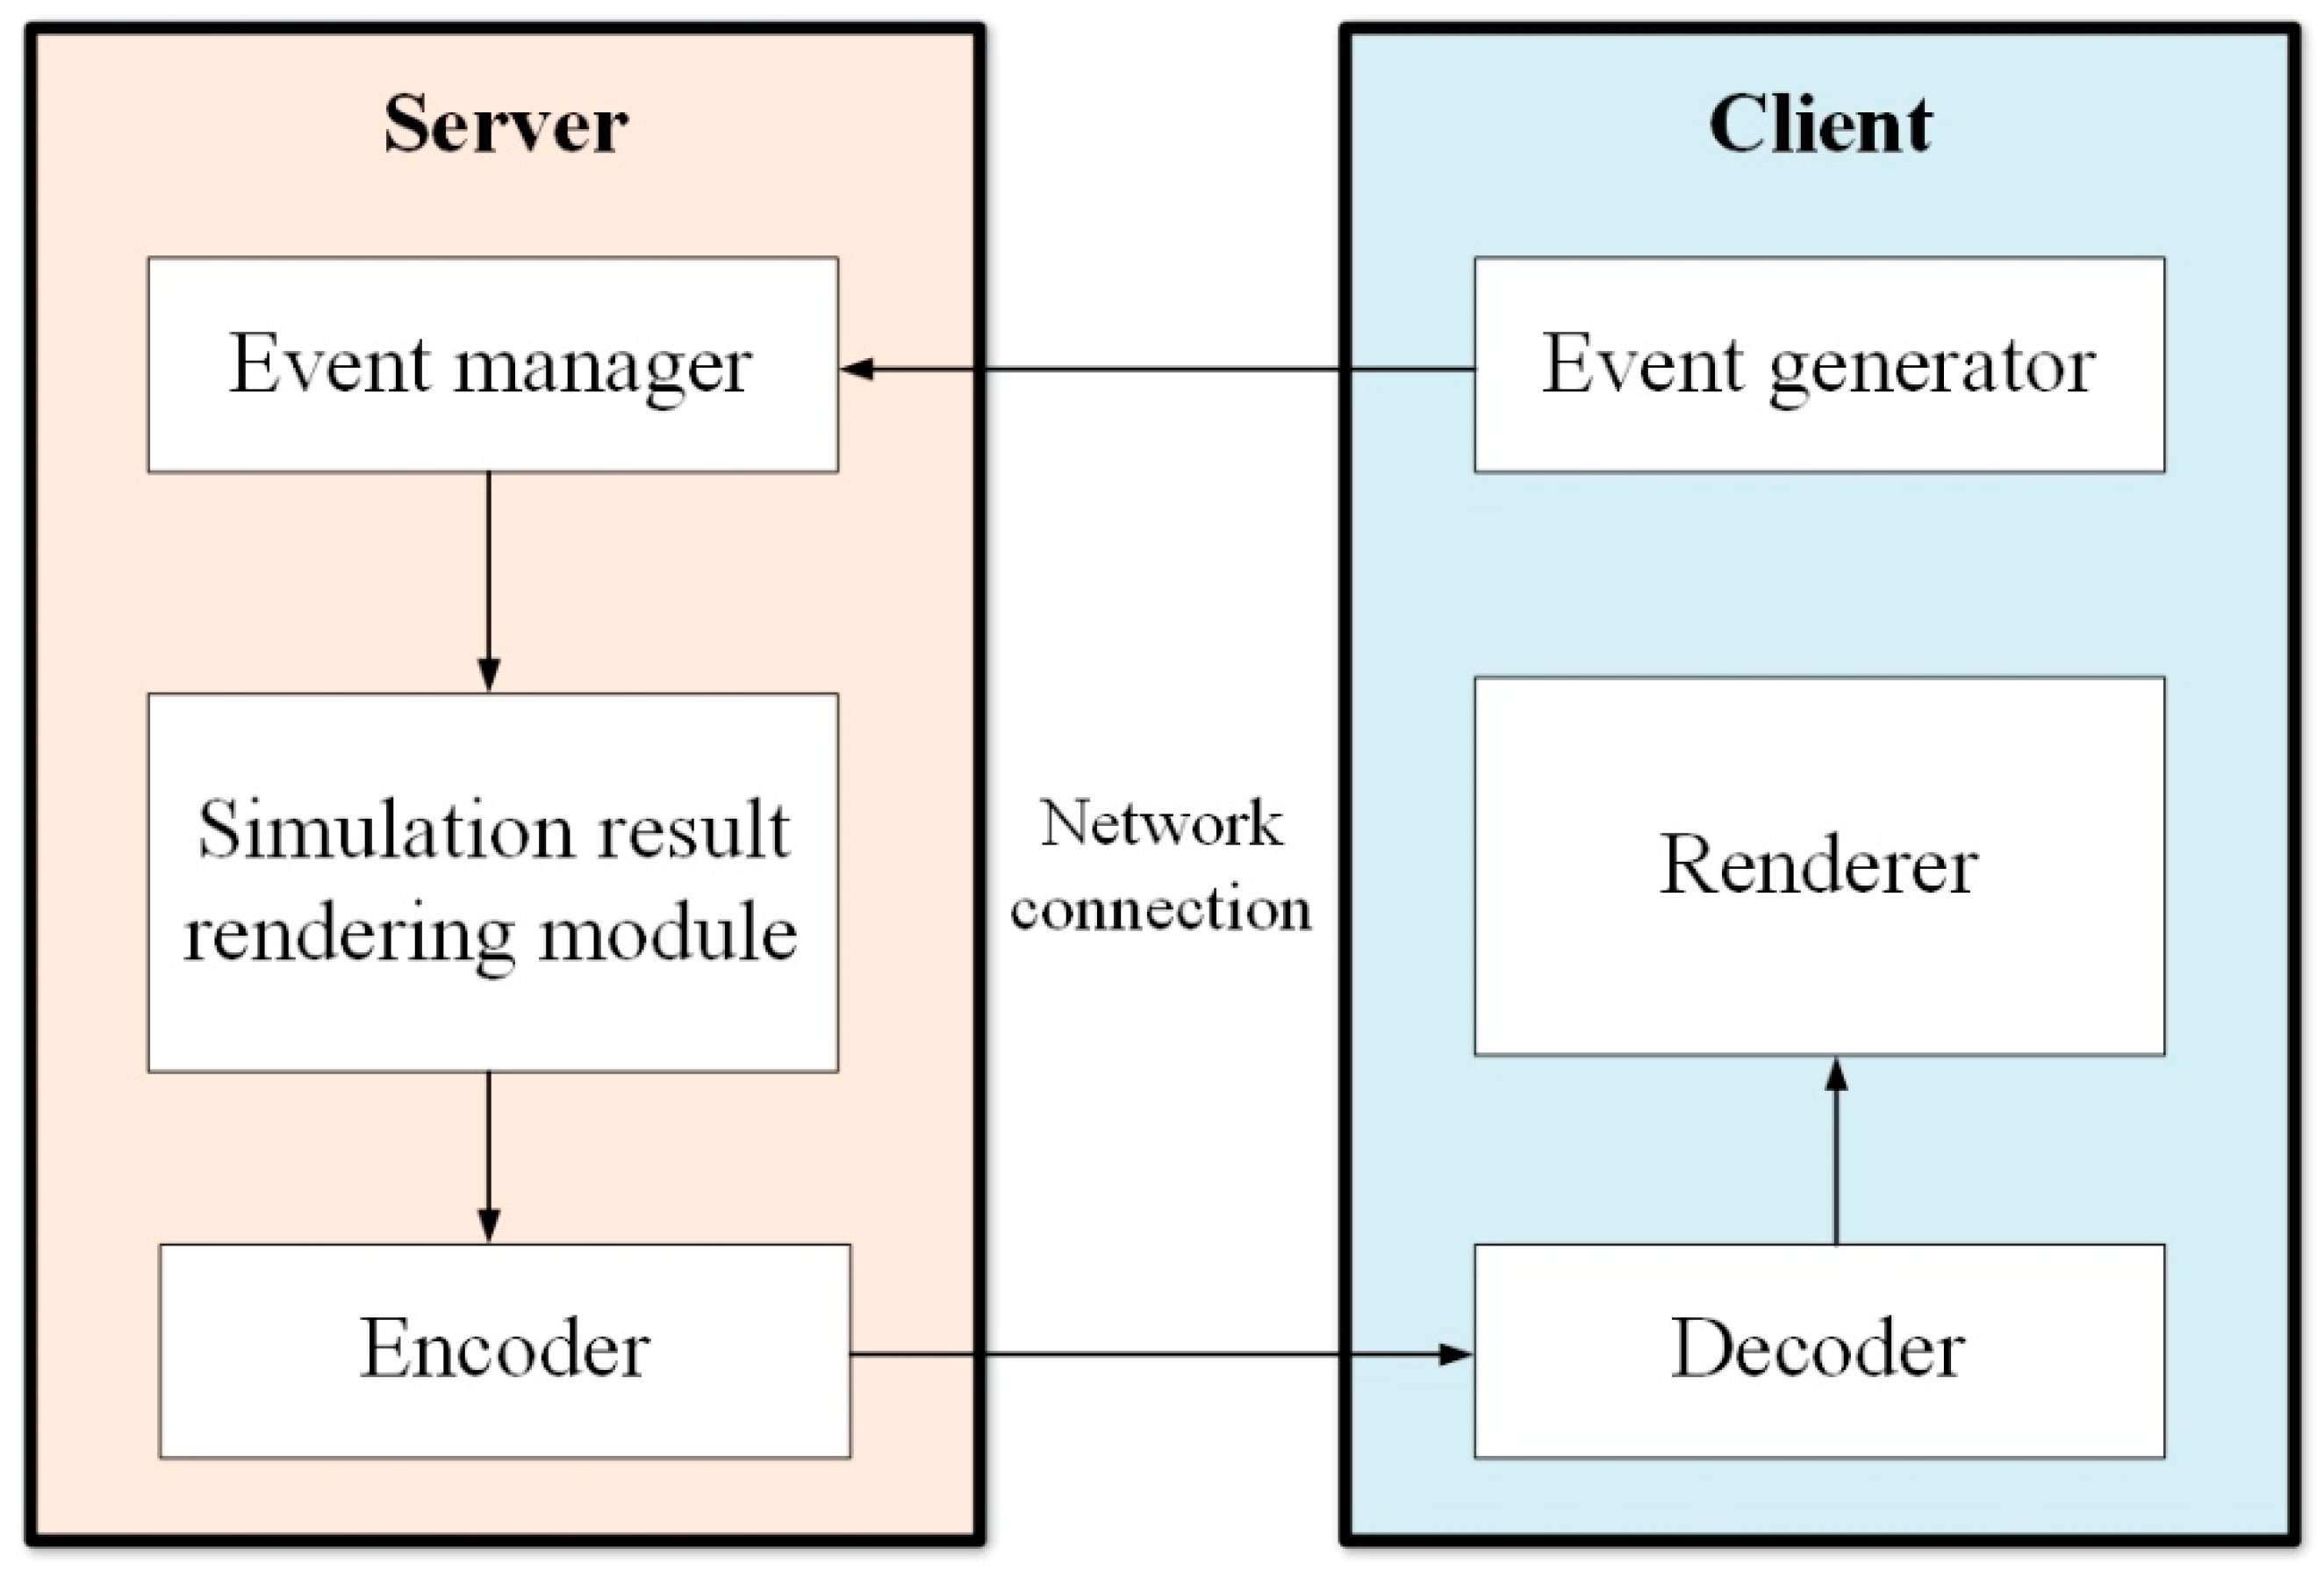
4.4. Client-Server Network Architecture

Client-server architecture has been widely used in the AR community for tracking, remote rendering, collaboration, etc. Simultaneous localization and mapping (SLAM) [109] is a technique used for tracking an unknown environment. A client-side SLAM system is integrated with server-side localization. The server side localization takes full advantage of the computational power without affecting the portability of the mobile client. The concept of using the computational ability of the server has influenced the development of the visualization techniques as well. For visualizing engineering analysis and simulation results, the general client/server system architecture can be summarized in Figure 6. The server comprises multiple components and processes commands generated from the client side. The result rendering module handling the simulation data converts the data into a readable format for the client side. Although the wireless network technology has been well developed in last ten years, the performance still varies depending on the actual outdoor location. The network connection may not be stable enough to support remote processing of simulation data.

5. Conclusions and Potential Future Directions

Today’s engineering analysis and simulation software aims to provide an easy-to-use interface for the users. Augmented reality applications are becoming increasingly common in many different fields. One of the major advantages of using AR instead of VR is that AR allows users to interact with real objects in addition to virtual contents in the augmented scene, and can amplify human perception and cognition of the real world. This paper has presented a state-of-the-art review of research studies on AR application in engineering analysis and simulation. Even though there are many researchers working on AR-based engineering analysis, there is no report to provide a comprehensive review on those systems. The aim of this paper is to provide an overview of the recent developments in this field to facilitate further investigation. Numerical simulation methods are powerful tools for engineers who can perform on-site engineering problem solving with the integration of AR and numerical analysis and simulation tools. This review starts with an overview of traditional computer-aided technologies followed by a detailed analysis on selected studies. The technical approaches used for addressing engineering analysis and simulation problems are discussed, which include tracking, visualization, interaction, collaboration, and client-server network connection. Tracking techniques have been investigated in Section 4.1. Sensor fusion techniques, such as using GPS or IMU, are available ubiquitously in AR systems, but have insufficient accuracy to fully support AR tracking. In addition to sensor-based tracking, optical-based tracking has been implemented to facilitate tracking performance. Marker-based tracking relies on a simple thresholding, in which the pose of the camera can be estimated easily from the markers. Comparing with marker-based tracking, natural feature tracking can be performed in a scene that is not prepared artificially. Recently, with the development of mobile computing, outdoor tracking addresses additional challenges to AR. Visualization in AR-based engineering analysis and simulation can be divided into three categories, namely, image overlay, format conversion, and scientific visualization. Section 4.2 has described related visualization methods in detail. The integration of VTK with AR has been introduced considering VTK is one of the fundamental libraries of other visualization tools. The basic characteristics of AR-based engineering analysis and simulation systems can be summarized as:
  • Robust tracking performance in the engineering scenario for enabling accurate registration of virtual contents;
  • Accurate visualization techniques for numerical simulation results allowing engineers to evaluate the problems efficiently; and
  • Intuitive interaction methods for volumetric data exploration.
AR is a promising tool for a wide range of engineering application areas. A further advancement will be the integration of AR with engineering analysis and simulation tools which has been evaluated in several studies and applications [39,42,74,79]. In addition to the key research fields and technologies presented in this paper, some directions for future work could be considered. One of the future directions is a fully functional mobile AR platform. Current mobile AR solutions are still in the infant stage, as tracking and result visualization performance cannot meet the current industrial needs. Advanced computer vision and visualization technology could enable near real-time display of numerical simulation results on mobile devices. Another possible direction is the use of sensor networks and ubiquitous computing. An increasing number of commercial products are controlled by a system-on-chip instead of traditional controllers. Sensors can be embedded in structures and products for monitoring and maintenance in an AR environment, and the analysis and simulation data can be provided for a better understanding of the conditions of the structures and products.

Acknowledgments

This research did not receive any specific grants from any funding agencies from the public, commercial, or not-for-profit sectors. The first author Wenkai Li would like to acknowledge his research scholarship provided by NGS of NUS.

Author Contributions

The authors, Wenkai Li., A.Y.C. Nee, and S.K. Ong, made equal contributions in collating and analyzing relevant research papers for this review.

Conflicts of Interest

The authors declare no conflict of interest.

References

  1. Moaveni, S. Finite Element Analysis Theory and Application with ANSYS. Available online: https://s3.amazonaws.com/academia.edu.documents/39672343/FINITE_ELEMENT_ANALYSIS.pdf?AWSAccessKeyId=AKIAIWOWYYGZ2Y53UL3A&Expires=1503551514&Signature=8llCti61A3gvv0%2BneizhZ%2Bo0egk%3D&response-content-disposition=inline%3B%20filename%3DFINITE_ELEMENT_ANALYSIS.pdf (accessed on 6 April 2007).
  2. Reddy, J.N. An. Introduction to the Finite Element Method, 3rd ed.; McGraw-Hill: New York, NY, USA, 2006. [Google Scholar]
  3. Azuma, R.T. A survey of augmented reality. Presence: Teleoperators. Virtual Env. 1997, 6, 355–385. [Google Scholar] [CrossRef]
  4. Behzadan, A.H.; Dong, S.; Kamat, V.R. Augmented reality visualization: A review of civil infrastructure system applications. Adv. Eng. Inform. 2015, 29, 252–267. [Google Scholar] [CrossRef]
  5. Barsom, E.Z.; Graafland, M.; Schijven, M.P. Systematic review on the effectiveness of augmented reality applications in medical training. Surg. Endosc. 2016, 30, 4174. [Google Scholar] [CrossRef] [PubMed]
  6. Nee, A.Y.C.; Ong, S.K. Virtual and Augmented Reality Applications in Manufacturing; Spring-Verlag: London, UK, 2004. [Google Scholar]
  7. Dong, F.H. Virtual reality research on vibration characteristics of long-span bridges with considering vehicle and wind loads based on neural networks and finite element method. Neural Comput. Appl. 2017. [Google Scholar] [CrossRef]
  8. Lian, D.; Oraifige, I.A.; Hall, F.R. Real-time finite element analysis with virtual hands: An introduction. In Proceedings of the WSCG POSTER, International Conference in Central Europe on Computer Graphics, Visualization and Computer Vision, Plzen, Czech Republic, 2–6 February 2004. [Google Scholar]
  9. Quesada, C.; González, D.; Alfaro, I.; Cueto, E.; Huerta, A.; Chinesta, F. Real-time simulation techniques for augmented learning in science and engineering. Vis. Comput. Int. J. Comput. Graph. 2016, 32, 1465–1479. [Google Scholar] [CrossRef]
  10. Ferrise, F.; Bordegoni, M.; Marseglia, L.; Fiorentino, M.; Uva, A.E. Can Interactive Finite Element Analysis Improve the Learning of Mechanical Behavior of Materials? A Case Study. Comput. Aided Des. Appl. 2015, 12, 45–51. [Google Scholar] [CrossRef]
  11. Rose, D.; Bidmon, K.; Ertl, T. Intuitive and Interactive Modification of Large finite Element models. Available online: http://www.visus.uni-stuttgart.de/uploads/tx_vispublications/rbevis04.pdf (accessed on 18 July 2017).
  12. Yagawa, G.; Kawai, H.; Yoshimura, S.; Yoshioka, A. Mesh-invisible finite element analysis system in a virtual reality environment. Comput. Model. Simul. Eng. 1996, 3, 289–314. [Google Scholar]
  13. Yeh, T.P.; Vance, J.M. Combining MSC/NASTRAN, sensitivity methods, and virtual reality to facilitate interactive design. Finite Elem. Anal. Des. 1997, 26, 161–169. [Google Scholar] [CrossRef]
  14. Scherer, S.; Wabner, M. Advanced visualization for finite elements analysis in virtual reality environments. Int. J. Interact. Des. Manuf. 2008, 2, 169–173. [Google Scholar] [CrossRef]
  15. Neugebauer, R.; Weidlich, D.; Scherer, S.; Wabner, M. Glyph based representation of principal stress tensors in virtual reality environments. Prod. Eng. 2008, 2, 179–183. [Google Scholar] [CrossRef]
  16. Buchau, A.; Rucker, W.M. Analysis of a Three-Phase Transformer using COMSOL Multiphysics and a Virtual Reality Environment. In Proceedings of the 2011 COMSOL Conference, Stuttgart, Germany, 26–28 October 2011. [Google Scholar]
  17. Avila, L.S.; Barre, S.; Blue, R.; Geveci, B.; Henderson, A.; Hoffman, W.A.; King, B.; Law, C.C.; Martin, K.M.; Schroeder, W.J. The VTK User’s Guide, 5th ed.; Kitware: New York, NY, USA, 2010. [Google Scholar]
  18. Hafner, M.; Schoning, M.; Antczak, M.; Demenko, A.; Hameyer, K. Interactive postprocessing in 3D electromagnetics. IEEE Trans. Magn. 2010, 46, 3437–3440. [Google Scholar] [CrossRef]
  19. Schoning, M.; Hameyer, K. Applying virtual reality techniques to finite element solutions. IEEE Trans. Magn. 2008, 44, 1422–1425. [Google Scholar] [CrossRef]
  20. Hambli, R.; Chamekh, A.; Salah, H.B.H. Real-time deformation of structure using finite element and neural networks in virtual reality applications. Finite Elem. Anal. Des. 2006, 42, 985–991. [Google Scholar] [CrossRef]
  21. Santhanam, A.; Fidopiastis, C.; Hamza-Lup, F.; Rolland, J.P.; Imielinska, C. Physically-based deformation of high-resolution 3D lung models for augmented reality based medical visualization. Available online: http://www.felixlup.net/papers/2004_MICCAI_Hamza-Lup.pdf (accessed on 18 July 2017).
  22. Tzong-Ming, C.; Tu, T.H. A fast parametric deformation mechanism for virtual reality applications. Comput. Ind. Eng. 2009, 57, 520–538. [Google Scholar] [CrossRef]
  23. Connell, M.; Tullberg, O. A framework for immersive FEM visualisation using transparent object communication in a distributed network environment. Adv. Eng. Softw. 2002, 33, 453–459. [Google Scholar] [CrossRef]
  24. Liverani, A.; Kuester, F. Towards Interactive Finite Element Analysis of Shell Structures in Virtual Reality. In Proceedings of the 1999 International Conference on Information Visualisation, London, UK, 14–16 July 1999. [Google Scholar]
  25. Ingrassia, T.; Cappello, F. VirDe: a new virtual reality design approach. Int. J. Interact. Des. Manuf. 2009, 3, 1–11. [Google Scholar] [CrossRef]
  26. Ong, S.K.; Yuan, M.L.; Nee, A.Y.C. Augmented reality applications in manufacturing: A survey. Int. J Prod. Res. 2008, 46, 2707–2742. [Google Scholar] [CrossRef]
  27. Ong, S.K.; Huang, J.M. Structure design and analysis with integrated AR-FEA. CIRP Ann. Manuf. Tech. 2017, 66, 149–152. [Google Scholar] [CrossRef]
  28. Zhou, F.; Duh, H.B.L.; Billinghurst, M. Trends in augmented reality tracking, interaction and display: A review of ten years of ISMAR. In Proceedings of the 7th IEEE/ACM International Symposium on Mixed and Augmented Reality, Cambridge, UK, 15–18 September 2008. [Google Scholar]
  29. Daponte, P.; De Vito, L.; Picariello, F.; Riccio, M. State of the art and future developments of the Augmented Reality for measurement applications. Measurement 2014, 57, 53–70. [Google Scholar] [CrossRef]
  30. Kato, H.; Billinghurst, M. Marker tracking and HMD calibration for a video-based augmented reality conferencing system. In Proceedings of the 2nd IEEE and ACM International Workshop on Augmented Reality, San Francisco, CA, USA, 20–21 October 1999. [Google Scholar]
  31. Salah, Z.; Preim, B.; Rose, G. An approach for enhanced slice visualization utilizing augmented reality: Algorithms and applications. In Proceedings of the 3rd Palestinian International Conference on Computer and Information Technology (PICCIT), Palestine Polytechnic University, 9–11 March 2010. [Google Scholar]
  32. Sutherland, C.; Hashtrudi-Zaad, K.; Sellens, R.; Abolmaesumi, P.; Mousavi, P. An augmented reality haptic training simulator for spinal needle procedures. IEEE Trans. Biomed. Eng. 2013, 60, 3009–3018. [Google Scholar] [CrossRef] [PubMed]
  33. Carmo, M.B.; Ana, P.C.; António, F.; Ana, P.A.; Paula, R.; Cristina, C.; Miguel, C.B.; Jose, N.P. Visualization of solar radiation data in augmented reality. In Proceedings of the IEEE International Symposium on Mixed and Augmented Reality (ISMAR), Munich, Germany, 10–12 September 2014. [Google Scholar]
  34. Carmo, M.B.; Cláudio, A.P.; Ferreira, A.; Afonso, A.P.; Redweik, P.; Catita, C.; and Meireles, C. Augmented reality for support decision on solar radiation harnessing. In Proceedings of the Computação Gráfica e Interação (EPCGI), Covilha, Portuguese, 24–25 November 2016. [Google Scholar]
  35. Heuveline, V.; Ritterbusch, S.; Ronnas, S. Augmented reality for urban simulation visualization. In Proceedings of the first international conference on advanced commnunications and computation, Barcelona, Spain, 23–28 October 2011. [Google Scholar]
  36. Ritterbusch, S.; Ronnås, S.; Waltschläger, I.; Heuveline, V. Augmented reality visualization of numerical simulations in urban environments. Int. J. Adv. Syst. Meas. 2013, 6, 26–39. [Google Scholar]
  37. Broll, W.; Lindt, I.; Ohlenburg, J.; Wittkämper, M.; Yuan, C.; Novotny, T.; Strothman, A. Arthur: A collaborative augmented environment for architectural design and urban planning. J. Virtual Real. Broadcast. 2004, 1, 1–10. [Google Scholar]
  38. Fukuda, T.; Mori, K.; Imaizumi, J. Integration of CFD, VR, AR and BIM for design feedback in a design process-an experimental study. In Proceedings of the 33rd International Conference on Education and Research in Computer Aided Architectural Design Europe (eCAADe33), Oulu, Finland, 22–26 August 2015. [Google Scholar]
  39. Yabuki, N.; Furubayashi, S.; Hamada, Y.; Fukuda, T. Collaborative visualization of environmental simulation result and sensing data using augmented reality. In Proceedings of the International Conference on Cooperative Design, Visualization and Engineering, Osaka, Japan, 2–5 September 2012. [Google Scholar]
  40. Bernasconi, A.; Kharshiduzzaman, M.; Anodio, L.F.; Bordegoni, M.; Re, G.M.; Braghin, F.; Comolli, L. Development of a monitoring system for crack growth in bonded single-lap joints based on the strain field and visualization by augmented reality. J. Adhes. 2014, 90, 496–510. [Google Scholar] [CrossRef]
  41. Huang, J.M.; Ong, S.K.; Nee, A.Y.C. Real-time finite element structural analysis in augmented reality. Adv. Eng. Softw. 2015, 87, 43–56. [Google Scholar] [CrossRef]
  42. Huang, J.M.; Ong, S.K.; Nee, A.Y.C. Visualization and interaction of finite element analysis in augmented reality. Comput. Aided Des. 2017, 84, 1–14. [Google Scholar] [CrossRef]
  43. Paulus, C.J.; Haouchine, N.; Cazier, D.; Cotin, S. Augmented reality during cutting and tearing of deformable objects. In Proceedings of the 2015 IEEE International Symposium on Mixed and Augmented Reality (ISMAR), Fukuoka, Japan, 29 September–3 October 2015. [Google Scholar]
  44. Fiorentino, M.; Monno, G.; Uva, A. Interactive “touch and see” FEM Simulation using Augmented Reality. Int. J. Eng. Educ. 2009, 25, 1124–1128. [Google Scholar]
  45. Fiorentino, M.; Monno, G.; Uva, A. Tangible Interfaces for Augmented Engineering Data Management. Available online: https://www.intechopen.com/books/augmented-reality/tangible-interfaces-for-augmented-engineering-data-management/ (accessed on 1 January 2010).
  46. Niebling, F.; Griesser, R.; Woessner, U. Using Augmented Reality and Interactive Simulations to Realize Hybrid Prototypes. Available online: https://www.researchgate.net/profile/Uwe_Woessner/publication/220844660_Using_Augmented_Reality_and_Interactive_Simulations_to_Realize_Hybrid_Prototypes/links/0c96052a9c0905da4e000000.pdf (accessed on 18 July 2017).
  47. Uva, A.E.; Cristiano, S.; Fiorentino, M.; Monno, G. Distributed design review using tangible augmented technical drawings. Comput. Aided Des. 2010, 42, 364–372. [Google Scholar] [CrossRef]
  48. Uva, A.E.; Fiorentino, M.; Monno, G. Augmented reality integration in product development. In Proceedings of the International conference on Innovative Methods in Product Design (IMProVe 2011), Venice, Italy, 15–17 June 2011. [Google Scholar]
  49. Valentini, P.P.; Pezzuti, E. Design and interactive simulation of cross-axis compliant pivot using dynamic splines. Int. J. Interact. Des. Manuf. 2013, 7, 261–269. [Google Scholar] [CrossRef]
  50. Valentini, P.P.; Pezzuti, E. Dynamic splines for interactive simulation of elastic beams in augmented reality. In Proceedings of the IMPROVE 2011 International Congress, Venice, Italy, 15–17 June 2011. [Google Scholar]
  51. Ibáñez, M.B.; Di Serio, Á.; Villarán, D.; Kloos, C.D. Experimenting with electromagnetism using augmented reality: Impact on flow student experience and educational effectiveness. Comput. Educ. 2014, 71, 1–13. [Google Scholar] [CrossRef] [Green Version]
  52. Mannuß, F.; Rubel, J.; Wagner, C.; Bingel, F.; Hinkenjann, A. Augmenting magnetic field lines for school experiments. In Proceedings of the 2011 10th IEEE International Symposium on Mixed and Augmented Reality (ISMAR), Basel, Switzerland, 26–29 October 2011. [Google Scholar]
  53. Matsutomo, S.; Mitsufuji, K.; Hiasa, Y.; Noguchi, S. Real time simulation method of magnetic field for visualization system with augmented reality technology. IEEE Trans. Magn. 2013, 49, 1665–1668. [Google Scholar] [CrossRef]
  54. Matsutomo, S.; Miyauchi, T.; Noguchi, S.; Yamashita, H. Real-time visualization system of magnetic field utilizing augmented reality technology for education. IEEE Trans. Magn. 2012, 48, 531–534. [Google Scholar] [CrossRef]
  55. Liao, H.; Inomata, T.; Sakuma, I.; Dohi, T. Three-dimensional augmented reality for MRI-guided surgery using integral videography auto stereoscopic-image overlay. IEEE Tran Biomed. Eng. 2010, 57, 1476–1486. [Google Scholar] [CrossRef] [PubMed]
  56. Haouchine, N.; Dequidt, J.; Berger, M.O.; Cotin, S. Single view augmentation of 3D elastic objects. In Proceedings of the IEEE International Symposium on Mixed and Augmented Reality (ISMAR), Munich, Germany, 10–12 September 2014. [Google Scholar]
  57. Haouchine, N.; Dequidt, J.; Kerrien, E.; Berger, M.O.; Cotin, S. Physics-based augmented reality for 3D deformable object. In Proceedings of the Eurographics Workshop on Virtual Reality Interaction and Physical Simulation, Darmstadt, Germany, 6–7 December 2012. [Google Scholar]
  58. Haouchine, N.; Dequidt, J.; Peterlik, I.; Kerrien, E.; Berger, M.O.; Cotin, S. Image-guided simulation of heterogeneous tissue deformation for augmented reality during hepatic surgery. In Proceedings of the IEEE International Symposium on Mixed and Augmented Reality (ISMAR), Adelaide, Australia, 1–4 October 2013. [Google Scholar]
  59. Kong, S.H.; Haouchine, N.; Soares, R.; Klymchenko, A.; Andreiuk, B.; Marques, B.; Marescaux, J. Robust augmented reality registration method for localization of solid organs' tumors using CT-derived virtual biomechanical model and fluorescent fiducials. Surg. Endosc. 2017, 31, 2863–2871. [Google Scholar] [CrossRef] [PubMed]
  60. Tawara, T.; Ono, K. A framework for volume segmentation and visualization using Augmented Reality. In Proceedings of the 2010 IEEE Symposium on 3D User Interface (3DUI), Westin Waltham-Boston Waltham, MA, USA, 20–21 March 2010. [Google Scholar]
  61. Kaladji, A.; Dumenil, A.; Castro, M.; Cardon, A.; Becquemin, J.P.; Bou-Saïd, B.; Haigron, P. Prediction of deformations during endovascular aortic aneurysm repair using finite element simulation. Comput. Med. Imaging Graph. 2013, 37, 142–149. [Google Scholar] [CrossRef] [PubMed] [Green Version]
  62. Ha, H.G.; Hong, J. Augmented Reality in Medicine. Hanyang Med. Rev. 2016, 36, 242–247. [Google Scholar] [CrossRef]
  63. Clothier, M.; Bailey, M. Augmented reality visualization tool for kings stormwater bridge. In Proceedings of the IASTED International Conference on Visualization, Imaging and Image Processing, Marballa, Spain, 6–8 September 2004. [Google Scholar]
  64. Underkoffler, J.; Ullmer, B.; Ishii, H. Emancipated pixels: Real-world graphics in the luminous room. In Proceedings of the 26th annual conference on Computer graphics and interactive techniques, Los Angeles, CA, USA, 8–13 August 1999. [Google Scholar]
  65. Lakaemper, R.; Malkawi, A.M. Integrating robot mapping and augmented building simulation. J. Comput. Civil. Eng. 2009, 23, 384–390. [Google Scholar] [CrossRef]
  66. Malkawi, A.M.; Srinivasan, R.S. A new paradigm for Human-Building Interaction: the use of CFD and Augmented Reality. Autom. Constr. 2005, 14, 71–84. [Google Scholar] [CrossRef]
  67. Golparvar-Fard, M.; Ham, Y. Automated diagnostics and visualization of potential energy performance problems in existing buildings using energy performance augmented reality models. J. Comput. Civil. Eng. 2013, 28, 17–29. [Google Scholar] [CrossRef]
  68. Ham, Y.; Golparvar-Fard, M. EPAR: Energy Performance Augmented Reality models for identification of building energy performance deviations between actual measurements and simulation results. Energy Build. 2013, 63, 15–28. [Google Scholar] [CrossRef]
  69. Graf, H.; Santos, P.; Stork, A. Augmented reality framework supporting conceptual urban planning and enhancing the awareness for environmental impact. In Proceedings of the 2010 Spring Simulation Multiconference, Orlando, FL, USA, 11–15 April 2010. [Google Scholar]
  70. Weidlich, D.; Scherer, S.; Wabner, M. Analyses using VR/AR visualization. IEEE Comput. Graph. Appl 2008, 28, 84–86. [Google Scholar] [CrossRef] [PubMed]
  71. Issartel, P.; Guéniat, F.; Ammi, M. Slicing techniques for handheld augmented reality. In Proceedings of the 2014 IEEE Symposium on 3D User Interfaces (3DUI), Minneapolis, MI, USA, 29–30 March 2014. [Google Scholar]
  72. Naets, F.; Cosco, F.; Desmet, W. Improved human-computer interaction for mechanical systems design through augmented strain/stress visualisation. Int. J. Intell. Eng. Inform. 2017, 5, 50–66. [Google Scholar] [CrossRef]
  73. Moreland, J.; Wang, J.; Liu, Y.; Li, F.; Shen, L.; Wu, B.; Zhou, C. Integration of Augmented Reality with Computational Fluid Dynamics for Power Plant Training. In Proceedings of the International Conference on Modeling, Simulation and Visualization Methods, Las Vegas, NE, USA, 22–25 July 2013. [Google Scholar]
  74. Regenbrecht, H.; Baratoff, G.; Wilke, W. Augmented reality projects in the automotive and aerospace industries. IEEE Comput. Graph. Appl. 2005, 25, 48–56. [Google Scholar] [CrossRef] [PubMed]
  75. Weidenhausen, J.; Knoepfle, C.; Stricker, D. Lessons learned on the way to industrial augmented reality applications, a retrospective on ARVIKA. Comput. Graph. 2003, 27, 887–891. [Google Scholar] [CrossRef]
  76. Buchau, A.; Rucker, W.M.; Wössner, U.; Becker, M. Augmented reality in teaching of electrodynamics. Int. J. Comput. Math. Electr. Electron. Eng. 2009, 28, 948–963. [Google Scholar] [CrossRef]
  77. Silva, R.L.; Rodrigues, P.S.; Oliveira, J.C.; Giraldi, G. Augmented Reality for Scientific Visualization: Bringing DataSets inside the RealWorld. In Proceedings of the Summer Computer Simulation Conference (SCSC 2004), Montreal, Québec, Canada, 20–24 July 2004. [Google Scholar]
  78. Engelke, T.; Keil, J.; Rojtberg, P.; Wientapper, F.; Schmitt, M.; Bockholt, U. Content first: A concept for industrial augmented reality maintenance applications using mobile devices. In Proceedings of the 6th ACM Multimedia Systems Conference, Portland, United States, 18–20 March 2015. [Google Scholar]
  79. Lowe, D.G. Distinctive image features from scale-invariant keypoints. Int. J. Comput. Vis. 2004, 60, 91–110. [Google Scholar] [CrossRef]
  80. Shi, J. Good features to track. In Proceedings of the IEEE Computer Society Conference on Computer Vision and Pattern Recognition, 1994 (CVPR’94), Seattle, WA, USA, 21–23 June 1994. [Google Scholar]
  81. Gauglitz, S.; Höllerer, T.; and Turk, M. Evaluation of interest point detectors and feature descriptors for visual tracking. Int. J. Comput. Vision 2011, 94, 335–360. [Google Scholar] [CrossRef]
  82. Mikolajczyk, K.; Schmid, C. Scale affine invariant interest point detectors. Int. J. Comput. Vision 2004, 60, 63–86. [Google Scholar] [CrossRef]
  83. Mikolajczyk, K.; Schmid, C. A performance evaluation of local descriptors. IEEE Trans Pattern Anal. Mach. Intell. 2005, 27, 1615–1630. [Google Scholar] [CrossRef] [PubMed]
  84. Moreels, P.; and Perona, P. Evaluation of features detectors and descriptors based on 3D objects. Int. J. Comput. Vision 2007, 73, 263–284. [Google Scholar] [CrossRef]
  85. Koch, R.; Evers-Senne, J.F.; Schiller, I.; Wuest, H.; and Stricker, D. Architecture and tracking algorithms for a distributed mobile industrial AR system. In Proceedings of the 5th International Conference on Computer Vision Systems (ICVS07), Bielefeld University, Germany, 21–24 March 2007. [Google Scholar]
  86. Ufkes, A.; Fiala, M. A markerless augmented reality system for mobile devices. In Proceedings of the International Conference on Computer and Robot Vision (CRV2013), Regina, Saskatchewan, Canada, 17–19 May 2013. [Google Scholar]
  87. Yu, L.; Li, W.K.; Ong, S.K.; Nee, A.Y.C. Enhanced Planar Pattern Tracking for an Outdoor Augmented Reality System. Int. J. Comput. Electr. Autom. Control Inf. Eng. 2017, 11, 125–136. [Google Scholar]
  88. Yu, L.; Ong, S.K.; and Nee, A.Y.C. A tracking solution for mobile augmented reality based on sensor-aided marker-less tracking and panoramic mapping. Multimed. Tools Appl. 2016, 75, 3199–3220. [Google Scholar] [CrossRef]
  89. Gammeter, S.; Gassmann, A.; Bossard, L.; Quack, T.; and Van Gool, L. Server-side object recognition and client-side object tracking for mobile augmented reality. In Proceedings of the IEEE Computer Society Conference on Computer Vision and Pattern Recognition Workshops (CVPRW2010), San Francisco, CA, USA, 13–18 June 2010. [Google Scholar]
  90. Ha, J.; Cho, K.; Rojas, F.A.; Yang, H.S. Real-time scalable recognition and tracking based on the server-client model for mobile augmented reality. In Proceedings of the IEEE International Symposium on VR Innovation (ISVRI2011), Singapore, 19–20 March 2011. [Google Scholar]
  91. Jung, J.; Ha, J.; Lee, S.W.; Rojas, F.A.; and Yang, H.S. Efficient mobile AR technology using scalable recognition and tracking based on server-client model. Comput. Graph. 2012, 36, 131–139. [Google Scholar] [CrossRef]
  92. Mulloni, A.; Grubert, J.; Seichter, H.; Langlotz, T.; Grasset, R.; Reitmayr, G.; Schmalstieg, D. Experiences with the impact of tracking technology in mobile augmented reality evaluations. In Proceedings of the MobileHCI 2012 Workshop MobiVis, San Francisco, CA, USA, 21–24 September 2012. [Google Scholar]
  93. Helfrich-Schkarbanenko, A.; Heuveline, V.; Reiner, R.; Ritterbusch, S. Bandwidth-efficient parallel visualization for mobile devices. In Proceedings of the 2nd International Conference on Advanced Communications and Computation, Venice, Italy, 21–26 October 2012. [Google Scholar]
  94. Moser, M.; Weiskopf, D. Interactive volume rendering on mobile devices. Vision Model. Vis. 2008, 8, 217–226. [Google Scholar]
  95. Anzt, H.; Augustin, W.; Baumann, M.; Bockelmann, H.; Gengenbach, T.; Hahn, T.; Ritterbusch, S. Hiflow3--A Flexible and Hardware-Aware Parallel Finite Element Package. Available online: https://journals.ub.uni-heidelberg.de/index.php/emcl-pp/article/view/11675 (accessed on 18 July 2017).
  96. Schroeder, W.J.; Lorensen, B.; Martin, K. The Visualization Toolkit: An Object-Oriented Approach to 3D Graphics, 4th ed.; Kitware: New York, NY, USA, 2006. [Google Scholar]
  97. Bruno, F.; Caruso, F.; De Napoli, L.; Muzzupappa, M. Visualization of industrial engineering data visualization of industrial engineering data in augmented reality. J. Vis. 2006, 9, 319–329. [Google Scholar] [CrossRef]
  98. De Pascalis, F. VTK Remote Rendering of 3D Laser Scanner Ply files for Android Mobile Devices. Available online: http://hdl.handle.net/10380/3458 (accessed on 5 May 2014).
  99. Augmented Reality Sandbox. Available online: idav.ucdavis.edu/~okreylos/ResDev/SARandbox (accessed on 14 July 2017).
  100. Lukosch, S.; Billinghurst, M.; Alem, L.; Kiyokawa, K. Collaboration in augmented reality. Comput. Support. Coop. Work 2015, 24, 515–525. [Google Scholar] [CrossRef]
  101. Fuhrmann, A.; Loffelmann, H.; Schmalstieg, D.; Gervautz, M. Collaborative visualization in augmented reality. IEEE Comput. Graph. Appl. 1998, 18, 54–59. [Google Scholar] [CrossRef]
  102. Rekimoto, J. Transvision: A hand-held augmented reality system for collaborative design. In Proceedings of the International Conference on Virtual Systems and Multimedia, Gifu, Japan, 18–20 September 1996. [Google Scholar]
  103. Dong, S.; Behzadan, A.H.; Chen, F.; Kamat, V.R. Collaborative visualization of engineering processes using tabletop augmented reality. Adv. Eng. Softw. 2013, 55, 45–55. [Google Scholar] [CrossRef]
  104. Benko, H.; Wilson, A.D.; Zannier, F. Dyadic projected spatial augmented reality. In Proceedings of the 27th annual ACM symposium on User interface software and technology, Hawaii, United States, 5–8 October 2014. [Google Scholar]
  105. Boulanger, P. Application of augmented reality to industrial tele-training. In Proceedings of the First Canadian Conference on Computer and Robot Vision, London, ON, Canada, 17–19 May 2004. [Google Scholar]
  106. Shen, Y.; Ong, S.K.; Nee, A.Y.C. Product information visualization and augmentation in collaborative design. Comput. Aided Des. 2008, 40, 963–974. [Google Scholar] [CrossRef]
  107. Ong, S.K.; Shen, Y. A mixed reality environment for collaborative product design and development. CIRP Ann. Manuf. Tech. 2009, 58, 139–142. [Google Scholar] [CrossRef]
  108. Gauglitz, S.; Nuernberger, B.; Turk, M.; Höllerer, T. In touch with the remote world: Remote collaboration with augmented reality drawings and virtual navigation. In Proceedings of the 20th ACM Symposium on Virtual Reality Software and Technology, Edinburgh, UK, 11–13 November 2014. [Google Scholar]
  109. Tan, W.; Liu, H.; Dong, Z.; Zhang, G.; Bao, H. Robust monocular SLAM in dynamic environments. In Proceedings of the IEEE International Symposium on Mixed and Augmented Reality (ISMAR2013), Adelaide, Australia, 1–4 October 2013. [Google Scholar]
Figure 1. Workflow of AR-based engineering analysis and simulation system.
Mti 01 00017 g001
Figure 2. Trends of AR papers published with different keywords in ScienceDirect.
Mti 01 00017 g002
Figure 3. The categories of research areas, research purposes, methods, and data types in AR-based engineering analysis and simulation.
Mti 01 00017 g003
Figure 4. Simulation data conversion procedure.
Mti 01 00017 g004
Figure 5. Integration of AR and VTK [41].
Mti 01 00017 g005
Figure 6. Client-server system for engineering analysis and simulation [98].
Mti 01 00017 g006
Table 1. Research area and purpose of AR-based engineering analysis and simulation.
Area of ResearchResearch GroupPurpose of Research
Biomedical engineering & surgeryLiao et al. [55]Assist on-site operation
Haouchine et al. [56,57,58]
Kong et al. [59]
Salah et al. [31]Intuitive analysis environment
Tawara and Ono [60]
Kaladji et al. [61]
Sutherland [32]Training and education
ARMed, [62]
Civil & urban engineeringClothier et al. [63]Assist on-site operation
Underkoffler et al. [64]
Malkawi et al. [65,66]Intuitive analysis environment
Carmo et al. [33,34]
Heuveline et al. [35,36]
Golparvar-Fard et al. [67,68]
Graf et al. [69]Intuitive design environment
Broll et al. [37]
Fukuda et al. [38,39]
Mechanical engineering & ManufacturingWeidlich et al. [70]Intuitive analysis environment
NUS AR group, [27,41,42]
Paulus, et al. [43]
Uva et al. [44,45,47,48]
Issartel et al. [71]
Bernasconi et al. [40]
Valentini et al. [49,50]
Naets et al. [72]
Moreland et al. [73]
Regenbrecht et al. [74]Intuitive design environment
Niebling et al. [46]
Weidenhausen et al. [75]
ElectromagnetismBuchau et al. [76]Training and education
Ibáñez et al. [51]
Silva et al. [77]Intuitive analysis environment
Mannuß et al. [52]
Matsutomo et al. [53,54]
Table 2. Characteristics and limitations of research in biomedical engineering and surgery.
Research GroupVisualization MethodCharacteristicsLimitations
Liao et al. [55]Stereoscopic image overlay Increase accuracy and safety in surgery with image overlay navigationThe visualization equipment lacks contrast in operation lighting condition
Haouchine et al. [56,57,58]Local image overlayReal-time physics-based model for simulation
Include in vivo test on human data during surgery
The scalability of the system is restricted due to currently only liver surgery is supported
Kong et al. [59]Local image overlayAccurate automatic result registration on laparoscopic image
A biomechanical model is included and analyzed with FEM
Use of fluorescent fiducials
The feasibility of widely use of fluorescent fiducials in surgery is restricted
Salah et al. [31]OpenGL + Fast light toolkit (FLTK)User interface for MRI data visualization and analysis
An optimized slicing algorithm is included
Lack of data support from real surgery scenario
Tawara and Ono [60]Stereoscopic image overlayDirect manipulation of human brain CT/MRI volume data using AR
Combined Wiimote and a motion tracking cube to get a tracked manipulation device for a volume data
Lack of support on system scalability
Kaladji et al. [61]Local image overlayThe deformation of the organ can be simulated and visualized on CT imageLack of interaction functions
Sutherland [32]Visualization Toolkit (VTK)Provide a simulation environment for CT volume data visualization
Result update from force feedback
The setup is pre-defined and is not adaptive for other applications
ARMed, [62]Stereoscopic image overlayGood educational system for diagnosis and surgery preparation, education1. Lack of real scene test
2. Only provided an educational environment
Table 3. Characteristics and limitations of research in civil and urban engineering.
Research GroupVisualization MethodCharacteristicsLimitations
Clothier et al. [63]OpenGLSensor implementation for structure simulation1. Sensor data reading and visualization is not robust
2. Desktop based system is not suitable for outdoor use
Underkoffler et al. [64]Local image overlayA scalable design which integrate different digital graphics and simulation result togetherThe simulation module in this system is still in infant stage, only simple results are demonstrated
Malkawi et al. [65,66]Java3DAugment CFD datasets in real-time based on speech and gesture recognition
Interactive and immersive environment
1. Support only indoor and pre-defined environment
2. Provided hand gesture cause ergonomic issue
Carmo et al. [33,34]OpenGLA mobile platform for visualize and analysis solar radiation in outdoor environment1. The solar energy data input has to be pre-defined
2. Without proper sensing technology, the system can hardly tap the potential of outdoor AR
Heuveline et al. [35,36]Remote image overlayImage based rendering to visualize numerical simulation data
Client-server framework for simulation data visualization
Use VTK, paraview, and HiVision for result visualization on the server
1. The simulation result is pre-defined in the system
2. Difficult to integrate into other applications
Golparvar-Fard et al. [67,68]VR modeling language3D thermal mesh modelling
Automated visualization of deviations between actual and expected building energy
Requires thermal camera and HMD device may cause ergonomic problem
Graf et al. [69]OpenGLVolumetric data preparation and simulation1. Currently serves as a prototype system
2. Lack of real scene test
Broll et al. [37]OpenGLCo-location collaboration method
Focused on design and planning part
1. The utilize of simulation data need to be described
2. The details of co-location collaboration could be further clarified
Fukuda et al. [38,39]OpenGL, VR Markup languageUse CFD data to promote a lean design
Visualization of CFD simulation results in AR
Desktop based system restrict the use of the outdoor AR system
Table 4. Characteristics and limitations of research in mechanical engineering and manufacturing.
Research GroupVisualization MethodCharacteristicsLimitations
Weidlich et al. [70]Remote image overlay
  • Visualize FEA result via client-server architecture
1. FEA results are pre-defined
2. Lack of interaction functions
NUS AR group, [27,41,42]VTK
  • Sensor implementation for near real-time result visualization
  • Interaction method based on VTK
The loading position is pre-defined and the sensor can only be attached at specific position
Paulus, et al. [43]OpenGL
  • Integrate FEM into the system
  • Deformation subject to cutting simulation can be performed in real-time
Pre-defined model is required
Uva et al. [44,45,47,48]Local image overlay
  • Enable near real-time tangible engineering simulation
  • Multiple interaction function included
1. The dataset visualization method is not described in detail
2. The precision of video tracking should be considered
Issartel et al. [71]VTK
  • Mobile volumetric rendering
  • Slicing method use tablet and marker
1. The results are hardcoded in the application
2. The use of stylus and tablet itself cause ergonomic issue
Bernasconi et al. [40]OpenGL
  • Sensor implementation for crack growth simulation
  • A simple Client-Server framework is integrated
Desktop based system restrict the use of the system
Valentini et al. [49,50]OpenGL
  • Real-time accurate dynamics simulation of elastic beams and cross-axis flexural pivot
  • Using stylus to control virtual beams to perform simulations
1. Has limitations for models with complex geometries
2. The deformation of practical structures is usually small, which cannot be measured using regular trackers
3. The user interface could be redesigned to include more functions
Naets et al. [72]Local image overlay
  • Model is reduced to enable efficient evaluation
  • Strain and stress data visualization in AR environment
The setup of using marker based tracking with another optical tracking system may cause difficulties for implementing system into other applications
Moreland et al. [73]Paraview
  • CFD flow data can be visualized efficiently
  • Integrate Paraview for visualization of simulation data
1. The results are pre-defined in the system
2. Difficult to integrate into other applications
Regenbrecht et al. [74]Local image overlay
  • Airplane cabin CFD result visualization with AR
  • Implement AR for help design and development
Only pre-defined results are included for design purpose
Niebling et al. [46]OpenGL
  • Interactive simulation and tangible user interface is supported
  • CFD result is included to help design the turbine prototype
1. The scalability of the system is limited
2. The simulation result is pre-defined
Weidenhausen et al. [75]OpenSG
  • Assist workflows in design, production, and maintenance operations
  • Immediate comparison of real and generated results of a vehicle crash test and augmented results on a crashed vehicle
Simulated result needs to be pre-defined
Table 5. Characteristics and limitations of research in electromagnetism.
Research GroupVisualization MethodCharacteristicsLimitations
Buchau et al. [76]OpenGL3D electromagnetic field in AR
Visualize analyzed result for pre-defined model in education
The interference of other magnetic fields is not included
Ibáñez et al. [51]OpenGLA handheld device based electromagnetic simulation platform1. Lack of interaction function
2. Limited system function may only suitable for education purpose
Silva et al. [77]Local image overlayUse bi-dimensional image to represent 3D scientific dataImage representation may not adaptive to other applications
Mannuß et al. [52]OpenGLInteractive magnetic field simulationThe cumbersome setup requires HMD device and desktop monitor
Matsutomo et al. [53,54]OpenGLMagnetic field visualization on background monitor
Generate flux lines for bar magnets
Real-time magnetic field visualization
1. Requires monitor under the working area
2. Magnetic model is restricted
Table 6. Common characteristics and limitations of current AR-based engineering analysis and simulation systems.
FeaturesLimitations
Robust tracking performance is required for high precision engineering operationsDesigned for one specific scenario with pre-defined model hardcoded.
Efficient visualization tools are implemented for near real-time displayMainly developed on one platform only. The lack of multi-platform support limited the usage of the system.
Accurate registration of computer-generated volumetric data and numerical simulation result on real sceneMost of the system lacks effective and intuitive interaction method. The system was only used for visualizing the results.
Table 7. Tracking methods in selected studies.
Marker-Based TrackingMarker-Less TrackingGPS & Sensor Fusion
[27,32,37,40,41,42,44,45,46,47,48,49,50,51,60,62,70,71,72,74,75,77][31,38,39,43,52,53,54,55,56,57,58,59,61,64,69,73][33,34,35,36,65,66,67,68]
Table 8. Simulation result updating in selected studies.
Pre-Defined[31,33,34,35,36,55,59,60,62,65,66,69,70,73,74]
Dynamic updateManual input[37,49,50,61,67,68]
Image processing[43,44,45,47,48,51,53,54,56,57,58,60,64,68,71,77]
Sensors[27,32,40,41,42,63,72]
Table 9. Platforms of selected studies.
Spatial displayHMDHHD
[27,31,32,38,39,40,41,42,43,46,53,54,55,56,57,58,59,61,63,64,72,73][37,49,50,52,60,62,65,66,67,68,69,70,74,75,76,77][33,34,35,36,44,45,47,48,51,71]

