Climate Warming in the Eastern Mediterranean: A Comparative Analysis of Beirut and Zahlé (Lebanon, 1992–2024)


Abstract
1. Introduction
2. Study Area, Data, and Methods
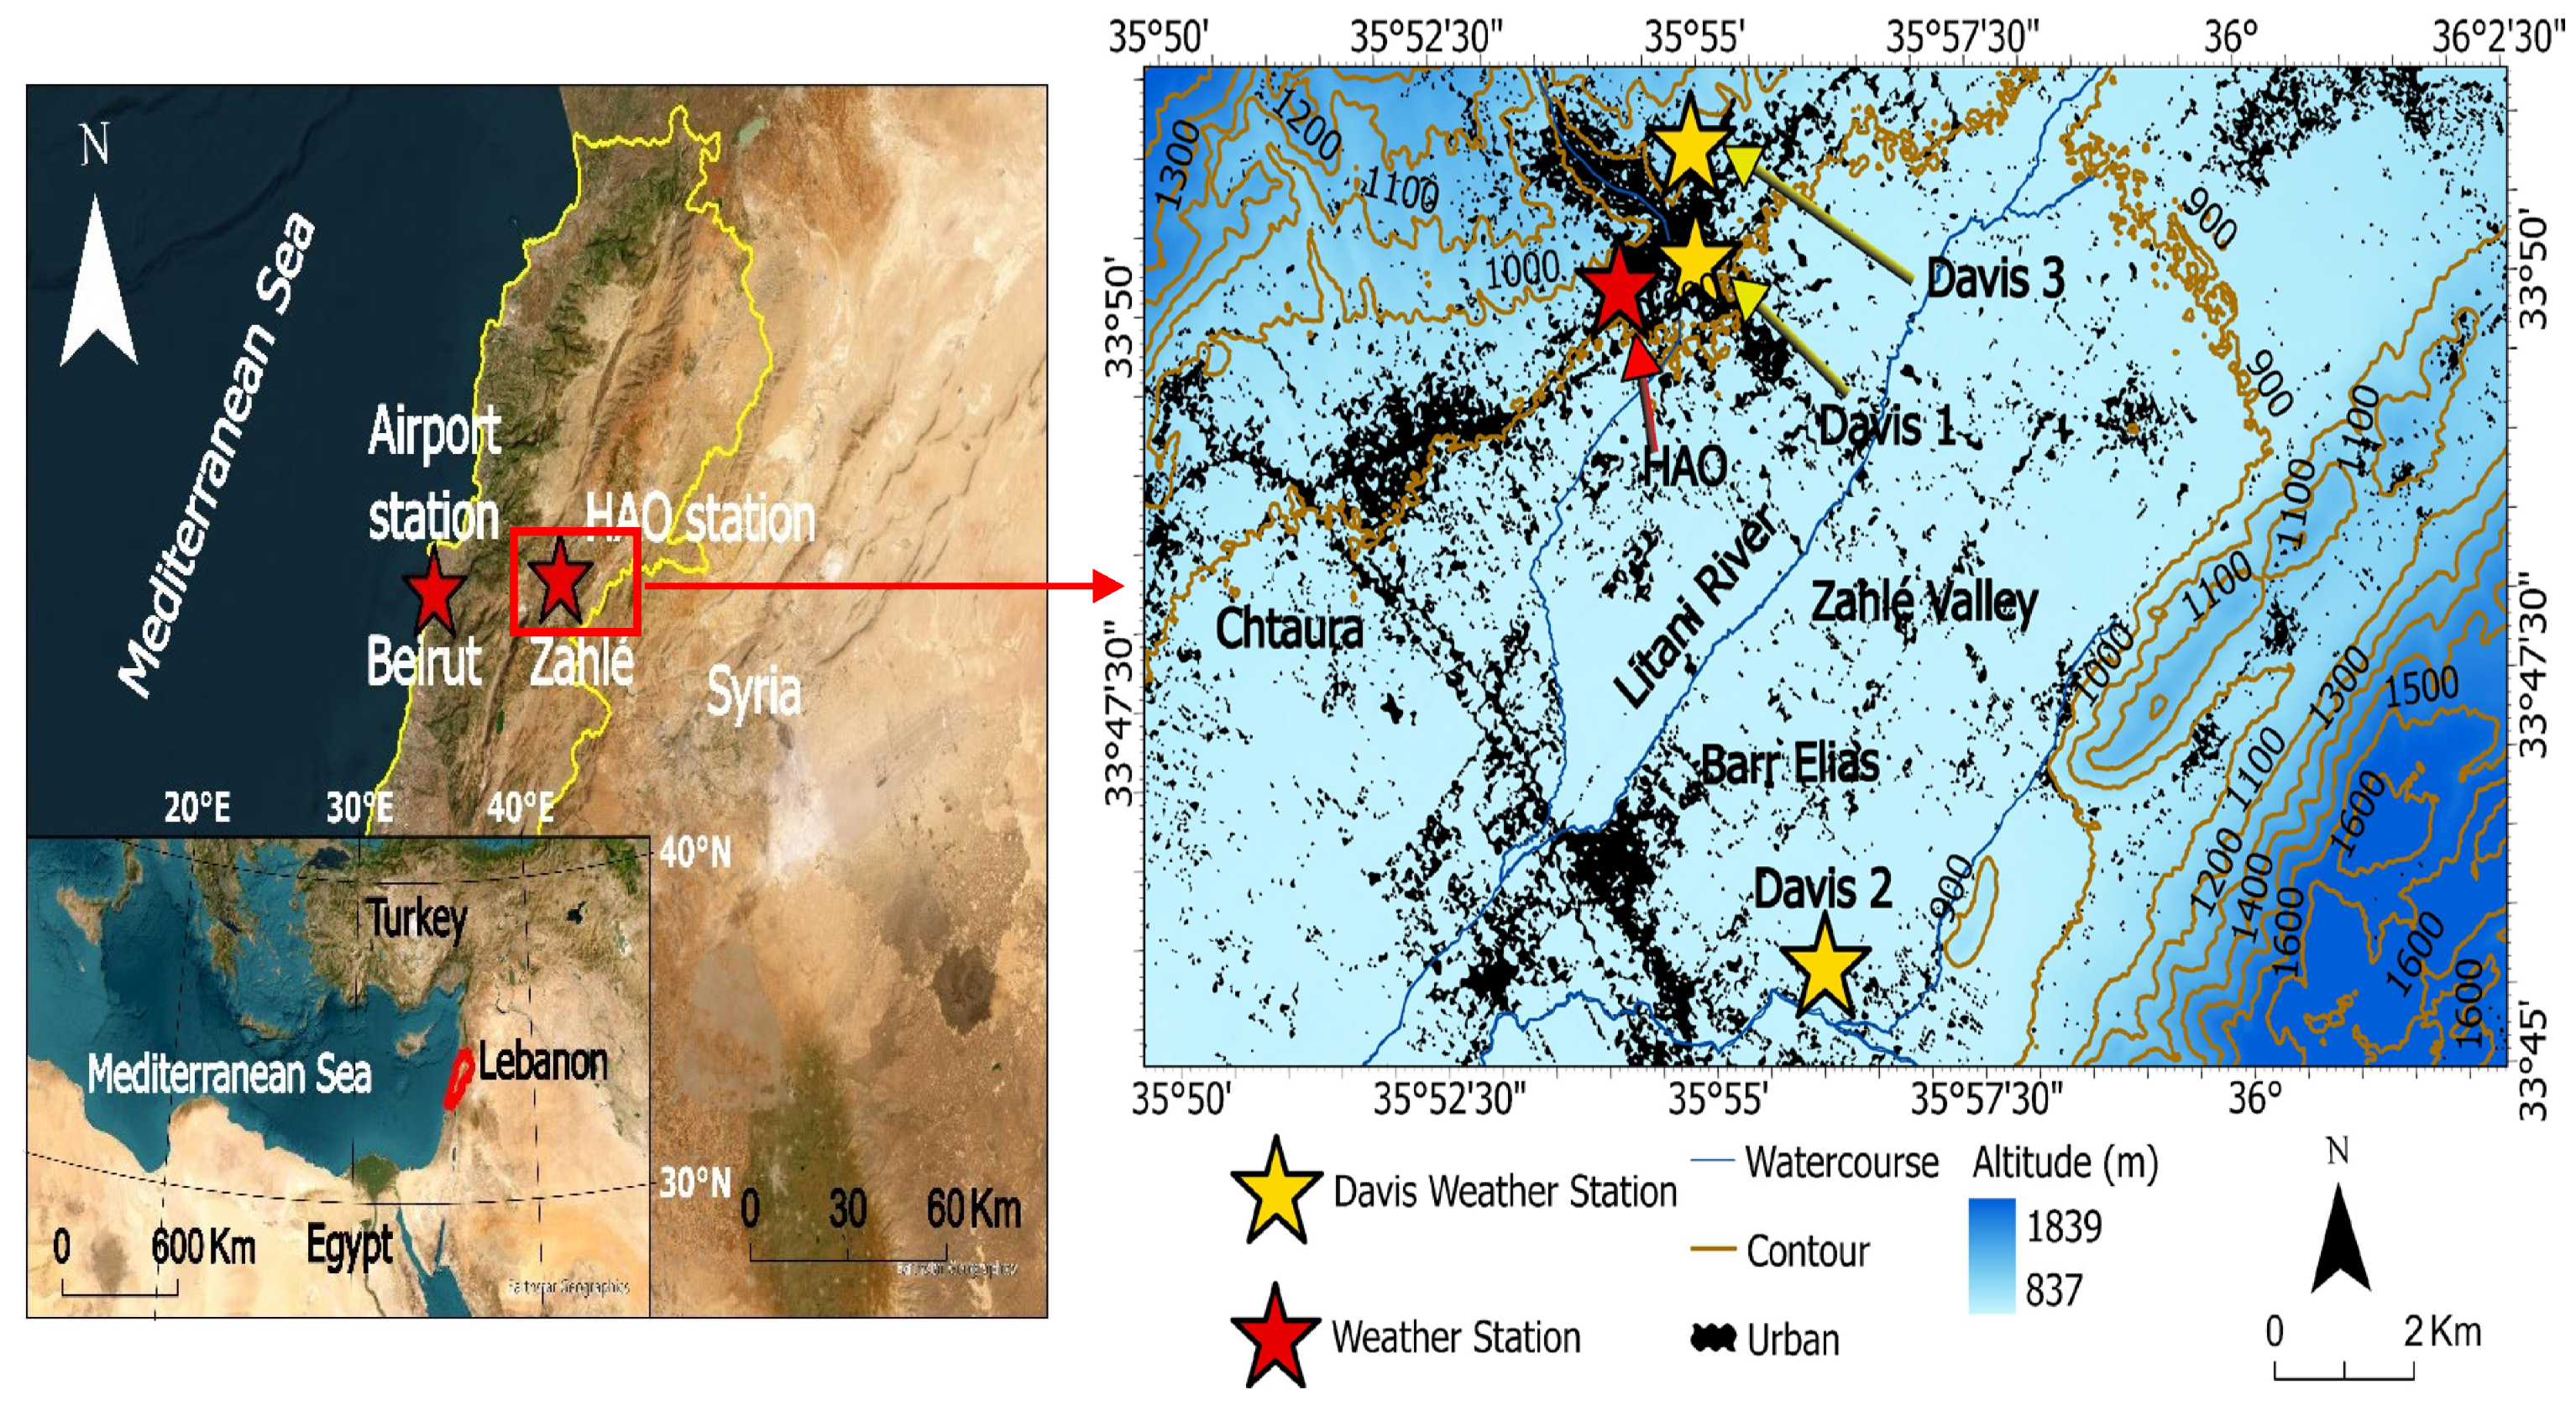
2.1. Study Area
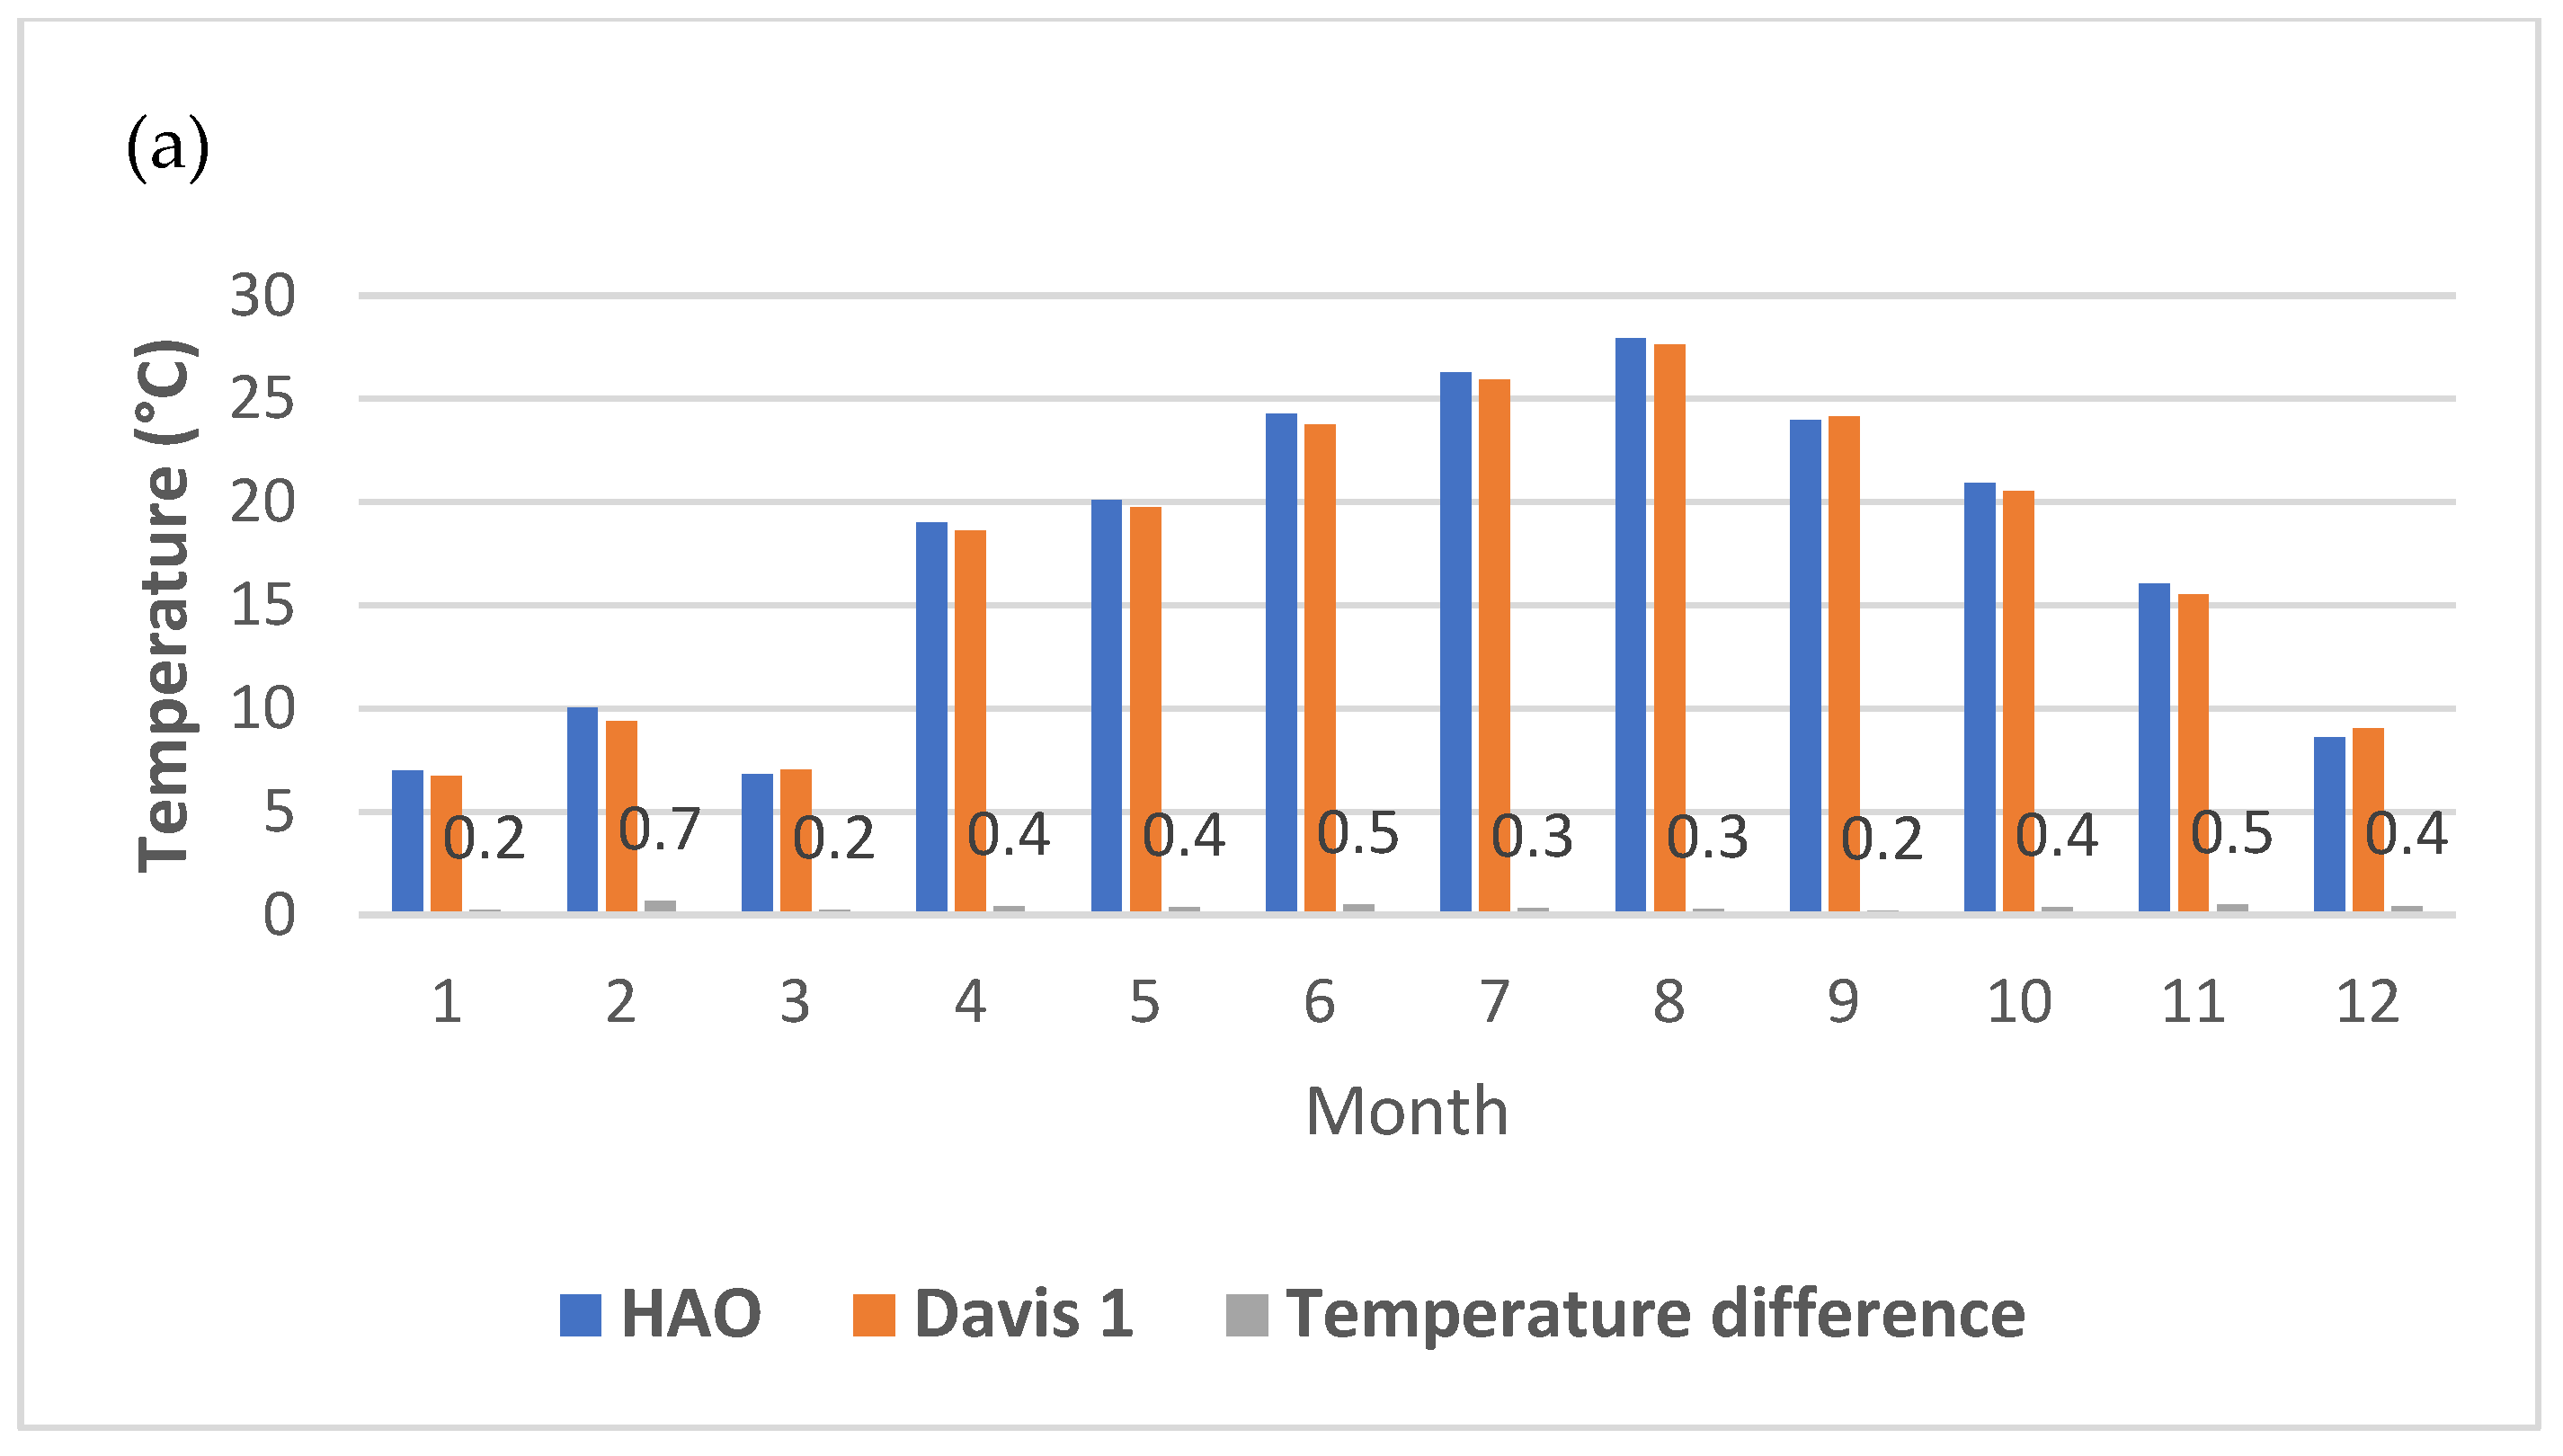
2.2. Meteorological Data from Fixed Weather Stations and Gaps

2.3. Air Temperature Data from Mobile and Vertical Measurements
- The sensor was programmed to record temperature every 2 s.
- It was then mounted on a drone.
- A vertical flight was carried out, with pauses of 10–15 s at every 20 m of altitude. The maximum altitude reached was 500 m.
- During the flight, we manually recorded the time and corresponding altitude (e.g., at 6:30′:42″; the altitude was 100 m) based on the altitude displayed on the drone’s remote control screen.
- For data processing, we retained one representative temperature reading for each 20 m altitude level and discarded the remaining readings.
2.4. Statistical Methods
2.4.1. Descriptive Statistical Analysis
2.4.2. Homogeneity Tests
2.4.3. Trend Tests
- a.
- The trend equation
- b.
- Mann–Kendall
3. Results
3.1. Homogeneity
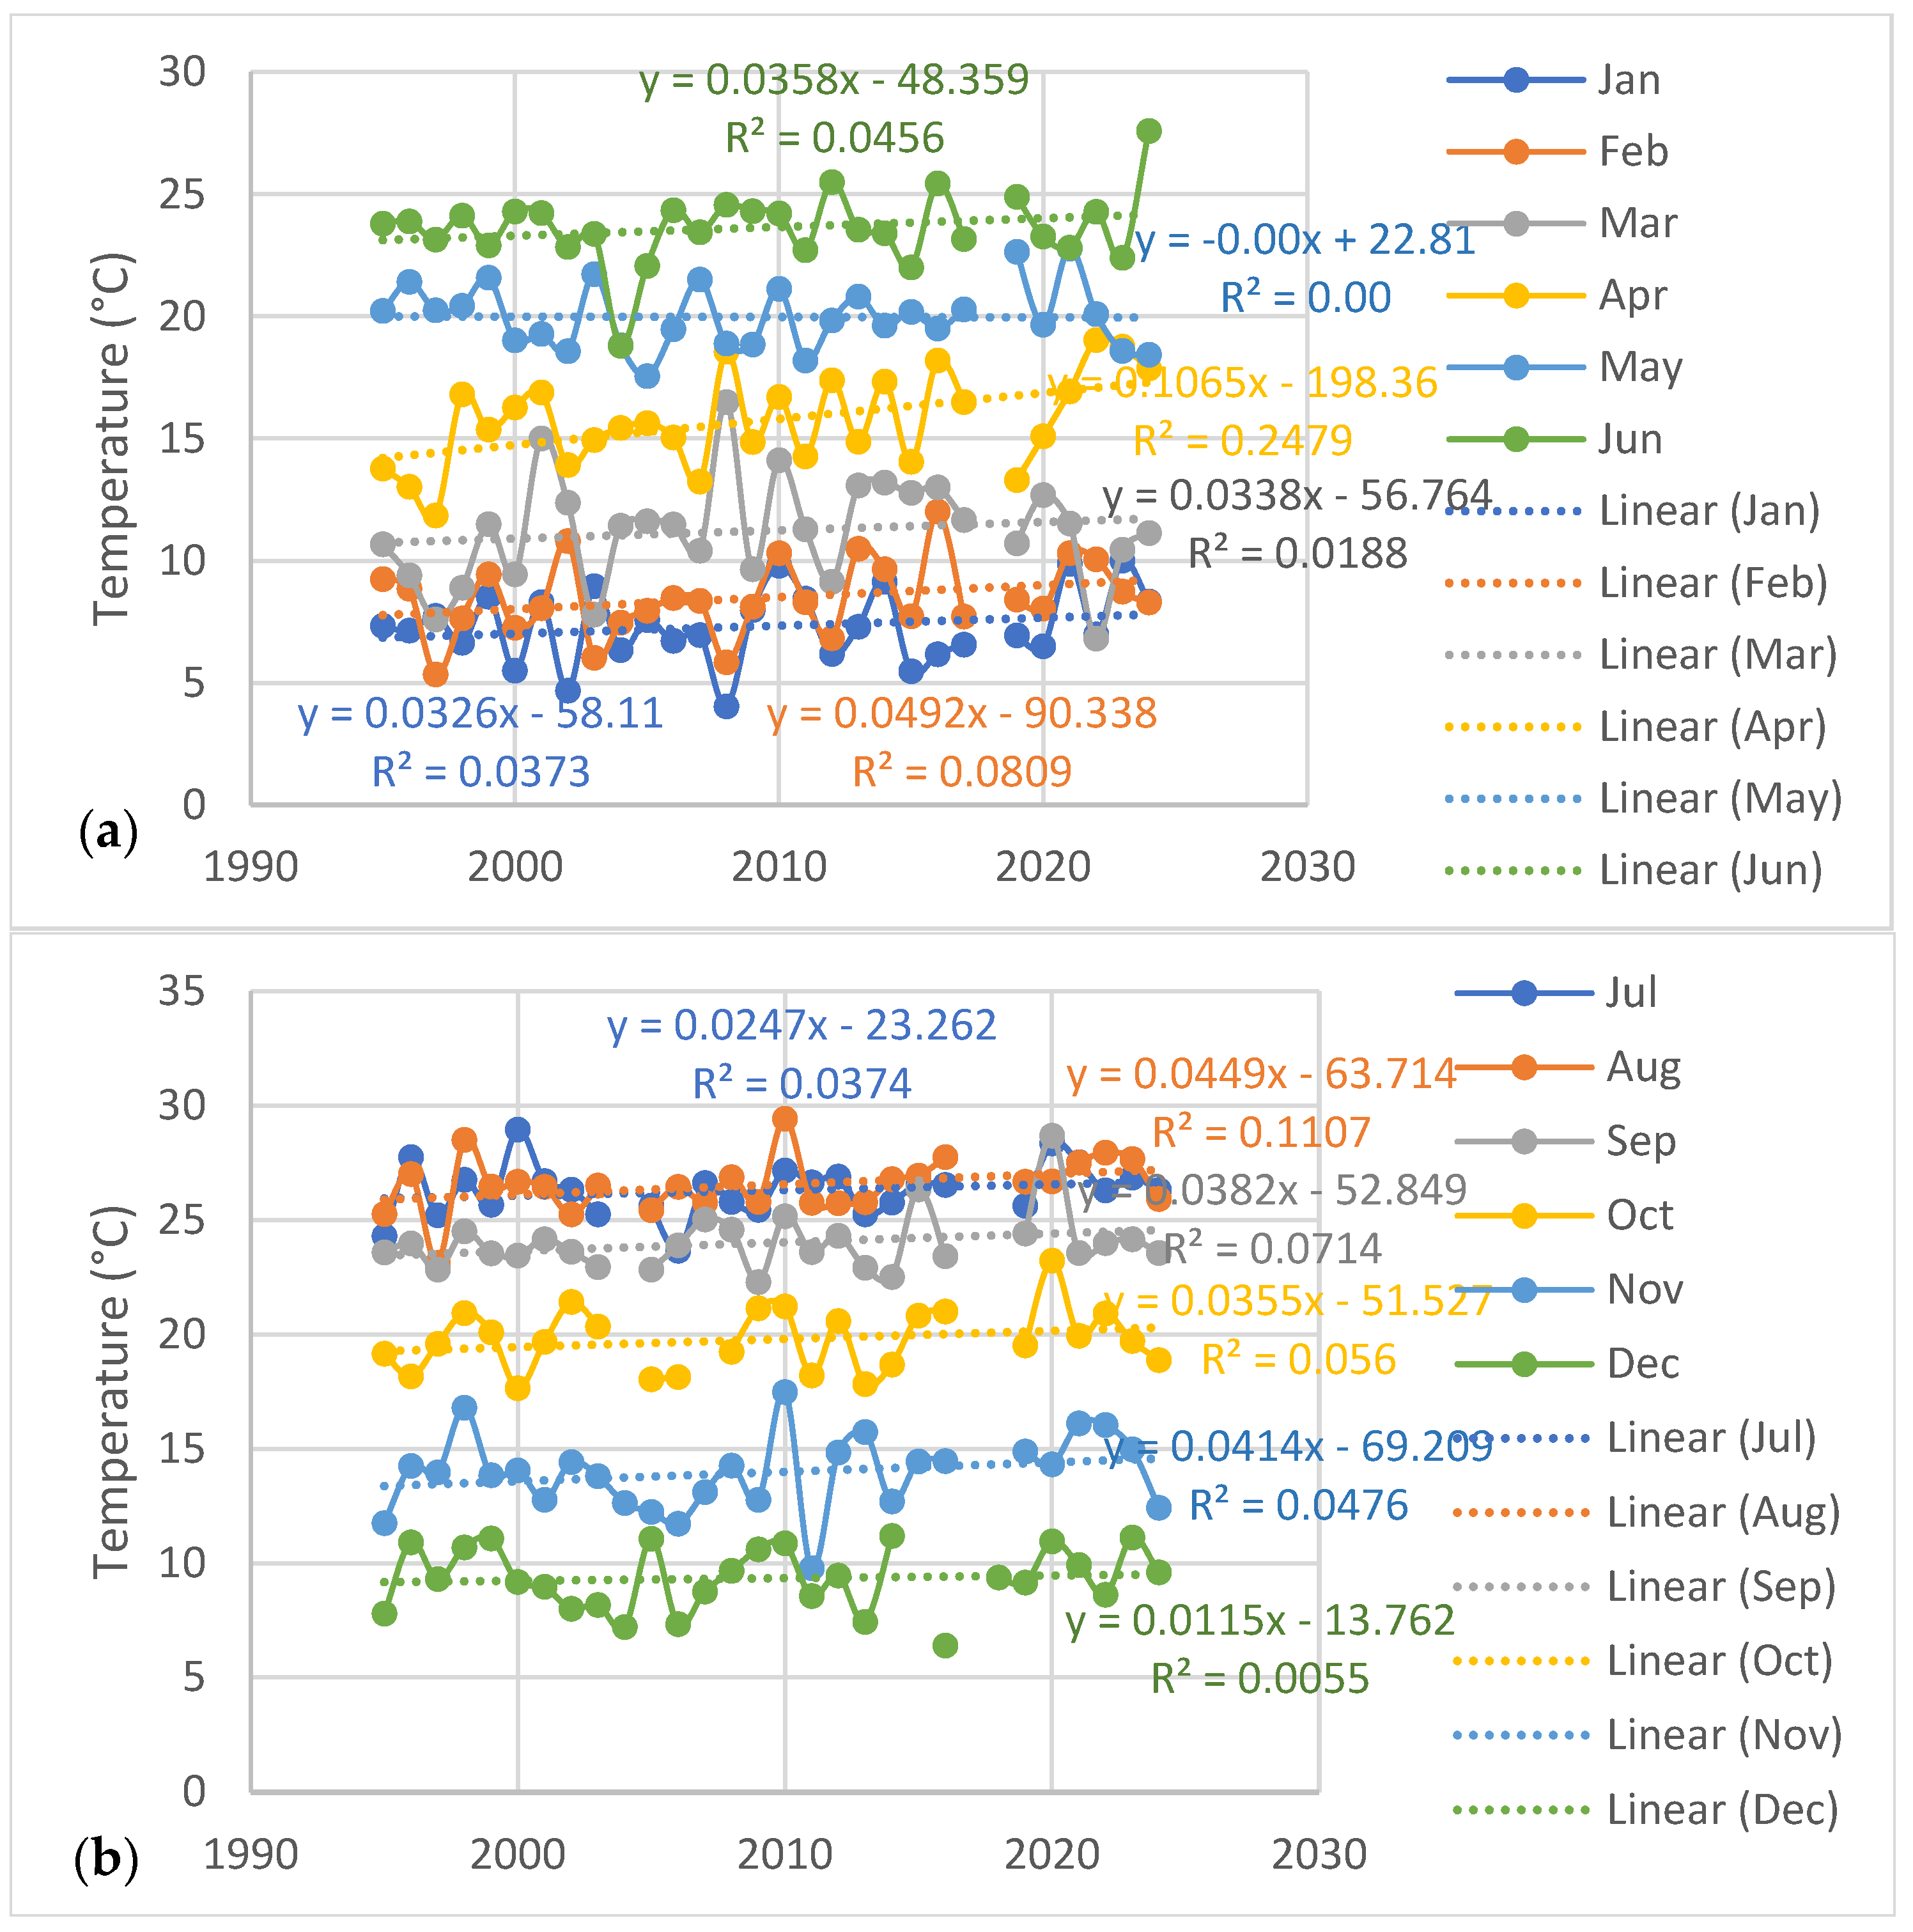
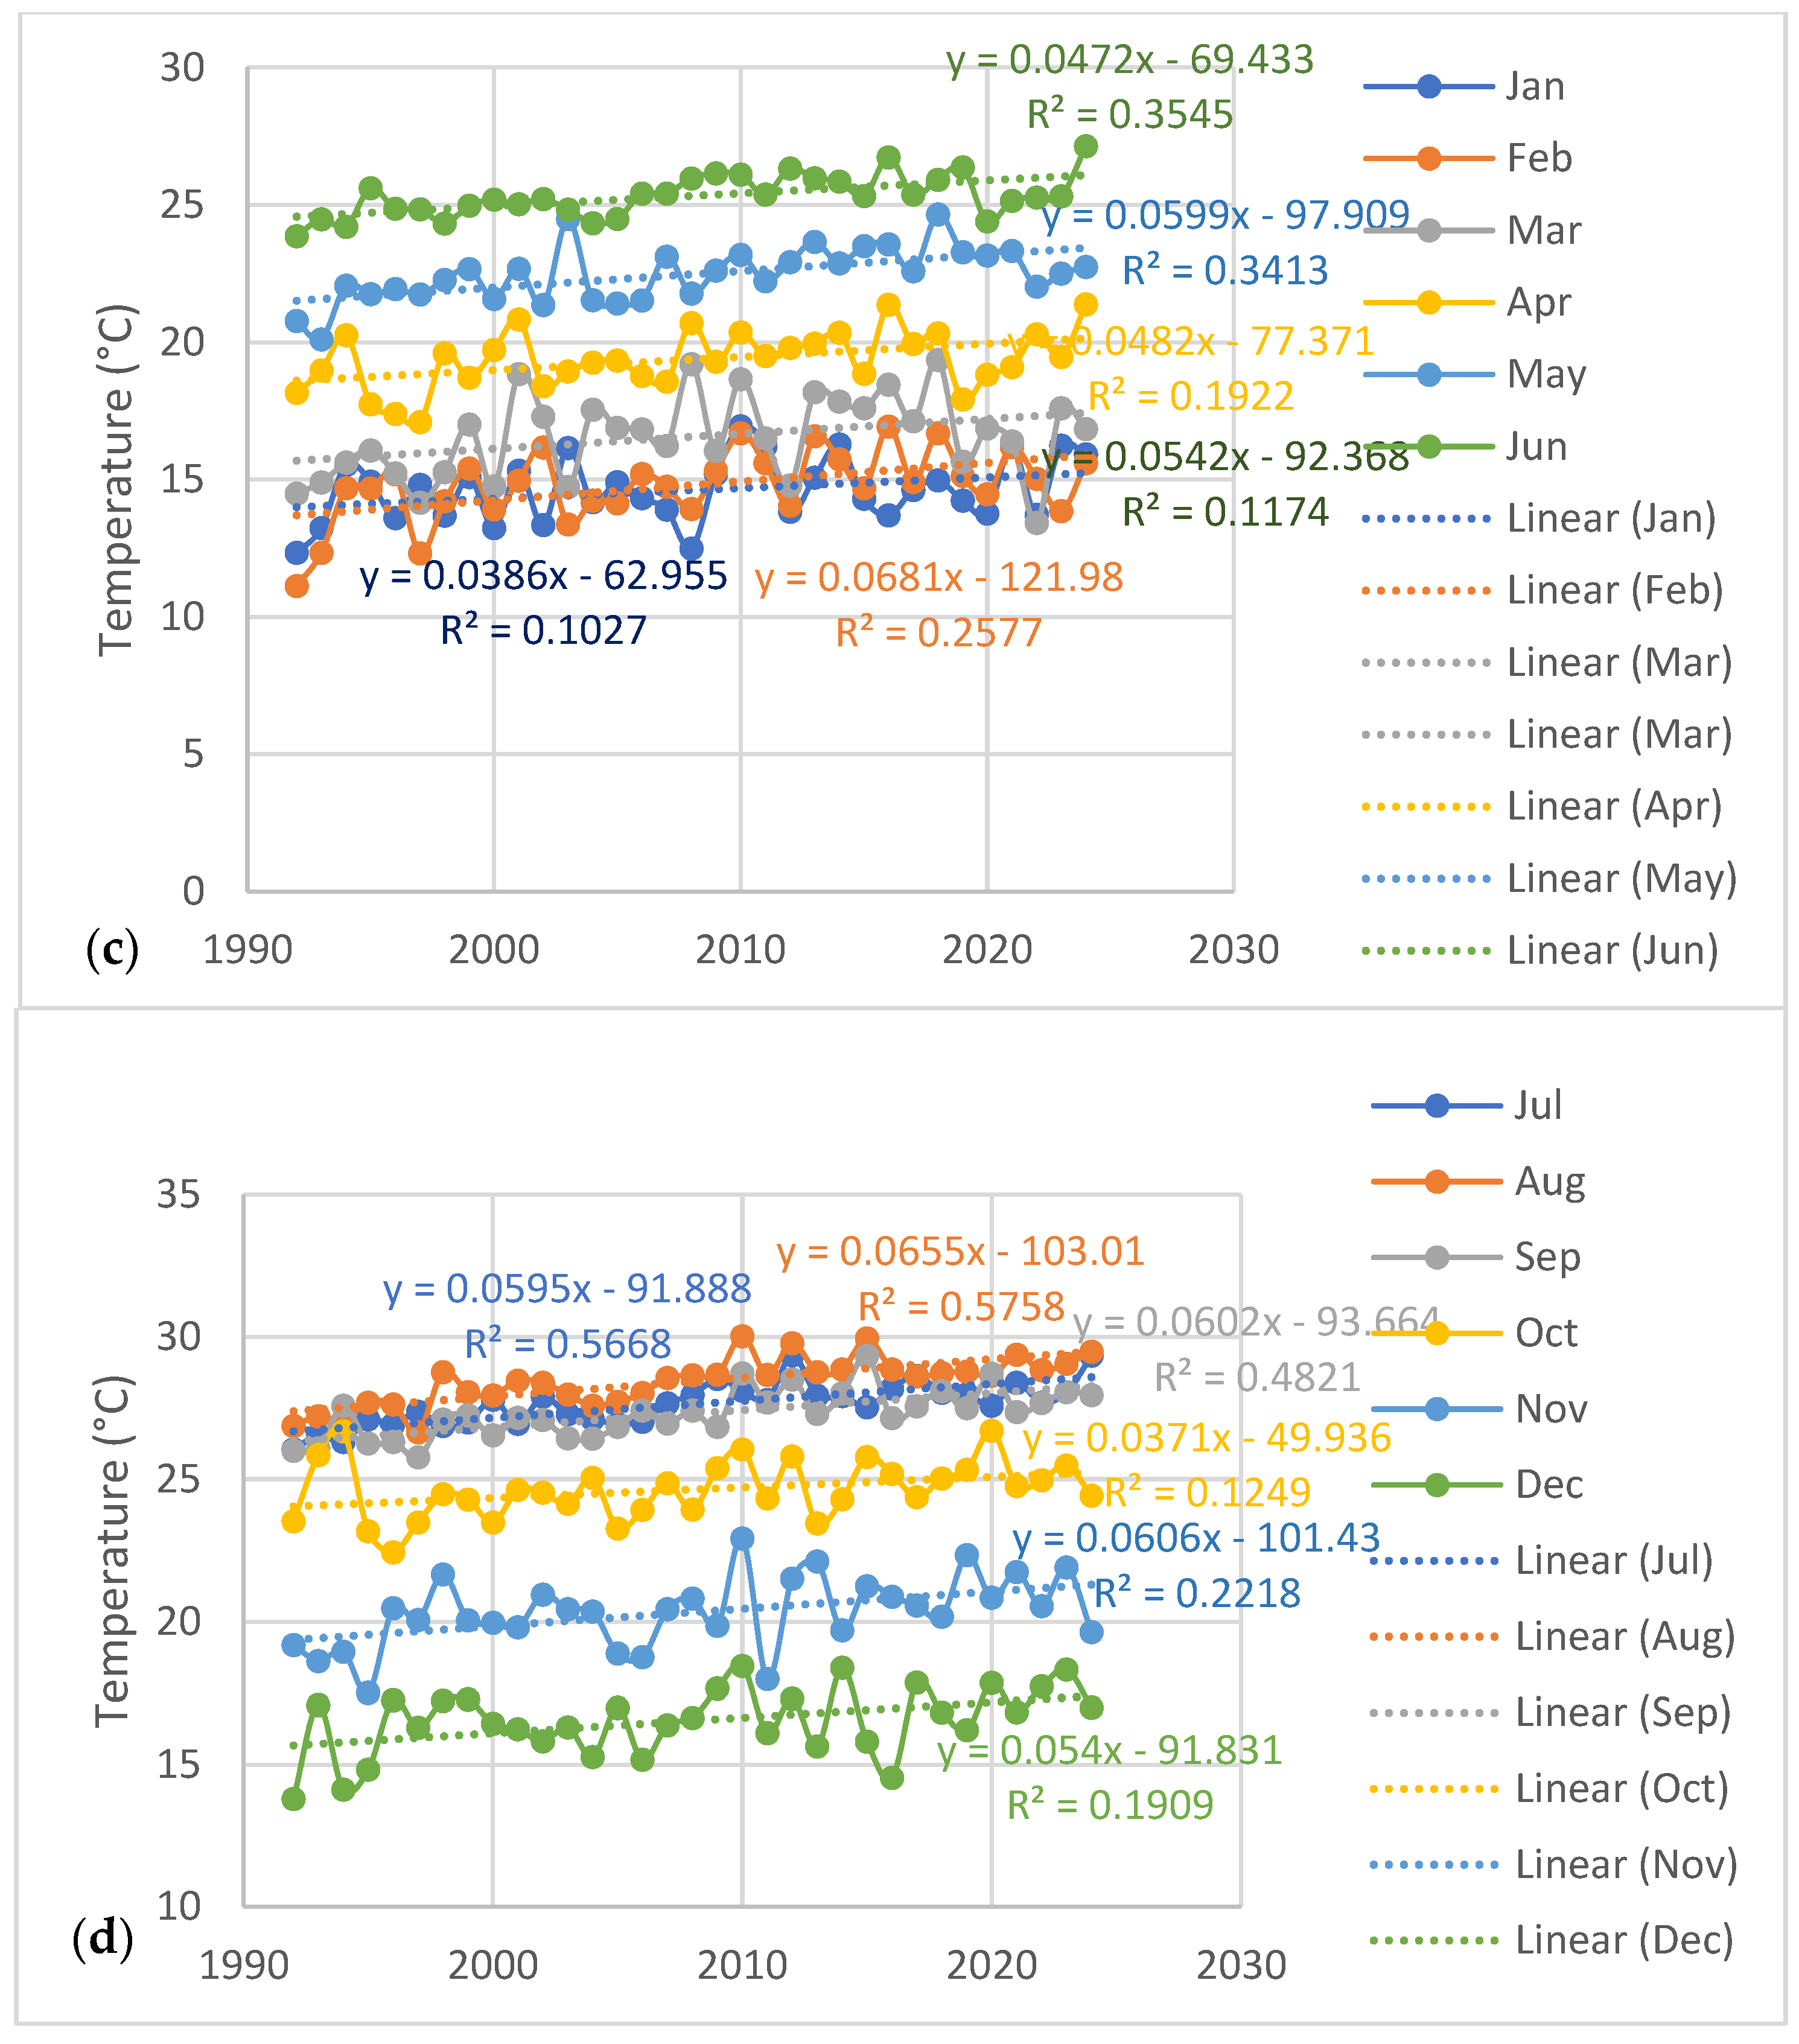
3.2. Trends
3.3. Possible Explanations
3.3.1. Metadata
3.3.2. Large-Scale Circulation
3.3.3. Local Factors
- UHI effect in Beirut
- b.
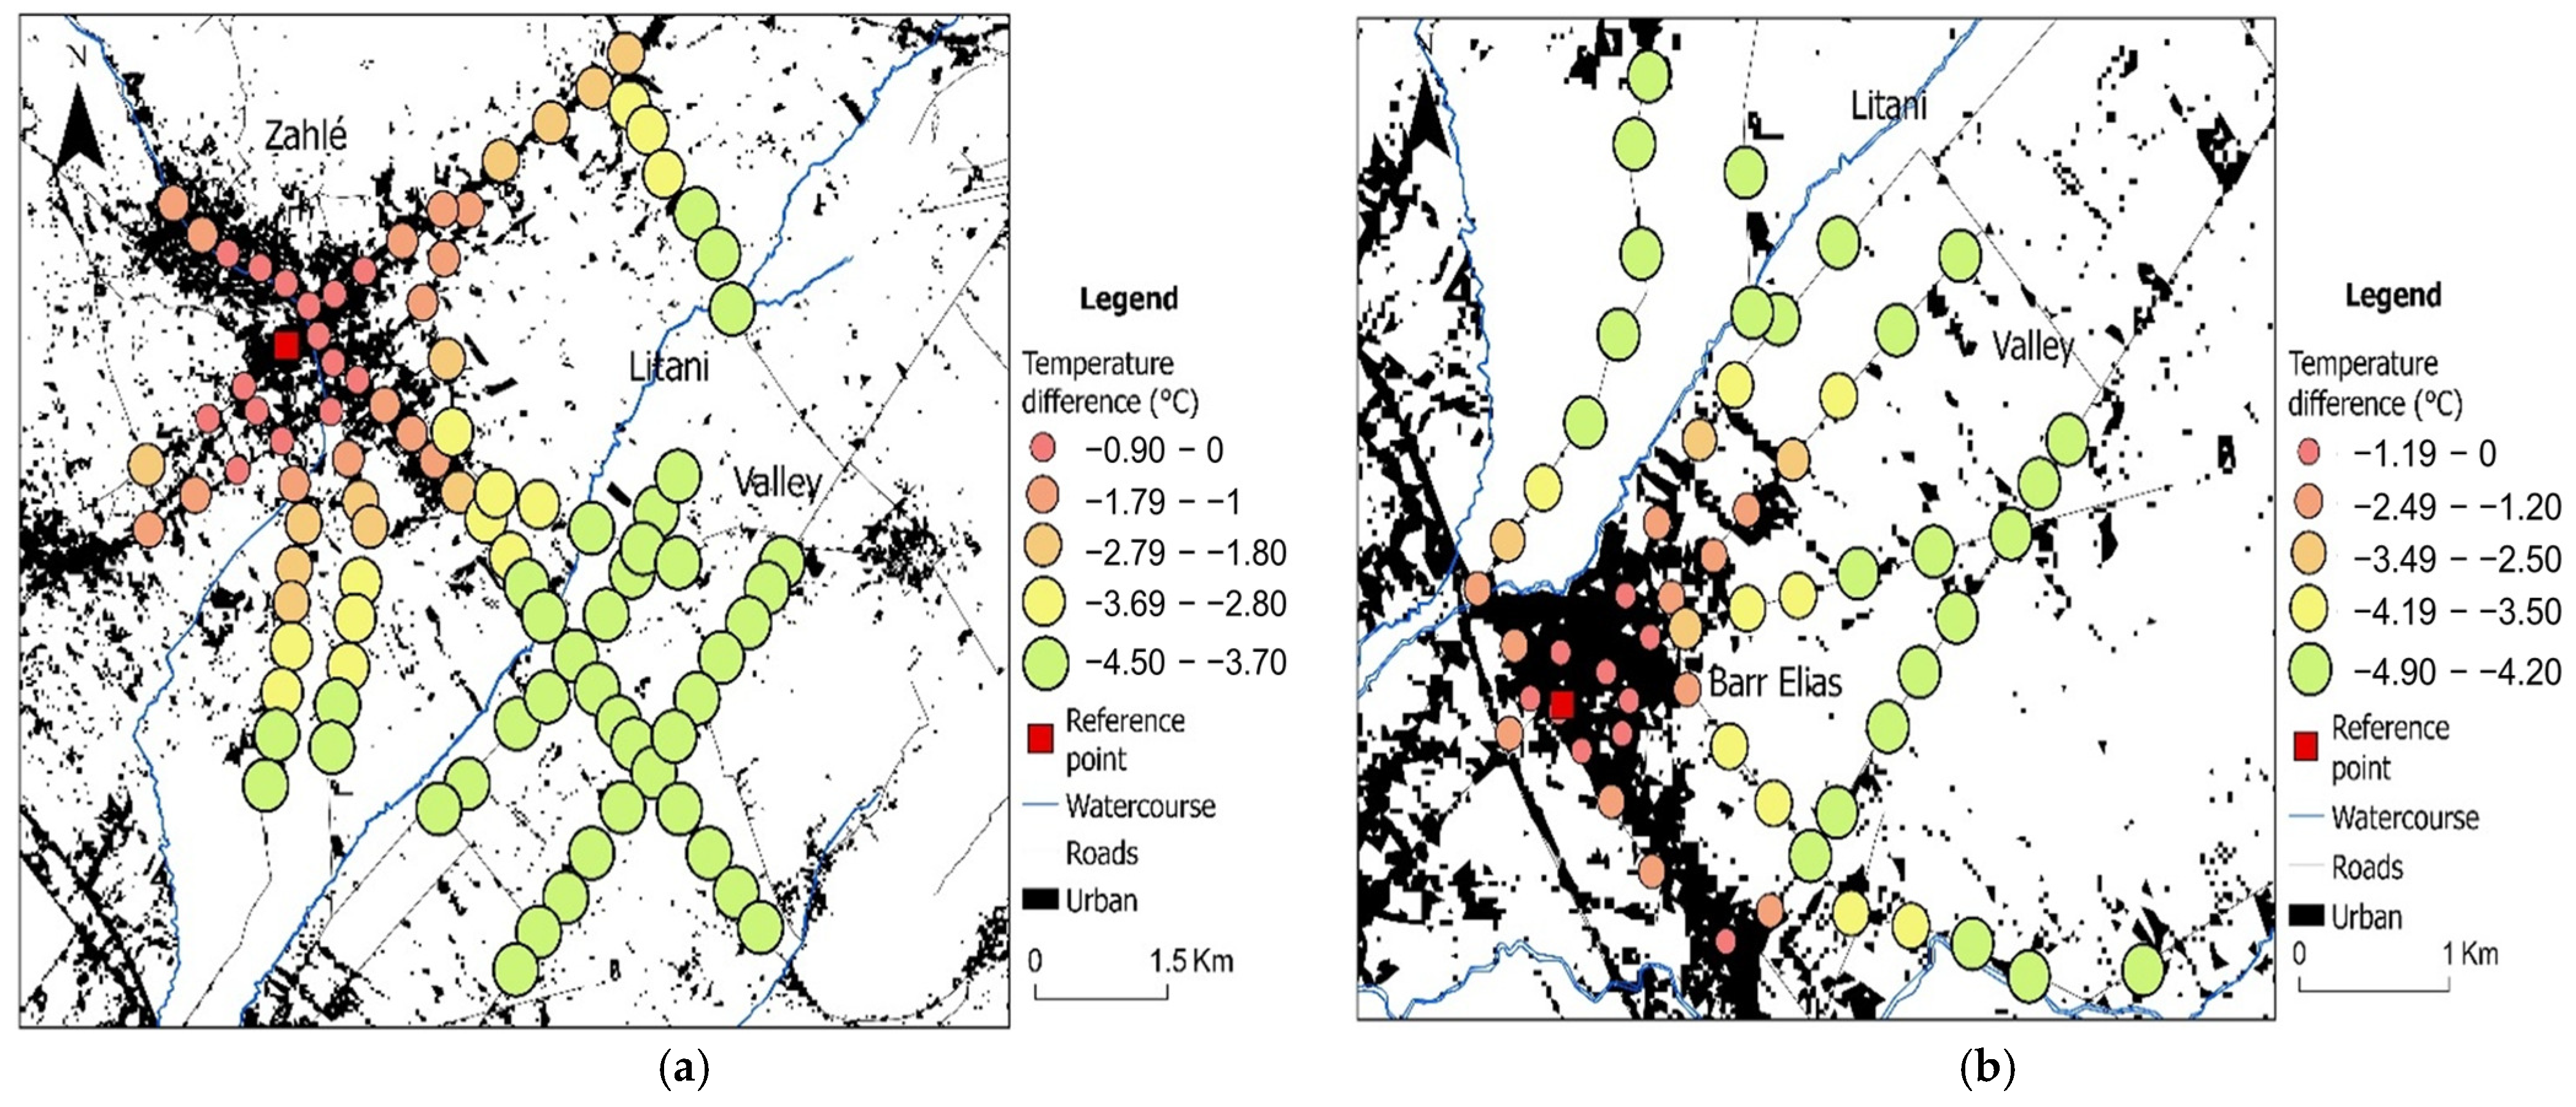
- Local climate of Zahlé
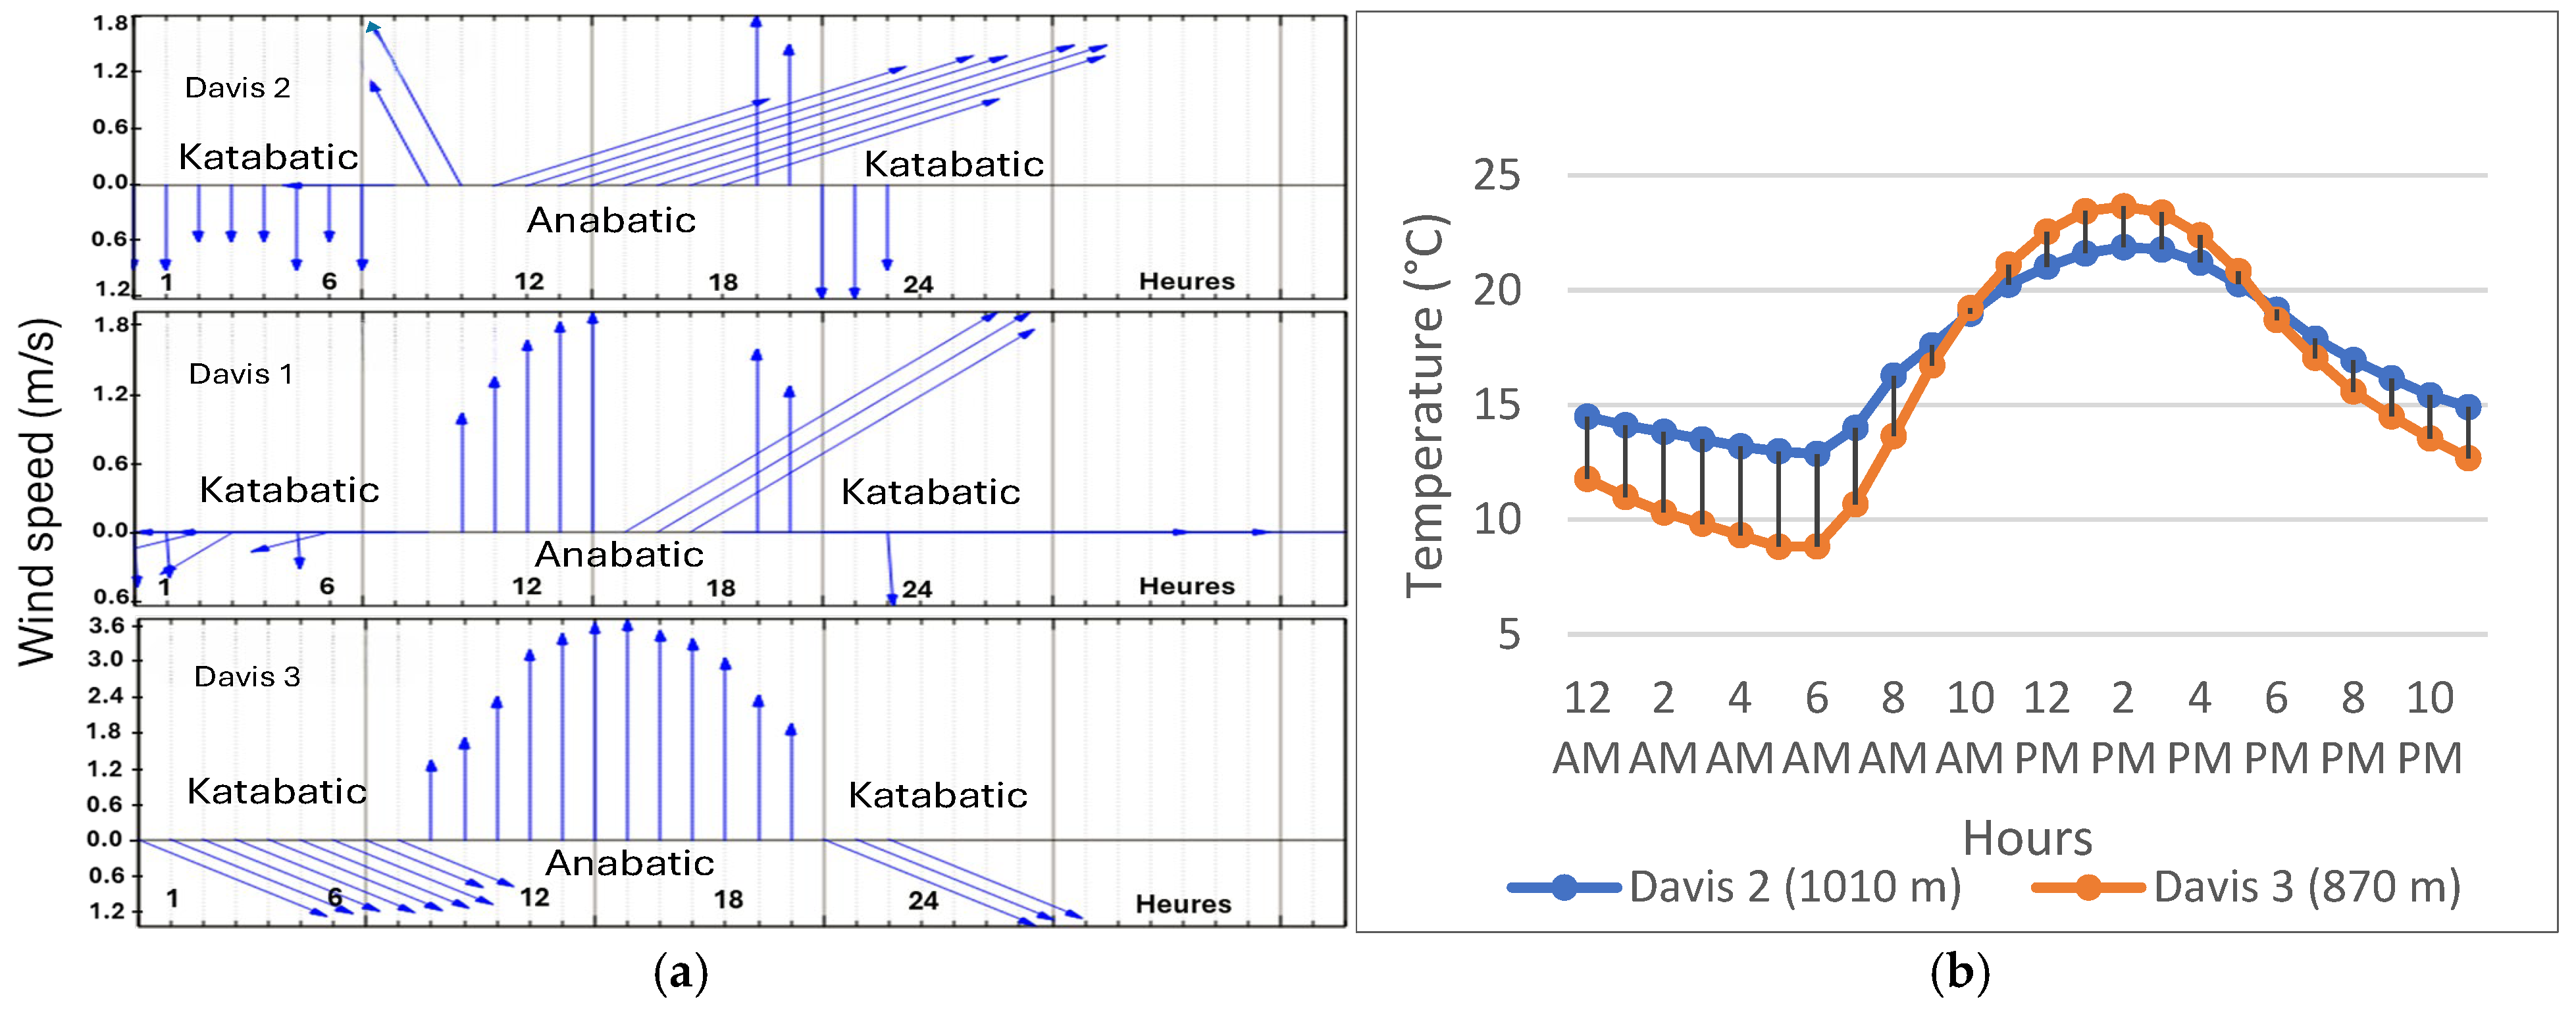
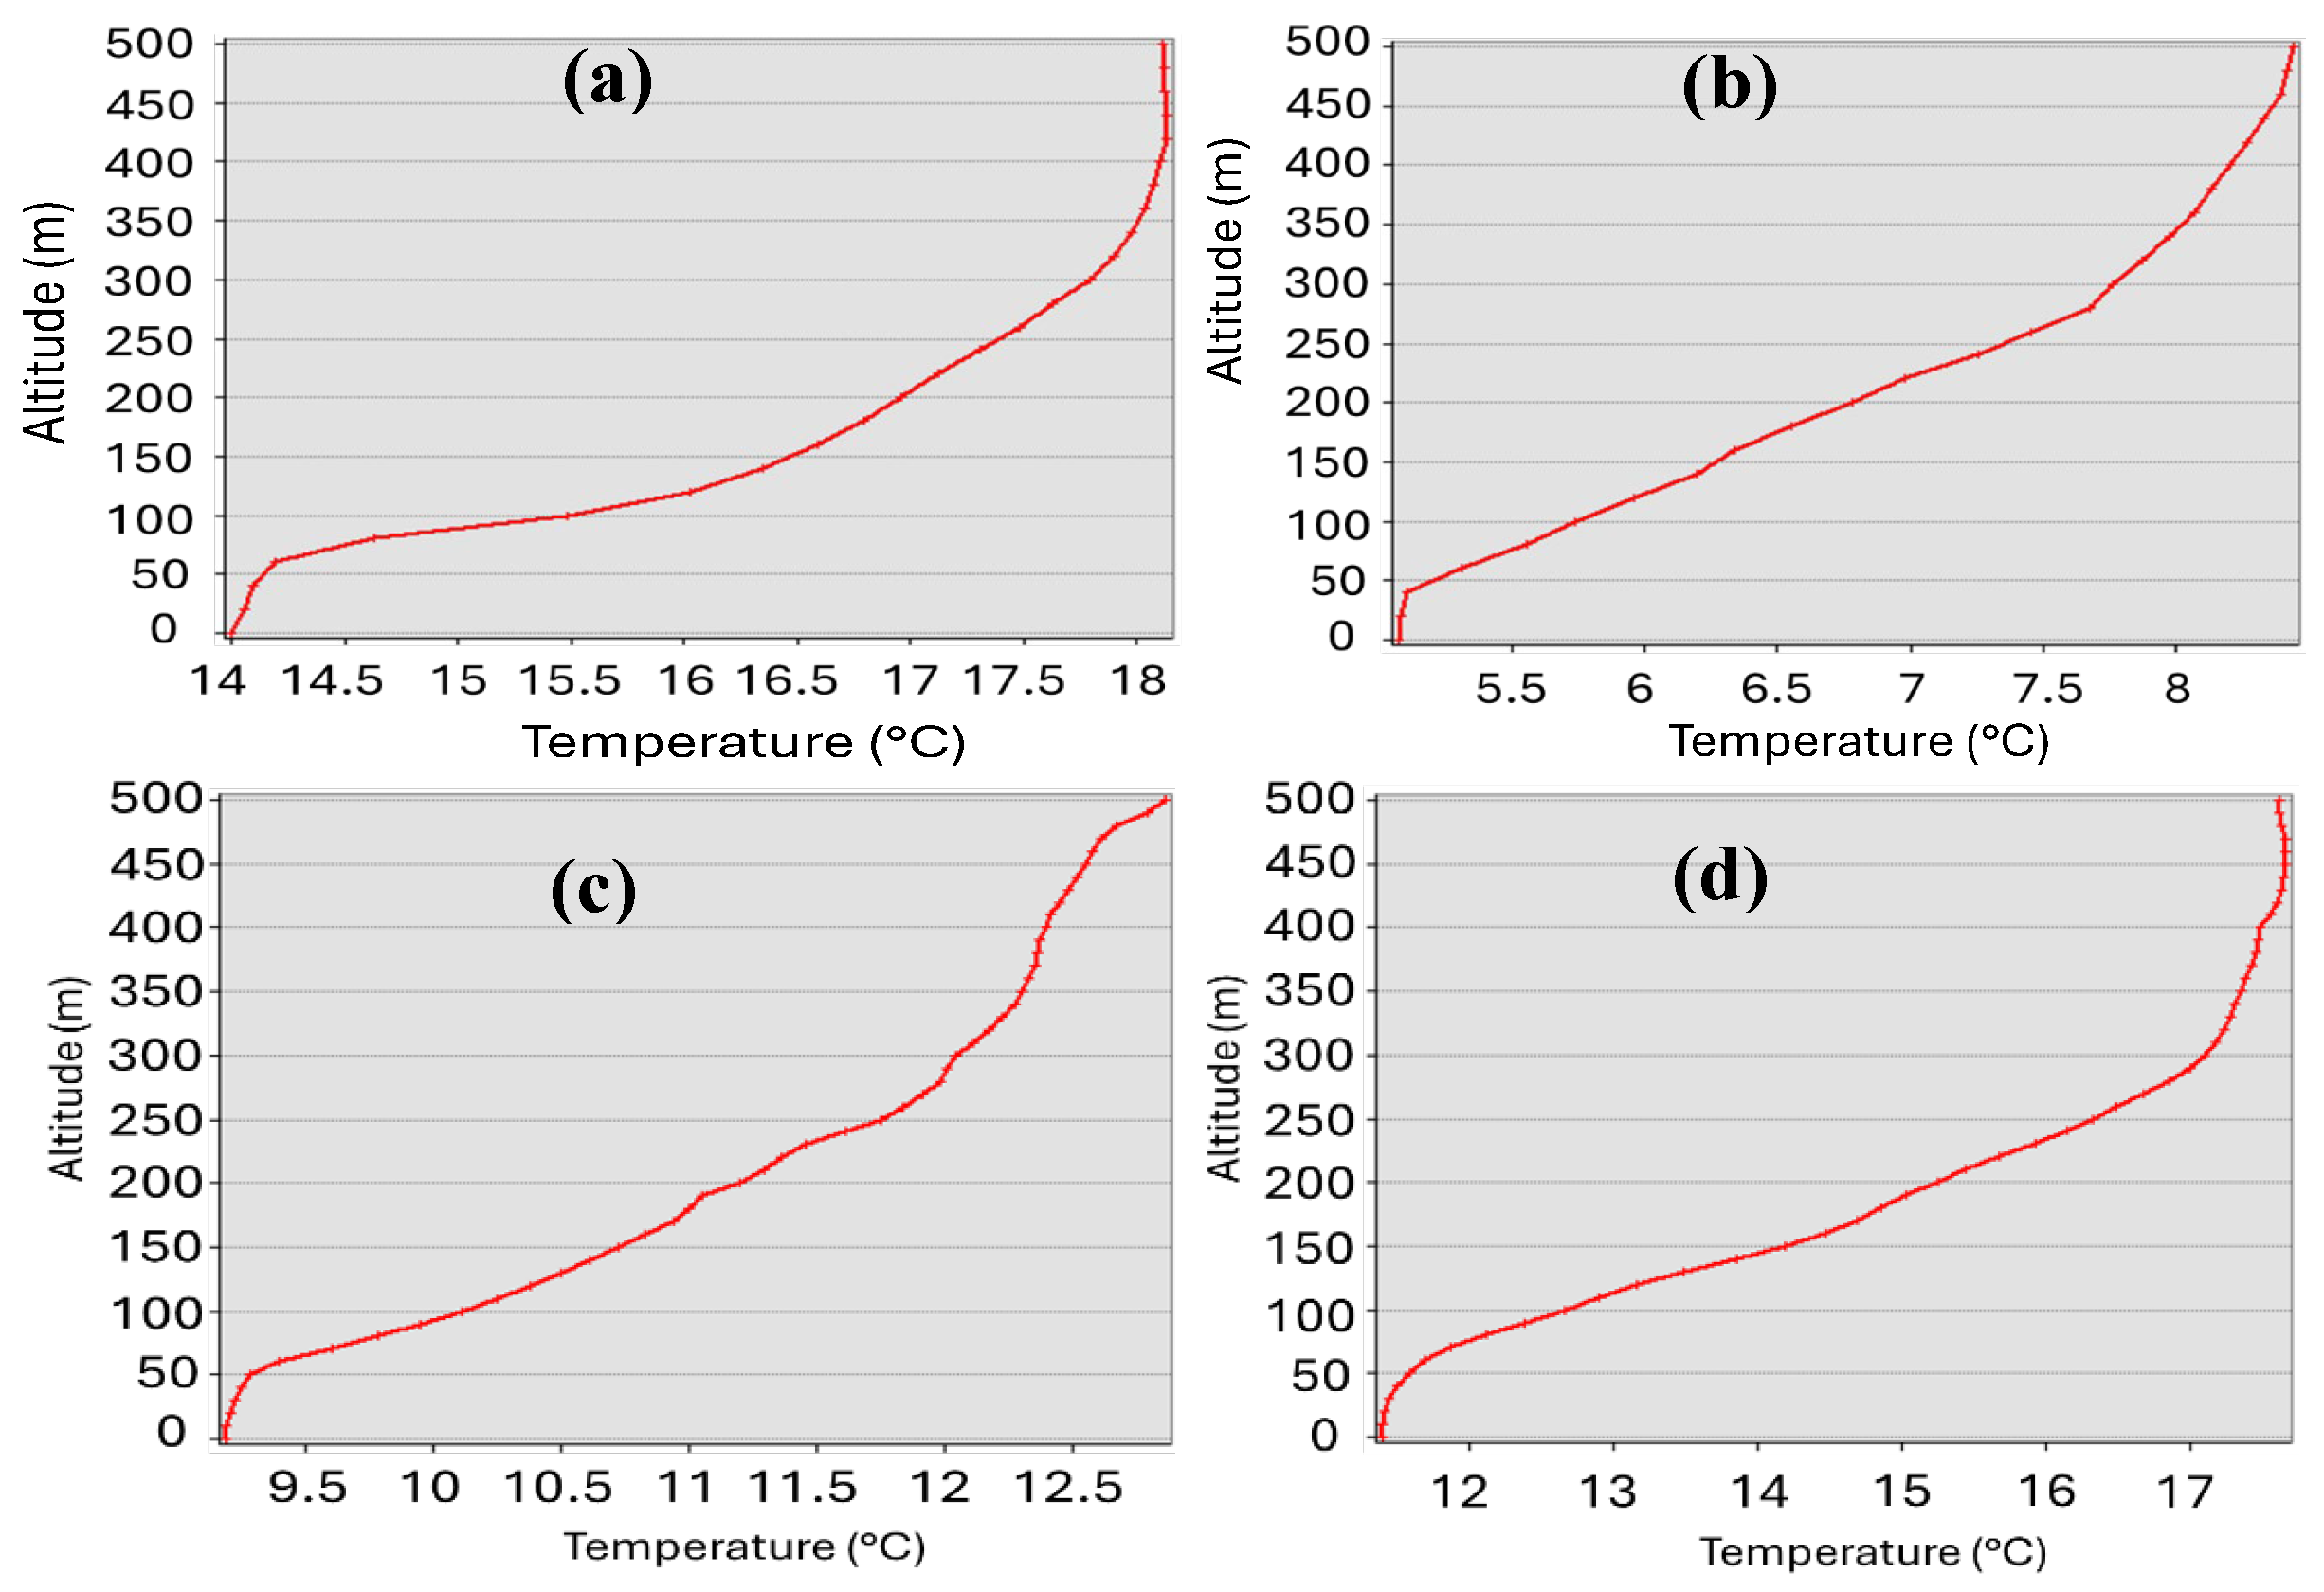
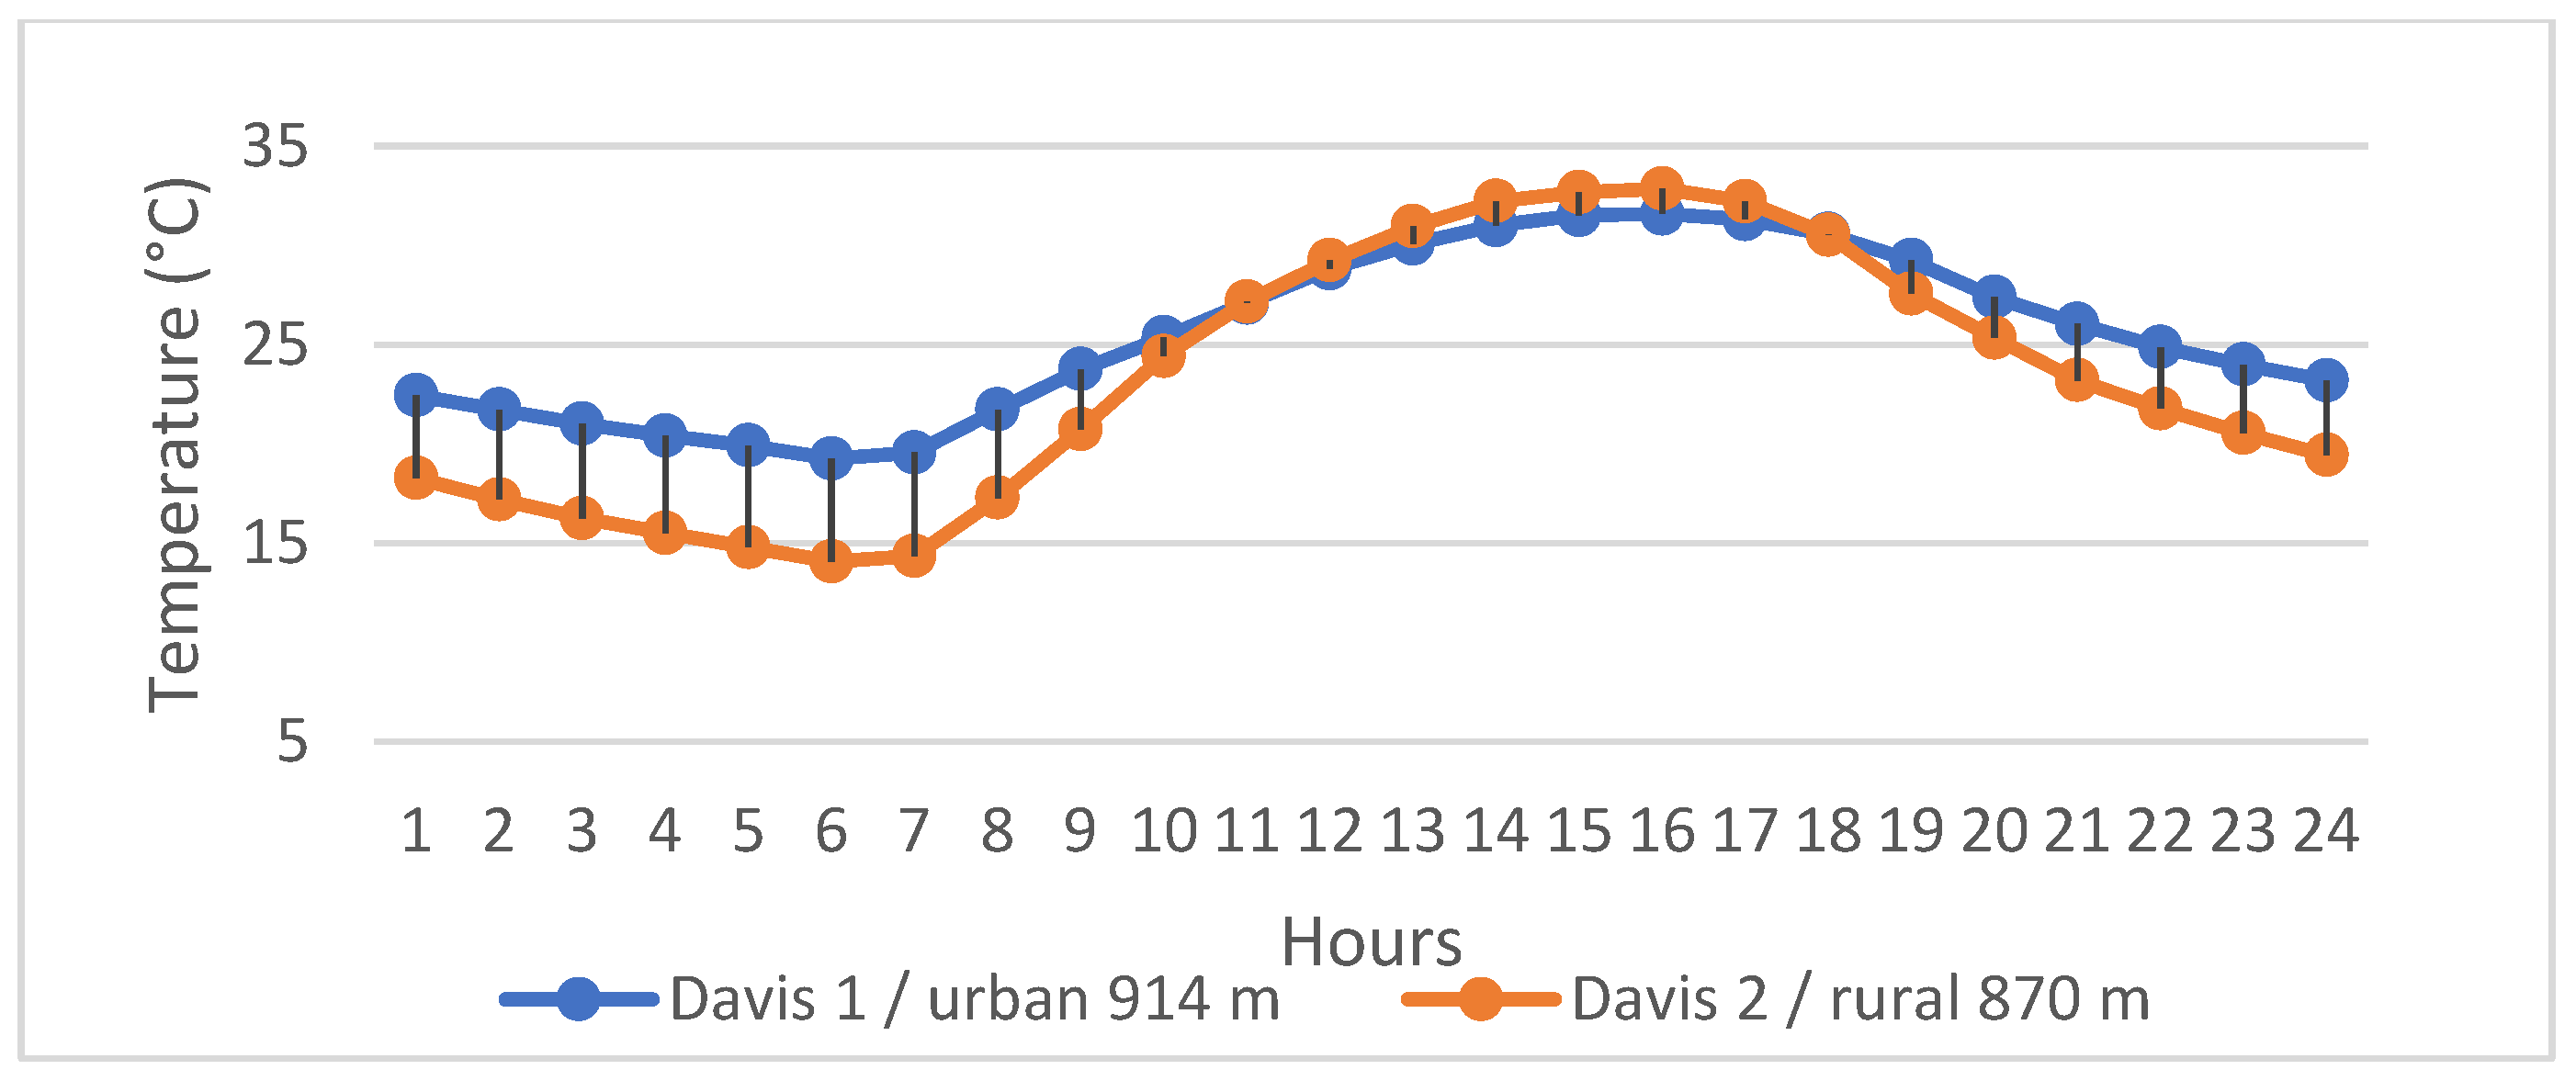
Cooling Factors: Thermal Breezes and Inversions
Warming Factor: UHI
4. Discussion
5. Conclusions
Author Contributions
Funding
Data Availability Statement
Acknowledgments
Conflicts of Interest
References
- Giorgi, F. Climate change hot-spots. Geophys. Res. Lett. 2006, 33, 101029. [Google Scholar] [CrossRef]
- Tuel, A.; Eltahir, E.A.B. Why Is the Mediterranean a Climate Change Hot Spot? J. Clim. 2020, 33, 5829–5843. [Google Scholar] [CrossRef]
- Di Bernardino, A.; Casadio, S.; Iannarelli, A.M.; Siani, A.M. Temperature Trends and Influence of the Base Period Selection on Climate Indices in the Mediterranean Region Over the Period 1961–2020. Int. J. Climatol. 2024, 44, 5969–5985. [Google Scholar] [CrossRef]
- Lionello, P.; Scarascia, L. The relation between climate change in the Mediterranean region and global warming. Reg. Environ. Change 2018, 18, 1481–1493. [Google Scholar] [CrossRef]
- Zittis, G.; Bruggeman, A.; Lelieveld, J. Revisiting future extreme precipitation trends in the Mediterranean. Weather. Clim. Extrem. 2021, 34, 100380. [Google Scholar] [CrossRef]
- Galdies, C. Temperature trends in Malta (central Mediterranean) from 1951 to 2010. Meteorol. Atmos. Phys. 2012, 117, 135–143. [Google Scholar] [CrossRef]
- Dahech, S.; Beltrando, G. Observed temperature evolution in the City of Sfax (Middle Eastern Tunisia) for the period 1950–2007. Clim. Change 2012, 114, 689–706. [Google Scholar] [CrossRef]
- Dai, A.; Trenberth, K.E.; Karl, T.R. Effects of Clouds, Soil Moisture, Precipitation, and Water Vapor on Diurnal Temperature Range. J. Clim. 1999, 12, 2451–2473. [Google Scholar] [CrossRef]
- Deser, C.; Alexander, M.A.; Xie, S.-P.; Phillips, A.S. Sea Surface Temperature Variability: Patterns and Mechanisms. Annu. Rev. Mar. Sci. 2010, 2, 115–143. [Google Scholar] [CrossRef]
- Intergovernmental Panel on Climate Change (IPCC). Climate Change 2013—The Physical Science Basis: Working Group I Contribution to the Fifth Assessment Report of the Intergovernmental Panel on Climate Change; Cambridge University Press: Cambridge, UK, 2014. [Google Scholar] [CrossRef]
- Pastor, F.; Valiente, J.A.; Palau, J.L. Sea Surface Temperature in the Mediterranean: Trends and Spatial Patterns (1982–2016). In Meteorology and Climatology of the Mediterranean and Black Seas; Vilibić, I., Horvath, K., Palau, J.L., Eds.; Springer International Publishing: Cham, Switzerland, 2019; pp. 297–309. [Google Scholar] [CrossRef]
- Juza, M.; Tintoré, J. Multivariate Sub-Regional Ocean Indicators in the Mediterranean Sea: From Event Detection to Climate Change Estimations. Front. Mar. Sci. 2021, 8, 610589. [Google Scholar] [CrossRef]
- García-Monteiro, S.; Sobrino, J.A.; Julien, Y.; Sòria, G.; Skokovic, D. Surface Temperature trends in the Mediterranean Sea from MODIS data during years 2003–2019. Reg. Stud. Mar. Sci. 2022, 49, 102086. [Google Scholar] [CrossRef]
- García, L.; José, M. Recent warming in the Balearic Sea and Spanish Mediterranean coast. Towards an earlier and longer summer. Atmósfera 2015, 28, 149–160. [Google Scholar] [CrossRef]
- Hadjinicolaou, P.; Tzyrkalli, A.; Zittis, G.; Lelieveld, J. Urbanisation and Geographical Signatures in Observed Air Temperature Station Trends Over the Mediterranean and the Middle East–North Africa. Earth Syst. Environ. 2023, 7, 649–659. [Google Scholar] [CrossRef]
- Pastor, F.; Valiente, J.A.; Khodayar, S. A Warming Mediterranean: 38 Years of Increasing Sea Surface Temperature. Remote Sens. 2020, 12, 2687. [Google Scholar] [CrossRef]
- Traboulsi, M.; Tolika, K.; Ch, A.; Maheras, P. Les changements des températures à Beyrouth et leurs relations avec les types de circulation atmosphérique. In Changement Climatique, Pénurie des Ressources en Eau, Nexus Eau/Énergie et Formes d’Adaptation; Université Hassan II: Mohammedia, Morocco, 2021; Available online: https://hal.science/hal-04878121 (accessed on 20 March 2025).
- Oke, T.R. The energetic basis of the urban heat island. Q. J. R. Meteorol. Soc. 1982, 108, 1–24. [Google Scholar] [CrossRef]
- Dahech, S. Le Vent à Sfax (Tunisie): Impact Sur le Climat et la Pollution Atmosphérique. Ph.D. Thesis, Paris 7 University, Paris, France, 2007. Available online: https://theses.fr/2007PA070002 (accessed on 1 January 2025).
- Lemonsu, A.; Viguié, V.; Daniel, M.; Masson, V. Vulnerability to heat waves: Impact of urban expansion scenarios on urban heat island and heat stress in Paris (France). Urban Clim. 2015, 14, 586–605. [Google Scholar] [CrossRef]
- EPA (U.S. Environmental Protection Agency). The Urban Heat Island Effect. 2020. Available online: https://www.epa.gov/heatislands/heat-island-trends (accessed on 20 April 2025).
- Akbari, H.; Cartalis, C.; Kolokotsa, D.; Muscio, A.; Pisello, A.L.; Rossi, F.; Santamouris, M.; Synnefa, A.; Wong, N.H.; Zinzi, M. Local climate change and urban heat island mitigation techniques—The state of the art. J. Civ. Eng. Manag. 2016, 22, 1111934. [Google Scholar] [CrossRef]
- Carrega, P. Topoclimatologie et Habitat. Ph.D. Thesis, Nice university, Nice, France, 1992. Available online: https://theses.fr/1992NICE2021 (accessed on 15 April 2025).
- Sakr, S. Brises thermiques et Risque de Pollution Dans la Région de Beyrouth. Ph.D. Thesis, Aix-Marseille University, Marseille, France, 2012. Available online: https://theses.fr/2012AIXM3137 (accessed on 15 April 2025).
- Zeinaldine, R. Aspects du Topoclimat et Pollution Atmosphérique à Zahlé (Liban Oriental). Ph.D. Thesis, Paris Cité University, Paris, France, 2024. [Google Scholar]
- Oke, T.R.; Mills, G.; Christen, A.; Voogt, J.A. Urban Climates; Cambridge University Press: Cambridge, UK, 2017. [Google Scholar]
- Cordeiro, A.; Ornelas, A.; Lameiras, J.M. The Thermal Regulator Role of Urban Green Spaces: The Case of Coimbra (Portugal). Forests 2023, 14, 2351. [Google Scholar] [CrossRef]
- Pettitt, A.N. A Non-Parametric Approach to the Change-Point Problem. J. R. Stat. Soc. Ser. C (Appl. Stat.) 1979, 28, 126–135. [Google Scholar] [CrossRef]
- Alexandersson, H. A homogeneity test applied to precipitation data. J. Climatol. 1986, 6, 661–675. [Google Scholar] [CrossRef]
- Buishand, T.A. Some methods for testing the homogeneity of rainfall records. J. Hydrol. 1982, 58, 11–27. [Google Scholar] [CrossRef]
- von Neumann, J. Distribution of the Ratio of the Mean Square Successive Difference to the Variance. Ann. Math. Stat. 1941, 12, 367–395. [Google Scholar] [CrossRef]
- Wijngaard, J.B.; Tank, A.M.G.K.; Können, G.P. Homogeneity of 20th century European daily temperature and precipitation series. Int. J. Climatol. 2003, 23, 679–692. [Google Scholar] [CrossRef]
- Draper, N.R.; Smith, H. Applied Regression Analysis; John Wiley & Sons: Hoboken, NJ, USA, 1998. [Google Scholar]
- Feidas, H.; Makrogiannis, T.; Bora-Senta, E. Trend analysis of air temperature time series in Greece and their relationship with circulation using surface and satellite data: 1955–2001. Theor. Appl. Climatol. 2004, 79, 185–208. [Google Scholar] [CrossRef]
- Gavrilov, M.B.; Tošić, I.; Marković, S.B.; Unkašević, M.; Petrović, P. Analysis of annual and seasonal temperature trends using the Mann-Kendall test in Vojvodina, Serbia. Időjárás 2016, 120, 183–198. Available online: https://physrep.ff.bg.ac.rs/handle/123456789/1126 (accessed on 2 April 2025).
- Bosneagu, R.; Lupu, C.E.; Torica, E.; Lupu, S.; Vatu, N.; Tanase, V.M.; Vasilache, C.; Daneci-Patrau, D.; Scurtu, I.C. Long-term analysis of air temperatures variability and trends on the Romanian Black Sea Coast. Acta Geophys. 2022, 70, 2179–2197. [Google Scholar] [CrossRef]
- Gadedjisso-Tossou, A.; Adjegan, K.I.; Kablan, A.K.M. Rainfall and Temperature Trend Analysis by Mann–Kendall Test and Significance for Rainfed Cereal Yields in Northern Togo. Science 2021, 3, 17. [Google Scholar] [CrossRef]
- Liyew, C.M.; Meo, R.; Ferraris, S.; Di Nardo, E. Analysis of Diurnal Air Temperature Trends and Pattern Similarities in Highland and Lowland Stations of Italy and UK. Int. J. Climatol. 2024, 44, 5398–5417. [Google Scholar] [CrossRef]
- Salameh, A.A.M.; Gámiz-Fortis, S.R.; Castro-Díez, Y.; Hammad, A.A.; Esteban-Parra, M.J. Spatio-temporal analysis for extreme temperature indices over the Levant region. arXiv 2024. [Google Scholar] [CrossRef]
- Onoz, B.; Bayazit, M. The power of statistical tests for trend detection. Turk. J. Eng. Environ. Sci. 2003, 27, 247. [Google Scholar]
- Barnston, A.G.; Livezey, R.E. Classification, Seasonality and Persistence of Low-Frequency Atmospheric Circulation Patterns. Mon. Weather. Rev. 1987, 115, 1083–1126. [Google Scholar] [CrossRef]
- Hurrell, J.W. Decadal Trends in the North Atlantic Oscillation: Regional Temperatures and Precipitation. Science 1995, 269, 676–679. [Google Scholar] [CrossRef] [PubMed]
- Chen, W.Y.; den Dool, H.V. Sensitivity of Teleconnection Patterns to the Sign of Their Primary Action Center. Mon. Weather. Rev. 2003, 131, 2885–2899. [Google Scholar] [CrossRef]
- Conte, M.; Giuffrida, A.; Tedesco, S. The mediterranean oscillation: Impact on precipitation and hydrology in Italy. Suom. Akat. Julk. 1989, 9, 121–137. [Google Scholar]
- Mariotti, A.; Zeng, N.; Lau, K.-M. Euro-Mediterranean rainfall and ENSO—A seasonally varying relationship. Geophys. Res. Lett. 2002, 29, 59-1–59-4. [Google Scholar] [CrossRef]
- Geeson, N.A.; Brandt, C.J.; Thornes, J.B. Mediterranean Desertification: A Mosaic of Processes and Responses; John Wiley & Sons: Hoboken, NJ, USA, 2003. [Google Scholar]
- Palutikof, J. Analysis of Mediterranean Climate Data: Measured and Modelled. In Mediterranean Climate. Regional Climate Studies; Bolle, H.J., Ed.; Springer: Berlin/Heidelberg, Germany, 2003. [Google Scholar]
- Oke, T.R. Boundary Layer Climates; Routledge: London, UK, 2002. [Google Scholar]
- Faour, G.; Hanna, J.; Hammoud, B. Investigation of Thermal Heat Mapping and Vegetation Cooling Impact Using Landsat-5, -7, and -8 Imagery: A Case Study of Greater Beirut Area in Lebanon. Environ. Sci. Proc. 2023, 29, 18. [Google Scholar] [CrossRef]
- Kaloustian, N.; Diab, Y. Effects of urbanization on the urban heat island in Beirut. Urban Clim. 2015, 14, 154–165. [Google Scholar] [CrossRef]
- Zeinaldine, R.; Dahech, S. Topoclimatic characteristics of Zahlé (Eastern Lebanon): Thermal breezes and urban heat island phenomenon—Preliminary results. Theor. Appl. Climatol. 2023, 154, 1075–1098. [Google Scholar] [CrossRef]
- Whiteman, C.D. Breakup of Temperature Inversions in Colorado Mountain Valleys. Ph.D. Thesis, Colorado State University, Fort Collins, CO, USA, 1980. Available online: https://ui.adsabs.harvard.edu/abs/1980PhDT........96W (accessed on 15 April 2025).
- Anquetin, S.; Guilbaud, C.; Chollet, J.-P. The Formation and Destruction of Inversion Layers within a Deep Valley. J. Appl. Meteorol. Climatol. 1998, 37, 1547–1560. [Google Scholar] [CrossRef]
- Michelot, N.; Carrega, P. Topoclimatogie et pollution de l’air dans les Alpes-Maritimes: Mécanismes et conséquences en images. EchoGéo 2014, 29. [Google Scholar] [CrossRef]
- Bokwa, A.; Hajto, M.J.; Walawender, J.P.; Szymanowski, M. Influence of diversified relief on the urban heat island in the city of Kraków, Poland. Theor. Appl. Climatol. 2015, 122, 365–382. [Google Scholar] [CrossRef]
- Faour, G.; Mhawej, M. Mapping Urban Transitions in the Greater Beirut Area Using Different Space Platforms. Land 2014, 3, 941–956. [Google Scholar] [CrossRef]
- Costanzini, S.; Boccolari, M.; Vega Parra, S.; Despini, F.; Lombroso, L.; Teggi, S. A comparative analysis of temperature trends at Modena Geophysical Observatory and Mount Cimone Observatory, Italy. Int. J. Climatol. 2024, 44, 4741–4766. [Google Scholar] [CrossRef]
- Boras, M.; Herceg-Bulić, I.; Žgela, M. Urban Heat Load in a Small Mediterranean City in Recent, Extreme and Future Climate Conditions—A Case Study for the City of Dubrovnik. Int. J. Climatol. 2025, 45, e8728. [Google Scholar] [CrossRef]
- Kalogeropoulos, G.; Dimoudi, A.; Toumboulidis, P.; Zoras, S. Urban Heat Island and Thermal Comfort Assessment in a Medium-Sized Mediterranean City. Atmosphere 2022, 13, 1102. [Google Scholar] [CrossRef]
- Sangiorgio, V.; Bruno, S.; Fiorito, F. Comparative Analysis and Mitigation Strategy for the Urban Heat Island Intensity in Bari (Italy) and in Other Six European Cities. Climate 2022, 10, 177. [Google Scholar] [CrossRef]
- Matthaios, V.N.; Garas, S.K.; Triantafyllou, A.G. Urban Heat Island in a Small Size Town in Northwestern Greece—A Comparison to Other Greek Areas. In Perspectives on Atmospheric Sciences; Karacostas, T., Bais, A., Nastos, P.T., Eds.; Springer International Publishing: Cham, Switzerland, 2017; pp. 759–765. [Google Scholar] [CrossRef]
- Dahech, S.; Berriche, M.; Charfi, S. L’îlot de chaleur urbain à Gabès dans le contexte du changement climatique (Tunisie méridionale). Méditerranée. Rev. Géographique Pays Méditerranéens/J. Mediterr. Geogr. 2025, 5627. [Google Scholar] [CrossRef]
- Keppas, S.C.; Papadogiannaki, S.; Parliari, D.; Kontos, S.; Poupkou, A.; Tzoumaka, P.; Kelessis, A.; Zanis, P.; Casasanta, G.; de’Donato, F.; et al. Future Climate Change Impact on Urban Heat Island in Two Mediterranean Cities Based on High-Resolution Regional Climate Simulations. Atmosphere 2021, 12, 884. [Google Scholar] [CrossRef]


| T mean | T max | T min | |||||
|---|---|---|---|---|---|---|---|
| Test | p-Value | Homogeneity | p-Value | Homogeneity | p-Value | Homogeneity | |
| HAO Station | Pettitt’s test | 0.005 | Non-homogeneous | 0.16 | Homogeneous | 0.001 | Non-homogeneous |
| Standard normal homogeneity test (SNHT) | 0.018 | Non-homogeneous | 0.216 | Homogeneous | 0.002 | Non-homogeneous | |
| Buishand test | 0.004 | Non-homogeneous | 0.15 | Homogeneous | 0 | Non-homogeneous | |
| Von Neumann test | 0.276 | Homogeneous | 0.23 | Homogeneous | 0.001 | Non-homogeneous | |
| Beirut Airport Station | Pettitt’s test | <0.0001 | Non-homogeneous | <0.0001 | Non-homogeneous | 0 | Non-homogeneous |
| Standard normal homogeneity test (SNHT) | <0.0001 | Non-homogeneous | 0.005 | Non-homogeneous | <0.0001 | Non-homogeneous | |
| Buishand test | <0.0001 | Non-homogeneous | 0.0008 | Non-homogeneous | <0.0001 | Non-homogeneous | |
| Von Neumann test | 0 | Non-homogeneous | <0.0001 | Non-homogeneous | 0 | Non-homogeneous | |
| Test | Breakpoint | |||
|---|---|---|---|---|
| T mean | T max | T min | ||
| HAO Station | Pettitt’s test | 2013 | _ | 2009 |
| Standard normal homogeneity test (SNHT) | 2009 | _ | 2022 | |
| Buishand test | 2009 | _ | 2009 | |
| Beirut Airport Station | Pettitt’s test | 2007 | 2006 | 2013 |
| Standard normal homogeneity test (SNHT) | 2007 | 2006 | 2016 | |
| Buishand test | 2007 | 2006 | 2015 | |
| Mann–Kendall | Kendall’s Tau | p Value | Significance | |
|---|---|---|---|---|
| HAO Station | T min | 0.43 | 0.001 | S positive trend |
| T max | 0.218 | 0.094 | NS positive trend | |
| T mean | 0.366 | 0.004 | S positive trend | |
| Beirut Airport Station | T min | 0.542 | <0.0001 | S positive trend |
| T max | 0.413 | 0.001 | S positive trend | |
| T mean | 0.617 | <0.0001 | S positive trend |
| Station | Month | T min | T max | ||||||||
|---|---|---|---|---|---|---|---|---|---|---|---|
| Kendall’s Tau | a (°C) | R2 | p-Value | Significance | Kendall’s Tau | a (°C) | R2 | p-Value | Significance | ||
| HAO | January | 0.124 | 0.046 | 0.07 | 0.344 | NS positive trend | 0.048 | 0.02 | 0.007 | 0.724 | NS positive trend |
| February | 0.237 | 0.05 | 0.09 | 0.069 | NS positive trend | 0.136 | 0.05 | 0.05 | 0.304 | NS positive trend | |
| March | 0.214 | 0.05 | 0.07 | 0.101 | NS positive trend | 0.025 | 0.02 | 0.003 | 0.860 | NS positive trend | |
| April | 0.235 | 0.06 | 0.15 | 0.071 | NS positive trend | 0.297 | 0.14 | 0.24 | 0.022 | S positive trend | |
| May | 0.09 | 0.025 | 0.04 | 0.502 | NS positive trend | −0.039 | −0.01 | 0.004 | 0.777 | NS negative trend | |
| June | 0.163 | 0.06 | 0.11 | 0.214 | NS positive trend | 0.025 | 0.01 | 0.004 | 0.860 | NS positive trend | |
| July | 0.186 | 0.032 | 0.1 | 0.155 | NS positive trend | 0.032 | 0.015 | 0.006 | 0.817 | NS positive trend | |
| August | 0.370 | 0.05 | 0.23 | 0.004 | S positive trend | 0.214 | 0.048 | 0.07 | 0.101 | NS positive trend | |
| September | 0.262 | 0.06 | 0.21 | 0.044 | S positive trend | 0.039 | 0.026 | 0.017 | 0.777 | NS positive trend | |
| October | 0.214 | 0.047 | 0.12 | 0.101 | NS positive trend | 0.099 | 0.04 | 0.04 | 0.457 | NS positive trend | |
| November | 0.325 | 0.074 | 0.21 | 0.012 | S positive trend | 0.136 | 0.027 | 0.012 | 0.304 | NS positive trend | |
| December | 0.182 | 0.05 | 0.095 | 0.166 | NS positive trend | −0.071 | −0.023 | 0.02 | 0.596 | NS negative trend | |
| Beirut Airport Station | January | 0.212 | 0.037 | 0.1 | 0.086 | NS positive trend | 0.167 | 0.04 | 0.08 | 0.179 | NS positive trend |
| February | 0.337 | 0.06 | 0.26 | 0.005 | S positive trend | 0.277 | 0.075 | 0.2 | 0.024 | S positive trend | |
| March | 0.299 | 0.05 | 0.17 | 0.014 | S positive trend | 0.212 | 0.056 | 0.075 | 0.086 | NS positive trend | |
| April | 0.241 | 0.04 | 0.18 | 0.05 | S positive trend | 0.246 | 0.05 | 0.12 | 0.045 | S positive trend | |
| May | 0.326 | 0.05 | 0.28 | 0.007 | S positive trend | 0.345 | 0.07 | 0.24 | 0.005 | S positive trend | |
| June | 0.341 | 0.046 | 0.33 | 0.005 | S positive trend | 0.254 | 0.048 | 0.13 | 0.039 | S positive trend | |
| July | 0.466 | 0.066 | 0.46 | <0.0001 | S positive trend | 0.332 | 0.05 | 0.21 | 0.007 | S positive trend | |
| August | 0.572 | 0.077 | 0.6 | <0.0001 | S positive trend | 0.394 | 0.05 | 0.2 | 0.001 | S positive trend | |
| September | 0.563 | 0.077 | 0.58 | <0.0001 | S positive trend | 0.322 | 0.04 | 0.16 | 0.008 | S positive trend | |
| October | 0.333 | 0.05 | 0.16 | 0.006 | S positive trend | 0.167 | 0.025 | 0.047 | 0.179 | NS positive trend | |
| November | 0.448 | 0.078 | 0.34 | 0 | S positive trend | 0.180 | 0.04 | 0.09 | 0.145 | NS positive trend | |
| December | 0.355 | 0.067 | 0.3 | 0.004 | S positive trend | 0.186 | 0.04 | 0.085 | 0.134 | NS positive trend | |
Disclaimer/Publisher’s Note: The statements, opinions and data contained in all publications are solely those of the individual author(s) and contributor(s) and not of MDPI and/or the editor(s). MDPI and/or the editor(s) disclaim responsibility for any injury to people or property resulting from any ideas, methods, instructions or products referred to in the content. |
© 2025 by the authors. Licensee MDPI, Basel, Switzerland. This article is an open access article distributed under the terms and conditions of the Creative Commons Attribution (CC BY) license (https://creativecommons.org/licenses/by/4.0/).
Share and Cite
Zeinaldine, R.; Dahech, S. Climate Warming in the Eastern Mediterranean: A Comparative Analysis of Beirut and Zahlé (Lebanon, 1992–2024). Urban Sci. 2025, 9, 247. https://doi.org/10.3390/urbansci9070247
Zeinaldine R, Dahech S. Climate Warming in the Eastern Mediterranean: A Comparative Analysis of Beirut and Zahlé (Lebanon, 1992–2024). Urban Science. 2025; 9(7):247. https://doi.org/10.3390/urbansci9070247
Chicago/Turabian StyleZeinaldine, Rabih, and Salem Dahech. 2025. "Climate Warming in the Eastern Mediterranean: A Comparative Analysis of Beirut and Zahlé (Lebanon, 1992–2024)" Urban Science 9, no. 7: 247. https://doi.org/10.3390/urbansci9070247
APA StyleZeinaldine, R., & Dahech, S. (2025). Climate Warming in the Eastern Mediterranean: A Comparative Analysis of Beirut and Zahlé (Lebanon, 1992–2024). Urban Science, 9(7), 247. https://doi.org/10.3390/urbansci9070247