
Assessing Mobility-Driven Socio-Economic Impacts on Quality of Life in Small Urban Areas: A Case Study of the Great Belt Fixed Link Corridor


Abstract
1. Introduction
2. Literature Review
2.1. Land Use and Mobility
2.2. Socio-Economic Impact and Living Standards
3. Methodology
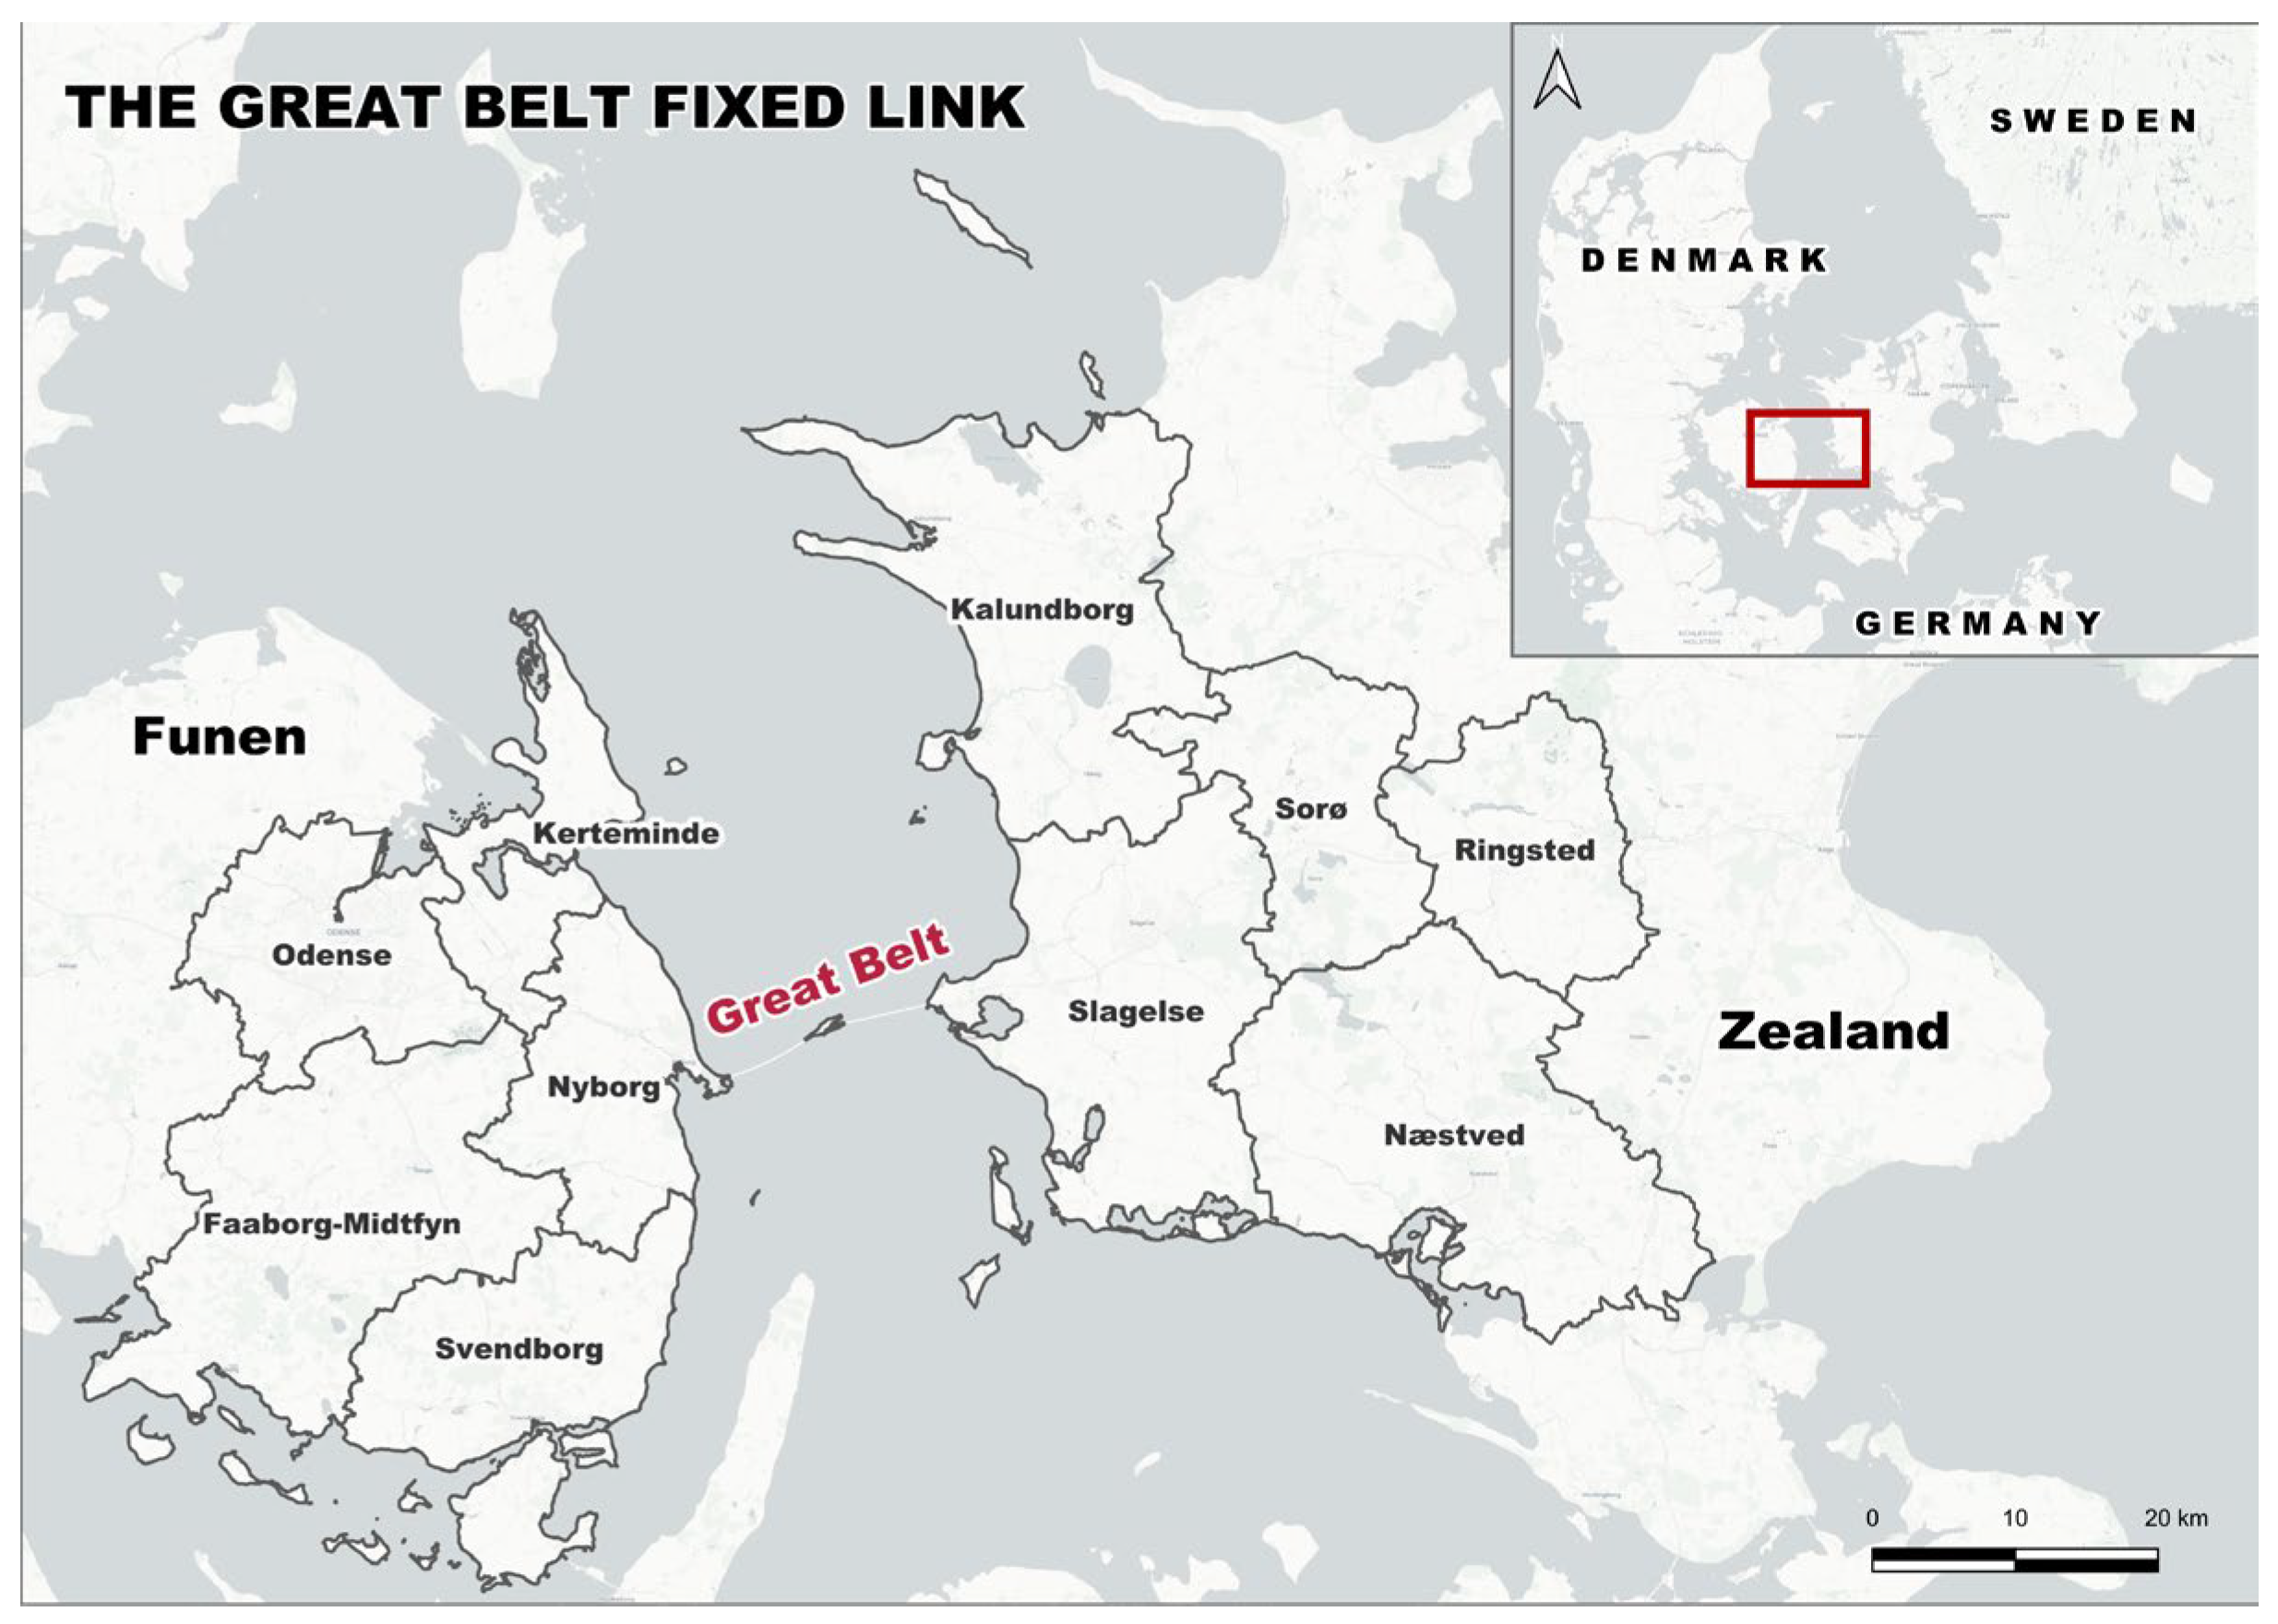
3.1. Case Study
3.2. Data Collection
3.3. Spatial and Predictive Modelling
4. Results
4.1. Commuting Behaviour and Accessibility
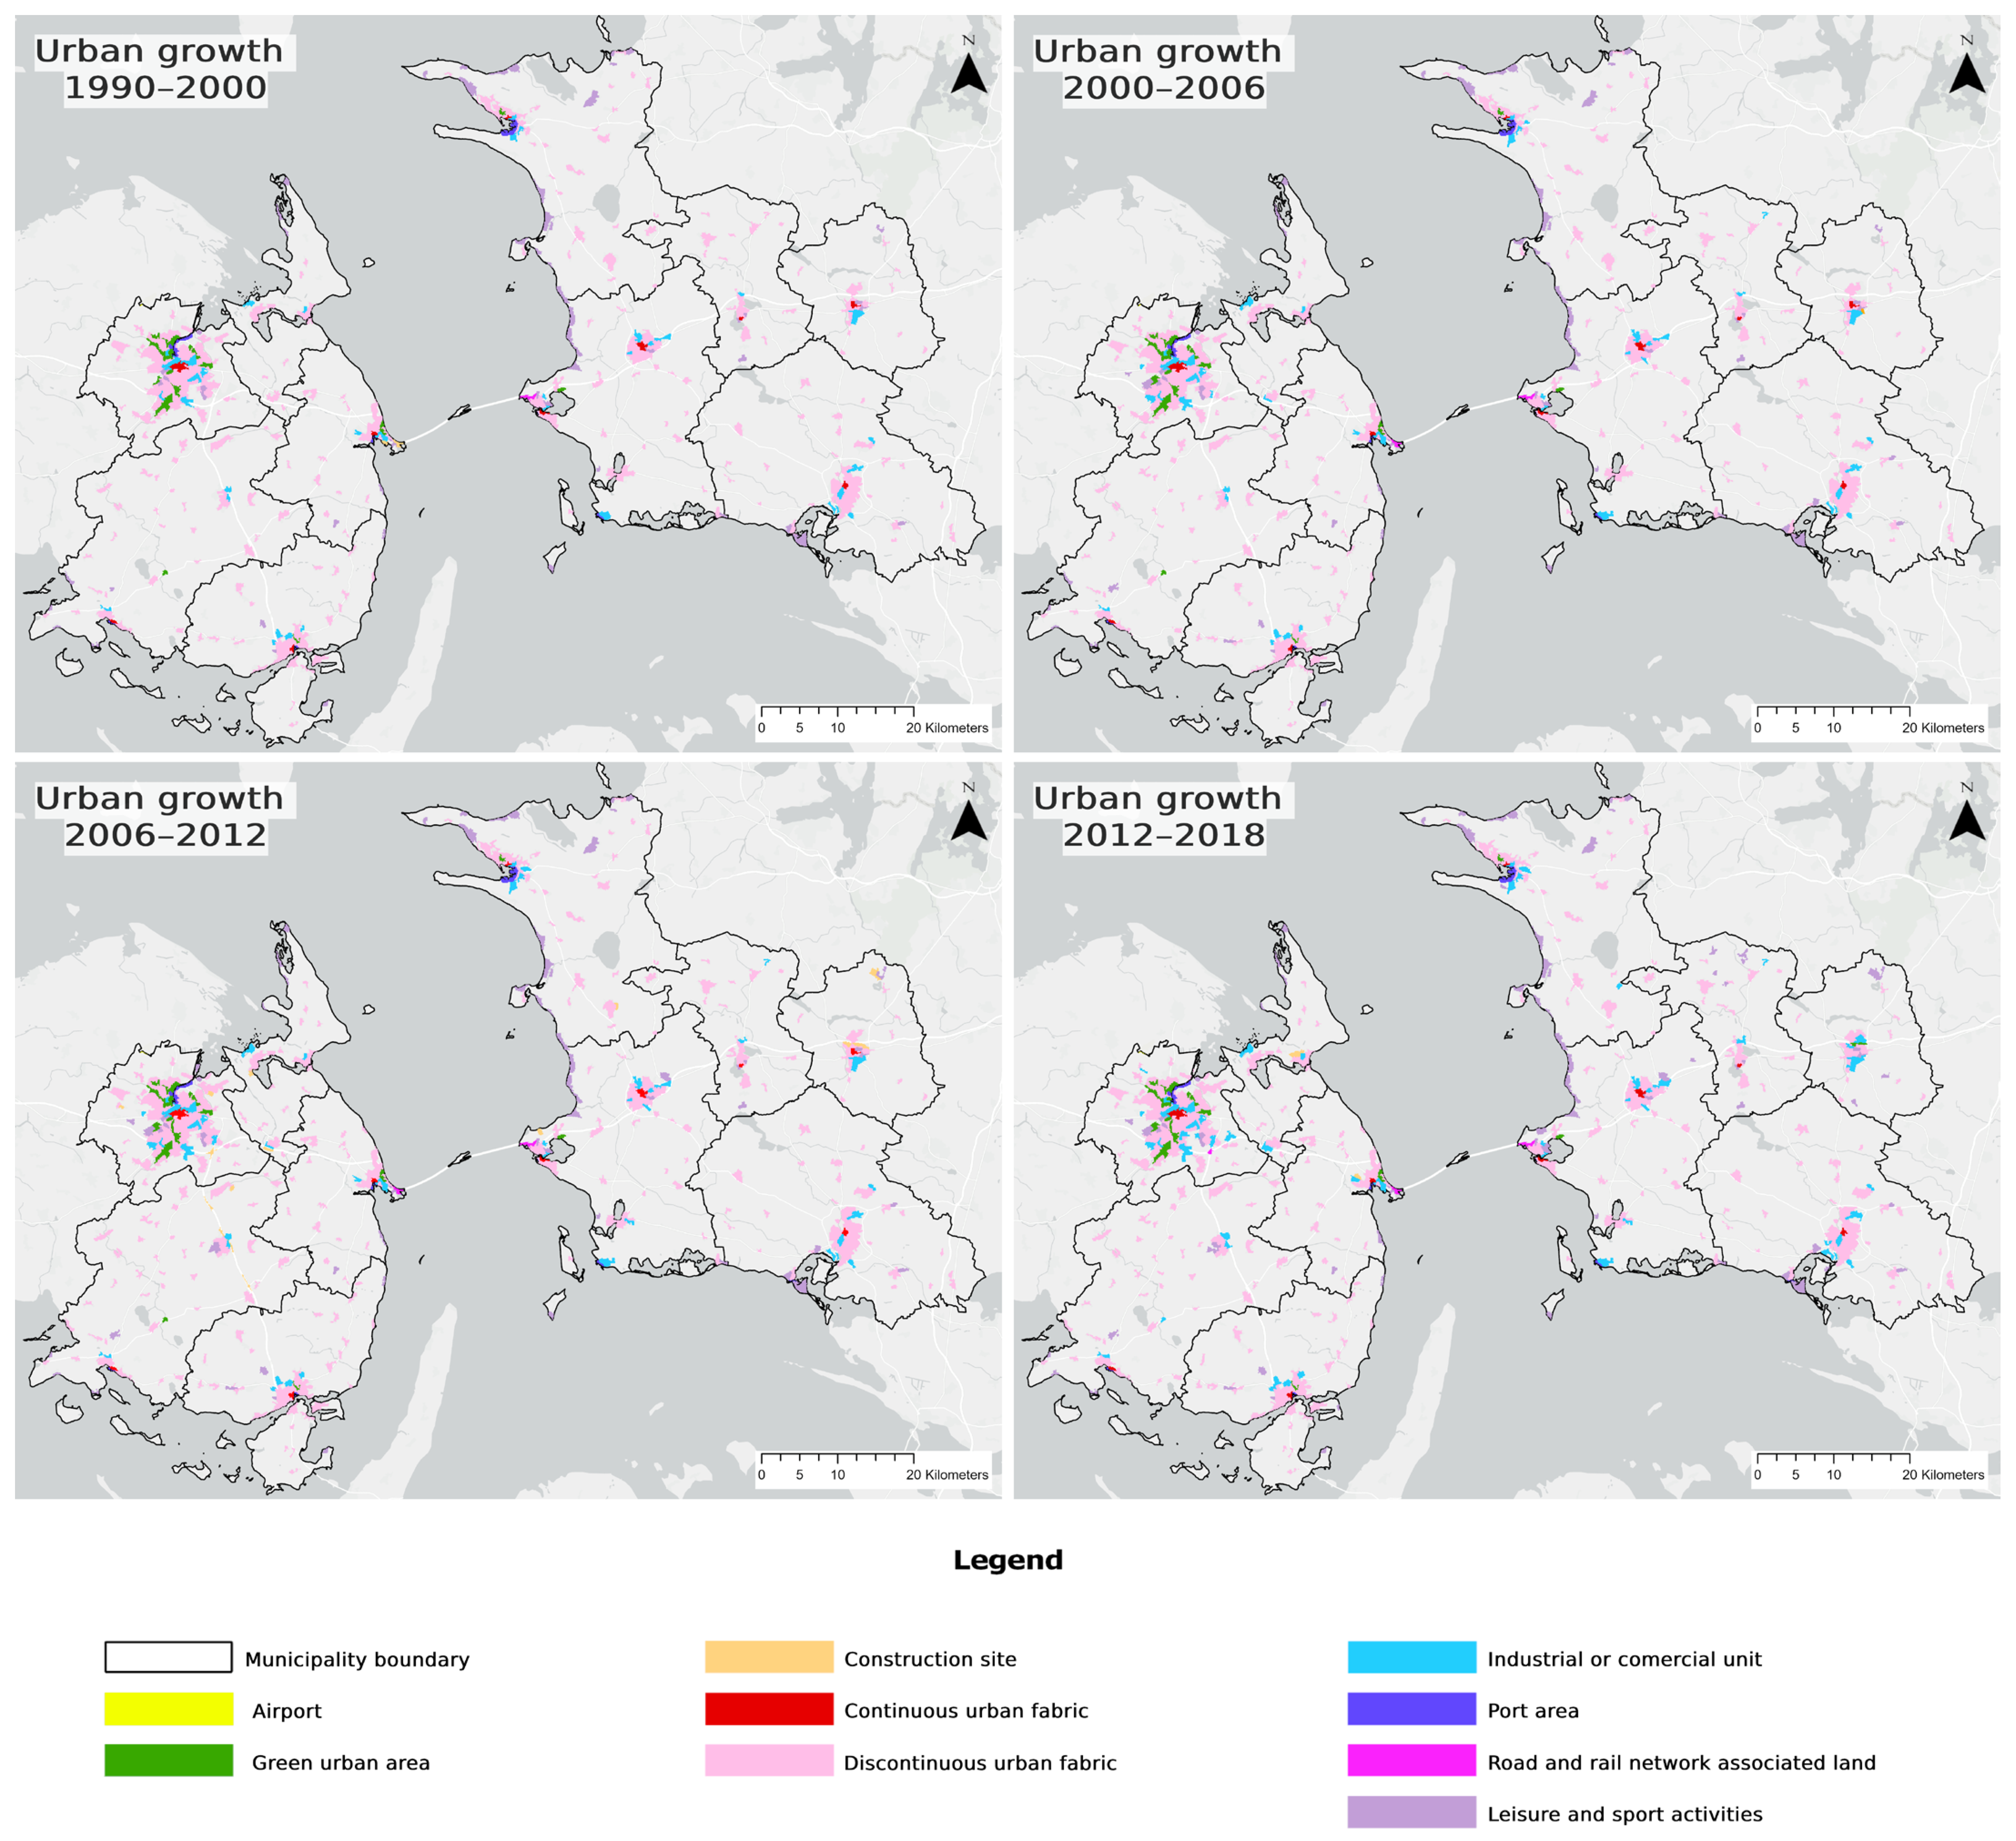
4.2. Urban Growth and Land Use Change
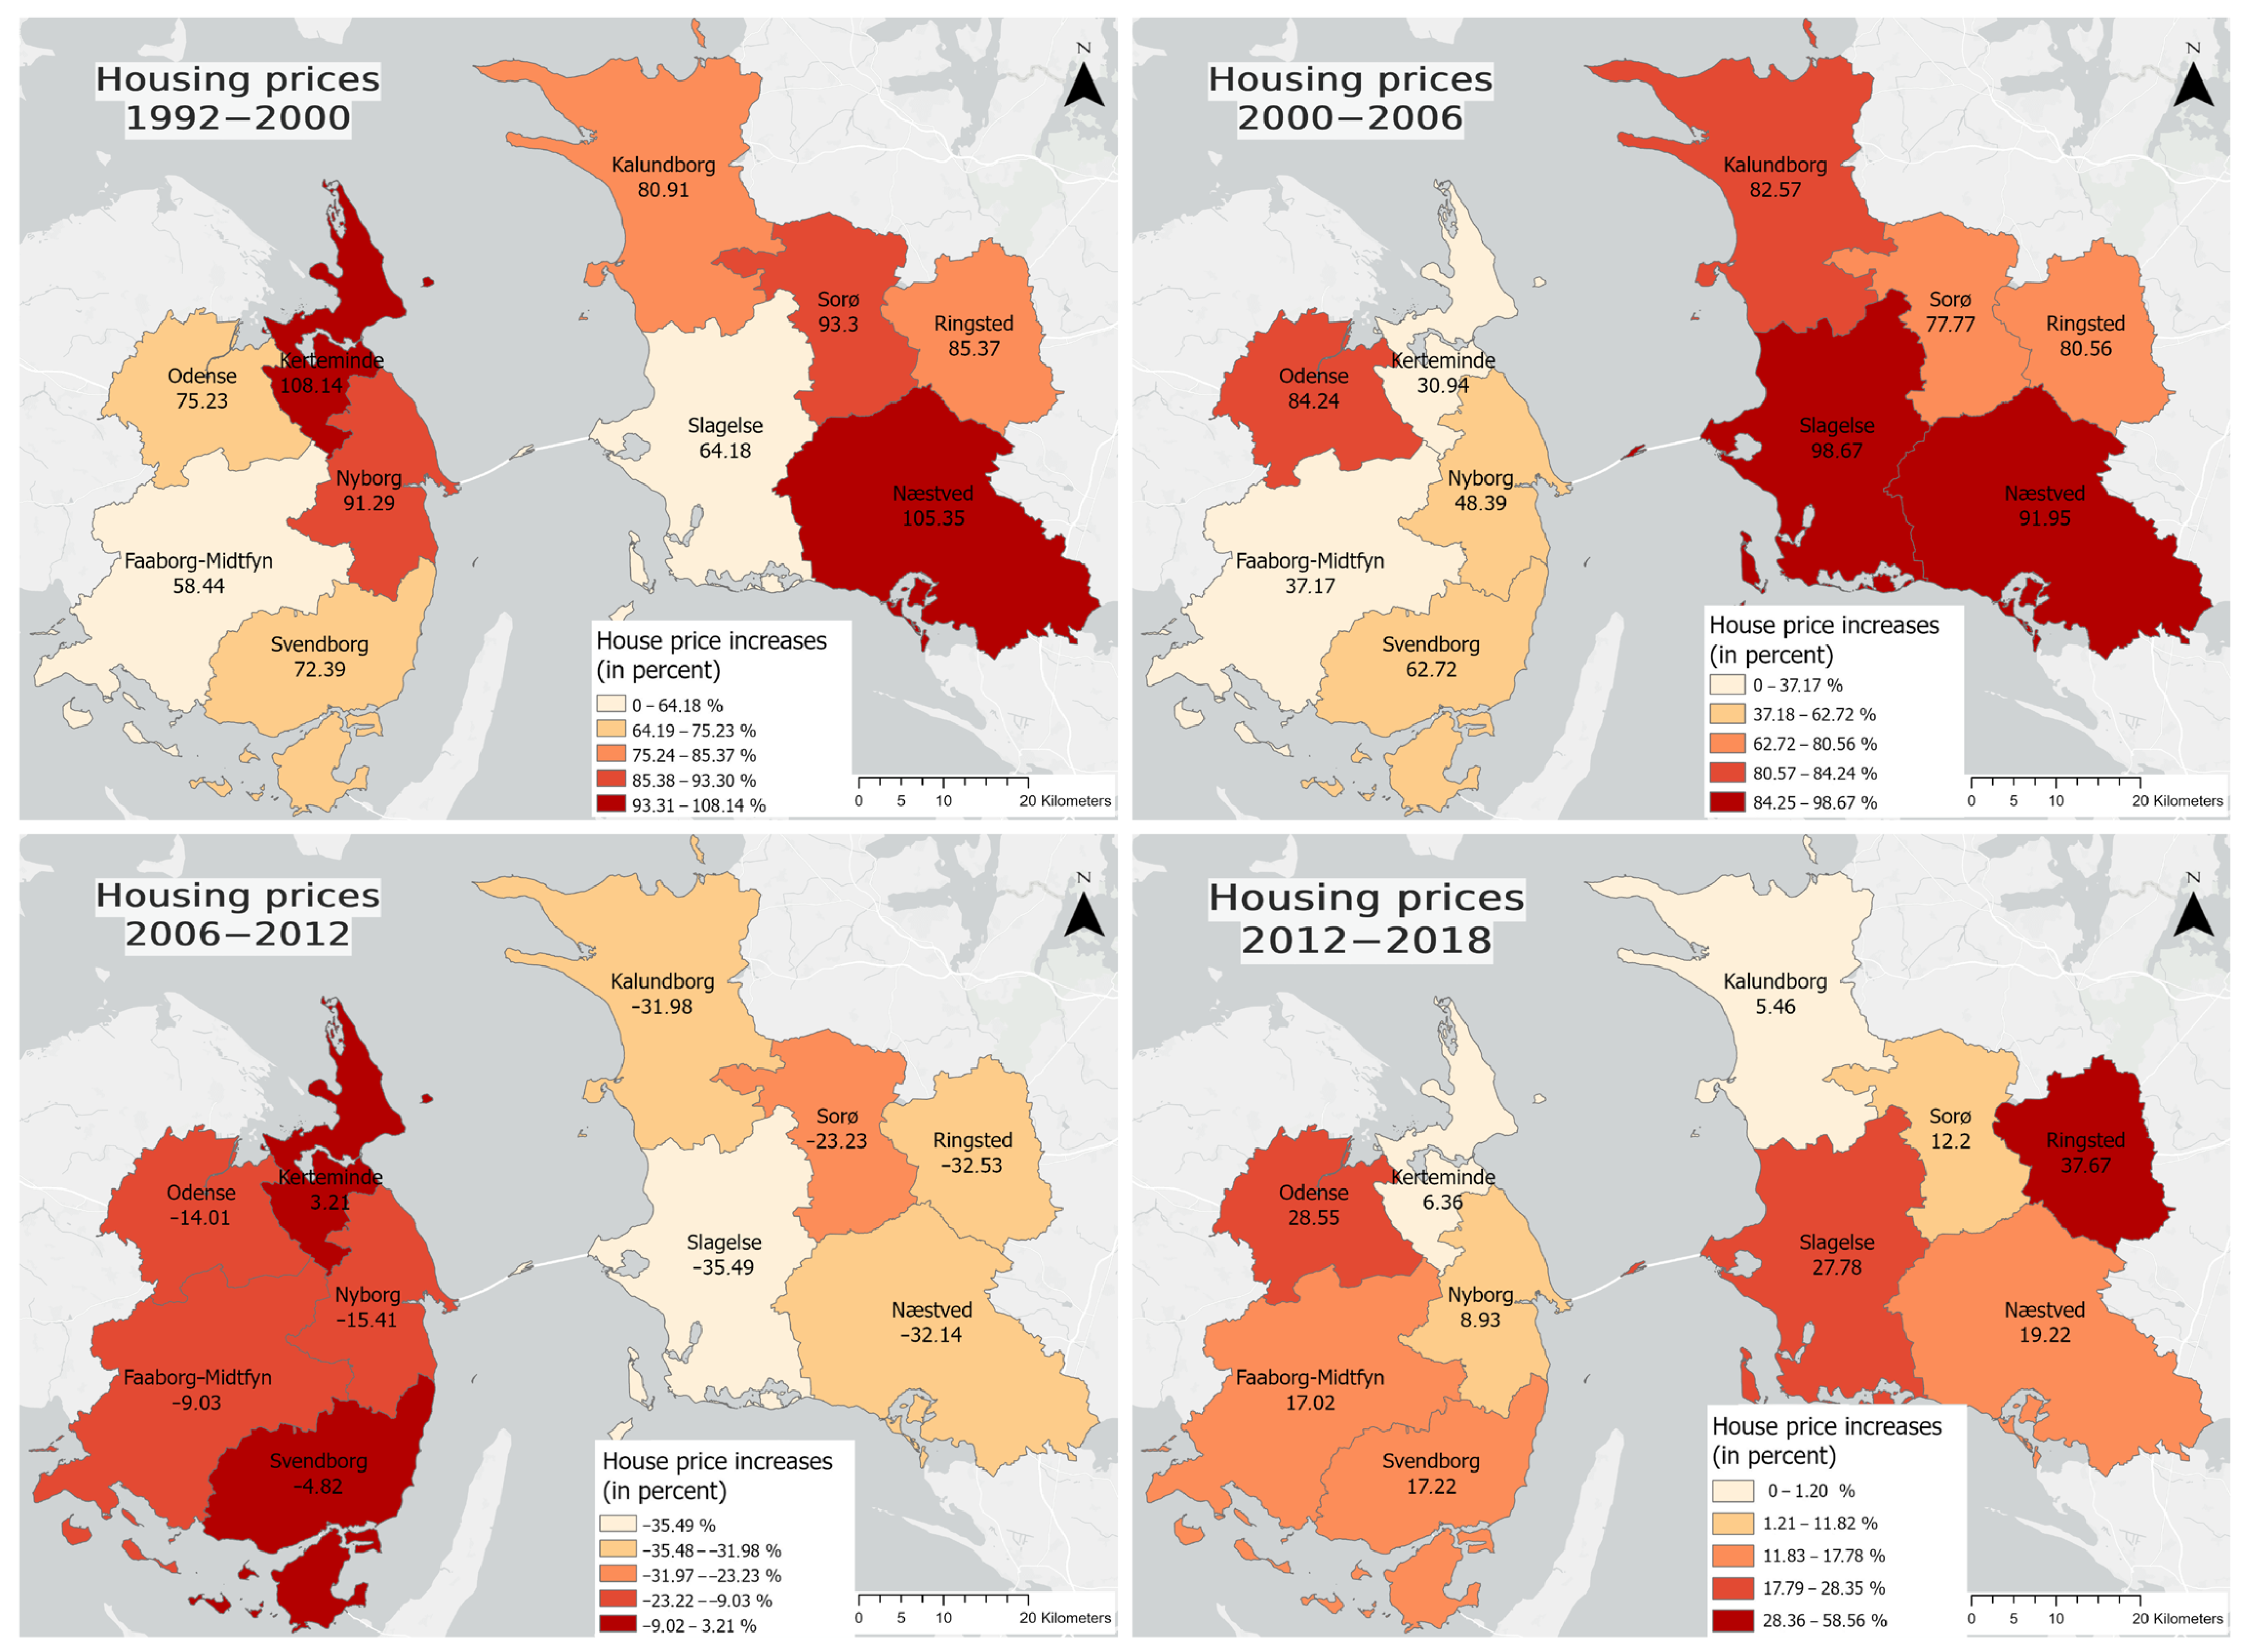
4.3. Socio-Economic Indicators
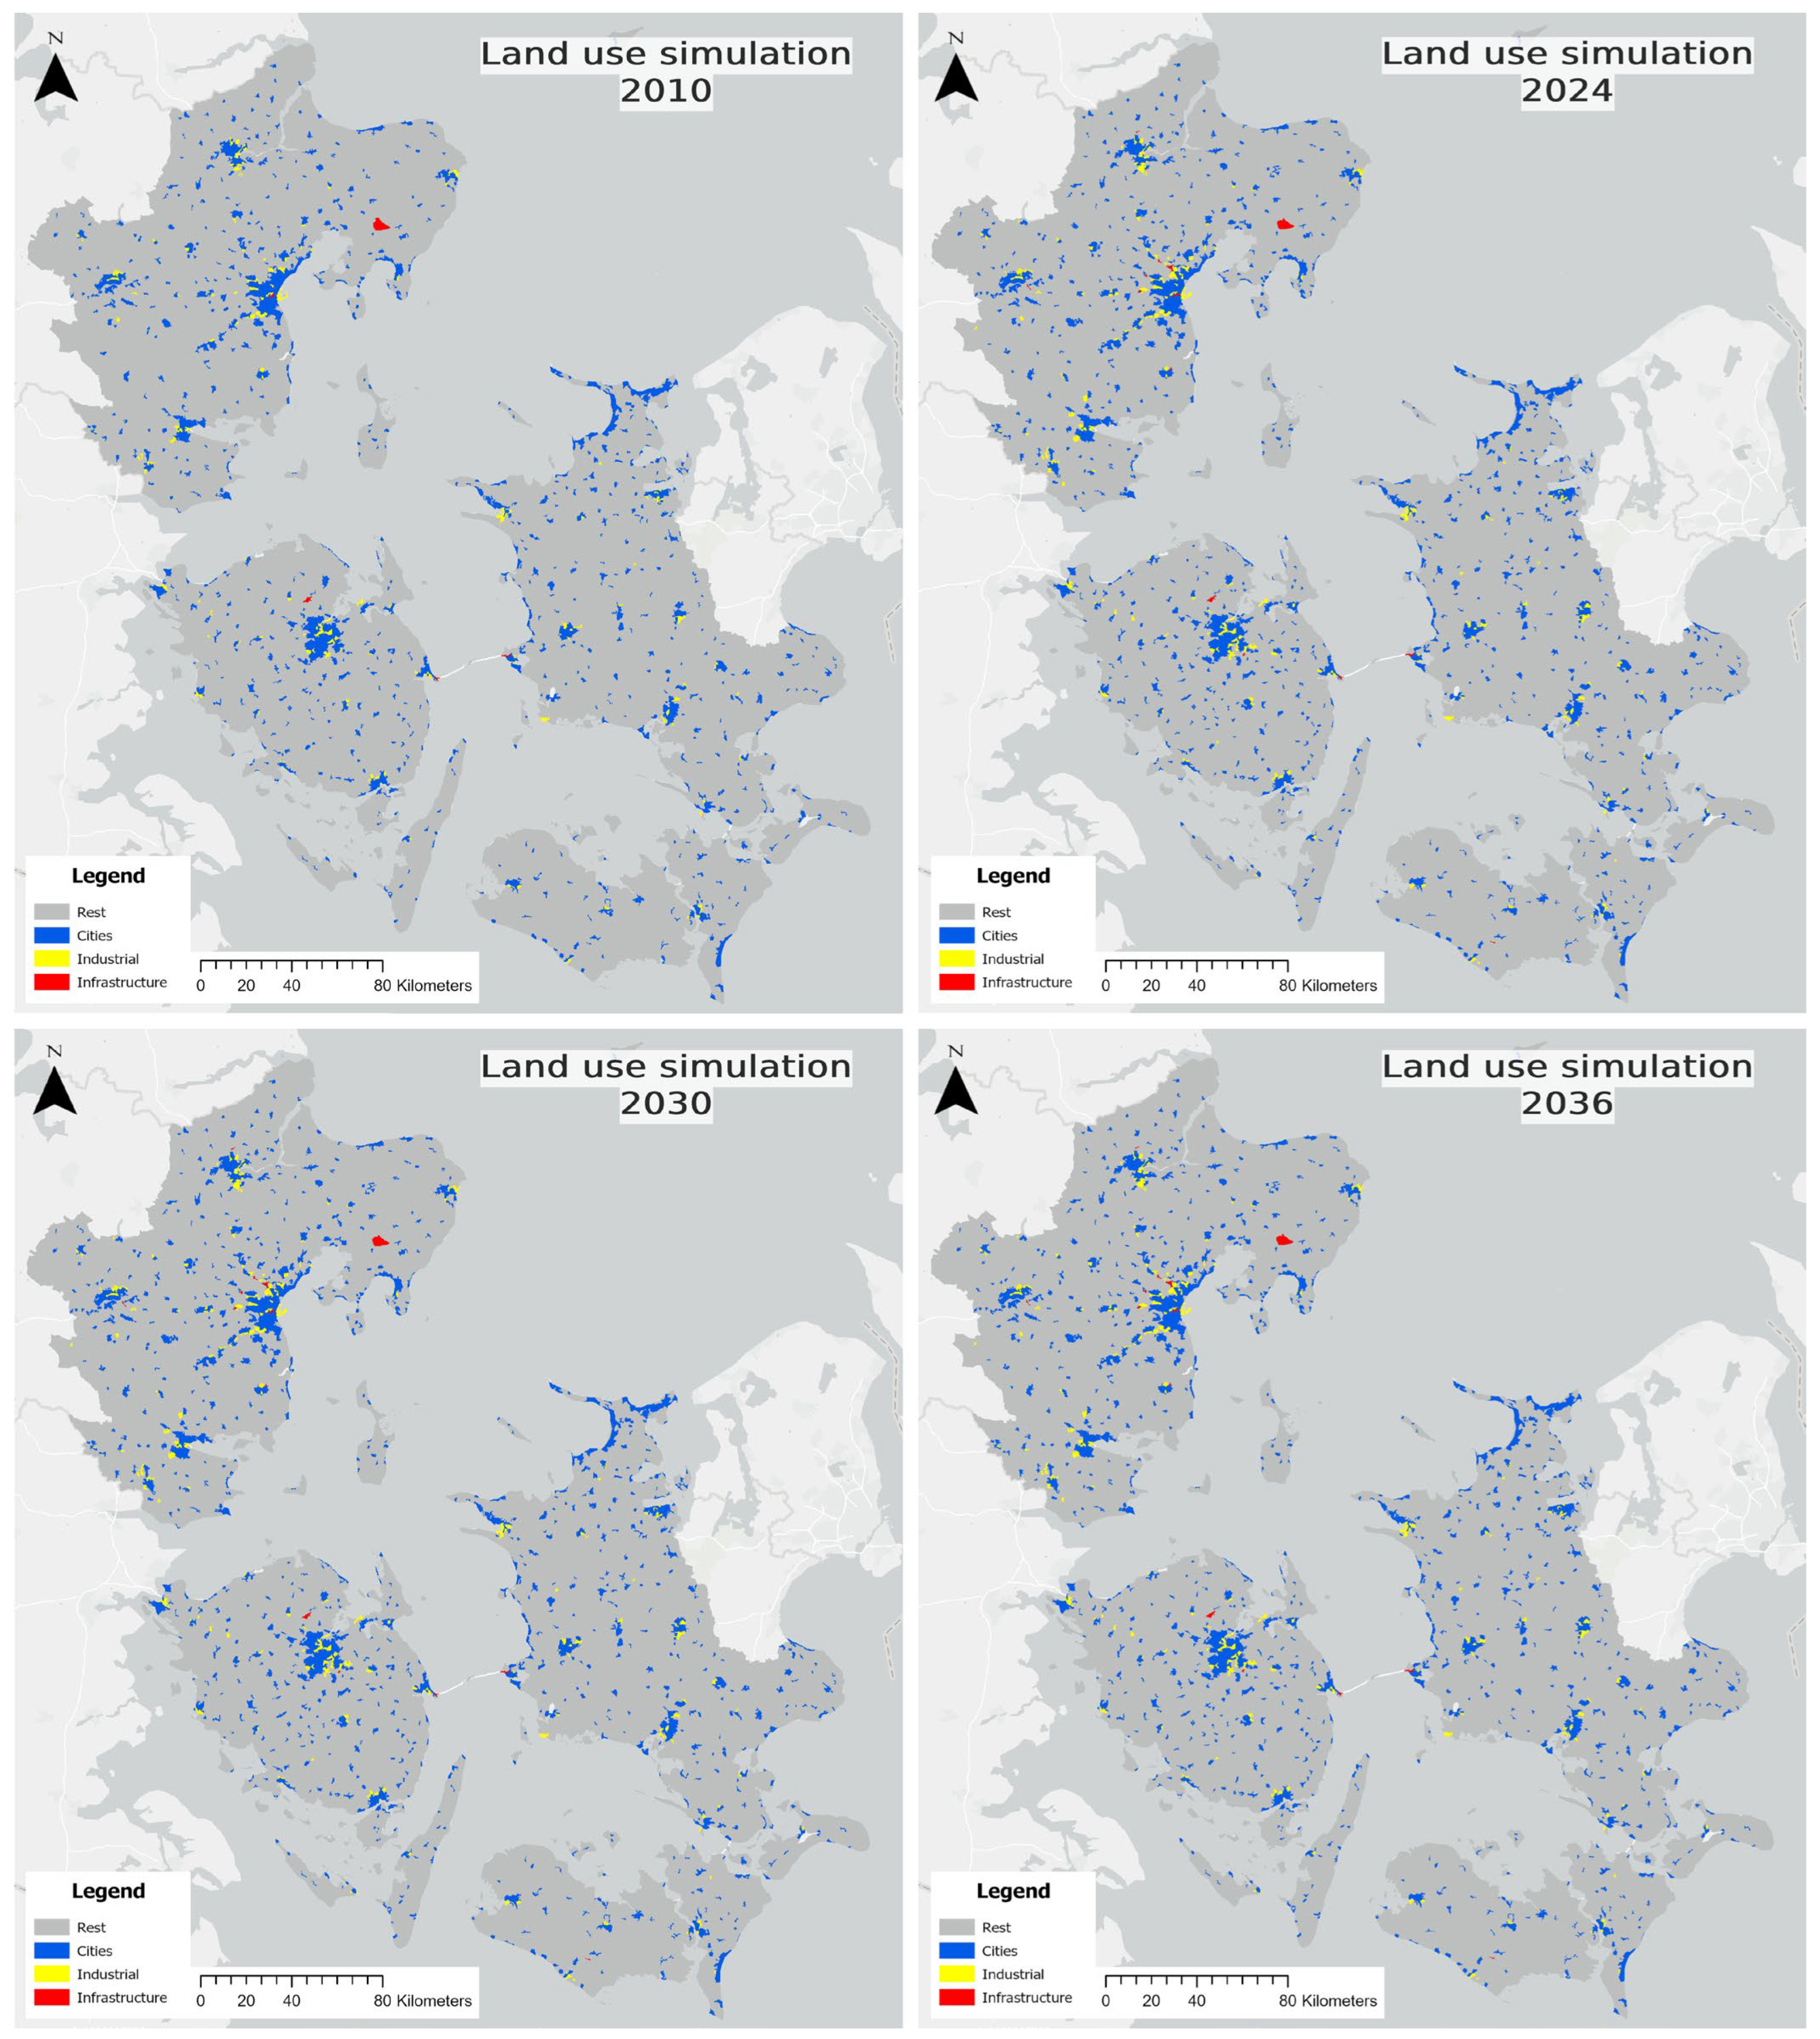
4.4. Land Use Prediction Modelling and Future Urban Expansion
5. Discussion
5.1. GBFL as a Mobility Enabler
5.2. Socio-Spatial Disparities and Urban Planning
5.3. Predictive Planning and Future Fixed Links
5.4. Methodological Considerations and Future Research Directions
6. Conclusions
Author Contributions
Funding
Data Availability Statement
Conflicts of Interest
References
- Verloo, N.; Bertolini, L. Seeing the City; Amsterdam University Press: Amsterdam, The Netherlands, 2020. [Google Scholar] [CrossRef]
- Sheller, M.; Urry, J. The New Mobilities Paradigm. Environ. Plan A 2006, 38, 207–226. [Google Scholar] [CrossRef]
- Odgaard, T.; Kolstrup, K.; Paag, H. Ex Post Samfundsøkonomisk Analyse af Storebæltsforbindelsen. 2014. Available online: www.incentive.dk (accessed on 6 November 2024).
- de Borger, B.; Mulalic, I.; Rouwendal, J. Productivity Effects of an Exogenous Improvement in Transport Infrastructure: Accessibility and the Great Belt Bridge. 2019. Available online: https://research.cbs.dk/en/publications/productivity-effects-of-an-exogenous-improvement-in-transport-inf (accessed on 6 April 2025).
- Mulalic, I.; De Borger, B.; Rouwendal, J. Productivity and Wage Effects of an Exogenous Improvement in Transport Infrastructure: Accessibility and the Great Belt Bridge. 2024. Available online: https://ssrn.com/abstract=5015669 (accessed on 6 April 2025).
- Sund & Bælt Holding; Transport Ministry. The Ministry of Transport A Brief Organisational Overview. Transport Ministry, Sund & Bælt Holding. Available online: https://www.trm.dk/media/5ejbc2af/organisational-overview-netversion-1.pdf (accessed on 6 April 2025).
- Sund & Baelt. Economic Importance of the Fixed Links. Sund & Bælt. Available online: https://sundogbaelt.dk/en/about-us/finance-economics/economic-importance-of-the-links/?utm_source=chatgpt.com (accessed on 14 April 2025).
- Galland, D.; Enemark, S. The Danish National Spatial Planning Framework Planning for States and Nation/States: A TransAtlantic Exploration. UCD Newman House, St Stephen’s Green. 2012. Available online: https://vbn.aau.dk/da/publications/the-danish-national-spatial-planning-framework (accessed on 13 April 2025).
- Banister, D. The sustainable mobility paradigm. Transp. Policy 2008, 15, 73–80. [Google Scholar] [CrossRef]
- Graham, S.; Marvin, S. Splintering Urbanism: Networked Infrastructures, Technological Mobilities and the Urban Condition; Routledge: London, UK, 2001; Available online: https://www.routledge.com/Splintering-Urbanism-Networked-Infrastructures-Technological-Mobilities-and-the-Urban-Condition/Graham-Marvin/p/book/9780415189651 (accessed on 14 April 2025).
- Geurs, K.T.; van Wee, B. Accessibility evaluation of land-use and transport strategies: Review and research directions. J. Transp. Geogr. 2004, 12, 127–140. [Google Scholar] [CrossRef]
- Chu, L.; Zou, Y.; Masiliūnas, D.; Blaschke, T.; Verbesselt, J. Assessing the impact of bridge construction on the land use/cover and socio-economic indicator time series: A case study of Hangzhou Bay Bridge. GIsci. Remote Sens. 2021, 58, 199–216. [Google Scholar] [CrossRef]
- Cai, J.; Deng, Z.; Li, L. The spatial impact of high bridges on travel accessibility and economic integration in Guizhou, China: A scenario-based analysis. Humanit. Soc. Sci. Commun. 2024, 11, 1565. [Google Scholar] [CrossRef]
- Rallis, T.; Meulengracht, K.; Vilhof, P. The organization of public transport in Denmark. Transp. Res. Part A Gen. 1984, 18, 163–175. [Google Scholar] [CrossRef]
- Leduc, S.; Wilson, D. Roads to prosperity or bridges to nowhere? Theory and evidence on the impact of public infrastructure investment. NBER Macroecon. Annu. 2012, 27, 89–142. [Google Scholar] [CrossRef]
- Fuglsang, M.; Münier, B.; Hansen, H.S. Modelling land-use effects of future urbanization using cellular automata: An Eastern Danish case. Environ. Model. Softw. 2013, 50, 1–11. [Google Scholar] [CrossRef]
- Tayyebi, A.; Pijanowski, B.C. Modeling multiple land use changes using ANN, CART and MARS: Comparing tradeoffs in goodness of fit and explanatory power of data mining tools. Int. J. Appl. Earth Obs. Geoinf. 2014, 28, 102–116. [Google Scholar] [CrossRef]
- LobbyFacts. The Danish Chamber of Commerce. Available online: https://www.lobbyfacts.eu/datacard/the-danish-chamber-of-commerce?rid=0330934426-12 (accessed on 15 April 2025).
- Cheng, J.; Bertolini, L.; Le Clercq, F. Measuring Sustainable Accessibility. Transp. Res. Rec. 2007, 2017, 16–25. [Google Scholar] [CrossRef]
- Pokharel, R.; Bertolini, L.; te Brömmelstroet, M. How does transportation facilitate regional economic development? A heuristic mapping of the literature. Transp. Res. Interdiscip. Perspect. 2023, 19, 100817. [Google Scholar] [CrossRef]
- Lind, N. A Development of the Human Development Index. Soc. Indic. Res. 2019, 146, 409–423. [Google Scholar] [CrossRef]
- Badowska, M.; Szkultecka-Dębek, M. Indicators affecting the quality of life of an individual and society. J. Health Policy Outcomes Res. 2023, 2023, 11–20. [Google Scholar] [CrossRef]
- Costanza, R.; Fisher, B.; Ali, S.; Beer, C.; Bond, L.; Boumans, R.; Danigelis, N.L.; Dickinson, J.; Elliott, C.; Farley, J.; et al. An integrative approach to quality of life measurement, research, and policy. Surv. Perspect. Integr. Environ. Soc. 2008, 1, 11–15. [Google Scholar] [CrossRef]
- Poul, S. Danmarks økonomi. Københavns Universitet. Available online: https://lex.dk/Danmarks_%C3%B8konomi (accessed on 14 April 2025).
- Yavuz, F.; Attanayake, U.; Aktan, H. Economic Impact on Surrounding Businesses due to Bridge Construction. Procedia. Comput. Sci. 2017, 109, 108–115. [Google Scholar] [CrossRef]
- Hybel, J.; Mulalic, I. Transportation and quality of life: Evidence from Denmark. Transp. Res. Part A Policy Pract. 2022, 157, 107–125. [Google Scholar] [CrossRef]
- Statistics Denmark. Home Equity. Available online: https://www.dst.dk/en/Statistik/emner/arbejde-og-indkomst/formue/husholdningernes-formue-i-fast-ejendom (accessed on 5 February 2024).
- Danish Ministry of Finance. Handlingsplan for FN’s Verdensmål. Available online: https://fm.dk/udgivelser/2021/juni/handlingsplan-for-fns-verdensmaal/ (accessed on 5 June 2025).
- Danish Chamber of Commerce. Hvad Ville du Gøre, Hvis du Mistede dit Job i Morgen? København. 2019. Available online: https://www.danskerhverv.dk/presse-og-nyheder/nyheder/2019/januar/analyse---hvor-langt-vil-du-pendle/ (accessed on 28 April 2024).
- Malmgren, C.A.; Christiansen, H. Transportvaneundersøgelsen: Faktaark om Pendling 2016-19. 2022. Available online: https://orbit.dtu.dk/en/publications/transportvaneunders%C3%B8gelsen-faktaark-om-pendling-2016-19 (accessed on 28 May 2025).
- Statistics Denmark. Statistics Denmark. Available online: https://www.dst.dk/en/Statistik/emner/borgere/befolkning/befolkningstal (accessed on 18 January 2023).
- Girma, R.; Fürst, C.; Moges, A. Land use land cover change modeling by integrating artificial neural network with cellular Automata-Markov chain model in Gidabo river basin, main Ethiopian rift. Environ. Chall. 2022, 6, 100419. [Google Scholar] [CrossRef]
- Ouma, Y.O.; Nkwae, B.; Odirile, P.; Moalafhi, D.B.; Anderson, G.; Parida, B.; Qi, J. Land-Use Change Prediction in Dam Catchment Using Logistic Regression-CA, ANN-CA and Random Forest Regression and Implications for Sustainable Land–Water Nexus. Sustainability 2024, 16, 1699. [Google Scholar] [CrossRef]
- Mahiny, S.; Clarke, K.C. Guiding SLEUTH land-use/land-cover change modeling using multicriteria evaluation: Towards dynamic sustainable land-use planning. Environ. Plan. B Plan. Des. 2012, 39, 925–944. [Google Scholar] [CrossRef]
- Abdullahi, S.; Pradhan, B. Land use change modeling and the effect of compact city paradigms: Integration of GIS-based cellular automata and weights-of-evidence techniques. Environ. Earth Sci. 2018, 77, 251. [Google Scholar] [CrossRef]
- Ren, J.; Wang, H. Calculus and optimization. Math. Methods Data Sci. 2023, 51–89. Available online: https://www.sciencedirect.com/science/article/abs/pii/B9780443186790000090 (accessed on 13 April 2025).
- Hyndman, R.J.; Athanasopoulos, G. Forecasting: Principles and Practice, 2nd ed.; OTexts: Melbourne, Australia, 2018; Available online: https://otexts.com/fpp2/ (accessed on 1 March 2024).
- Foody, G.M. Status of land cover classification accuracy assessment. Remote Sens. Environ. 2002, 80, 185–201. [Google Scholar] [CrossRef]
- Smits, P.C.; Dellepiane, S.G.; Schowengerdt, R.A. Quality assessment of image classification algorithms for land-cover mapping: A review and a proposal for a cost-based approach. Int. J. Remote Sens. 1999, 20, 1461–1486. [Google Scholar] [CrossRef]
- Yang, X.; Chen, R.; Zheng, X.Q. Simulating land use change by integrating ANN-CA model and landscape pattern indices. Geomat. Nat. Hazards Risk 2016, 7, 918–932. [Google Scholar] [CrossRef]
- Christiansen, H.; Baescu, O. The Danish National Travel Survey; DTU Management: Copenhagen, Denmark, 2021. [Google Scholar] [CrossRef]
- Giménez-Nadal, J.I.; Molina, J.A.; Velilla, J. Trends in commuting time of European workers: A cross-country analysis. Transp. Policy 2022, 116, 327–342. [Google Scholar] [CrossRef]
- The Danish Ministry of Transport. Cost–Benefit Analysis of the Fehmarn Belt Fixed Link. Copenhagen, 2015. Available online: https://www.trm.dk/media/kpgnkcru/eng-rapport-samfundsoekonomi-femern-incentive.pdf?utm_source=chatgpt.com (accessed on 4 February 2024).
- Phan, D.C.; Truong, L.T. Traffic Congestion and Safety: Mixed Effects on Total and Fatal Crashes. Sustainability 2024, 16, 8911. [Google Scholar] [CrossRef]
- Gibbons, S.; Machin, S. Valuing rail access using transport innovations. J. Urban Econ. 2005, 57, 148–169. [Google Scholar] [CrossRef]
- Jayantha, W.M.; Lam, T.I.; Chong, M.L. The impact of anticipated transport improvement on property prices: A case study in Hong Kong. Habitat Int. 2015, 49, 148–156. [Google Scholar] [CrossRef]
- Harvey, D. The Condition of Postmodernity an Enquiry into the Origins of Cultural Change British Library Cataloguing in Publication Data; Blackwell: Oxford, UK, 1989. [Google Scholar]
- Janelle, D.G. SPATIAL REORGANIZATION: A MODEL AND CONCEPT1. Ann. Assoc. Am. Geogr. 1969, 59, 348–364. [Google Scholar] [CrossRef]
- Sheller, M. Mobility Justice: The Politics of Movement in an Age of Extremes; Verso: London, UK, 2018; Available online: https://lib.ugent.be/catalog/rug01:002811249 (accessed on 16 April 2025).
- Sheller, M. Mobility justice. In Handbook of Research Methods and Applications for Mobilities; Edward Elgar Publishing: Cheltenham, UK, 2020. [Google Scholar] [CrossRef]
- Lucas, K. Transport and social exclusion: Where are we now? Transp. Policy 2012, 20, 105–113. [Google Scholar] [CrossRef]
- Næss, P.; Volden, G.H.; Odeck, J.; Richardson, T.K. Neglected and Underestimated Negative Impacts of Transport Investments. Helsinki, 2017. Available online: https://app.cristin.no/results/show.jsf?id=1530296 (accessed on 5 June 2025).
- Bertolini, L. Planning the Mobile Metropolis: Transport for People, Places and the Planet; Palgrave: London, UK, 2017; Available online: https://www.rsc.ox.ac.uk/files/files-1/wp96-civitas-polis-urbs-2013.pdf (accessed on 5 June 2023).
- Wendt, L. Afgiften på Storebæltsbroen er en Økonomisk mur, der Deler Danmark i to. Information, Copenhagen, 26 March 2019. Available online: https://www.information.dk/debat/2019/03/afgiften-paa-storebaeltsbroen-oekonomisk-mur-deler-danmark-to (accessed on 16 April 2025).
- Vickerman, R. Transit investment and economic development. Res. Transp. Econ. 2008, 23, 107–115. [Google Scholar] [CrossRef]
- Gibbons, S.; Lyytikäinen, T.; Overman, H.G.; Sanchis-Guarner, R. New road infrastructure: The effects on firms. J. Urban Econ. 2019, 110, 35–50. [Google Scholar] [CrossRef]
- Elburz, Z.; Nijkamp, P.; Pels, E. Public infrastructure and regional growth: Lessons from meta-analysis. J. Transp. Geogr. 2017, 58, 1–8. [Google Scholar] [CrossRef]
- Bertolini, L. Integrating Mobility and Urban Development Agendas: A Manifesto. disP Plan. Rev. 2012, 48, 16–26. [Google Scholar] [CrossRef]
- Eggers, F.J.; Moumen, F.; Econometrica, Inc. Impact of Moving and Job Changes on Commuting Time. 2005. Available online: https://www.census.gov/programs-surveys/ahs/research/publications/Moving_and_Commuting.html (accessed on 14 April 2025).
- Knowles, R.D.; Matthiessen, C.W. Barrier effects of international borders on fixed link traffic generation: The case of Øresundsbron. J. Transp. Geogr. 2009, 17, 155–165. [Google Scholar] [CrossRef]

| Name | Source | Year | Purpose |
|---|---|---|---|
| DAGI | Datafordeler | 2023 | Defining municipal boundaries for zonal statistics |
| Road network | Open Historical Map | 2015–2024 | Infrastructure development timelines and spatial interaction modelling |
| Commuting times | GIS OPS UG | 2024 | Isochrone modelling and accessibility analysis around the GBFL |
| CORINE | Copernicus | 1986–2018 | Land cover classification used as base for land use change modelling |
| Soil types | Aarhus University | 1970 | Environmental constraints in land use modelling |
| Creeks and streams | Geofabrik | 2024 | Hydrological features in spatial prediction models |
| Slope | GEBCO | 2024 | Physical geography input for land suitability modelling |
| Population | DST and ISM | 2024 | Demographic pressure and migration patterns |
| Unemployment rates | DST | 2024 | Socio-economic disparity and labour market accessibility |
| Housing prices | Finance Denmark | 2024 | Urban expansion and residential mobility trends |
| Year | Number of Pixels in Urban Areas | Number of Pixels in Municipalities | Urban Areas in Percentage | Number of Pixels in Urban Areas in DK | Number of Pixels in DK | Urban Areas in Percentage in DK |
|---|---|---|---|---|---|---|
| 1990–2000 | 29,611 | 412,874 | 7.17% | 289,143 | 4,292,914 | 6.74% |
| 2000–2006 | 31,059 | 412,874 | 7.52% | 303,530 | 4,292,914 | 7.07% |
| 2006–2012 | 34,493 | 412,874 | 8.35% | 324,130 | 4,292,914 | 7.55% |
| 2012–2018 | 36,450 | 412,874 | 8.83% | 343,190 | 4,292,914 | 7.99% |
Disclaimer/Publisher’s Note: The statements, opinions and data contained in all publications are solely those of the individual author(s) and contributor(s) and not of MDPI and/or the editor(s). MDPI and/or the editor(s) disclaim responsibility for any injury to people or property resulting from any ideas, methods, instructions or products referred to in the content. |
© 2025 by the authors. Licensee MDPI, Basel, Switzerland. This article is an open access article distributed under the terms and conditions of the Creative Commons Attribution (CC BY) license (https://creativecommons.org/licenses/by/4.0/).
Share and Cite
Kveladze, I.; Lund, R.F.; Kjeller, S.H. Assessing Mobility-Driven Socio-Economic Impacts on Quality of Life in Small Urban Areas: A Case Study of the Great Belt Fixed Link Corridor. Urban Sci. 2025, 9, 238. https://doi.org/10.3390/urbansci9070238
Kveladze I, Lund RF, Kjeller SH. Assessing Mobility-Driven Socio-Economic Impacts on Quality of Life in Small Urban Areas: A Case Study of the Great Belt Fixed Link Corridor. Urban Science. 2025; 9(7):238. https://doi.org/10.3390/urbansci9070238
Chicago/Turabian StyleKveladze, Irma, Rie Friberg Lund, and Sisse Holmsted Kjeller. 2025. "Assessing Mobility-Driven Socio-Economic Impacts on Quality of Life in Small Urban Areas: A Case Study of the Great Belt Fixed Link Corridor" Urban Science 9, no. 7: 238. https://doi.org/10.3390/urbansci9070238
APA StyleKveladze, I., Lund, R. F., & Kjeller, S. H. (2025). Assessing Mobility-Driven Socio-Economic Impacts on Quality of Life in Small Urban Areas: A Case Study of the Great Belt Fixed Link Corridor. Urban Science, 9(7), 238. https://doi.org/10.3390/urbansci9070238