
The Typology of Urban Polycentricity: A Comparative Study of Firm Distribution in 35 Chinese Cities


Abstract
1. Introduction
2. Materials and Methods
2.1. Data Acquisition
2.2. Methodology
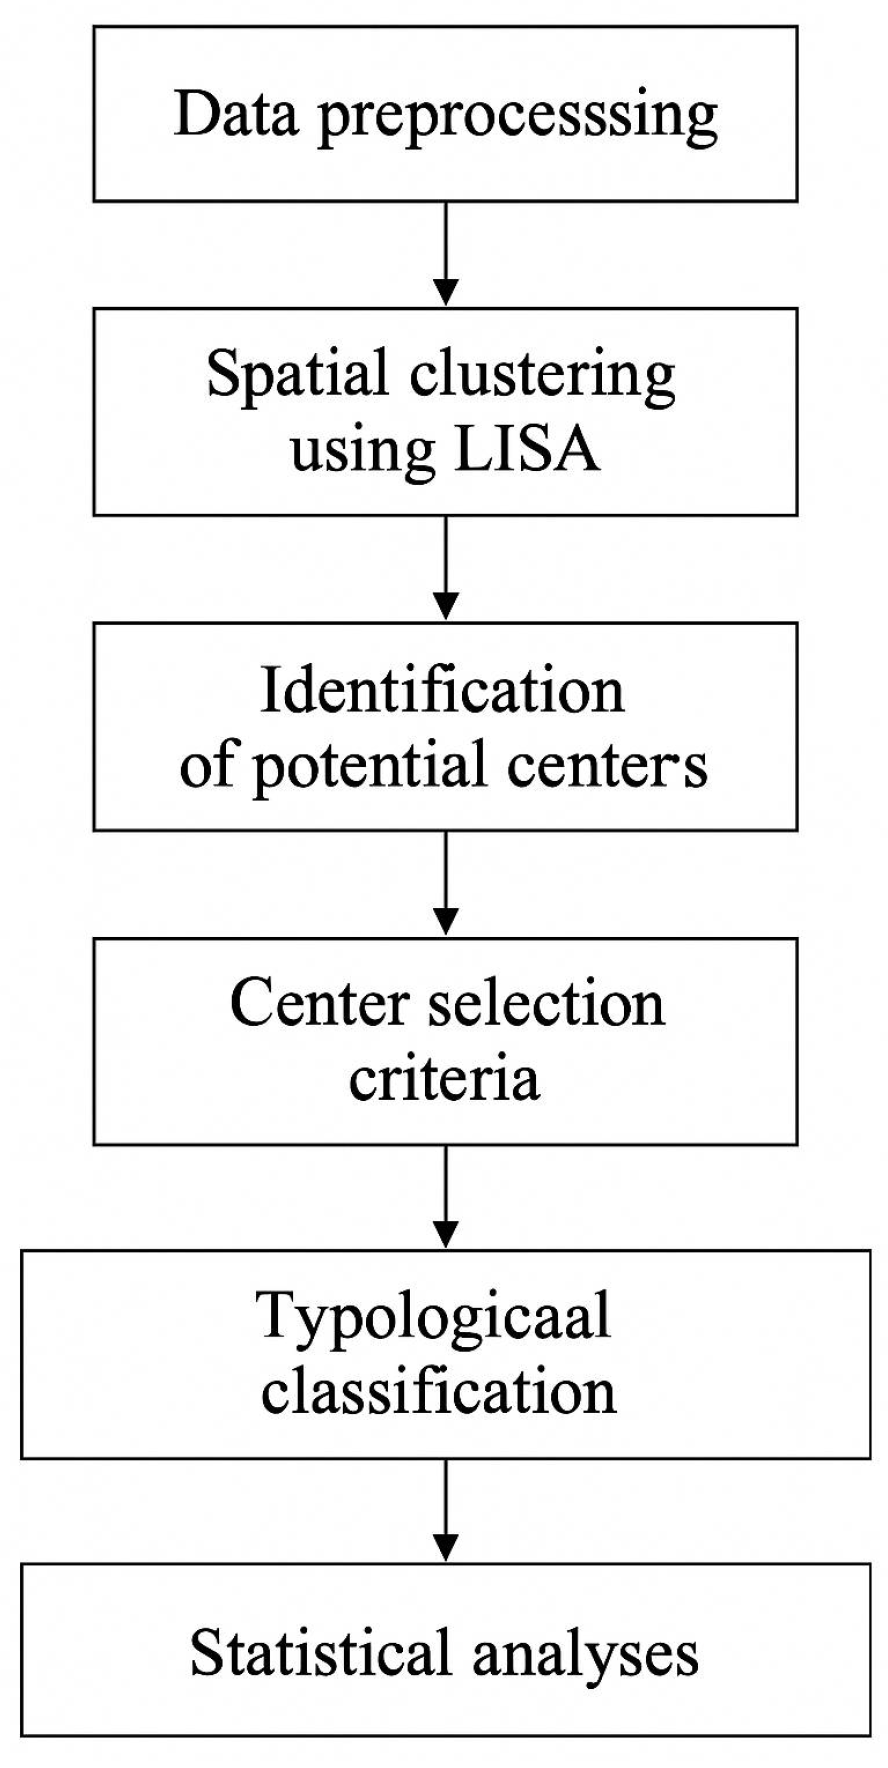
2.2.1. Urban Center Identification
- (1)
- (2)
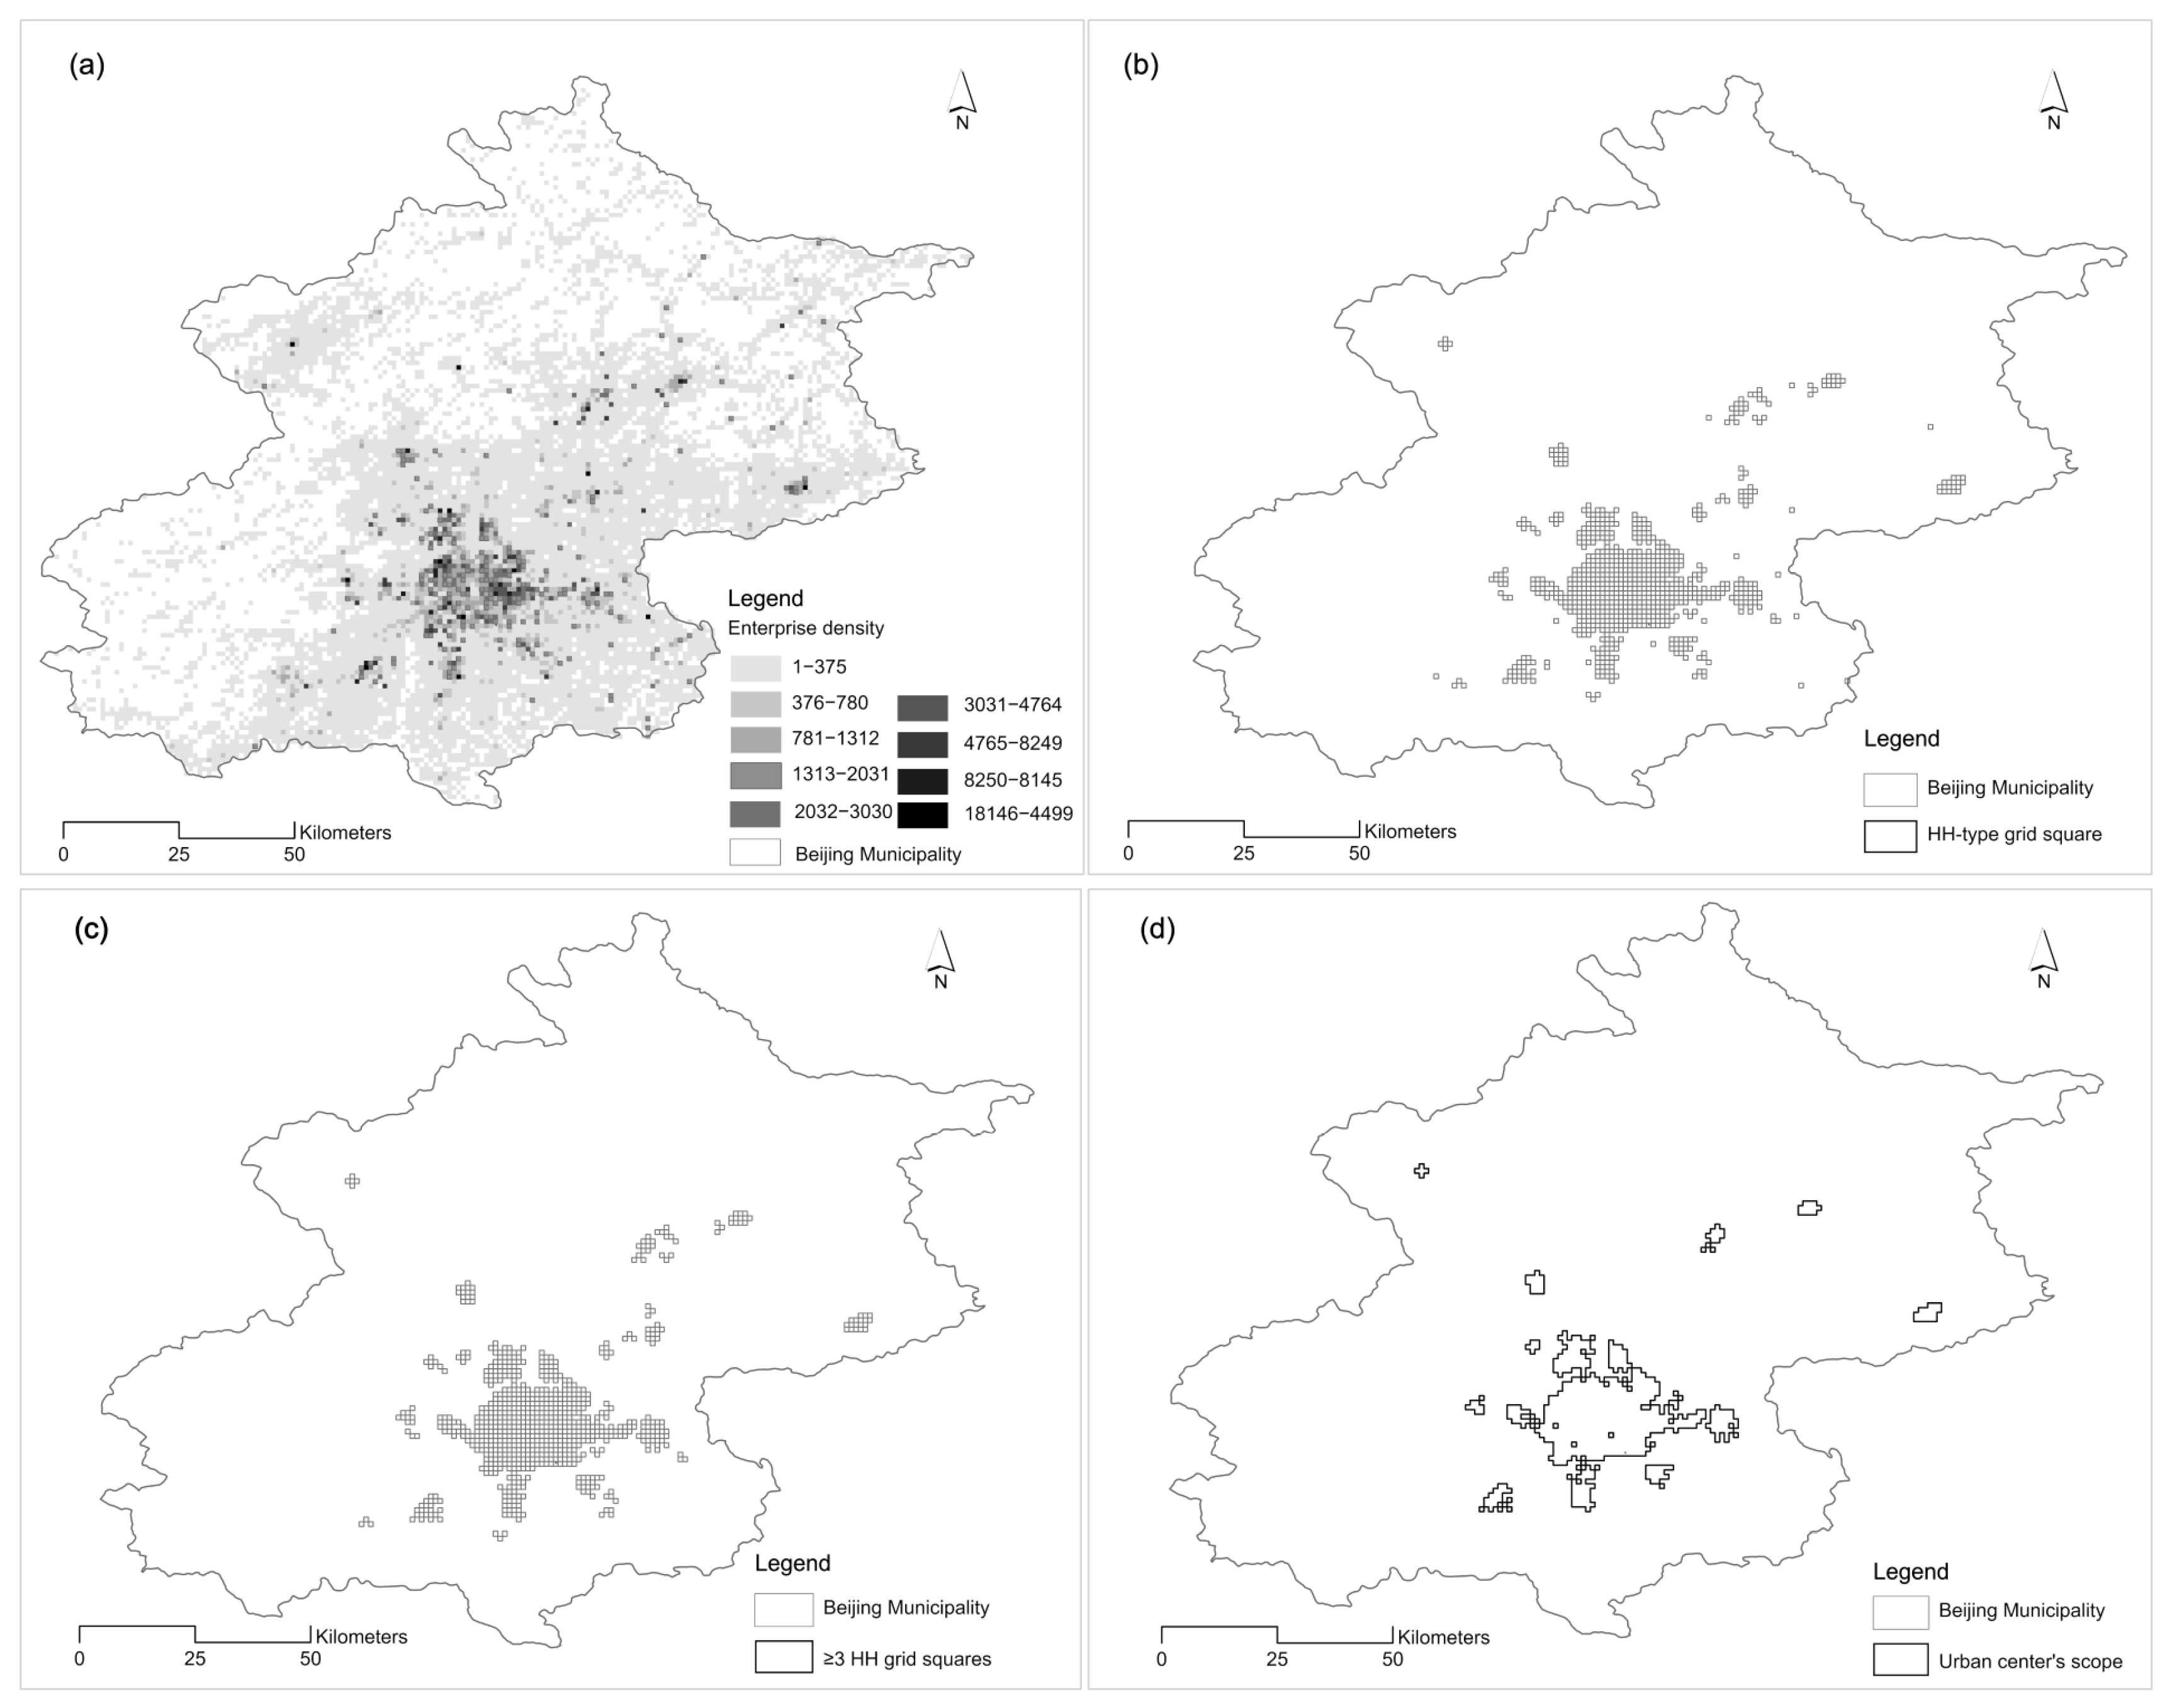
- Screening potential centers. To minimize the subjective bias arising from artificially defining the scope of subcenters, we employed 499 random permutations, specifically selecting grids with LISA values that were statistically significant at the 95% confidence interval [37,38]. The grid squares were divided into four categories: (1) high firm-density grid squares surrounded by high-density grid squares (HH); (2) low firm-density grid squares surrounded by low-density grid squares (LL); (3) high firm-density grid squares surrounded by low-density grid squares (HL); and (4) low-density firm grid squares surrounded by high-density grid squares (LH). Following the definition of urban centers used in this study, HH-type grid squares were retained as potential firm centers. Based on the criterion that urban centers should form a continuous area, HH-type grid squares with adjacent edges were screened using the vehicle adjacency principle (Figure 2b).
- (3)
- Defining the scope of the urban center. In this study, we adopt a threshold-based method to delineate the spatial extent of urban centers. This approach is widely used in similar research due to its advantages in consistency, repeatability, and operational simplicity [18,34,39]. Regarding the specific threshold, we refer to benchmark values employed in the literature for identifying employment centers (see Table 2). A threshold of 10 jobs per hectare and a minimum of 10,000 total jobs has commonly been used to define employment centers, with later studies refining this by including labor-force ratios [20,40,41,42,43].
2.2.2. Comparison Indicators
2.2.3. LOWESS
3. Results
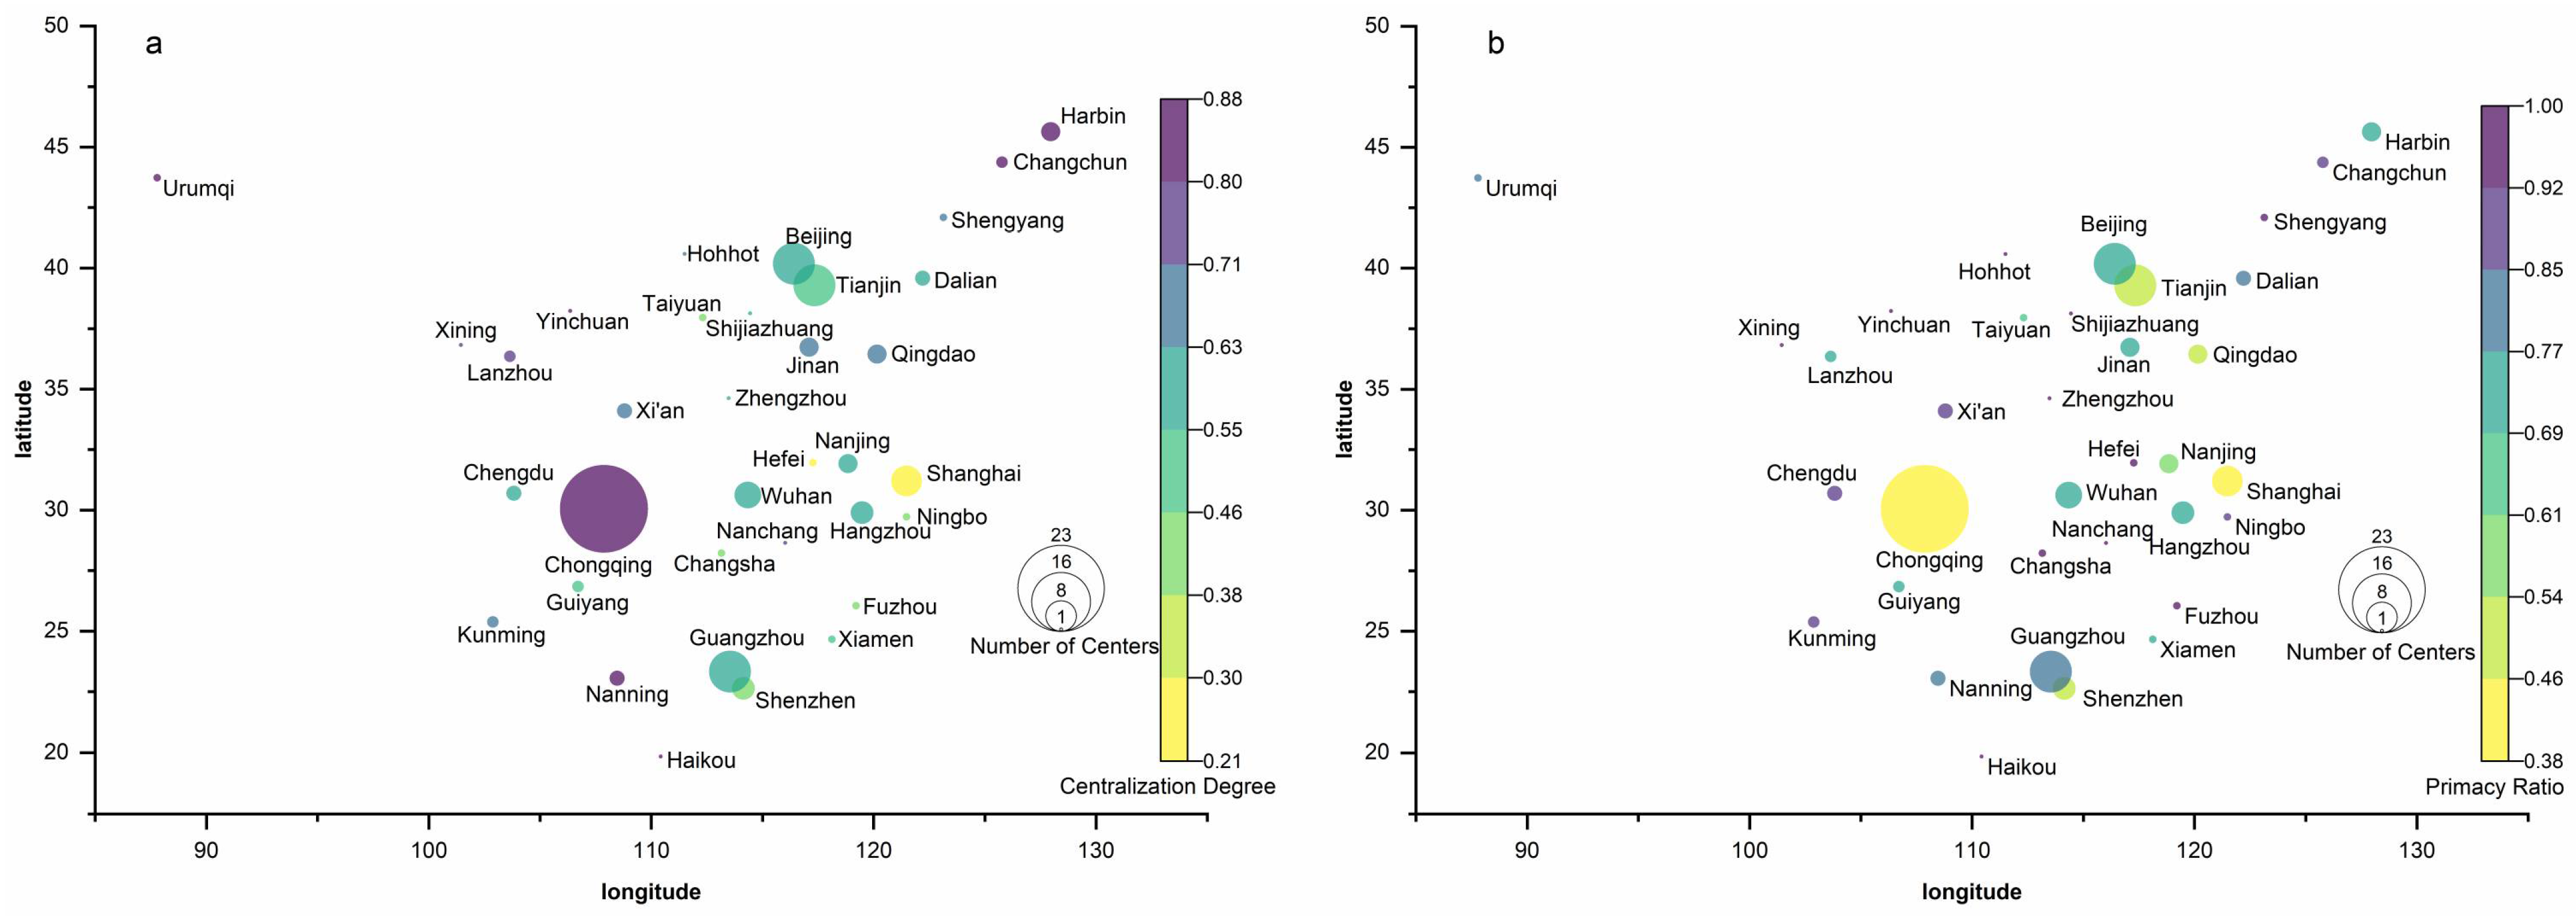
3.1. The Number of Centers, Centralization Degree, and Primacy Ratio
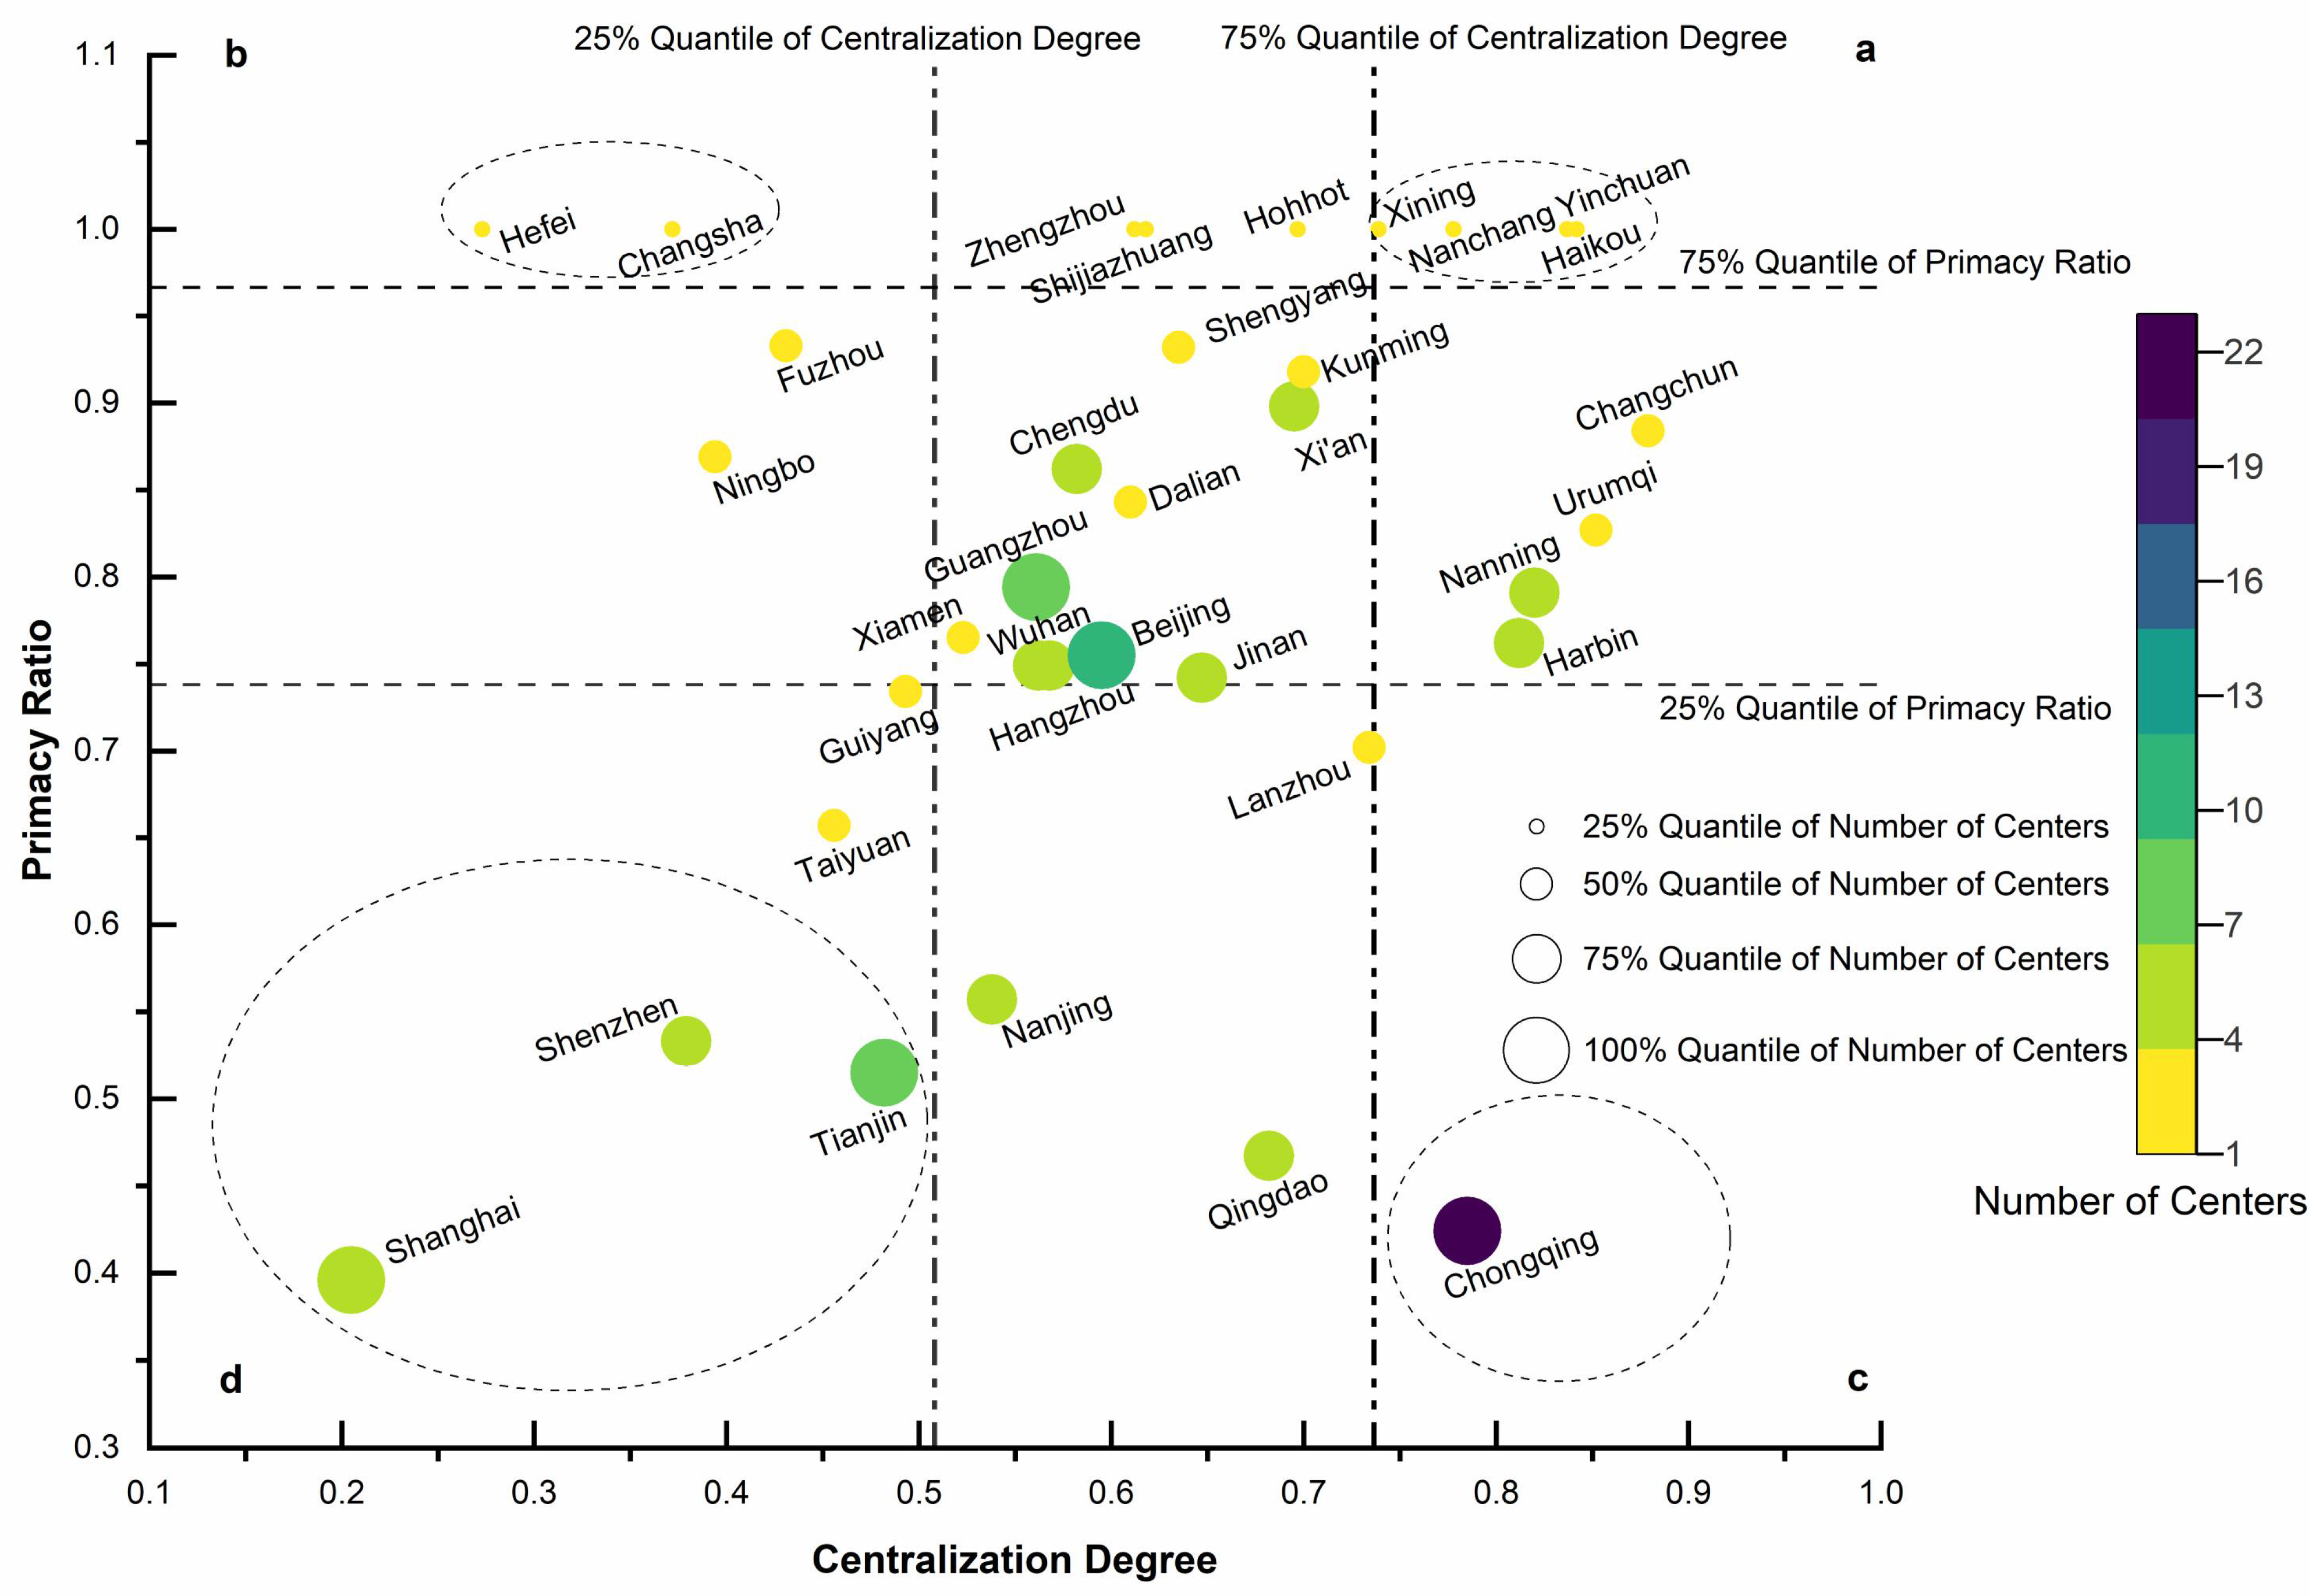
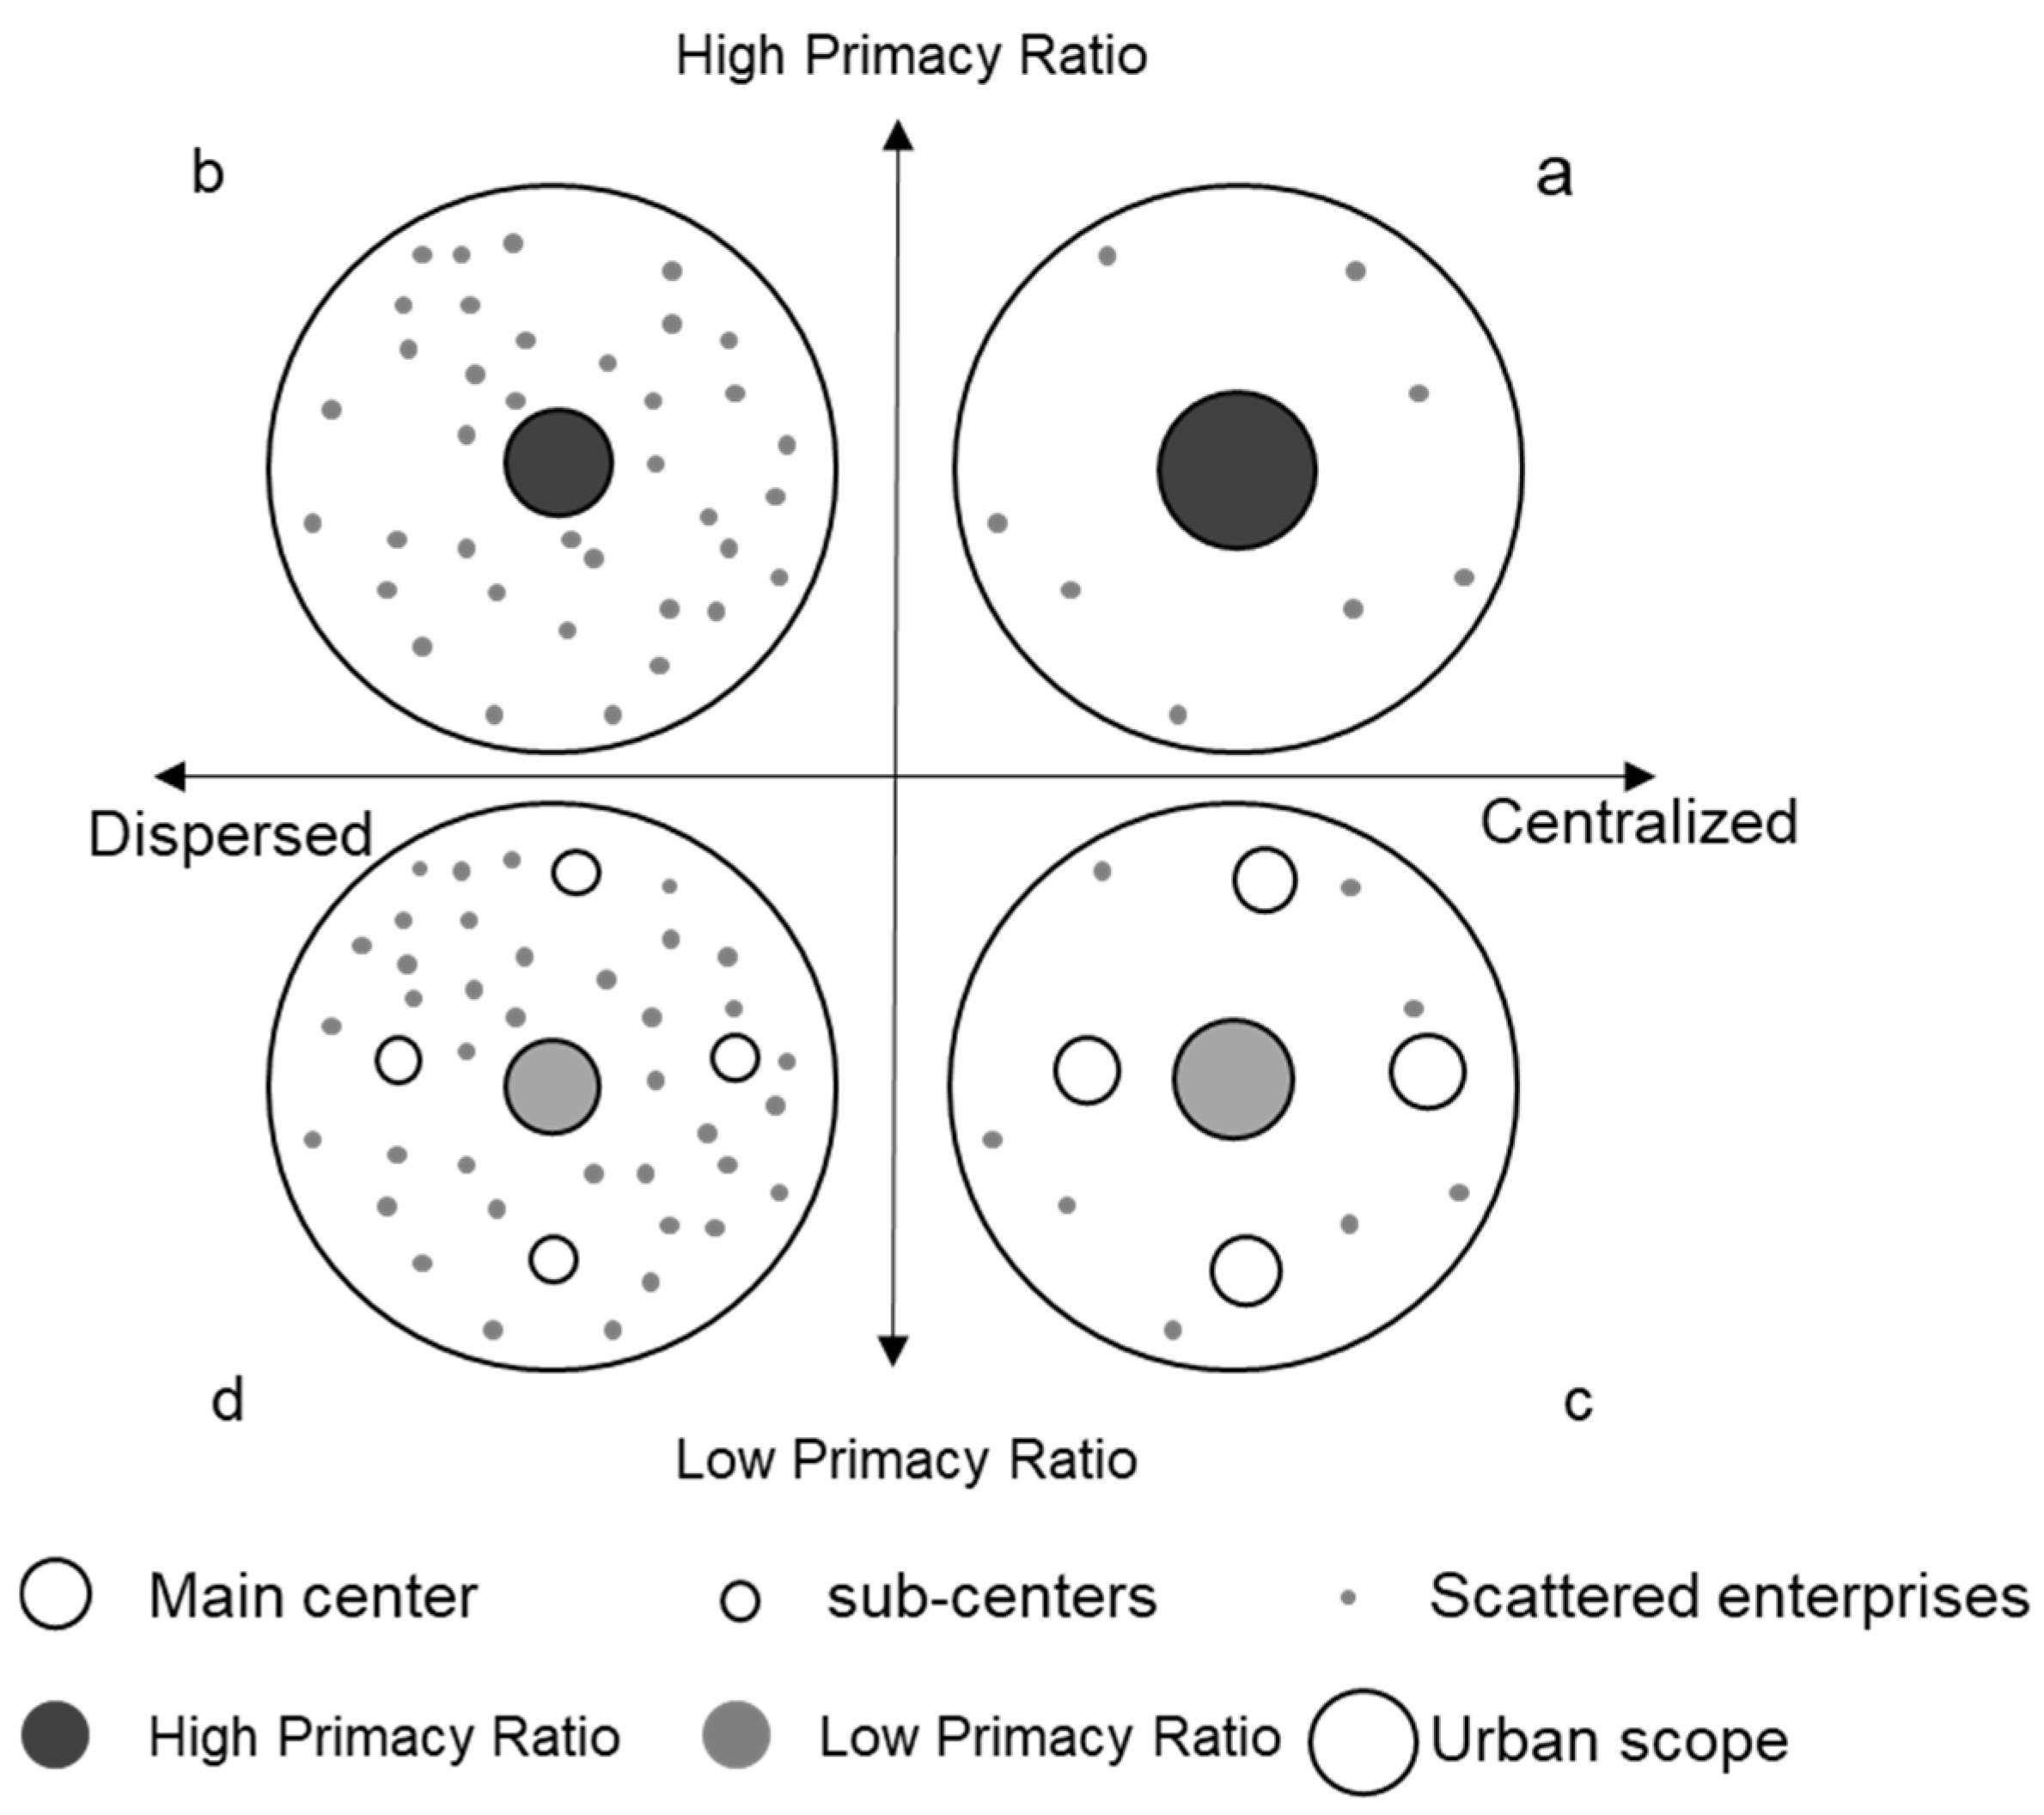
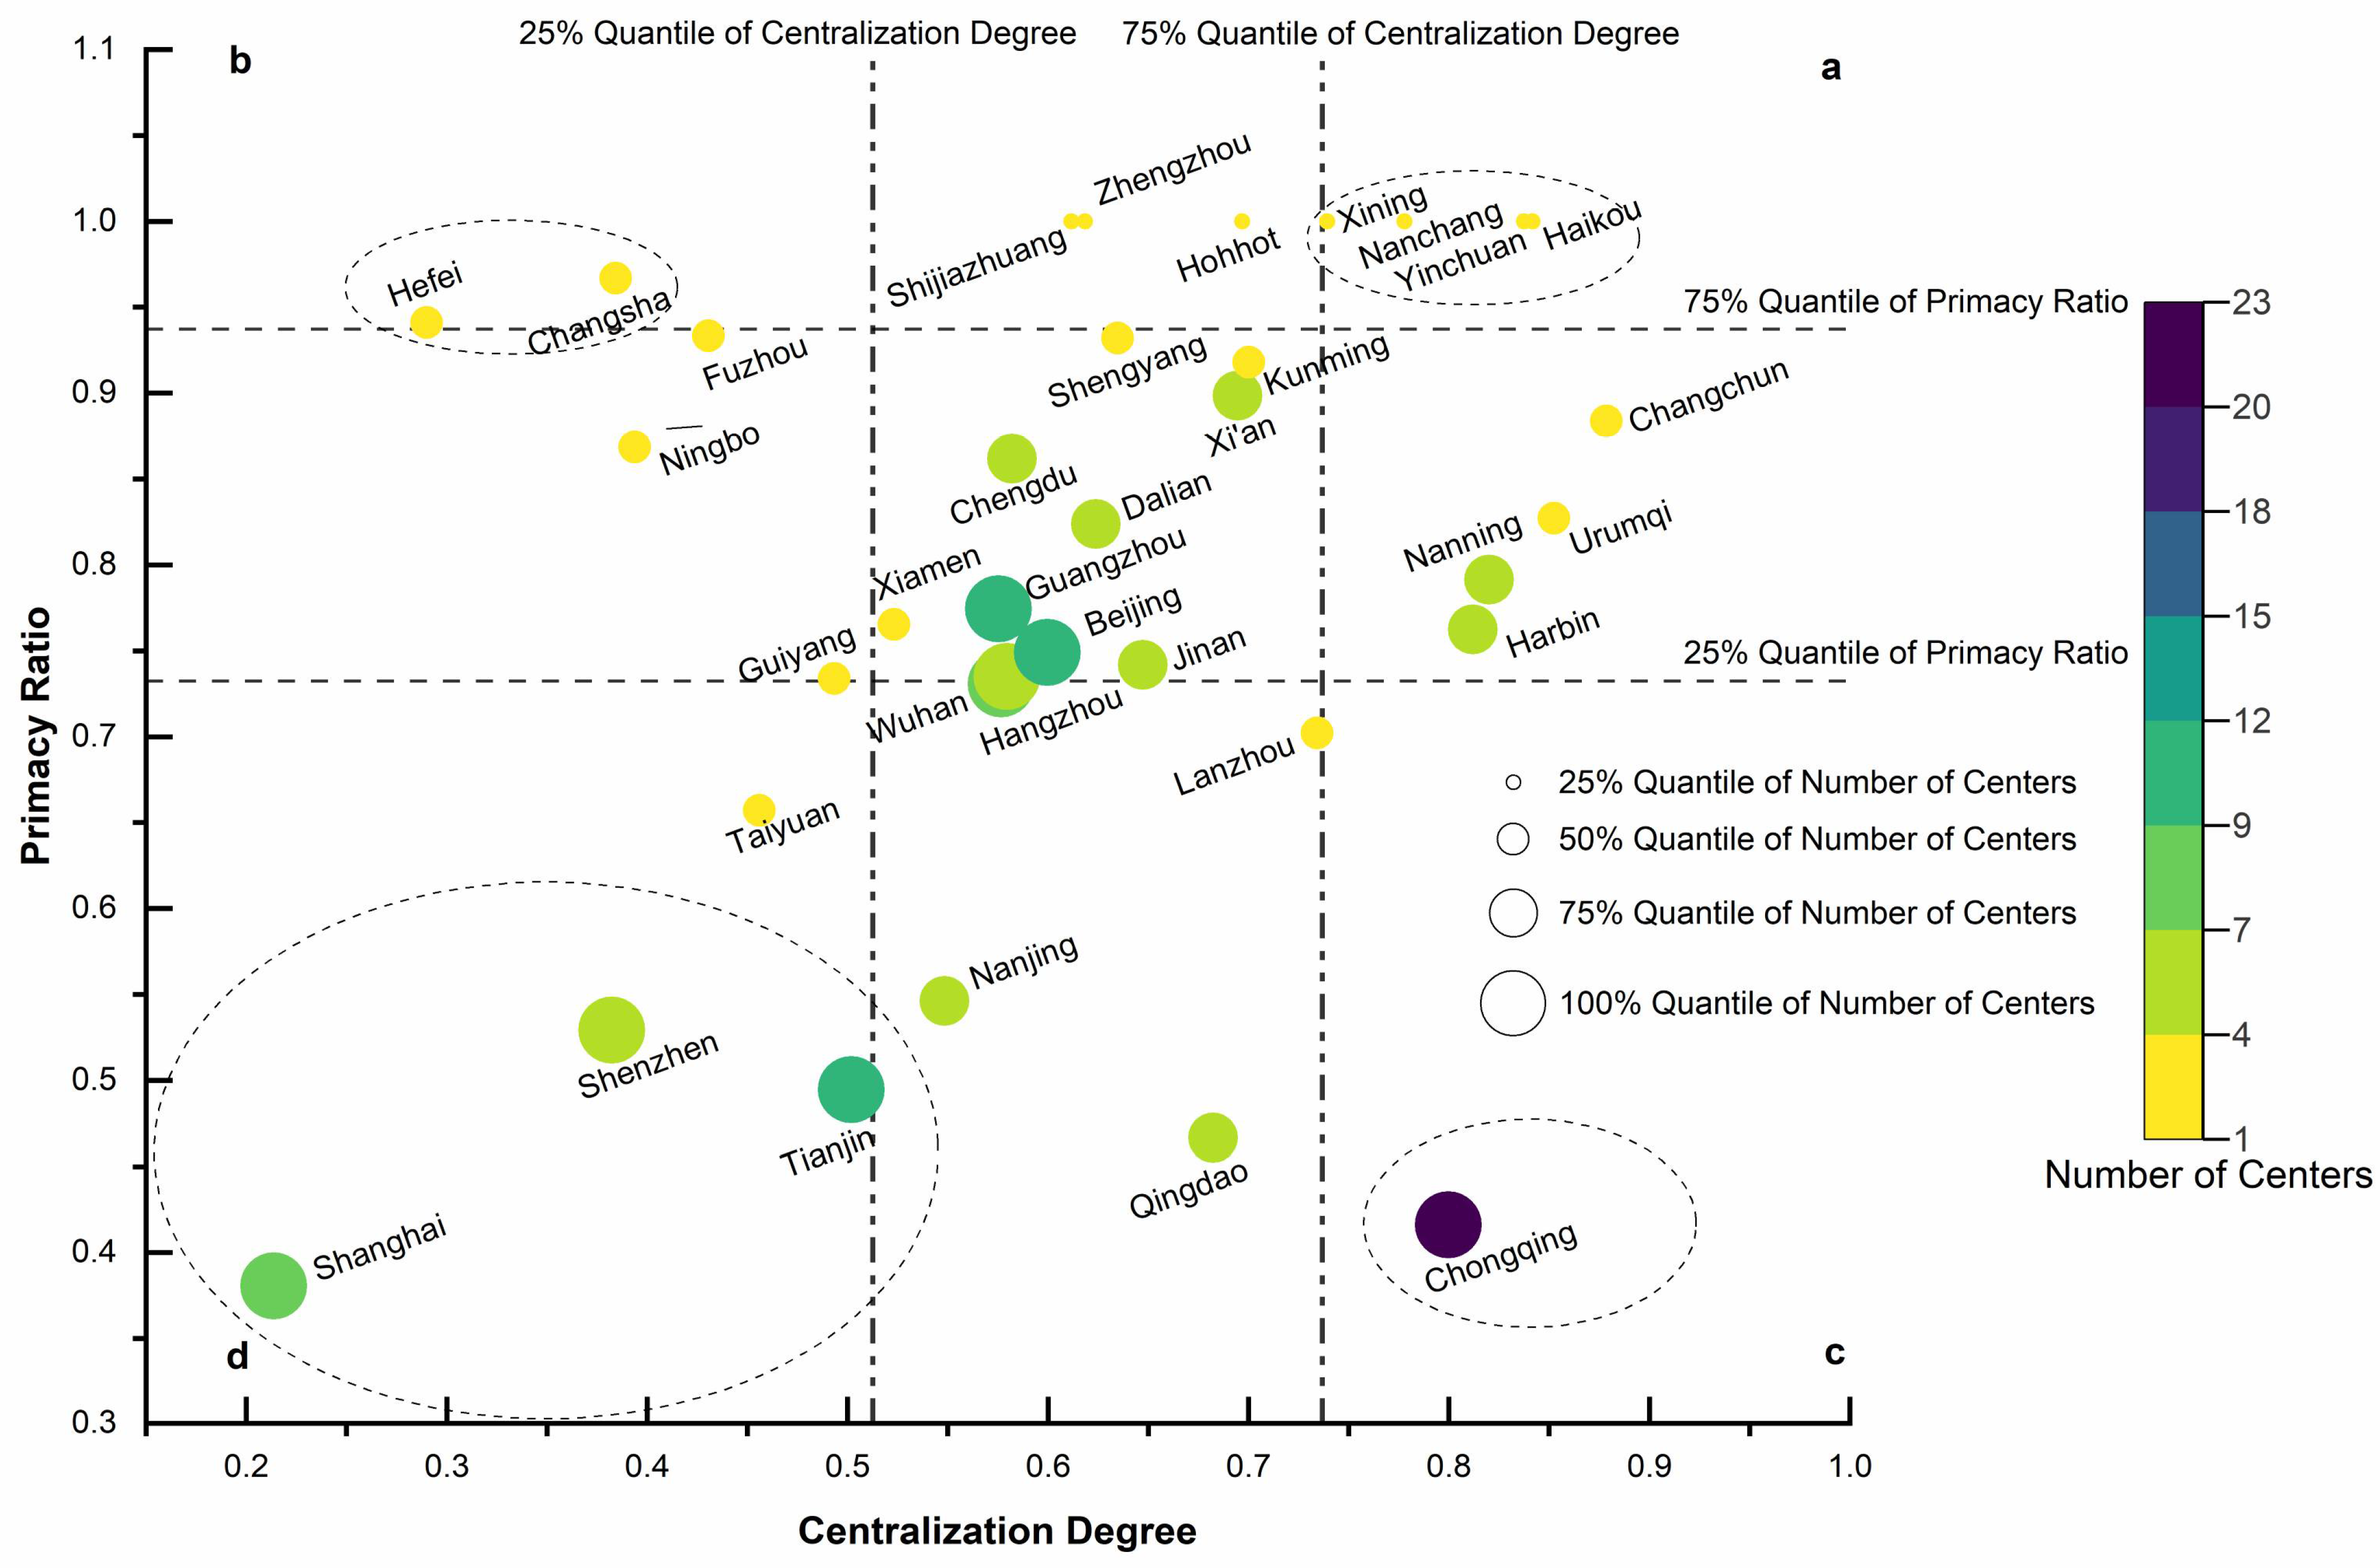
3.2. The Typology of Polycentric Urban Spatial Structure
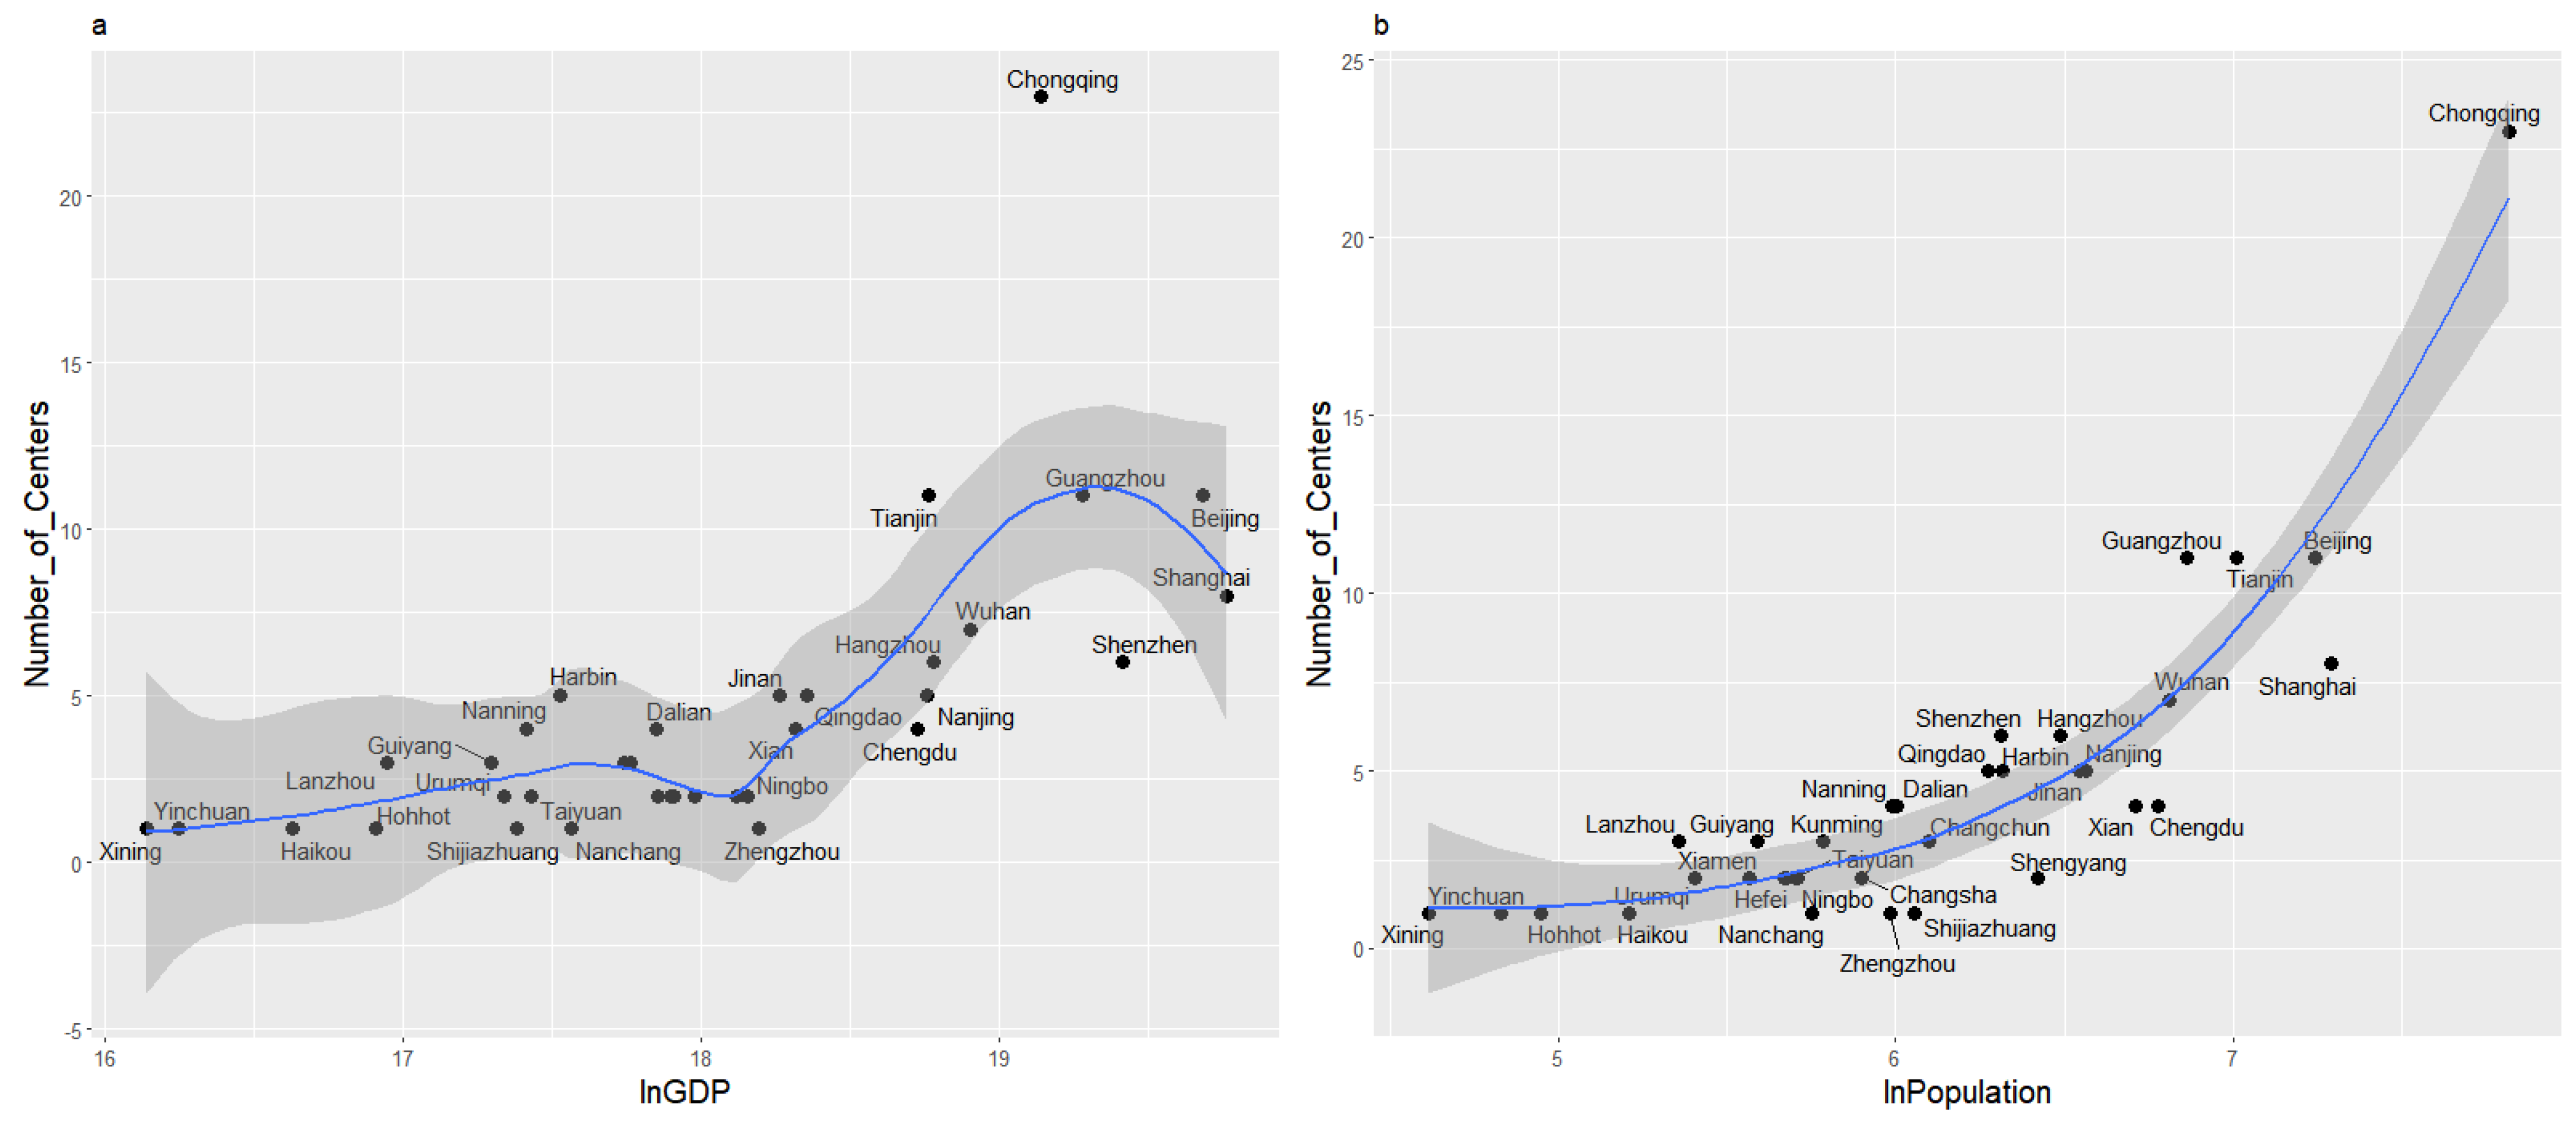
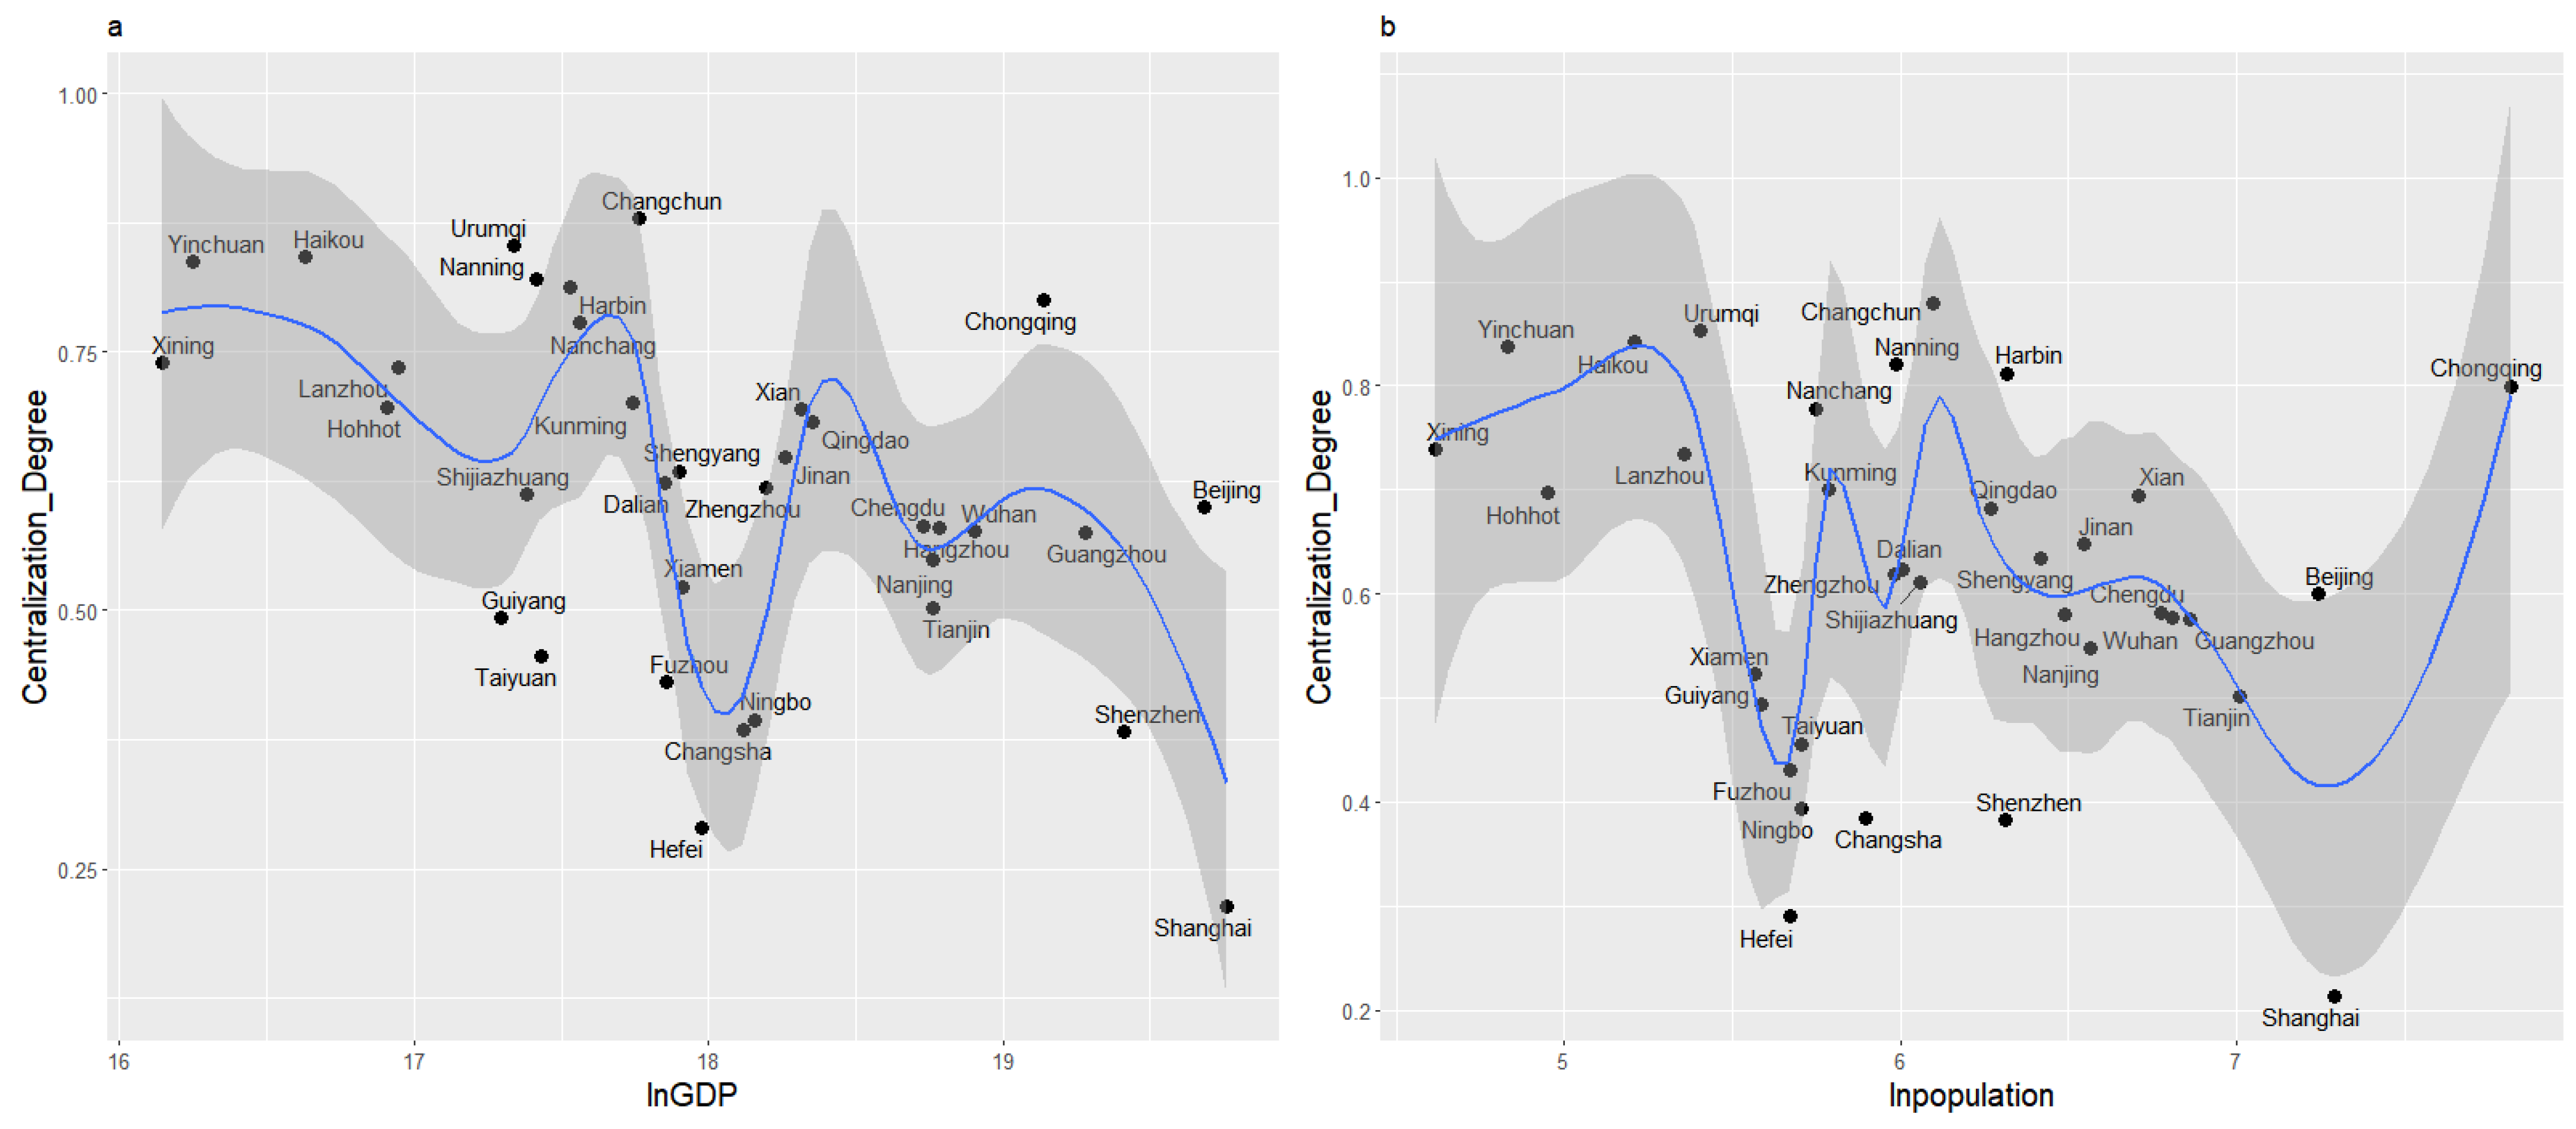
3.3. The Factors Associated with the Urban Polycentricity Typology
4. Discussion
5. Conclusions
Author Contributions
Funding
Data Availability Statement
Conflicts of Interest
Appendix A

| City | Number of Centers | Centralization Degree | Primacy Ratio | Change in Centers Compared with 10,000-Firm Threshold |
|---|---|---|---|---|
| Shanghai | 6 | 0.205 | 0.396 | −2 |
| Hefei | 1 | 0.273 | 1 | −1 |
| Shenzhen | 5 | 0.379 | 0.533 | −1 |
| Changsha | 1 | 0.372 | 1 | −1 |
| Ningbo | 2 | 0.394 | 0.869 | Unchanged |
| Fuzhou | 2 | 0.431 | 0.933 | Unchanged |
| Taiyuan | 2 | 0.456 | 0.657 | Unchanged |
| Guiyang | 3 | 0.493 | 0.734 | Unchanged |
| Tianjin | 9 | 0.482 | 0.515 | −2 |
| Xiamen | 2 | 0.523 | 0.765 | Unchanged |
| Nanjing | 4 | 0.538 | 0.557 | −1 |
| Guangzhou | 8 | 0.561 | 0.794 | −3 |
| Wuhan | 5 | 0.562 | 0.749 | −2 |
| Hangzhou | 5 | 0.568 | 0.749 | −1 |
| Chengdu | 4 | 0.582 | 0.862 | Unchanged |
| Beijing | 10 | 0.595 | 0.755 | −1 |
| Shijiazhuang | 1 | 0.612 | 1 | Unchanged |
| Zhengzhou | 1 | 0.618 | 1 | Unchanged |
| Dalian | 3 | 0.610 | 0.843 | −1 |
| Shenyang | 2 | 0.635 | 0.932 | Unchanged |
| Jinan | 5 | 0.647 | 0.742 | Unchanged |
| Qingdao | 5 | 0.682 | 0.467 | Unchanged |
| Xi’an | 4 | 0.695 | 0.898 | Unchanged |
| Hohhot | 1 | 0.697 | 1 | Unchanged |
| Kunming | 3 | 0.700 | 0.918 | Unchanged |
| Lanzhou | 3 | 0.734 | 0.702 | Unchanged |
| Xining | 1 | 0.739 | 1 | Unchanged |
| Nanchang | 1 | 0.778 | 1 | Unchanged |
| Chongqing | 21 | 0.785 | 0.424 | −2 |
| Harbin | 5 | 0.812 | 0.762 | Unchanged |
| Nanning | 4 | 0.820 | 0.791 | Unchanged |
| Yinchuan | 1 | 0.837 | 1 | Unchanged |
| Haikou | 1 | 0.842 | 1 | Unchanged |
| Urumqi | 2 | 0.852 | 0.827 | Unchanged |
| Changchun | 3 | 0.879 | 0.884 | Unchanged |
References
- Lee, B.; Gordon, P. Urban spatial structure and economic growth in US metropolitan areas. In Proceedings of the 46th Annual Meetings of the Western Regional Science Association, Newport Beach, CA, USA, 21–24 February 2007; Volume 141. [Google Scholar]
- Moghadam, A.S.; Soltani, A.; Parolin, B.; Alidadi, M. Analysing the space-time dynamics of urban structure change using employment density and distribution data. Cities 2018, 81, 203–213. [Google Scholar] [CrossRef]
- Bastian, H.; Stefan, S. Employment suburbanization in the 21st century: A comparison of German and US city regions. Cities 2020, 104, 102802. [Google Scholar] [CrossRef]
- Kim, J.I.; Yeo, C.H.; Kwon, J. Spatial Change in Urban Employment Distribution in Seoul Metropolitan City: Clustering, Dispersion and General Dispersion. Int. J. Urban Sci. 2014, 18, 355–372. [Google Scholar] [CrossRef]
- Feng, J.; Wang, F.H.; Zhou, Y.X. Spatial Restructuring of Population in Beijing Metropolitan Area towards Polycentricity in the Post-Reform Era. Urban Geogr. 2009, 30, 779–802. [Google Scholar] [CrossRef]
- Stanback, T.M. The New Suburbanization; Westview Press: Boulder, CO, USA, 1991. [Google Scholar]
- Gordon, P.; Richardson, H.W. Beyond Polycentricity: Examining the Dispersed Metropolis of Los Angeles from 1970 to 1990. J. Am. Plan. Assoc. 1996, 62, 289–295. [Google Scholar] [CrossRef]
- Hajrasouliha, A.H.; Hamidi, S. The typology of the American metropolis: Monocentricity, polycentricity, or general-ized dispersion? Urban Geogr. 2017, 38, 420–444. [Google Scholar] [CrossRef]
- Dadashpoor, H.; Alidadi, M. Towards decentralization: Spatial changes of employment and population in Tehran Metropolitan Region, Iran. Appl. Geogr. 2017, 85, 51–61. [Google Scholar] [CrossRef]
- Ingram, G.K. Patterns of Metropolitan Development: What Have We Learned? Urban Stud. 1998, 35, 1019–1035. [Google Scholar] [CrossRef]
- Garreau, J. Edge City; Doulbleday: New York, NY, USA, 1991. [Google Scholar]
- Anas, A.; Arnott, R.J.; Small, K.A. Urban spatial structure. J. Econ. Lit. 1998, 36, 1426–1464. [Google Scholar]
- Liu, X.J.; Wang, M.S. How polycentric is urban China and why? A case study of 318 cities. Landsc. Urban Plan. 2016, 151, 10–20. [Google Scholar] [CrossRef]
- Zhou, H.; Sun, B.; Zhang, T. The evolution of urban employment spatial structure in China: From the perspective of monocentricity and polycentricity. Cities 2024, 147, 104824. [Google Scholar] [CrossRef]
- Shi, G.; Liu, J.; Yang, C.; An, Q.; Tian, Z.; Chen, C.; Zhang, J.; Li, X.; Zhang, Y.; Xu, J. Study on the spatiotemporal evolution of urban spatial structure in Nanjing’s main urban area: A coupling study of POI and nighttime light data. Front. Arch. Res. 2025; in press. [Google Scholar] [CrossRef]
- Li, Y.C.; Xiong, W.T.; Wang, X.P. Does polycentric and compact development alleviate urban traffic congestion? A case study of 98 Chinese cities. Cities 2019, 88, 100–111. [Google Scholar] [CrossRef]
- Li, Y.C. Towards concentration and decentralization: The evolution of urban spatial structure of Chinese cities, 2001-2016. Comput. Environ. Urban Syst. 2020, 80, 101425. [Google Scholar] [CrossRef]
- Yu, L.; Zheng, W.; Yu, T.; Wu, Y.X. How to identify urban centers/subcenters in metropolises? An analytical review. Habitat Int. 2021, 115, 102397. [Google Scholar] [CrossRef]
- Sun, B.D.; Wei, X.H. Spatial Distribution and Structure Evolution of Employment and Population in Shanghai Metropolitan Area. Acta Geogr. Sin. 2014, 69, 747–758. (In Chinese) [Google Scholar]
- Giuliano, G.; Small, K.A. Subcenters in the Los Angeles Region. Reg. Sci. Urban Econ. 1991, 21, 163–182. [Google Scholar] [CrossRef]
- Zhao, M.X.; Derudder, B.; Huang, J.H. Examining the transition processes in the Pearl River Delta polycentric mega-city region through the lens of corporate networks. Cities 2017, 60, 147–155. [Google Scholar] [CrossRef]
- Zhuo, Y.X.; Liu, T. Polycentric City and Region: A Review and Appraisal. Prog. Geogr. 2020, 39, 1385–1396. (In Chinese) [Google Scholar] [CrossRef]
- Feng, J.; Liu, Y. Restructuring of urban internal space in China in the transition period: Characteristics, models and mechanisms. Prog. Geogr. 2007, 4, 93–106. (In Chinese) [Google Scholar]
- Zhang, T.L.; Sun, B.D.; Li, W.; Dan, B.; Wang, C.X. Polycentricity or dispersal? The spatial transformation of metropolitan Shanghai. Cities 2019, 95, 102352. [Google Scholar] [CrossRef]
- Gaubatz, P. China’s Urban Transformation: Patterns and Processes of Morphological Change in Beijing, Shanghai and Guangzhou. Urban Stud. 1999, 36, 1495–1521. [Google Scholar] [CrossRef] [PubMed]
- Zhou, Y.X.; Ma, L.J.C. Economic restructuring and suburbanization in China. Urban Geogr. 2000, 21, 205–236. [Google Scholar] [CrossRef]
- Qin, B.; Han, S.S. Emerging Polycentricity in Beijing: Evidence from Housing Price Variations, 2001–2005. Urban Stud. 2013, 50, 2006–2023. [Google Scholar] [CrossRef]
- Cheng, H.; Shaw, D. Polycentric development practice in master planning: The case of China. Int. Plan. Stud. 2018, 23, 163–179. [Google Scholar] [CrossRef]
- Long, Y.; Song, Y.M.; Chen, L. Identifying subcenters with a nonparametric method and ubiquitous point-of-interest data: A case study of 284 Chinese cities. Environ. Plan. B Urban Anal. City Sci. 2022, 49, 58–75. [Google Scholar] [CrossRef]
- Sun, T.S.; Lv, Y.Q. Employment centers and polycentric spatial development in Chinese cities: A multi-scale analysis. Cities 2020, 99, 102617. [Google Scholar] [CrossRef]
- Lv, Y.Q.; Lan, Z.M.; Kan, C.C.; Zheng, X.Q. Polycentric Urban Development and its Determinants in China: A Geospatial Big Data Perspective. Geogr. Anal. 2021, 53, 520–542. [Google Scholar] [CrossRef]
- Deng, H.; Zhang, K.; Wang, F.; Dang, A. Compact or disperse? Evolution patterns and coupling of urban land expansion and population distribu-tion evolution of major cities in China, 1998–2018. Habitat Int. 2021, 108, 102324. [Google Scholar] [CrossRef]
- Wang, J.T.; Xie, Y.; Lu, X.C. Has the industrial development promoted urban sprawl? An empirical study based on the panel data of 35 large and medium-sized cities in China. J. Xi’an Jiaotong Univ. (Soc. Sci.) 2017, 37, 9–18. (In Chinese) [Google Scholar] [CrossRef]
- Guillain, R.; Le Gallo, J.; Boiteux-Orain, C. Changes in Spatial and Sectoral Patterns of Employment in Ile-de-France, 1978–1997. Urban Stud. 2006, 43, 2075–2098. [Google Scholar] [CrossRef]
- Li, Y.C.; Liu, X.J. How did urban polycentricity and dispersion affect economic productivity? A case study of 306 Chinese cities. Landsc. Urban Plan. 2018, 173, 51–59. [Google Scholar] [CrossRef]
- Anselin, L. Local indicators of spatial association-LISA. Geographical 1995, 27, 93–115. [Google Scholar] [CrossRef]
- Daniel, A.; Fernando, S. The validity of the monocentric city model in a polycentric age: US metropolitan areas in 1990, 2000 and 2010. Urban Geogr. 2014, 35, 980–997. [Google Scholar] [CrossRef]
- Ruan, Y.; Zhang, X.; Chen, Q.X.; Zhang, M.Y. A global polycenter identification method with single-source data: The integration of local multisource data recognition. Trans. GIS 2024, 28, 1772–1792. [Google Scholar] [CrossRef]
- Rodríguez-Gámez, L.; Dallerba, S. Spatial Distribution of Employment in Hermosillo, 1999–2004. Urban Stud. 2012, 49, 3663–3678. [Google Scholar] [CrossRef]
- Coffey, W.J.; Shearmur, R.G. Agglomeration and Dispersion of High-order Service Employment in the Montreal Metropolitan Region, 1981–1996. Urban Stud. 2002, 39, 359–378. [Google Scholar] [CrossRef]
- Shearmur, R.; Alvergne, C. Regional Planning Policy and the Location of Employment in the Ile-De-France: Does Policy Matter? Urban Aff. Rev. 2003, 39, 3–31. [Google Scholar] [CrossRef]
- Giuliano, G.; Kang, S.; Yuan, Q. Agglomeration Economies and Evolving Urban Form. Ann. Reg. Sci. 2019, 63, 377–398. [Google Scholar] [CrossRef]
- Giuliano, G.; Hou, Y.T.; Kang, S.; Shin, E.J. Polycentricity and the evolution of metropolitan spatial structure. Growth Change 2022, 53, 593–627. [Google Scholar] [CrossRef]
- Jiang, L.; Wu, F.L. A Study on Guangzhou’s Employment Subcentres and Polycentricity. Urban Plan. Forum 2009, 3, 75–81. (In Chinese) [Google Scholar]
- Zeng, H.H.; Meng, X.C.; Li, G.C. Spatial Structure of Employment and Its Evolution in Shenzhen City: 2001–2004. Hum. Geogr. 2010, 25, 34–40. (In Chinese) [Google Scholar]
- Lee, B. “Edge” or “Edgeless” cities? Urban spatial structure in US metropolitan areas, 1980 to 2000. J. Reg. Sci. 2007, 47, 479–515. [Google Scholar] [CrossRef]
- Yang, J.W.; French, S.; Holt, J.; Zhang, X.Y. Measuring the Structure of U.S. Metropolitan Areas, 1970–2000 Spatial Statistical Metrics and an Application to Commuting Behavior. J. Am. Plan. Assoc. 2012, 78, 197–209. [Google Scholar] [CrossRef]
- Lee, B.; Gordon, P. Urban structure: Its role in urban growth, net new business formation and Industrial Churn. Reg. Dev. 2011, 33, 137–159. [Google Scholar]
- Meijers, E.J.; Burger, M.J. Spatial Structure and Productivity in US Metropolitan Areas. Environ. Plan. A Econ. Space 2010, 42, 1383–1402. [Google Scholar] [CrossRef]
- Li, Y.C.; Zhu, K.; Wang, S.J. Polycentric and Dispersed Population Distribution Increases PM2.5 Concentrations: Evidence from 286 Chinese Cities, 2001–2016. J. Clean. Prod. 2019, 248, 119202. [Google Scholar] [CrossRef]
- William, S.C. Robust Locally Weighted Regression and Smoothing Scatterplots. J. Am. Stat. Assoc. 1979, 368, 829–836. [Google Scholar] [CrossRef]
- Lu, Y.M.; Wang, L.; Qiu, A.G.; Zhao, Y.Y.; Zhang, Y.C. PM2.5 spatial interpolation method based on local weighted linear regression model. Sci. Surv. Mapp. 2018, 43, 79–84+91. (In Chinese) [Google Scholar] [CrossRef]
- Chaves, L.M.; Carvalho, L.D.d.e.; Reis, C.J.d.o.s.; de Souza, D.J. Explaining the Generalized Cross-Validation on Linear Models. J. Math. Stat. 2019, 15, 298–307. [Google Scholar] [CrossRef]
- Ren, W.; Wei, L.G.; Lu, X.H.; Xu, J.L.; Qin, Y. Spatio-Temporal Dynamic Characteristics and Driving Mechanisms of Urban Compactness in Central China. Urban Sci. 2024, 8, 40. [Google Scholar] [CrossRef]
- Agarwal, A.; Giuliano, G.; Redfearn, C.L. Strangers in our midst: The usefulness of exploring polycentricity. Ann. Reg. Sci. 2012, 48, 433–450. [Google Scholar] [CrossRef]
- Behrens, K.; Robert-Nicoud, F. Agglomeration Theory with Heterogeneous Agents. In Handbook of Regional and Urban Economics; Elsevier B.V.: Amsterdam, The Netherlands, 2015; pp. 171–245. [Google Scholar] [CrossRef]
- Eeckhout, J.; Pinheiro, R.; Schmidheiny, K. Spatial Sorting. J. Political Econ. 2014, 122, 554–620. [Google Scholar] [CrossRef]
- Gaubert, C. Firm sorting and agglomeration. Am. Econ. Rev. 2018, 11, 3117–3153. [Google Scholar] [CrossRef]
- Dai, M.; Zhang, H.; Rao, X.Q. From monocentric to polycentric pattern: An evolutional tendency of the urban internal spatial structure in Post-Industrial Era. Econ. Geogr. 2014, 34, 80–86. [Google Scholar] [CrossRef]
- Dong, R.X.; Yan, F.Y. Revealing Characteristics of the Spatial Structure of Megacities at Multiple Scales with Jobs-Housing Big Data: A Case Study of Tianjin, China. Land 2021, 10, 1144. [Google Scholar] [CrossRef]
- Changoluisa, J. The role o f agglomerations in the emerging performance and the early development of new establish-ments: Evidence from Germany. J. Evol. Econ. 2023, 33, 837–868. [Google Scholar] [CrossRef]
- Wolfgang, D.; Sebastian, F.; Enrico, M.; Jens, S. Matching in cities. J. Eur. Econ. Assoc. 2022, 4, 1462–1501. [Google Scholar] [CrossRef]


| City | Number of Firms (1000) | City | Number of Firms (1000) |
|---|---|---|---|
| Shenzhen | 3247 | Shenyang | 697 |
| Shanghai | 2931 | Dalian | 639 |
| Guangzhou | 2810 | Shijiazhuang | 603 |
| Chengdu | 2437 | Guiyang | 593 |
| Beijing | 2140 | Haikou | 567 |
| Xi’an | 1782 | Kunming | 559 |
| Chongqing | 1645 | Fuzhou | 536 |
| Wuhan | 1437 | Nanning | 508 |
| Tianjin | 1350 | Ningbo | 500 |
| Nanjing | 1323 | Taiyuan | 499 |
| Hangzhou | 1269 | Xiamen | 421 |
| Qingdao | 1165 | Urumqi | 395 |
| Jinan | 1139 | Yinchuan | 248 |
| Zhengzhou | 864 | Hohhot | 231 |
| Changsha | 849 | Xining | 191 |
| Changchun | 815 | Lanzhou | 187 |
| Hefei | 784 | Nanchang | 154 |
| Harbin | 747 | ||
| Total | 36,264 | ||
| Author | Year | Study Area | Threshold Definition |
|---|---|---|---|
| Giuliano et al. | 1991 | 1980 Los Angeles | ≥10 jobs/acre and ≥10,000 total employment [20] |
| Coffey et al. | 2002 | 1981–1996 Montreal suburbs | ≥5000 jobs + job/labor ratio > 1.0 [40] |
| Shearmur et al. | 2003 | 1978, 1994 Paris | ≥5000 jobs, working population mostly residents [41] |
| Giuliano et al. | 2019 | 1980–2010 Los Angeles | Top 5% job density and ≥10,000 jobs (Type I); top 1% density and ≥20,000 jobs (Type II) [42] |
| Giuliano et al. | 2022 | 1980–2009 Four U.S. metropolitan areas | Top 5% and 1% job density percentiles, plus job count thresholds [43] |
| Jiang et al. | 2009 | 2004 Guangzhou | Sucenters: >5000 jobs/km2 (excluding parks) [44] |
| Zeng et al. | 2010 | 2001, 2004 Shenzhen | Primary centers: >30,000 jobs/km2 and >200,000 jobs; subcenters: 16,000–30,000 jobs/km2, ≥70,000 jobs [45] |
| Zhang et al. | 2019 | 2004, 2008, 2013 Shanghai | Two times the average number of employed people per grid (1 km2, 5 km2) [24] |
| Sun et al. | 2020 | 2008, 287 Chinese cities | Job count > 20,000; residual exceeds 5% significance over zero baseline [30] |
| City | Number of Centers | Centralization Degree | Primacy Ratio | Region |
|---|---|---|---|---|
| Shanghai | 8 | 0.21 | 0.38 | Eastern |
| Hefei | 2 | 0.29 | 0.94 | Central |
| Shenzhen | 6 | 0.38 | 0.53 | Eastern |
| Changsha | 2 | 0.38 | 0.97 | Central |
| Ningbo | 2 | 0.39 | 0.87 | Eastern |
| Fuzhou | 2 | 0.43 | 0.93 | Eastern |
| Taiyuan | 2 | 0.46 | 0.66 | Central |
| Guiyang | 3 | 0.49 | 0.73 | Western |
| Tianjin | 11 | 0.50 | 0.49 | Eastern |
| Xiamen | 2 | 0.52 | 0.77 | Eastern |
| Nanjing | 5 | 0.55 | 0.55 | Eastern |
| Guangzhou | 11 | 0.58 | 0.77 | Eastern |
| Wuhan | 7 | 0.58 | 0.73 | Central |
| Hangzhou | 6 | 0.58 | 0.73 | Eastern |
| Chengdu | 4 | 0.58 | 0.86 | Western |
| Beijing | 11 | 0.60 | 0.75 | Eastern |
| Shijiazhuang | 1 | 0.61 | 1.00 | Eastern |
| Zhengzhou | 1 | 0.62 | 1.00 | Central |
| Dalian | 4 | 0.62 | 0.82 | Northeastern |
| Shenyang | 2 | 0.63 | 0.93 | Northeastern |
| Jinan | 5 | 0.65 | 0.74 | Eastern |
| Xi’an | 4 | 0.69 | 0.90 | Western |
| Hohhot | 1 | 0.70 | 1.00 | Western |
| Kunming | 3 | 0.70 | 0.92 | Western |
| Lanzhou | 3 | 0.73 | 0.70 | Western |
| Xining | 1 | 0.74 | 1.00 | Western |
| Nanchang | 1 | 0.78 | 1.00 | Central |
| Chongqing | 23 | 0.80 | 0.42 | Western |
| Harbin | 5 | 0.81 | 0.76 | Northeast |
| Nanning | 4 | 0.82 | 0.79 | Western |
| Yinchuan | 1 | 0.84 | 1.00 | Western |
| Haikou | 1 | 0.84 | 1.00 | Eastern |
| Urumqi | 2 | 0.85 | 0.83 | Western |
| Changchun | 3 | 0.88 | 0.88 | Northeast |
| Variable Category | Variable Name | Variable Description | Obs | Mean | Std. Dev. | Min | Max |
|---|---|---|---|---|---|---|---|
| Dependent Variable | Number of centers | Number of identified urban centers | 35 | 4.400 | 4.333 | 1.000 | 23.000 |
| Centralization Degree | The proportion of the number of firms in the polycentric urban areas to the total number of firms in the city, with a value range of 0 to 1. | 35 | 0.615 | 0.167 | 0.214 | 0.879 | |
| Primacy Ratio | The proportion of the number of firms in the primary center to the number of firms in all centers, with a value range of 0 to 1. | 35 | 0.795 | 0.182 | 0.381 | 1.000 | |
| Social Factors | Total population | Total population of municipal districts (ln) | 35 | 6.093 | 0.722 | 4.615 | 7.816 |
| Economic Factors | GDP | Gross Regional Product (ln) | 35 | 18.013 | 0.901 | 16.143 | 19.760 |
Disclaimer/Publisher’s Note: The statements, opinions and data contained in all publications are solely those of the individual author(s) and contributor(s) and not of MDPI and/or the editor(s). MDPI and/or the editor(s) disclaim responsibility for any injury to people or property resulting from any ideas, methods, instructions or products referred to in the content. |
© 2025 by the authors. Licensee MDPI, Basel, Switzerland. This article is an open access article distributed under the terms and conditions of the Creative Commons Attribution (CC BY) license (https://creativecommons.org/licenses/by/4.0/).
Share and Cite
Wu, Z.; Peng, Y.; Qin, B. The Typology of Urban Polycentricity: A Comparative Study of Firm Distribution in 35 Chinese Cities. Urban Sci. 2025, 9, 235. https://doi.org/10.3390/urbansci9070235
Wu Z, Peng Y, Qin B. The Typology of Urban Polycentricity: A Comparative Study of Firm Distribution in 35 Chinese Cities. Urban Science. 2025; 9(7):235. https://doi.org/10.3390/urbansci9070235
Chicago/Turabian StyleWu, Zhihui, Yanyan Peng, and Bo Qin. 2025. "The Typology of Urban Polycentricity: A Comparative Study of Firm Distribution in 35 Chinese Cities" Urban Science 9, no. 7: 235. https://doi.org/10.3390/urbansci9070235
APA StyleWu, Z., Peng, Y., & Qin, B. (2025). The Typology of Urban Polycentricity: A Comparative Study of Firm Distribution in 35 Chinese Cities. Urban Science, 9(7), 235. https://doi.org/10.3390/urbansci9070235