Urban Resilience and Energy Demand in Tropical Climates: A Functional Zoning Approach for Emerging Cities


Abstract
1. Introduction
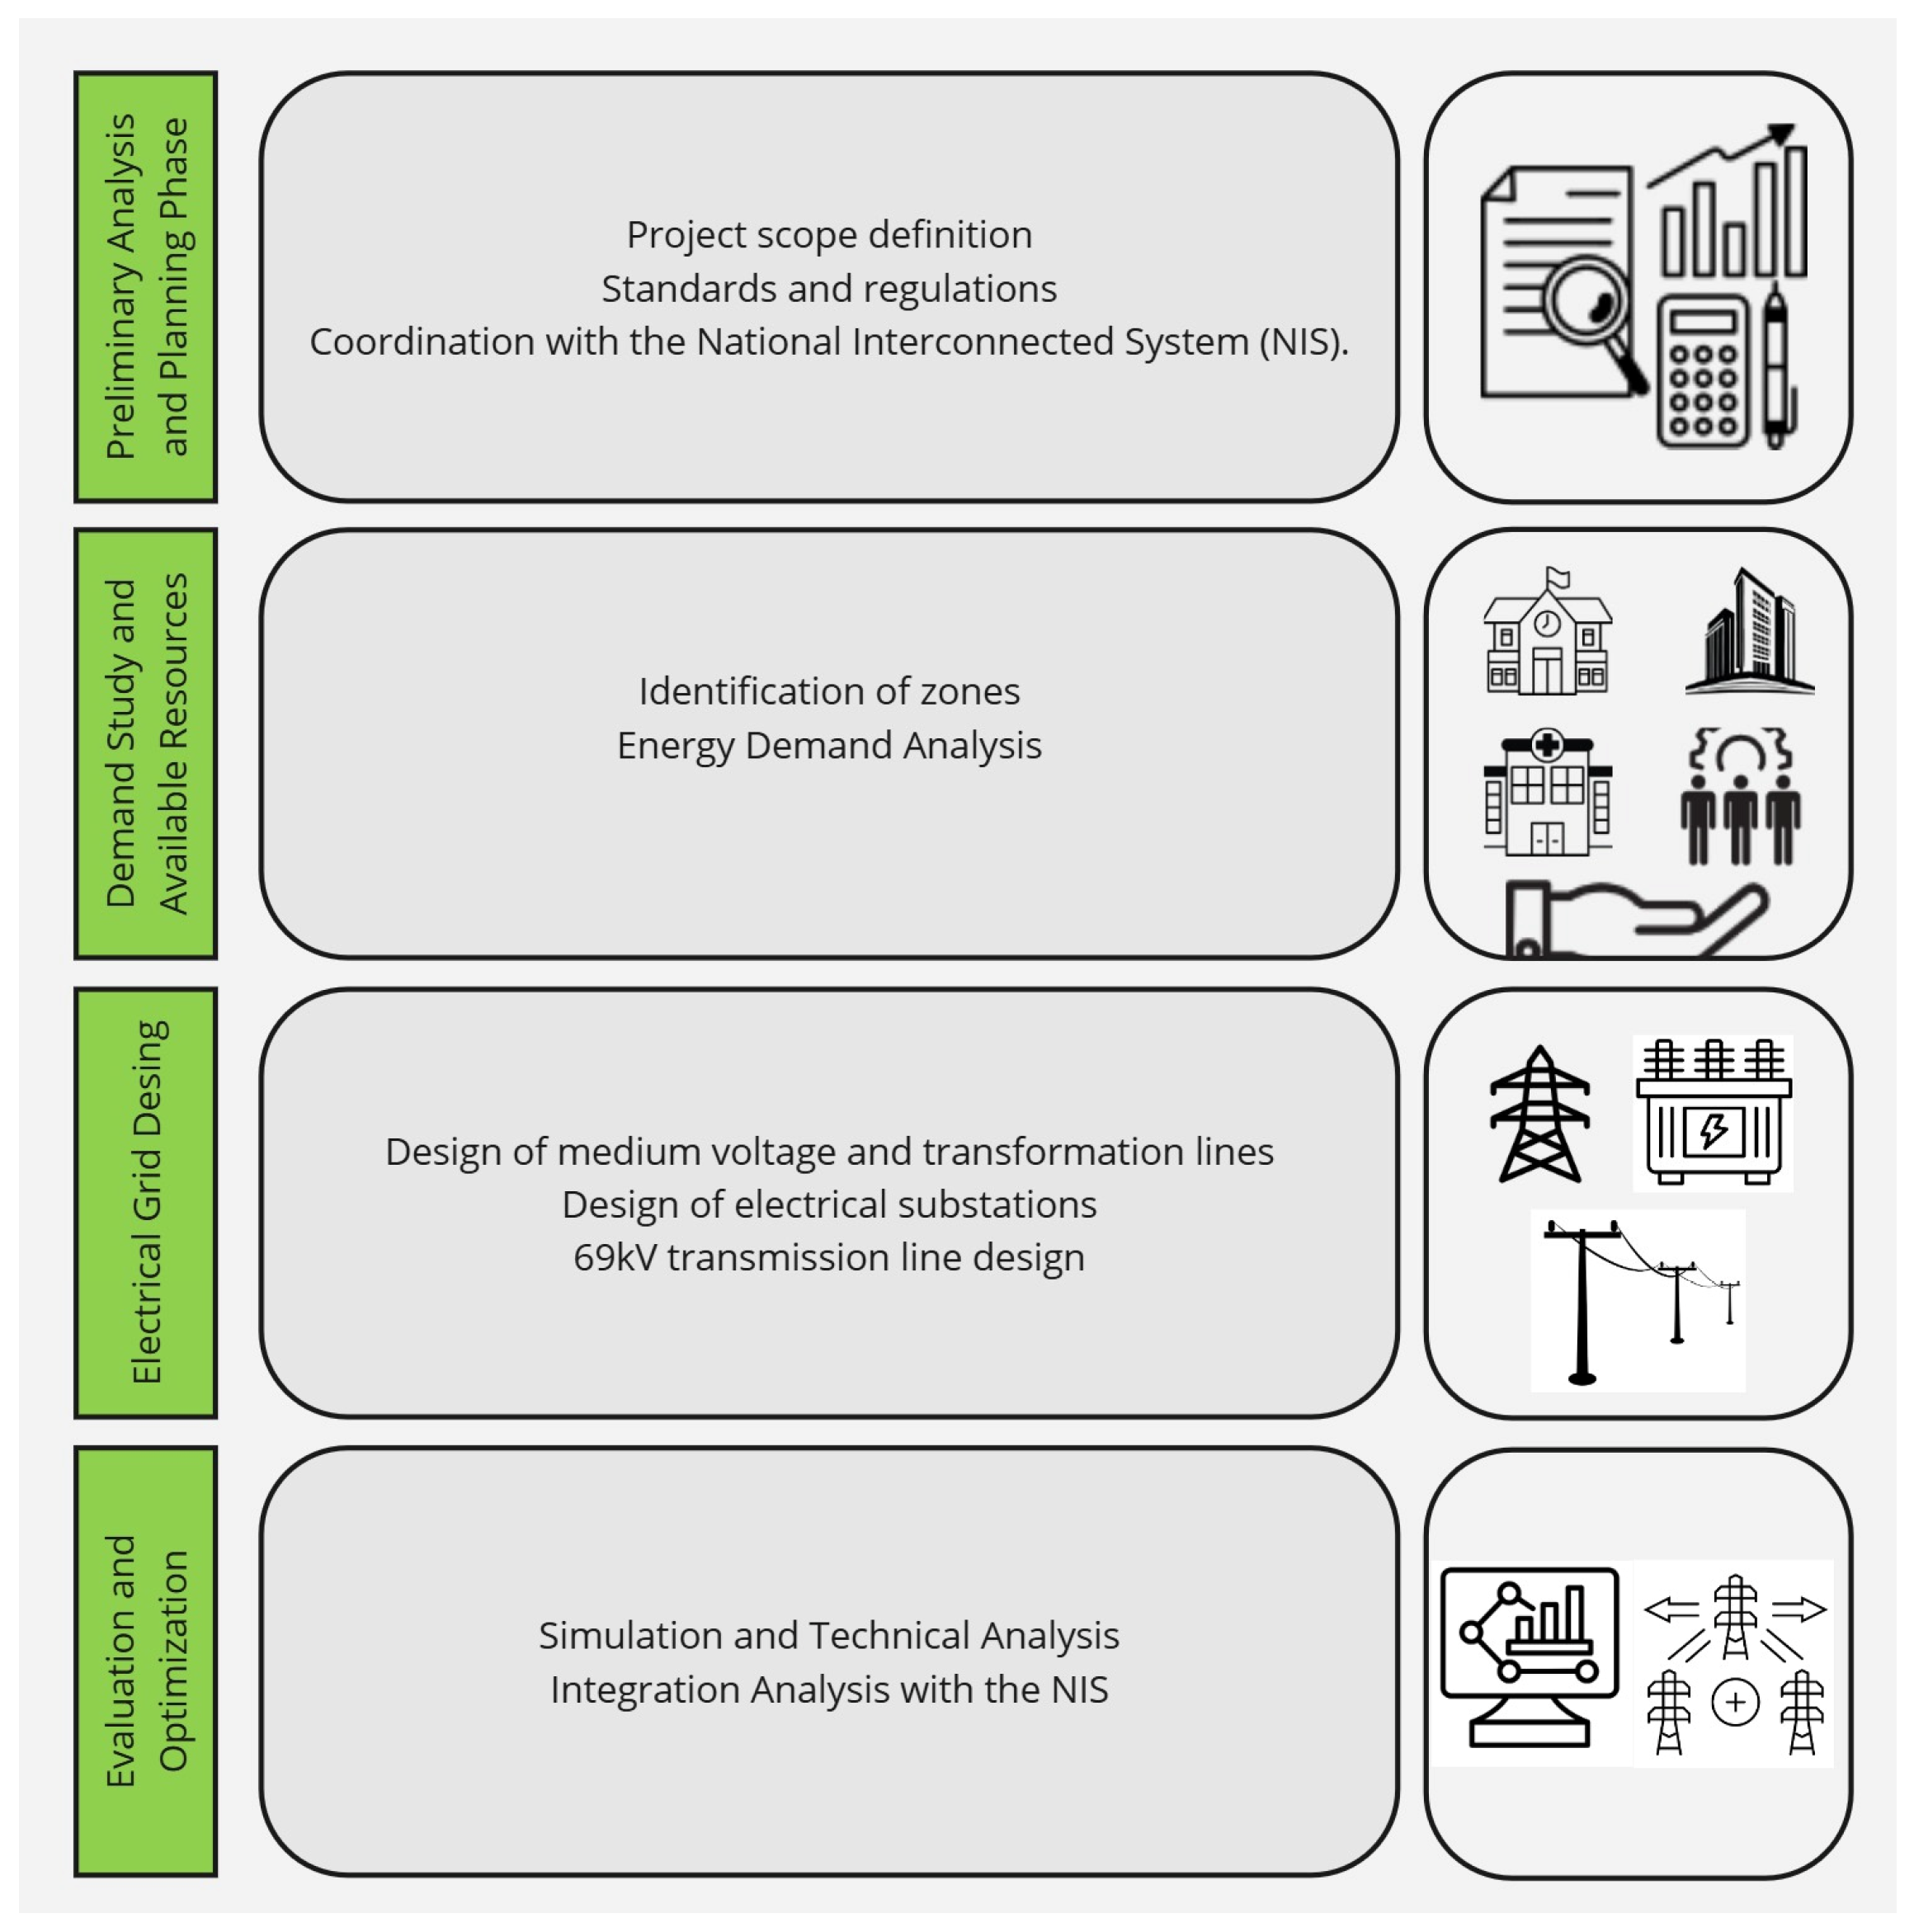
2. Methodology
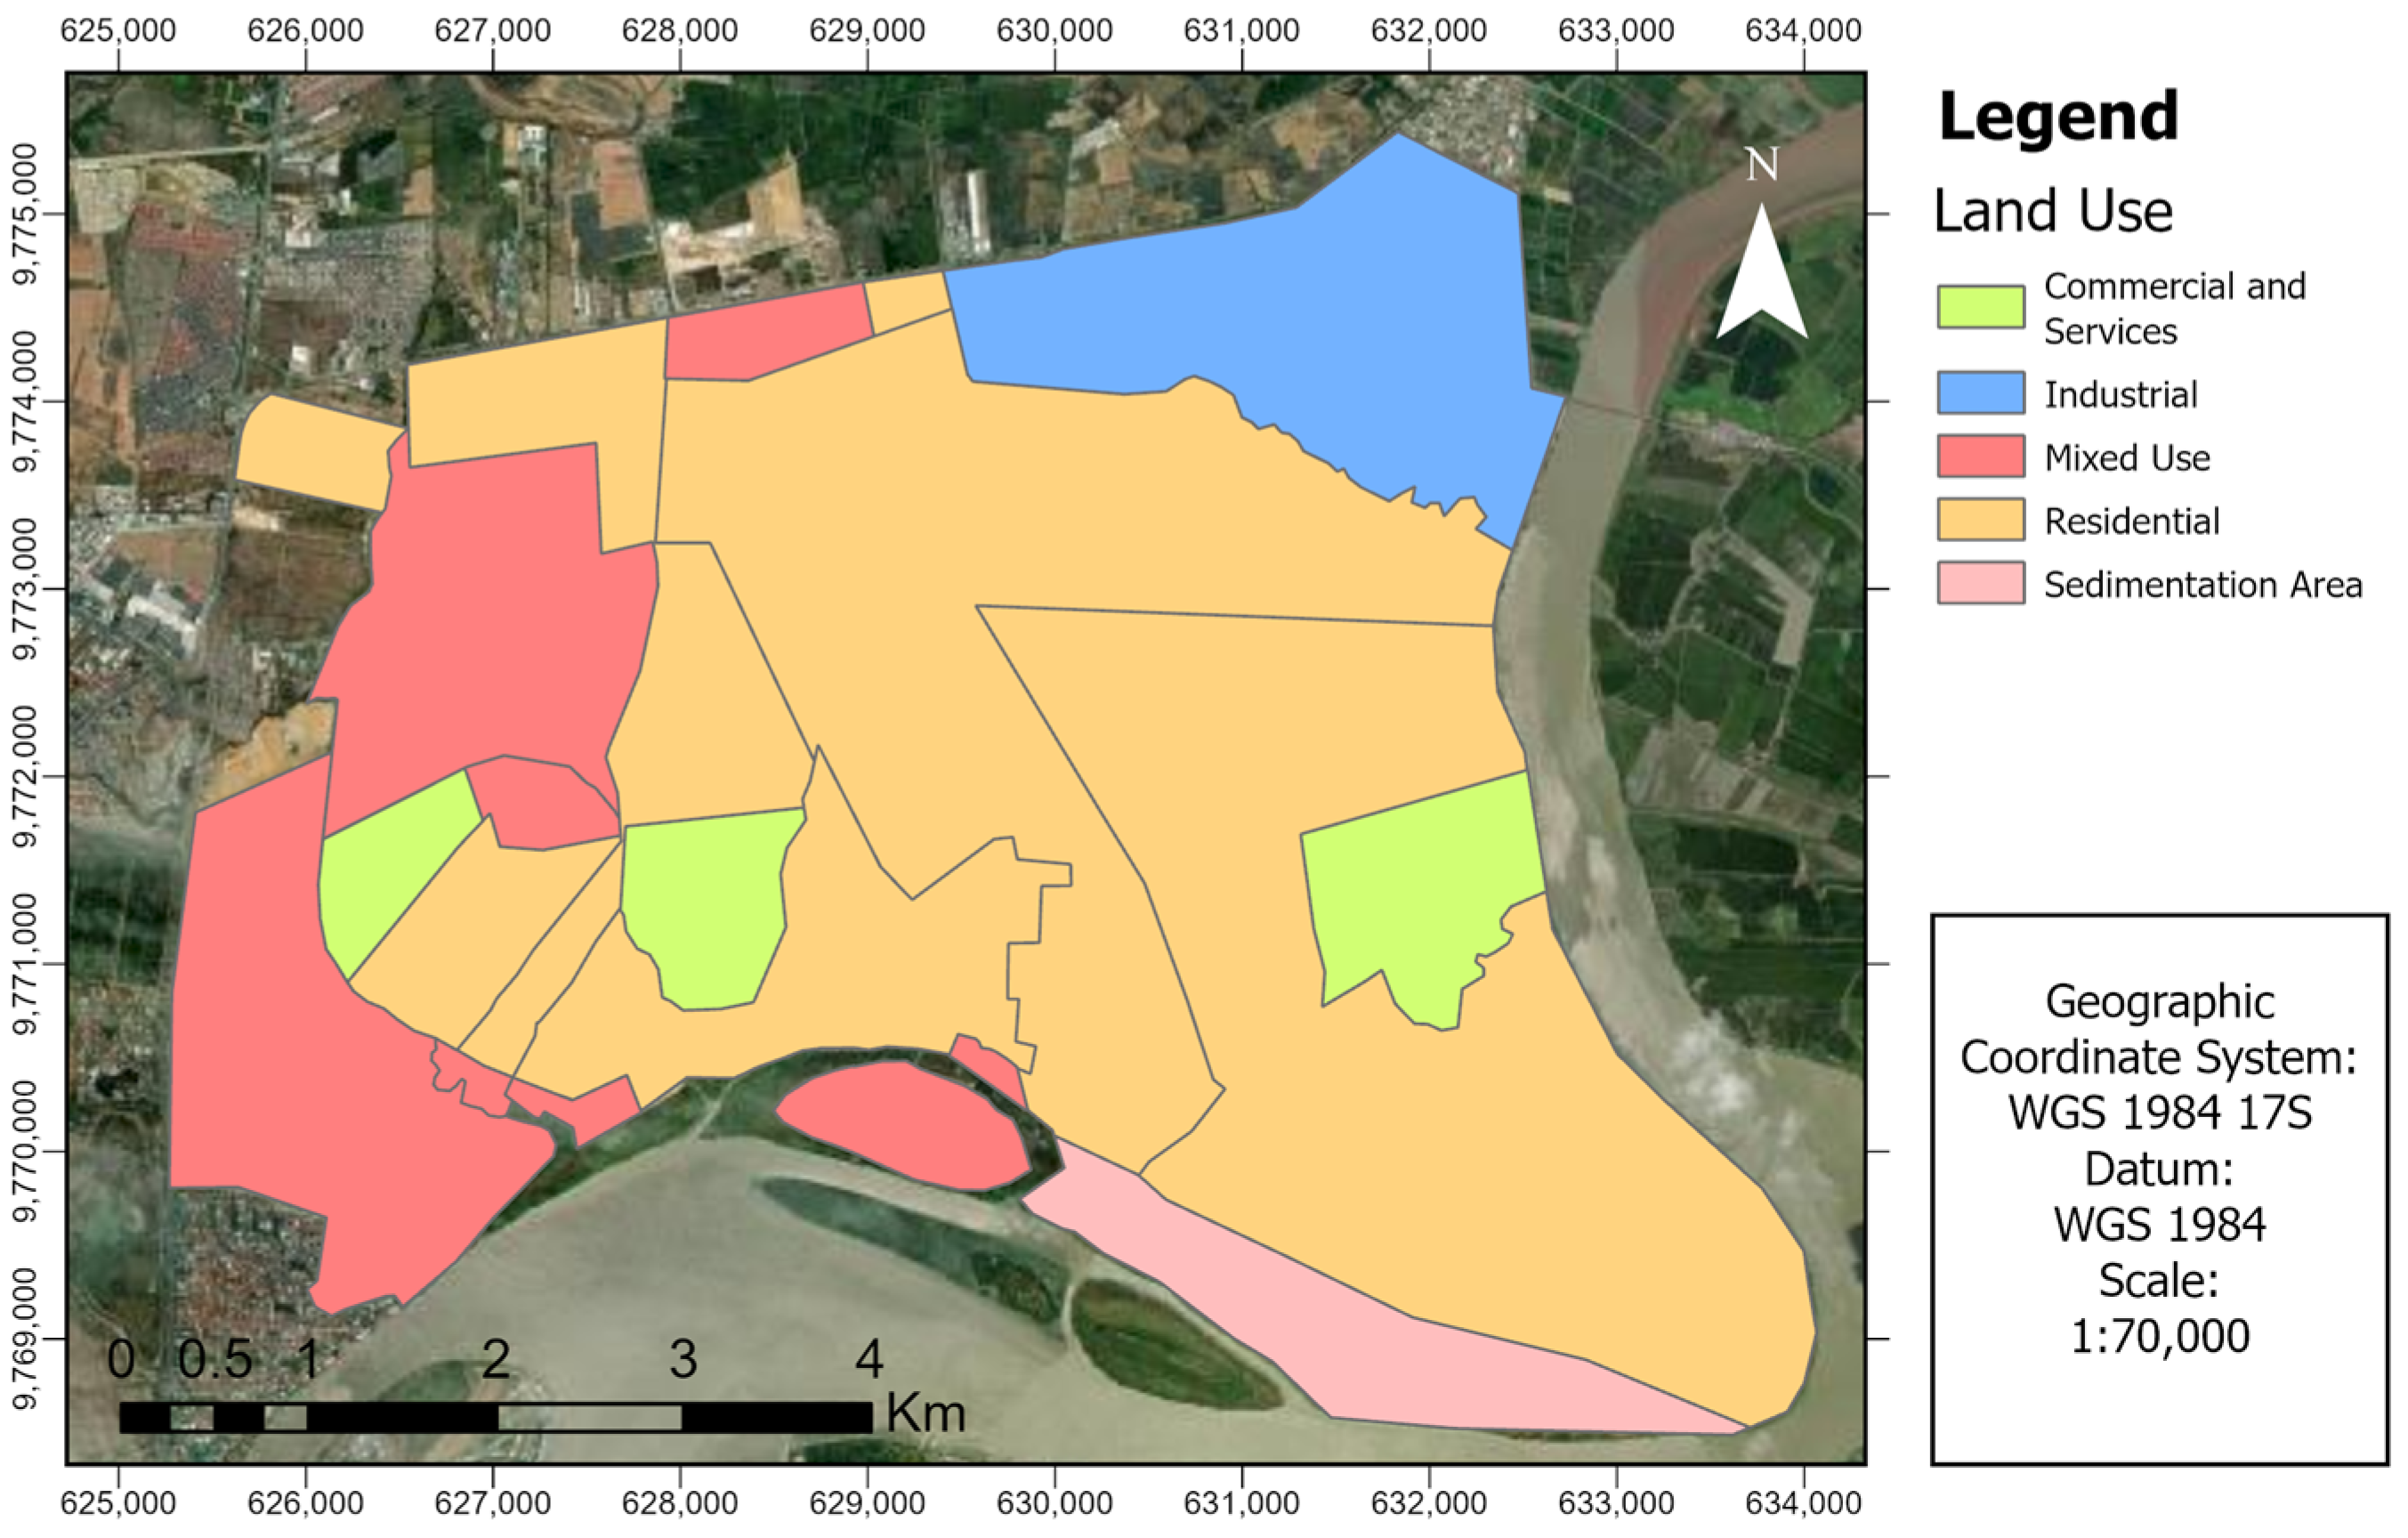
2.1. Case Study
2.2. Preliminary Analysis and Planning Phase
2.3. Demand Study and Available Resources Phase
2.3.1. Identification of Zones
2.3.2. Energy Demand Analysis
2.4. Electrical Grid Design
2.4.1. Design of Electrical Substations
2.4.2. 69 KV Transmission Line Design
2.5. Evaluation and Optimization
2.5.1. Simulation and Technical Analysis
2.5.2. Integration Analysis with the NIS
3. Results
3.1. Energy Demand
3.1.1. Hospital Load
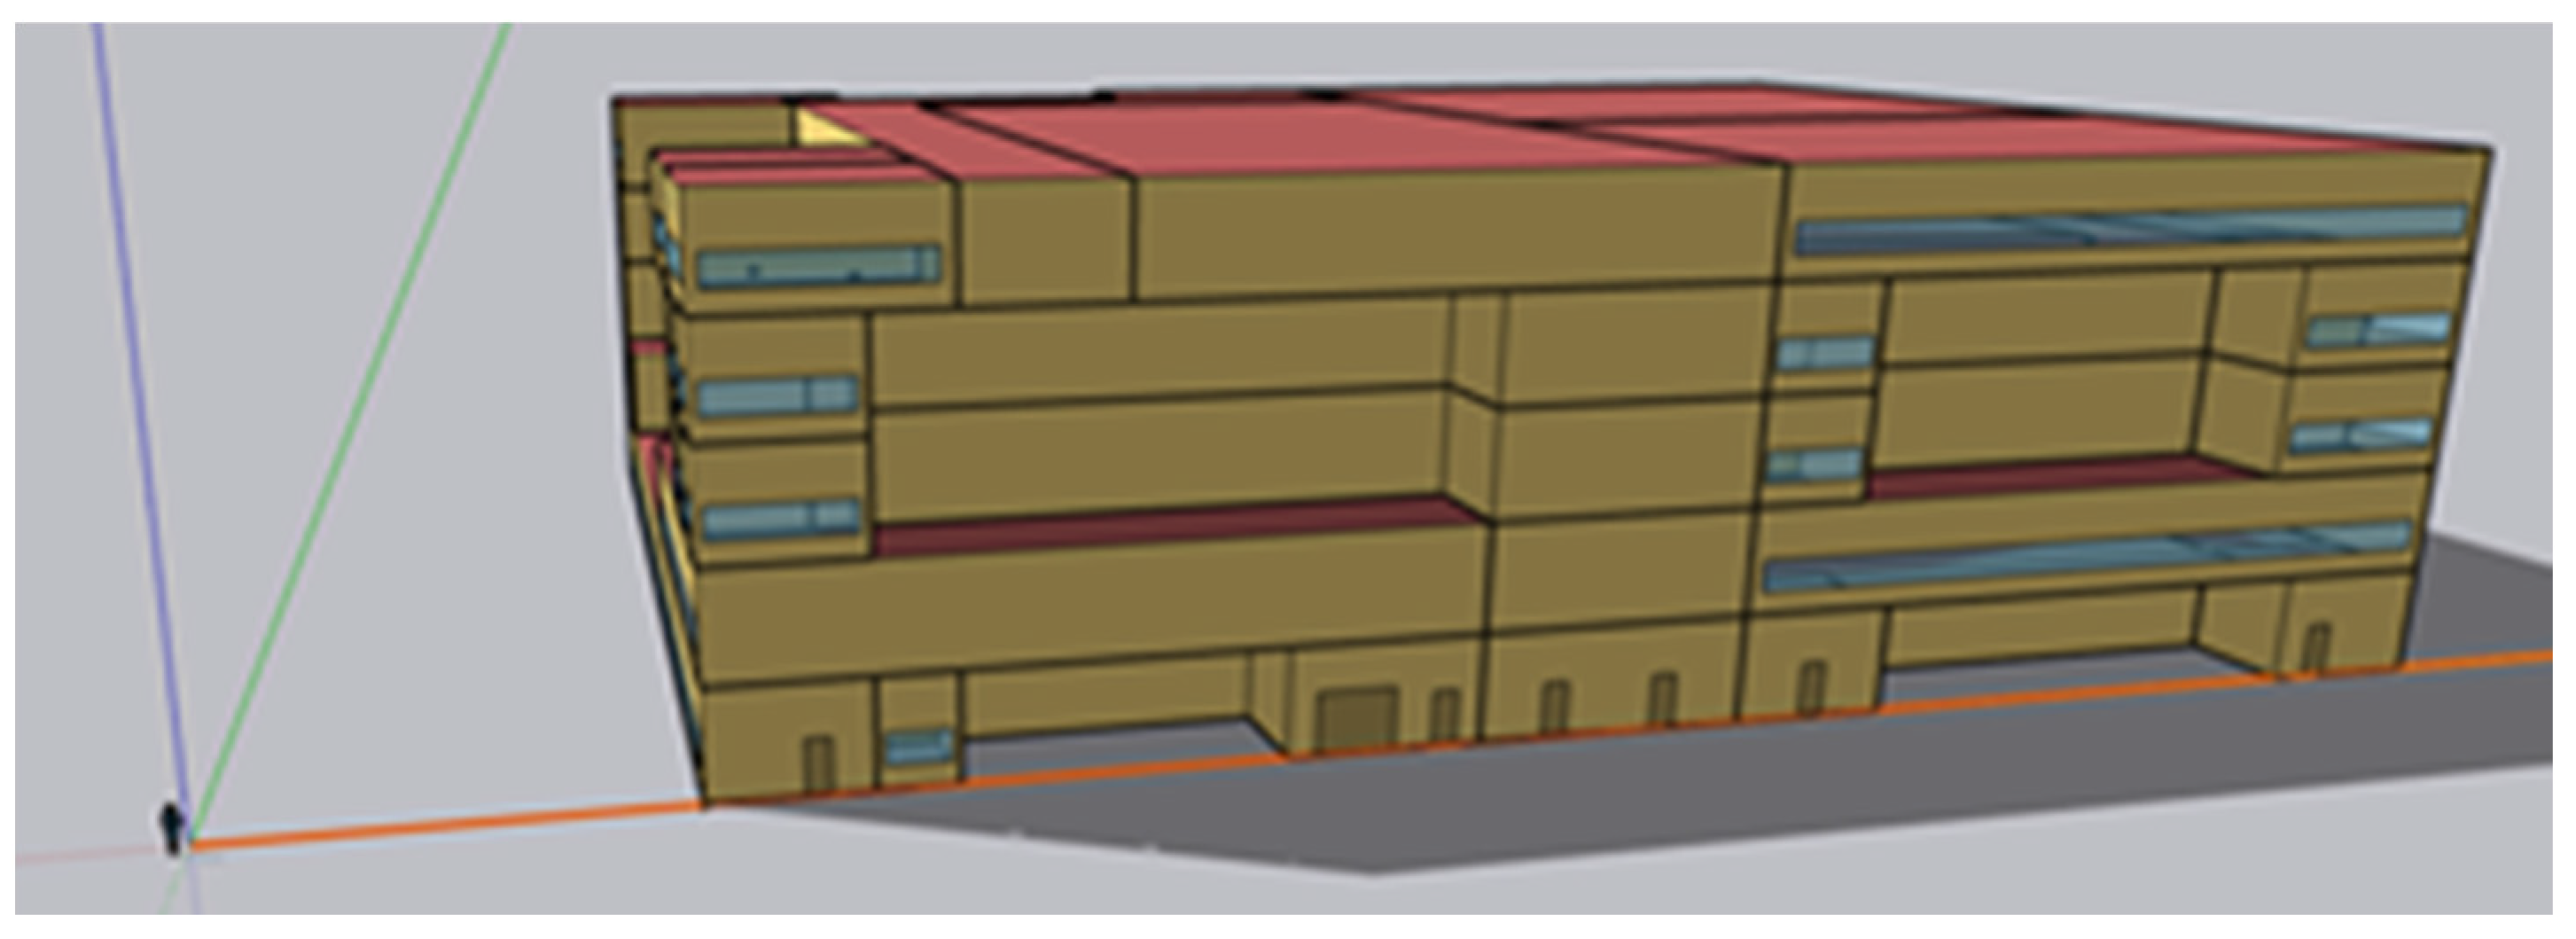
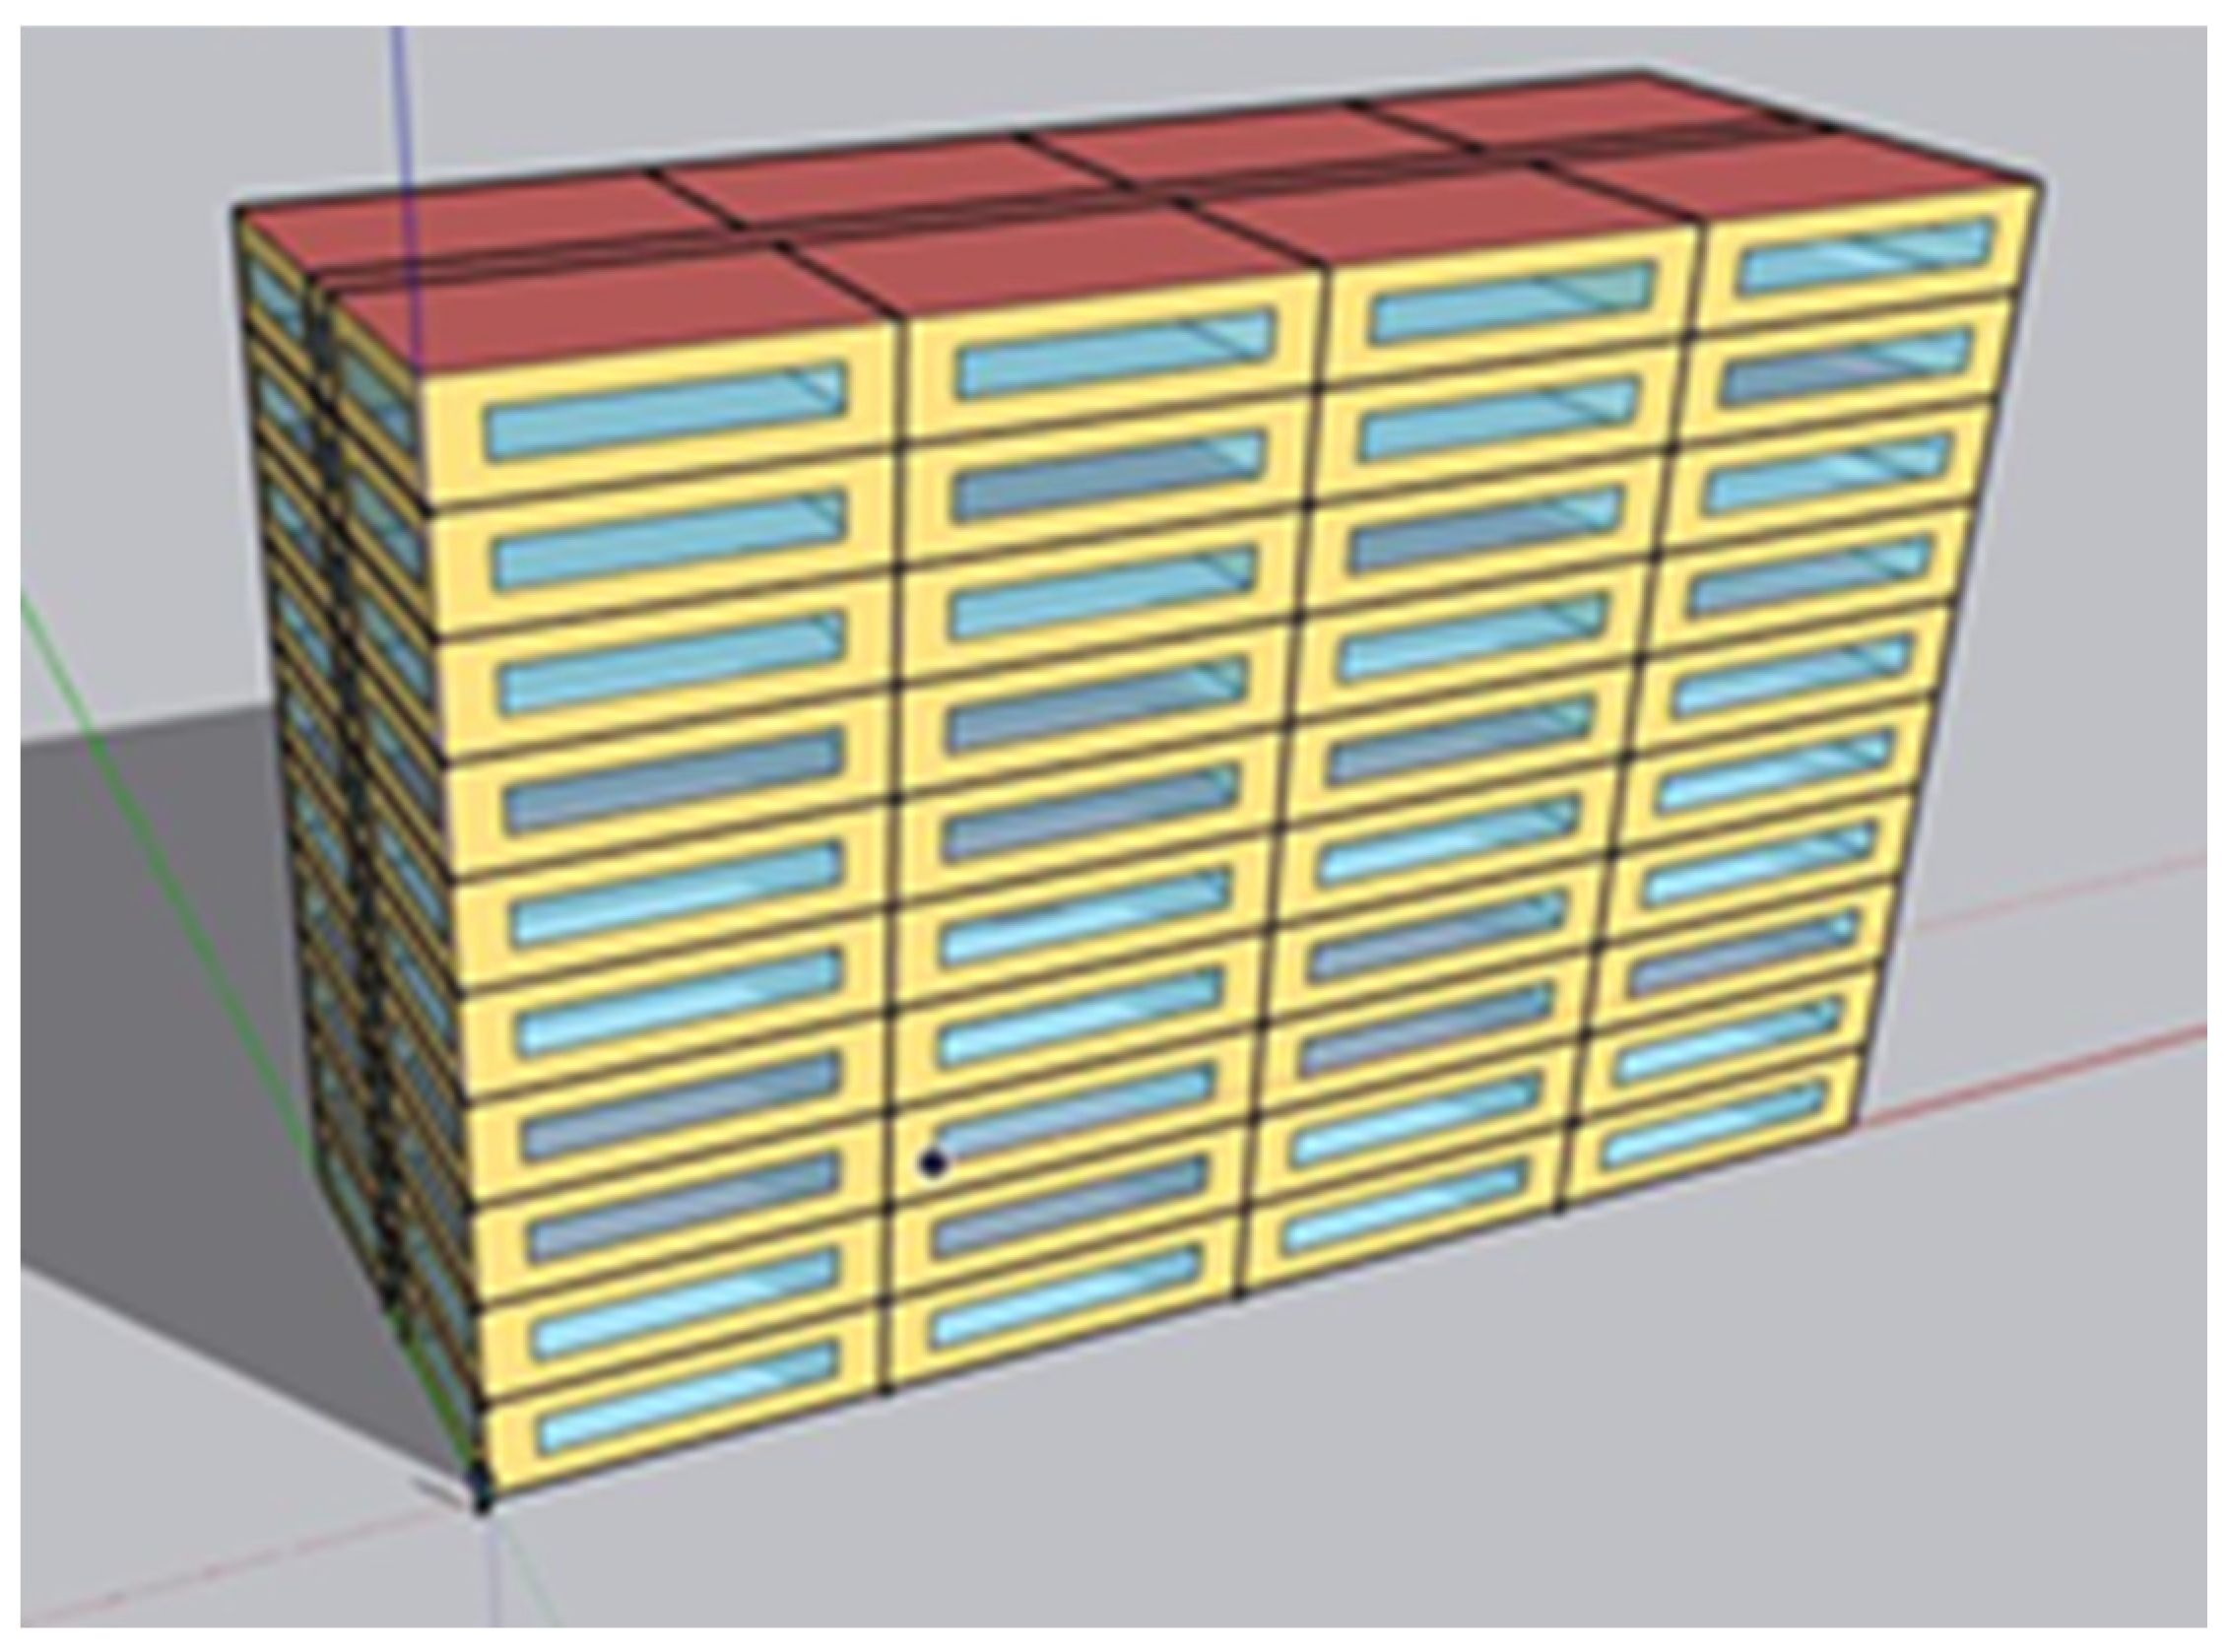
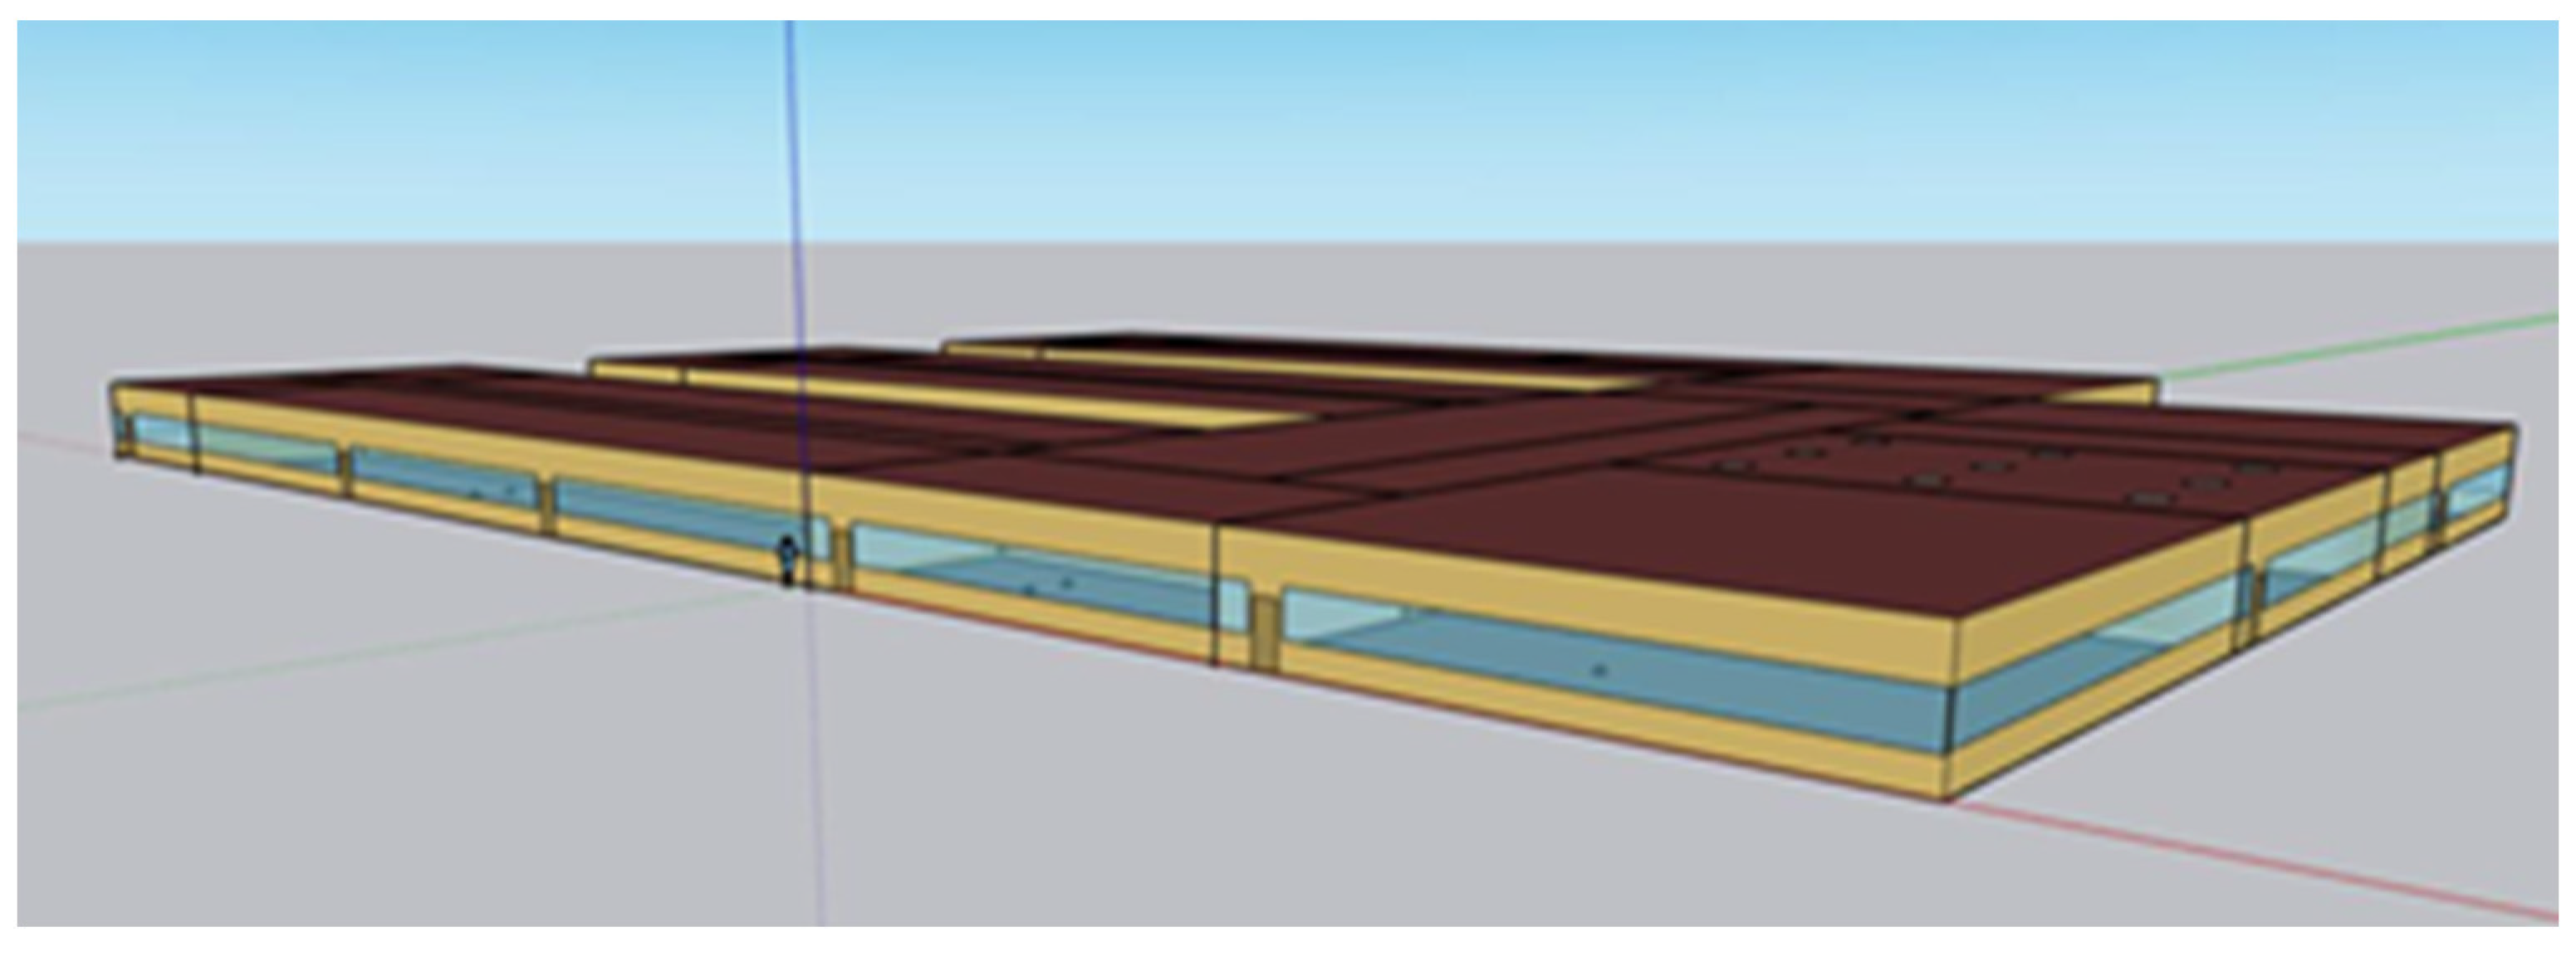
3.1.2. High-Rise Apartment Load
3.1.3. Primary School Load
3.1.4. Load Modelling
3.2. Substations
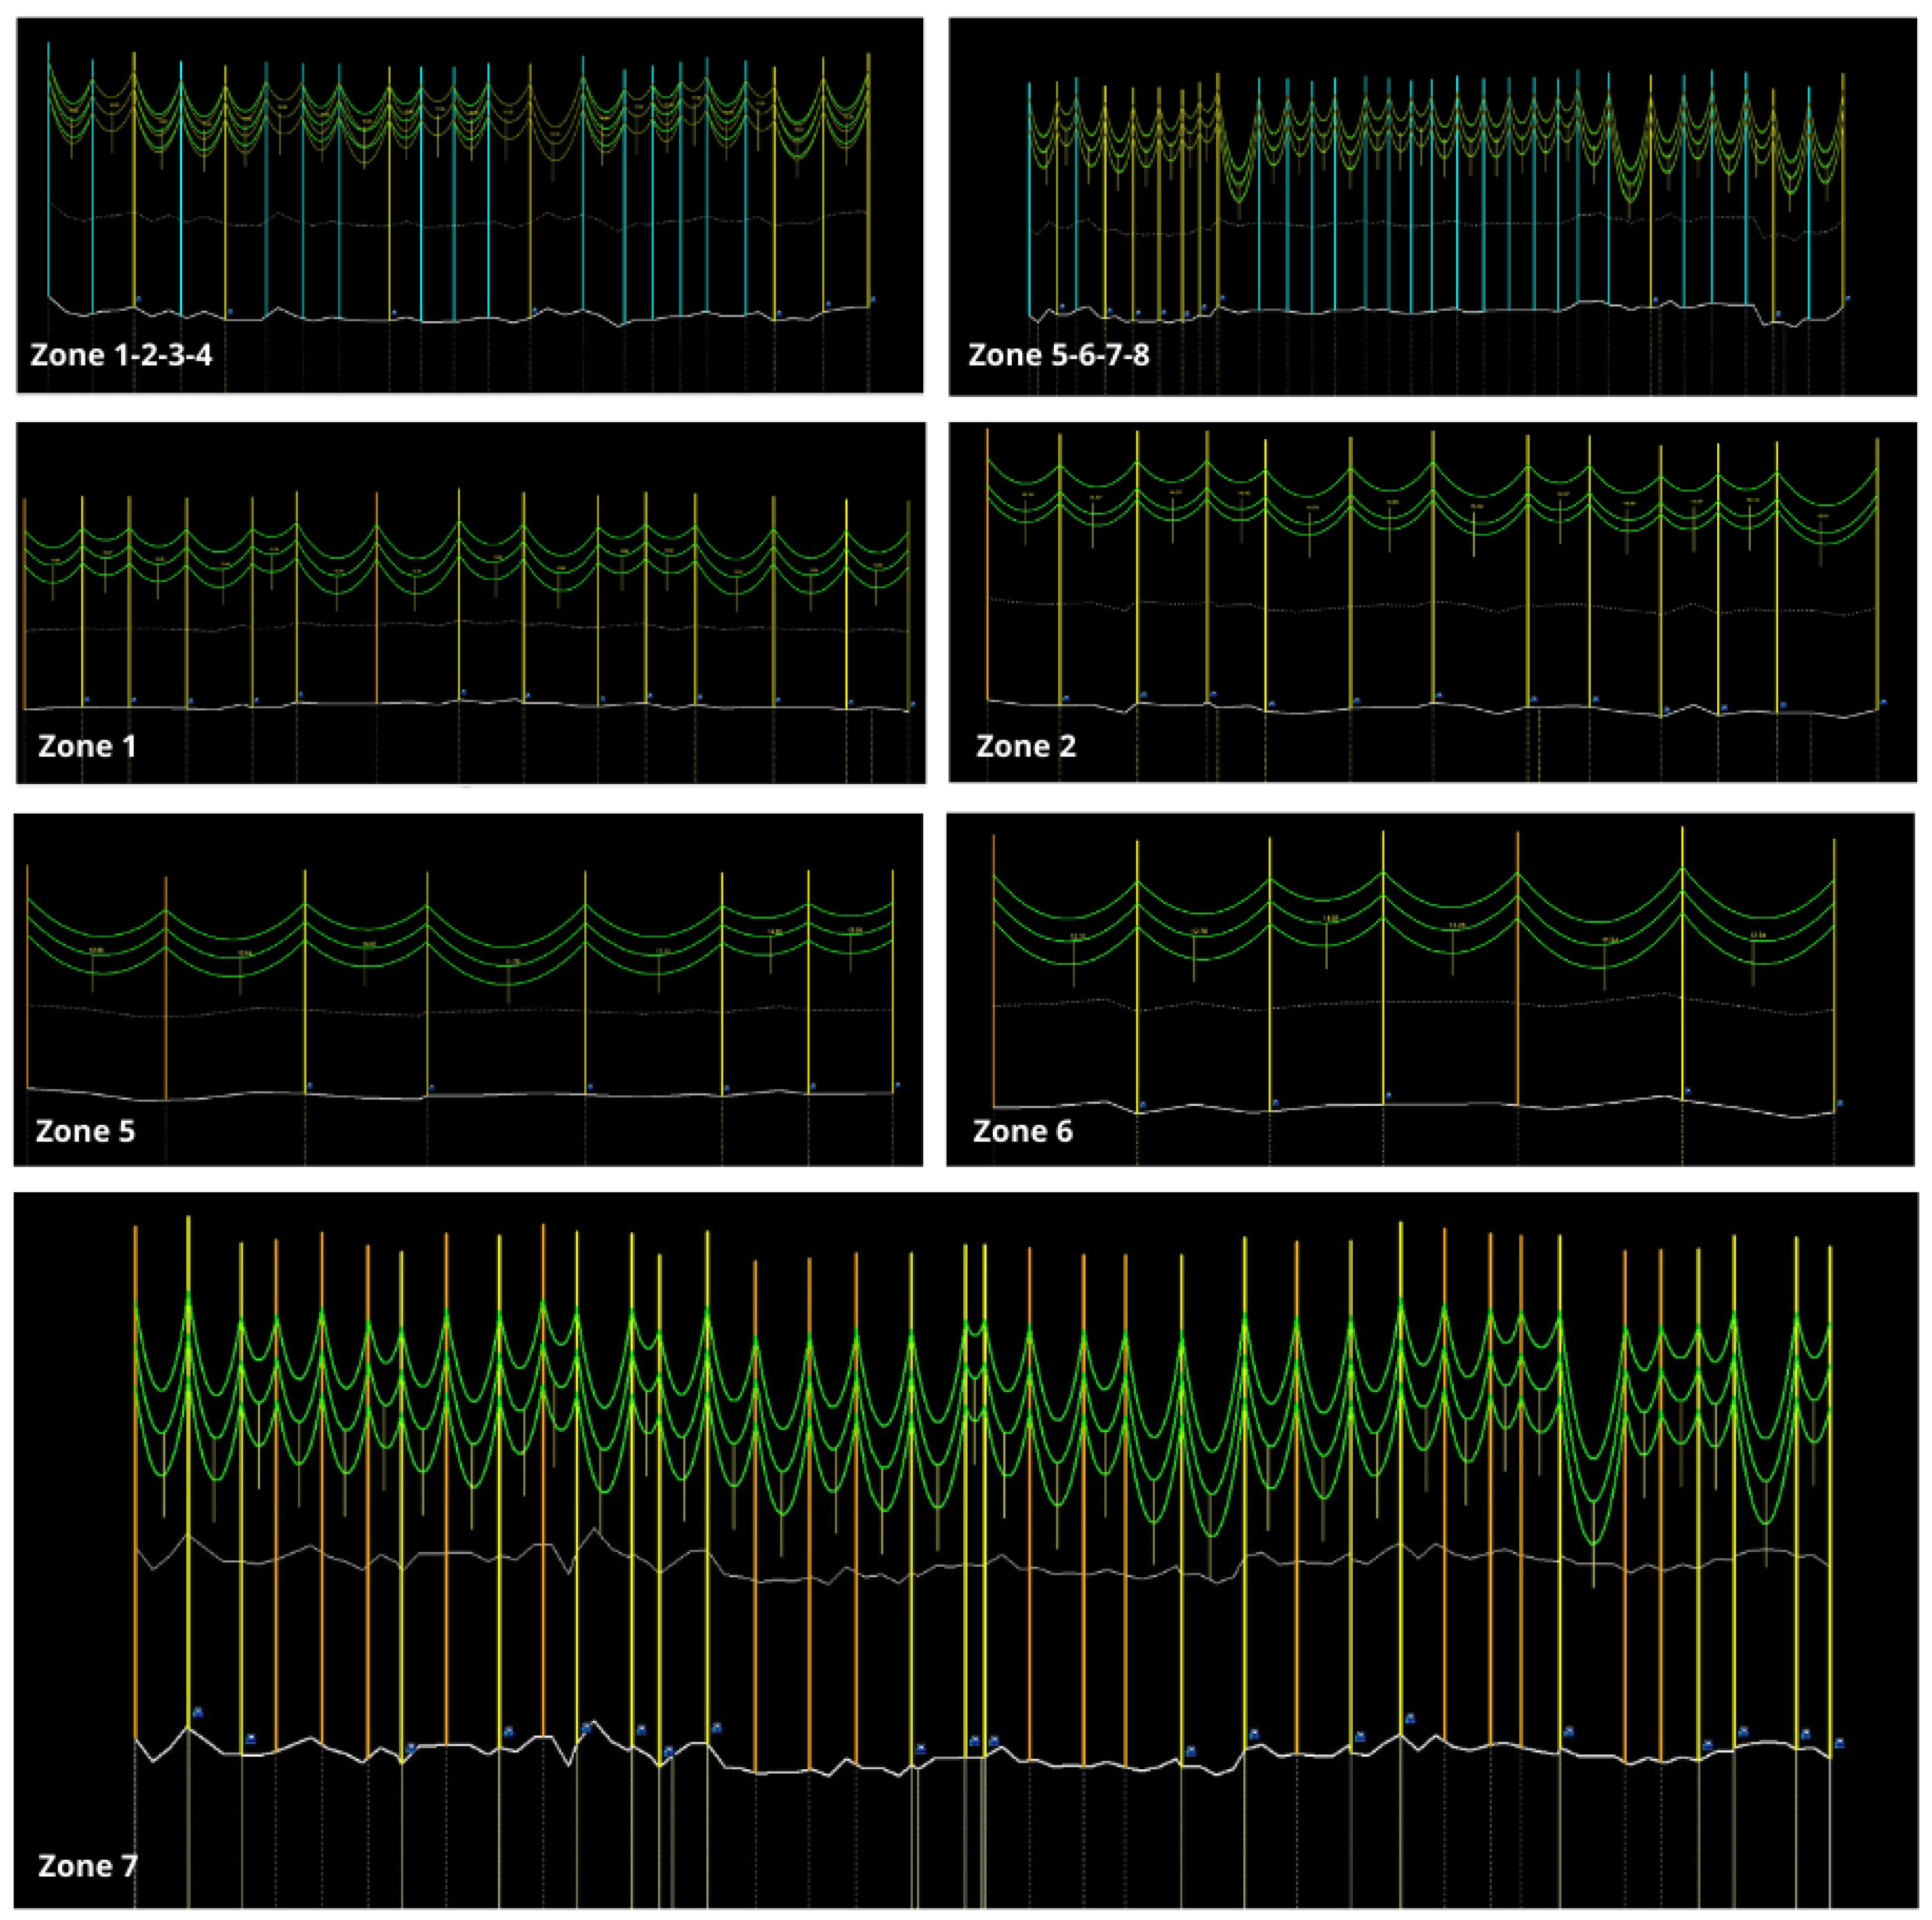
3.3. 69 kV Ring
3.4. Integration with the National Transmission Network
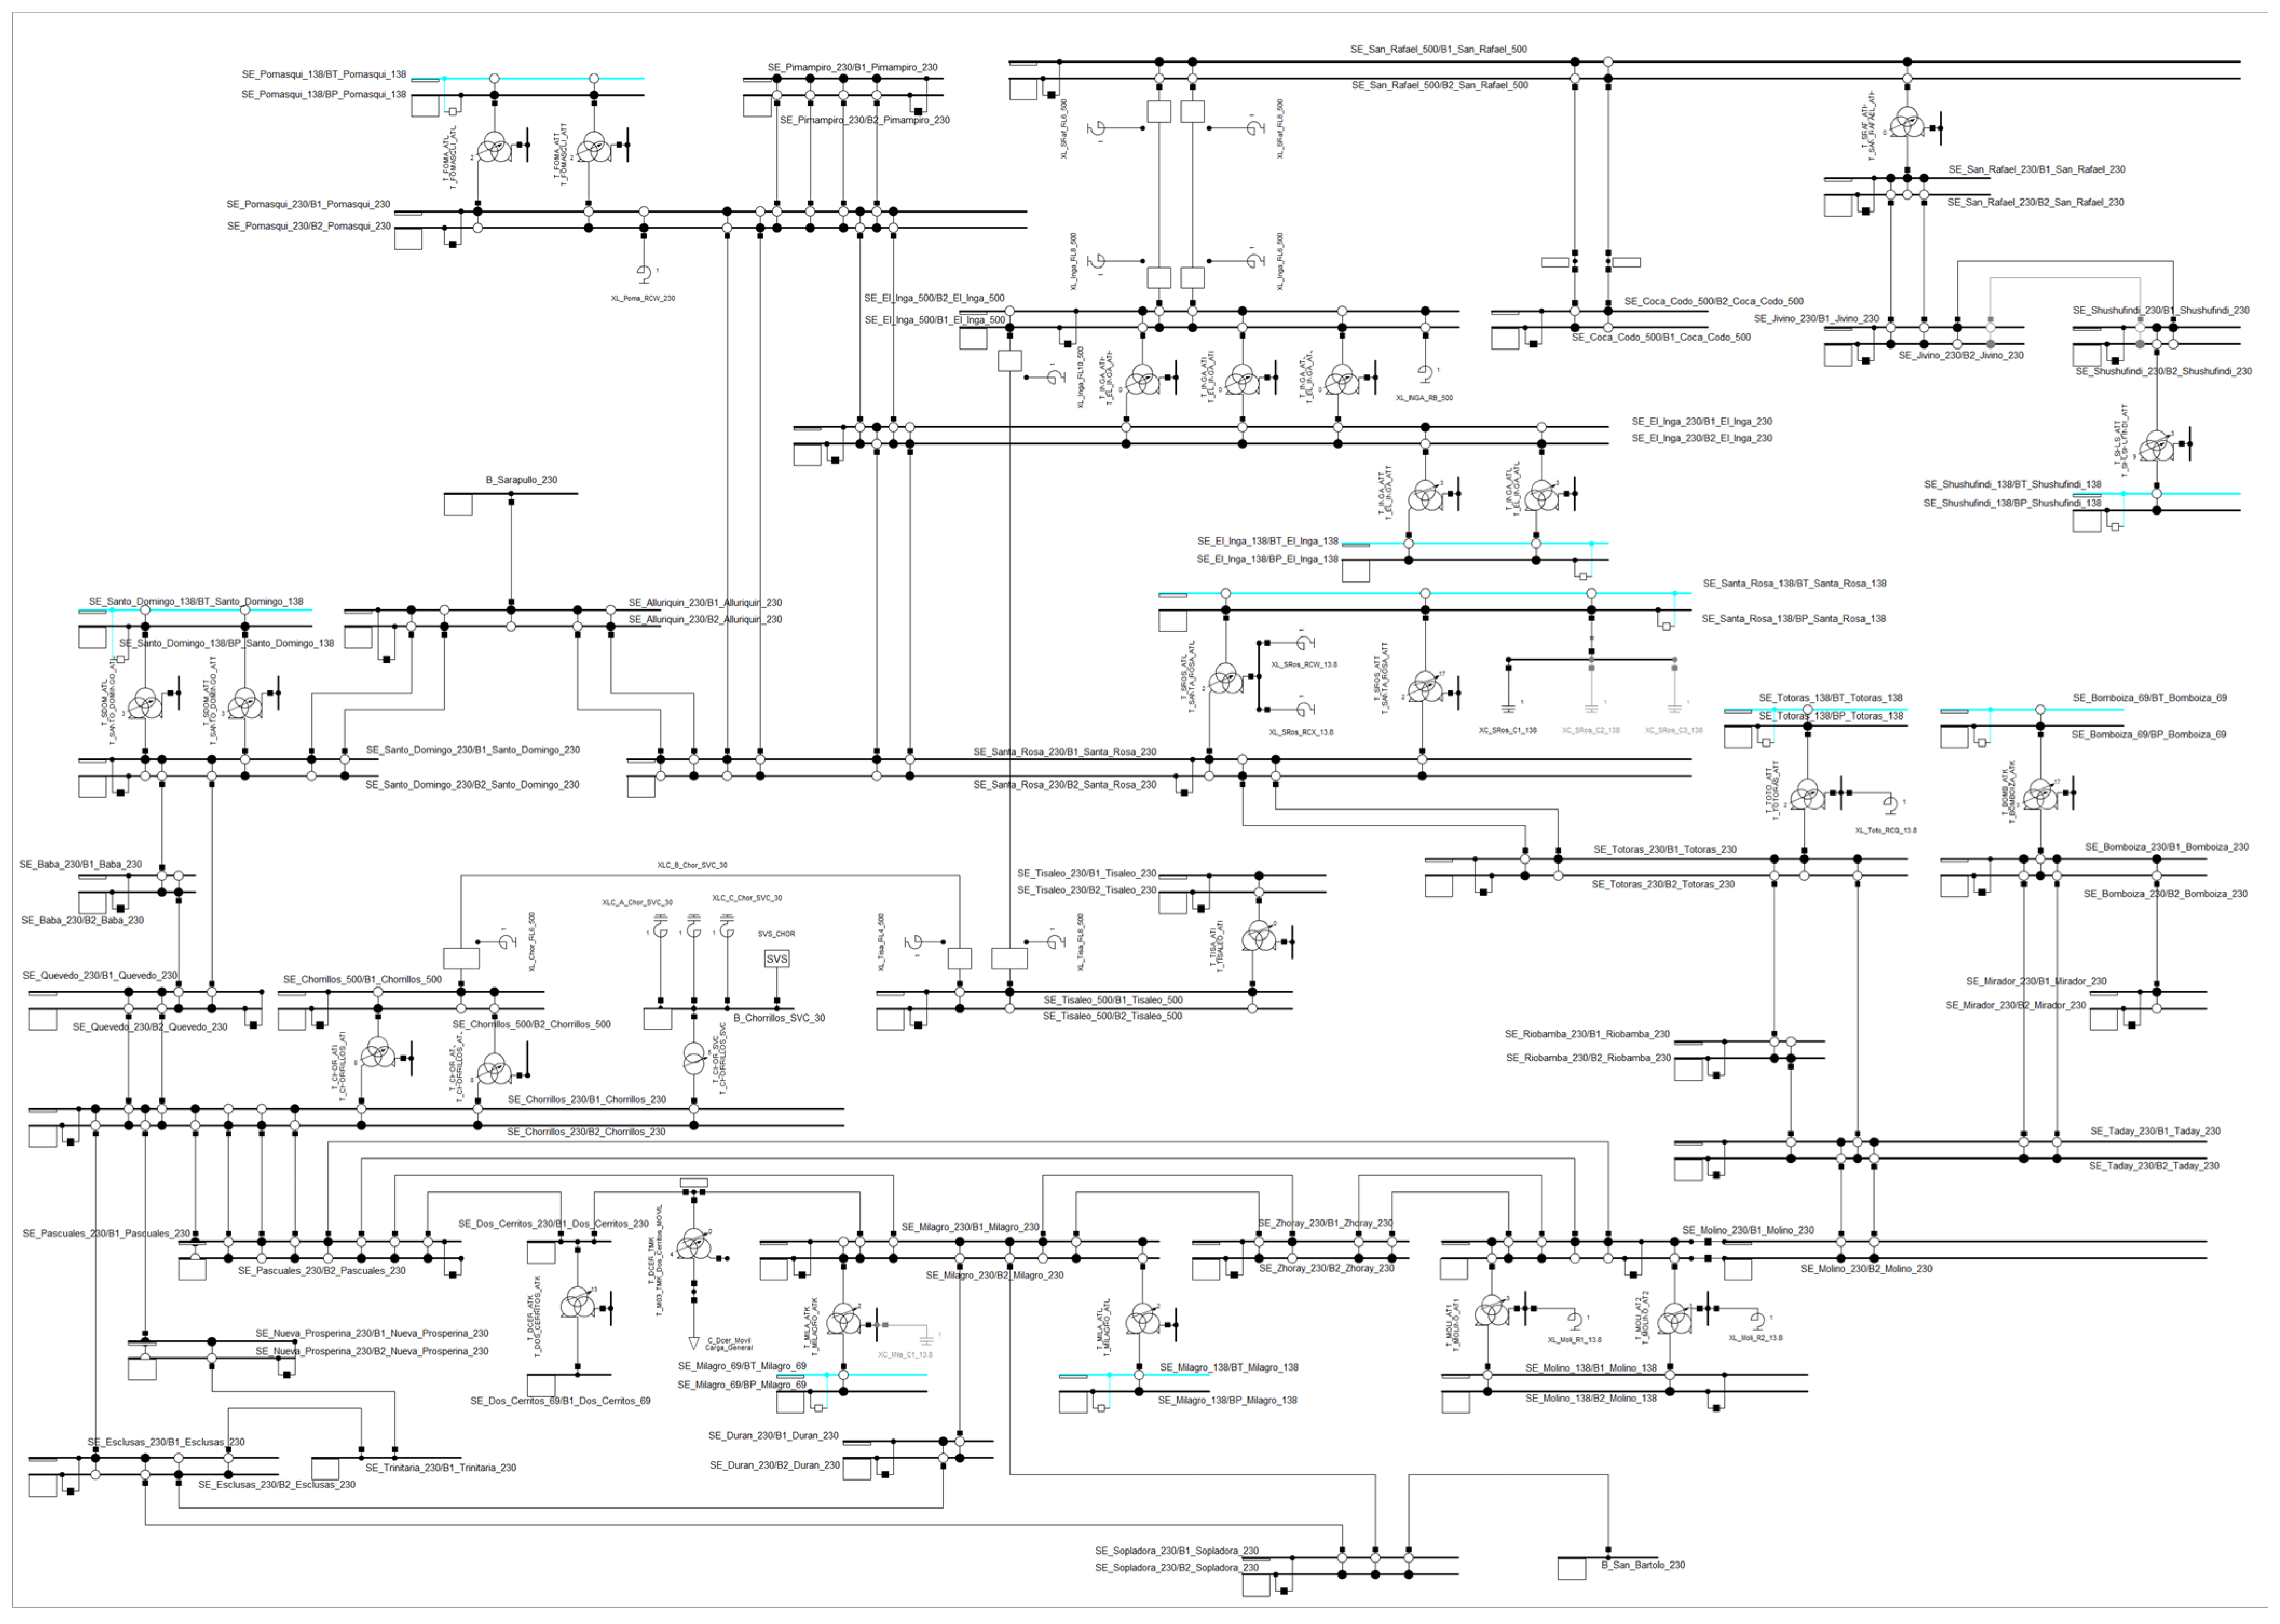
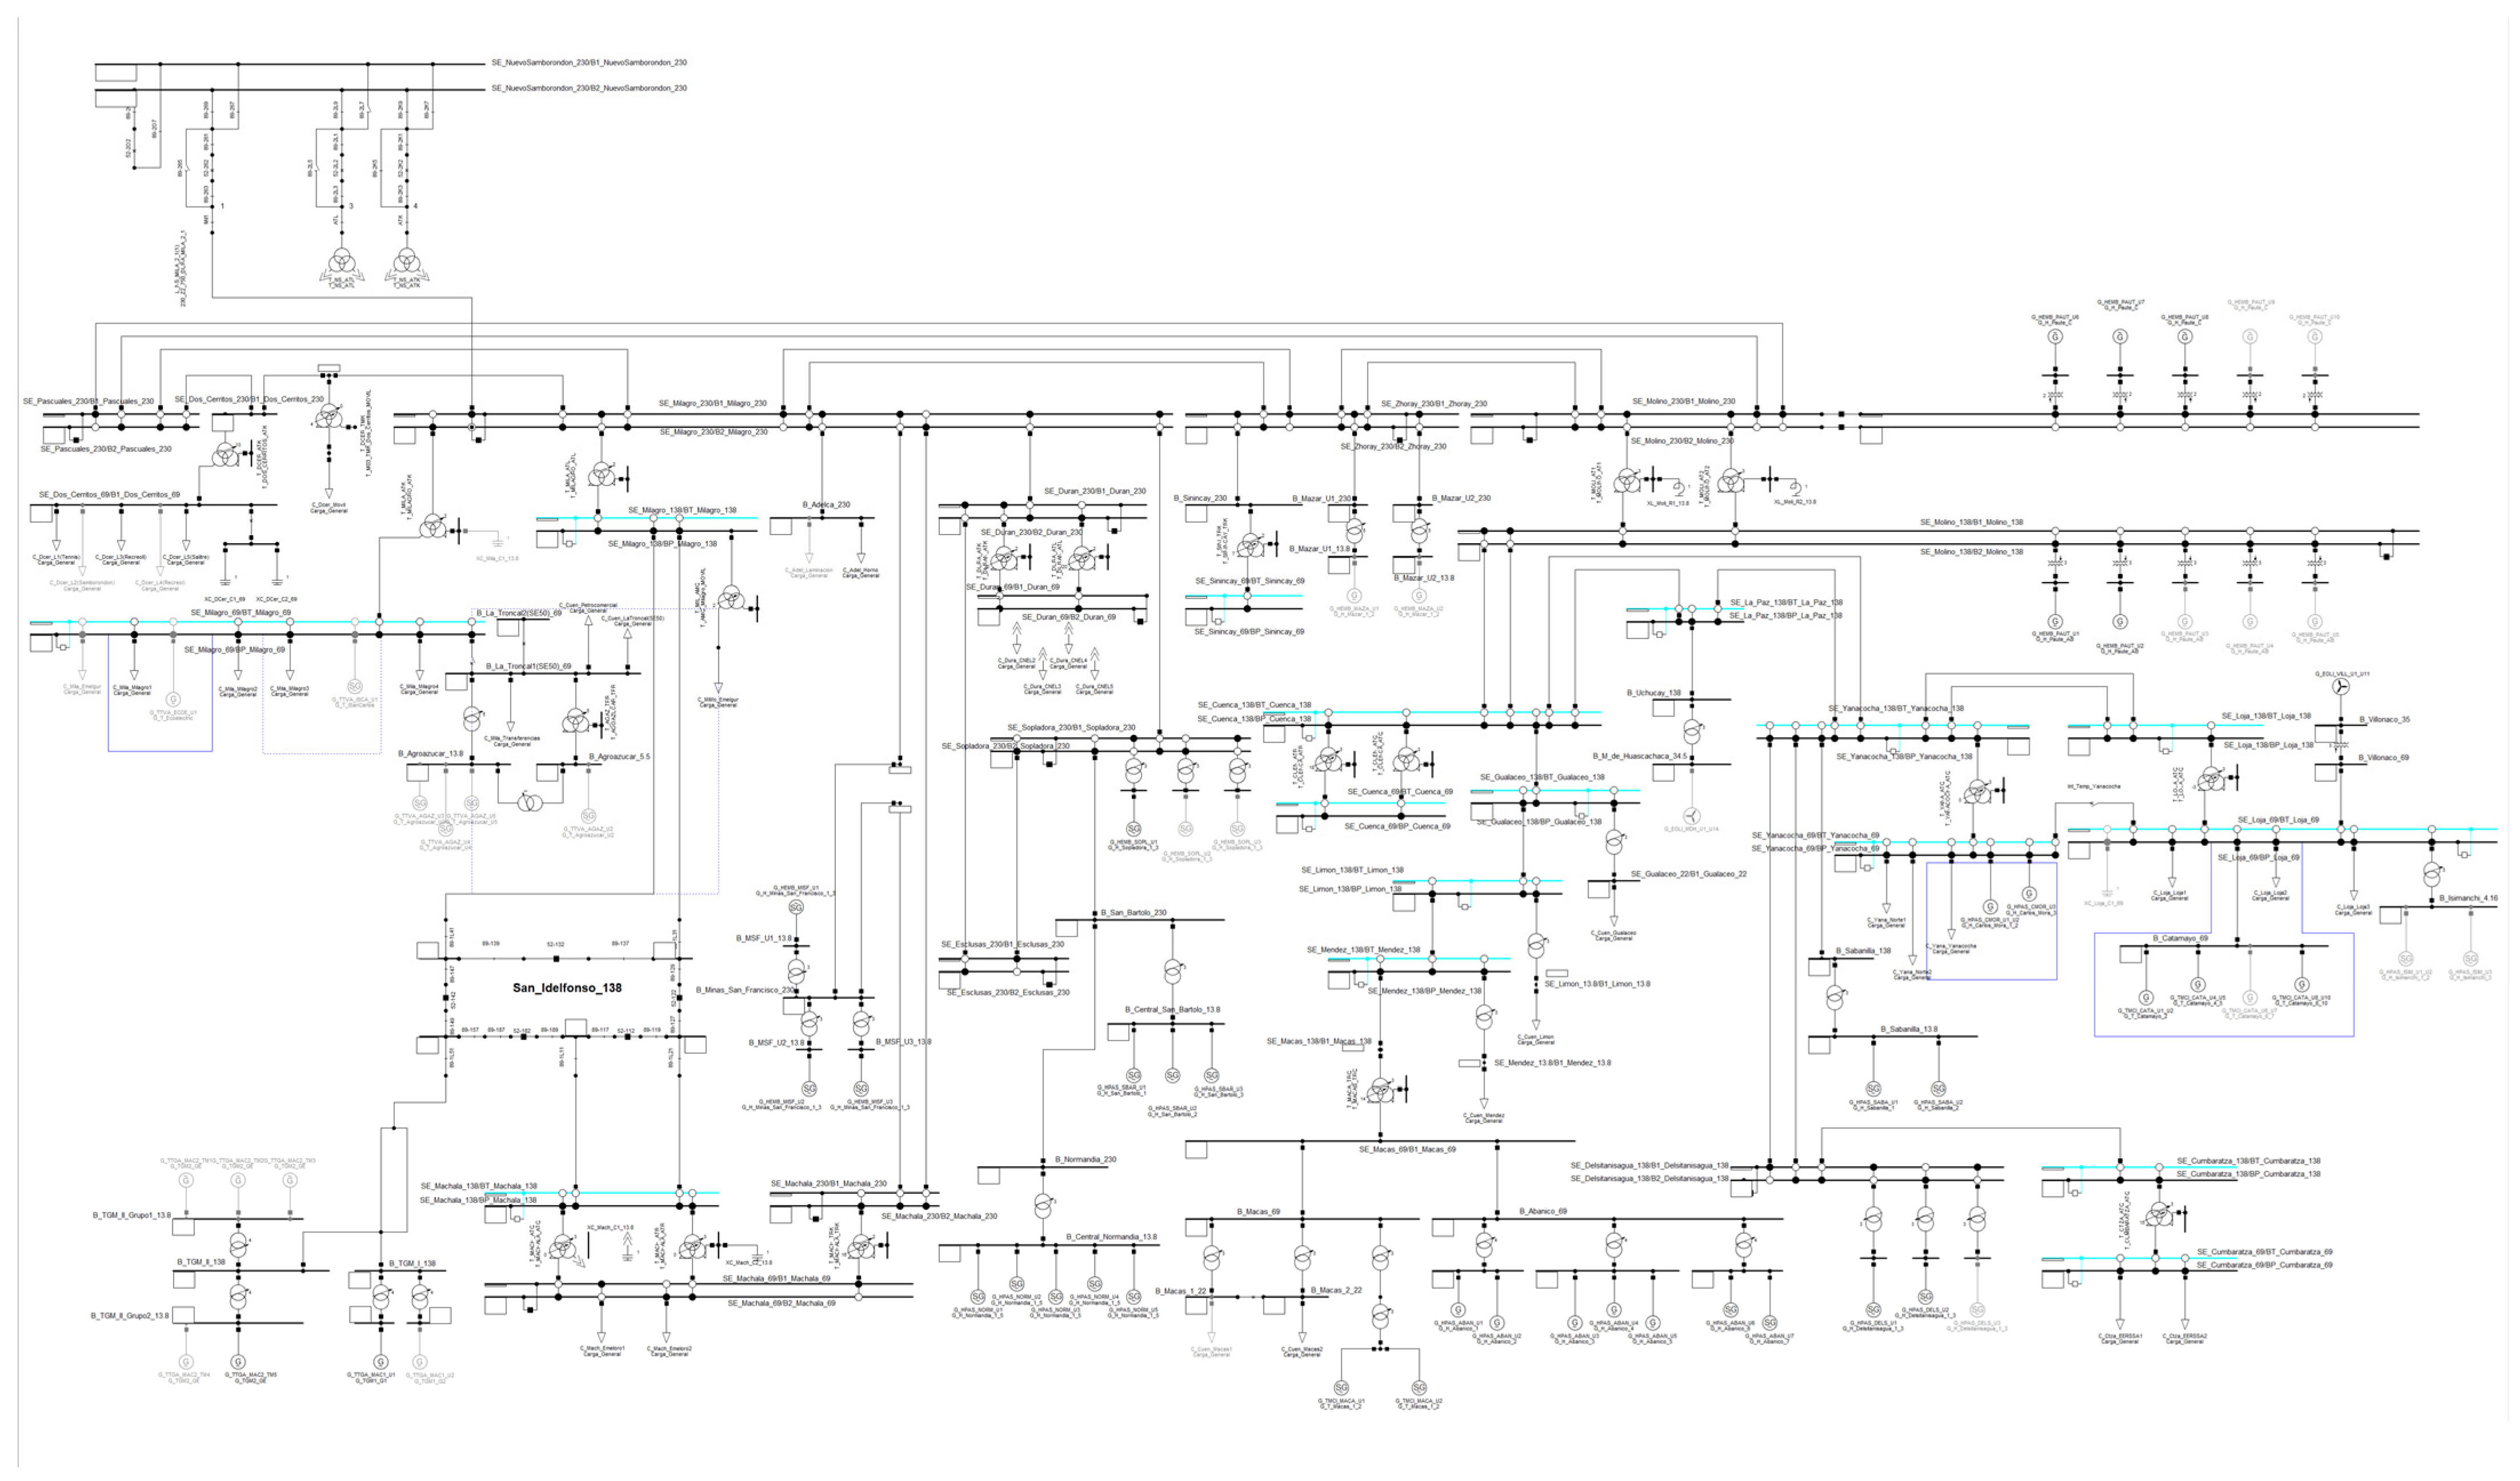
3.4.1. Ecuador’s 230 kV Network Modelled in PowerFactory DIgSILENT
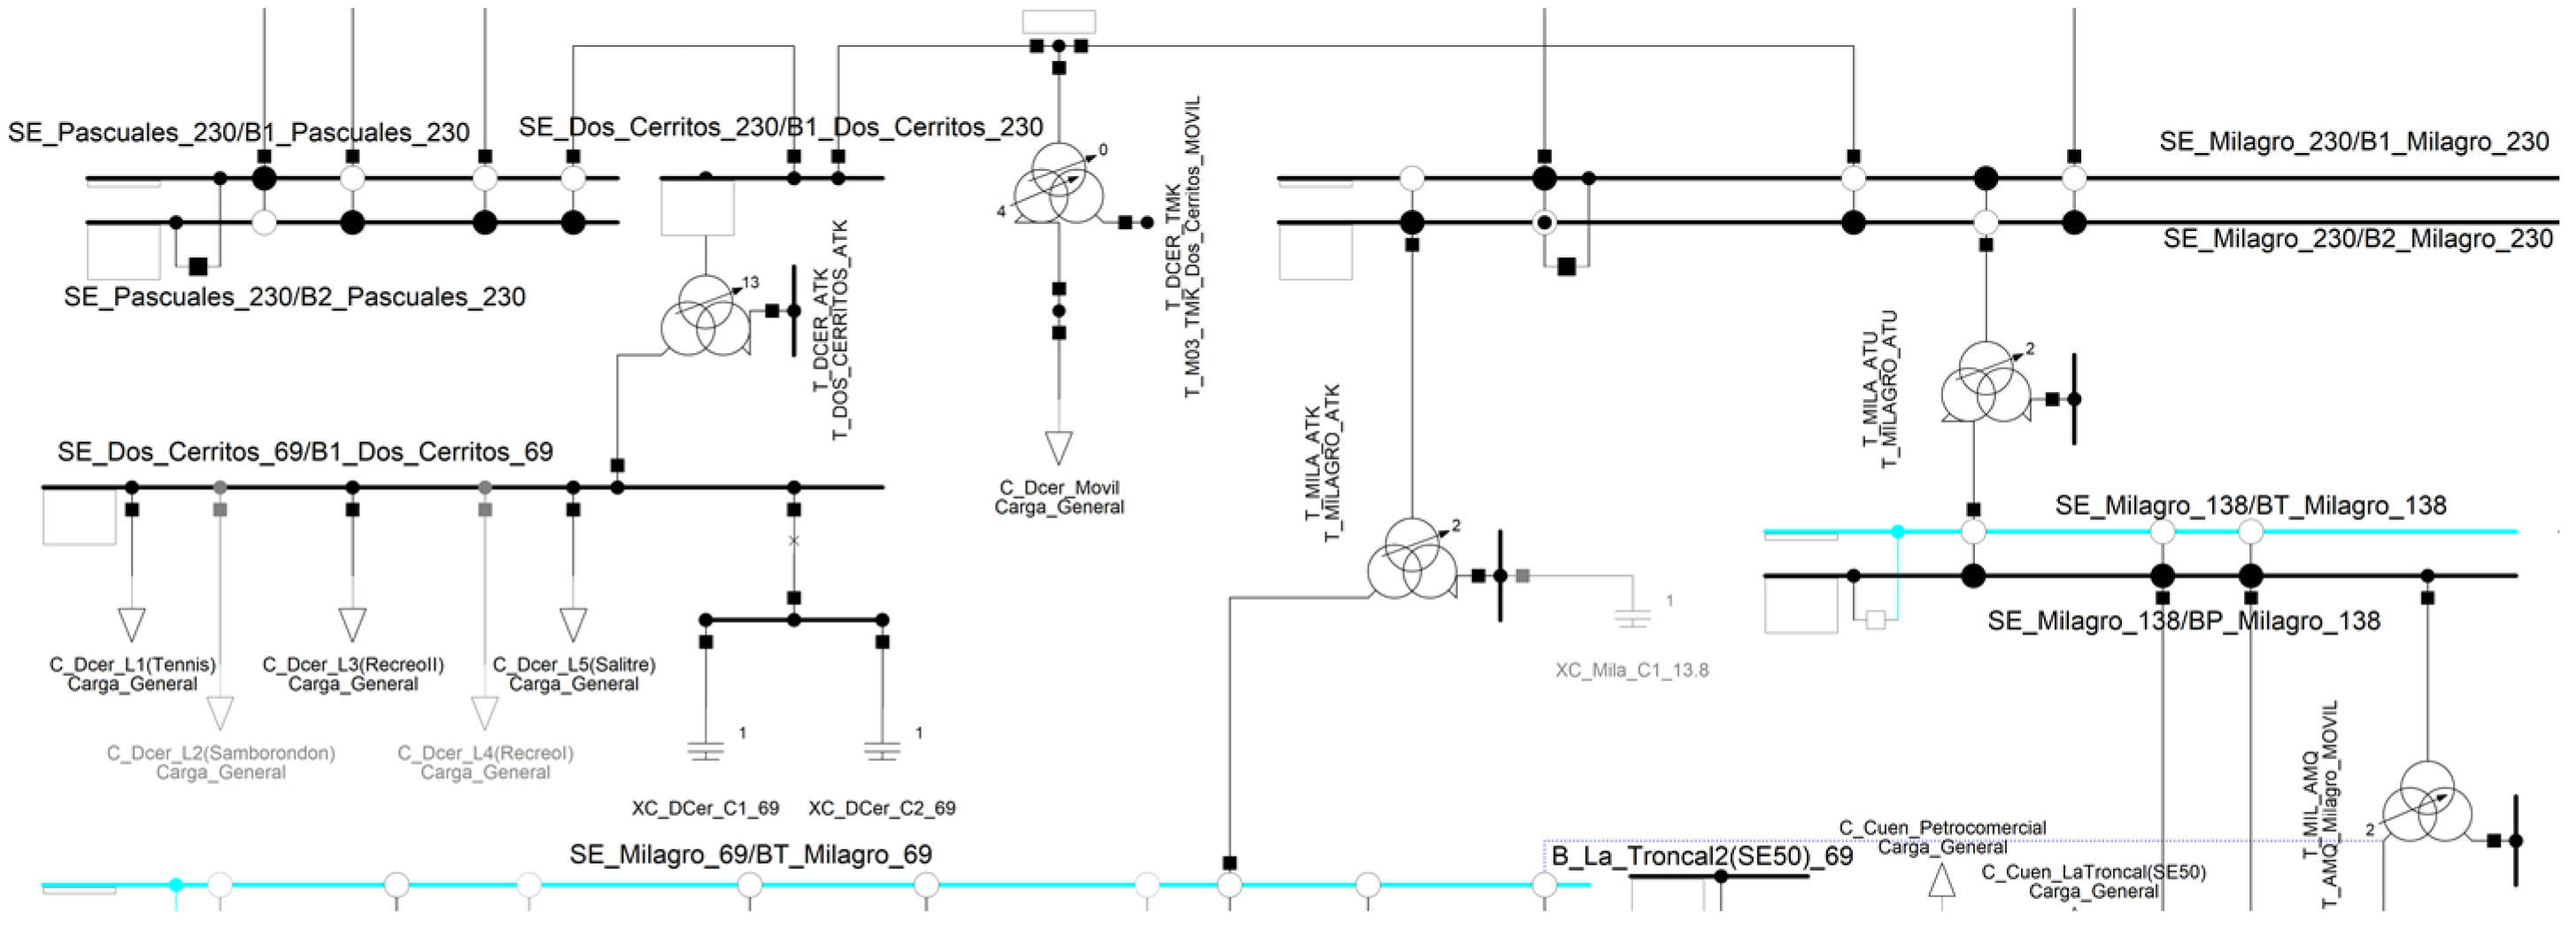
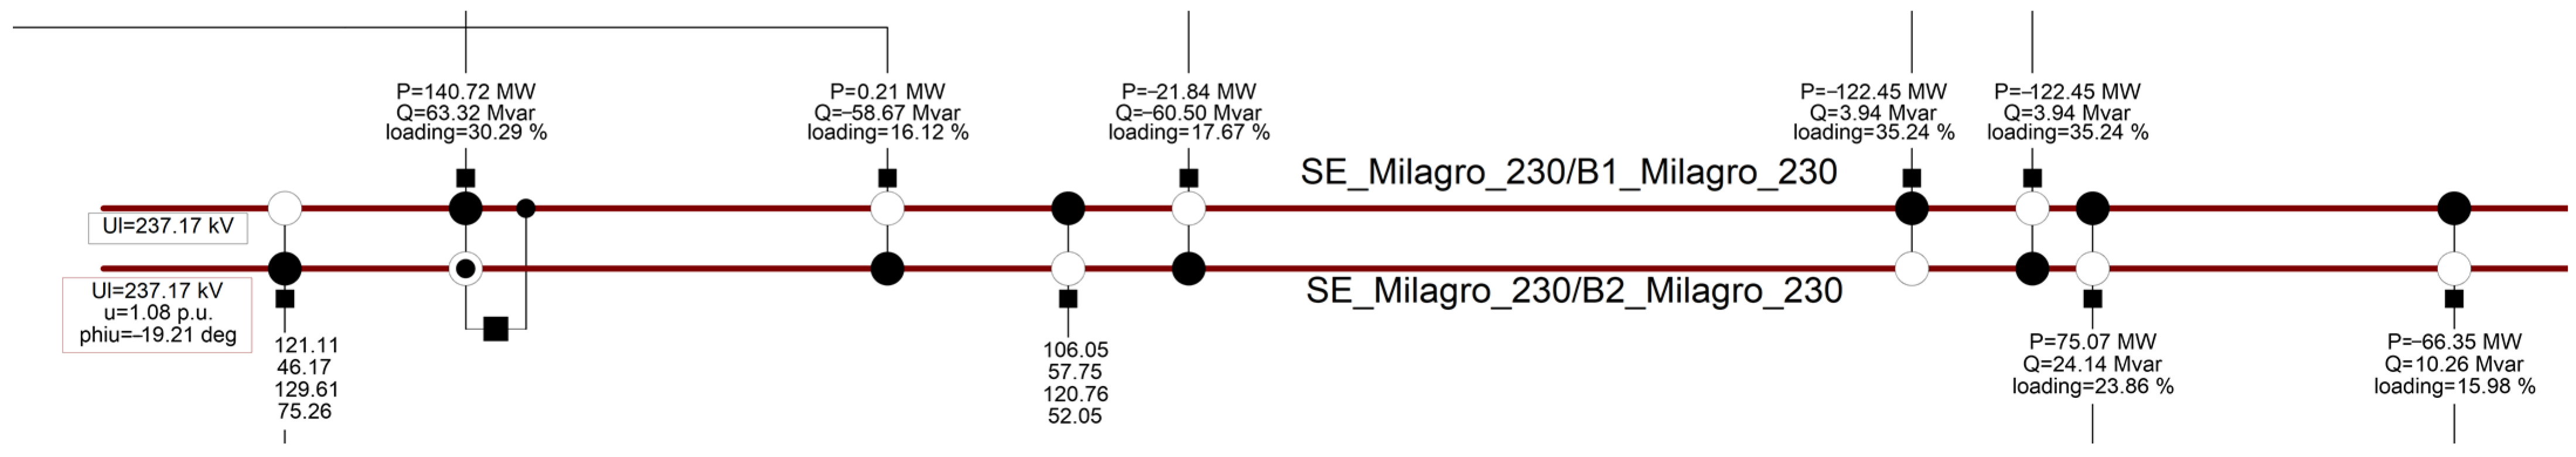
3.4.2. Molino-Milagro Zone
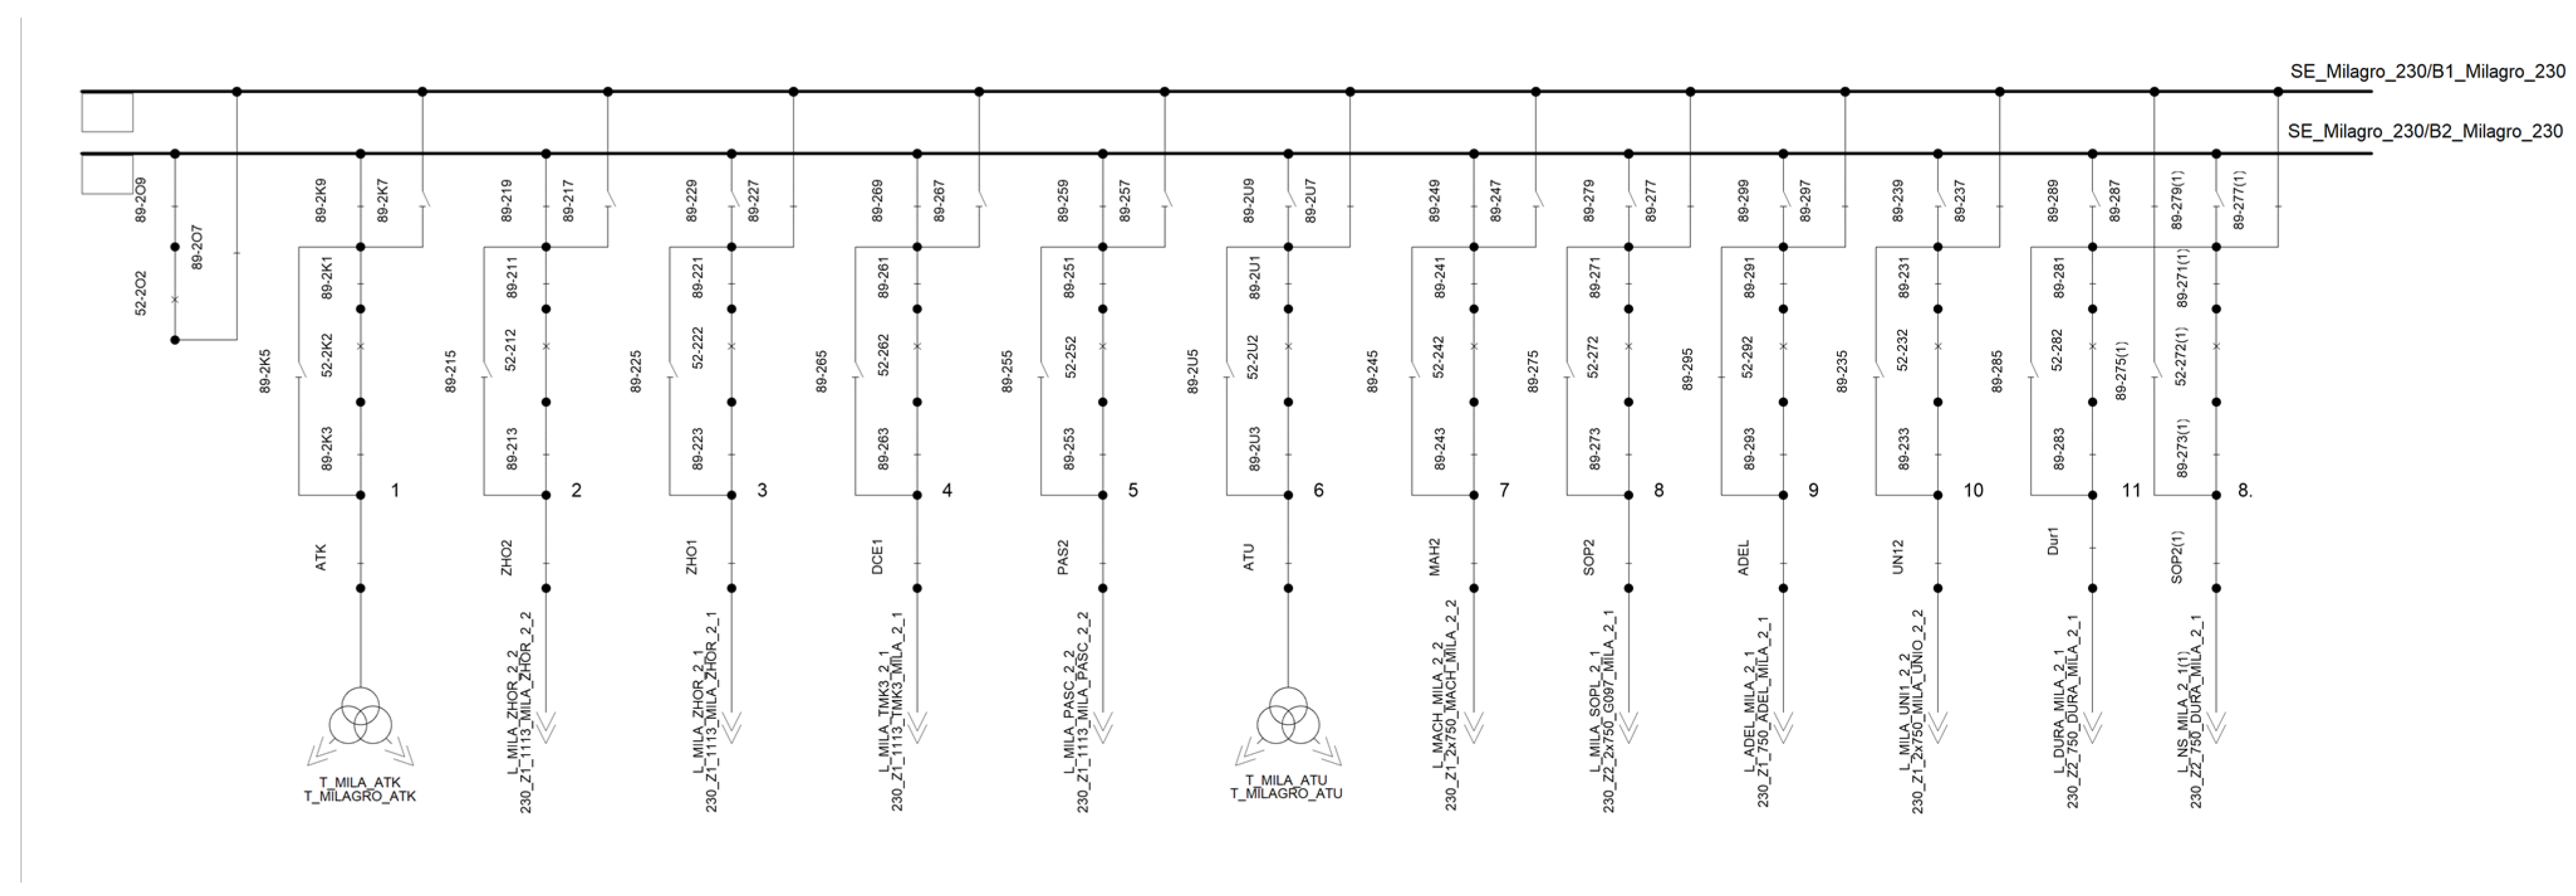
3.4.3. Milagro 230/69 kV Substation
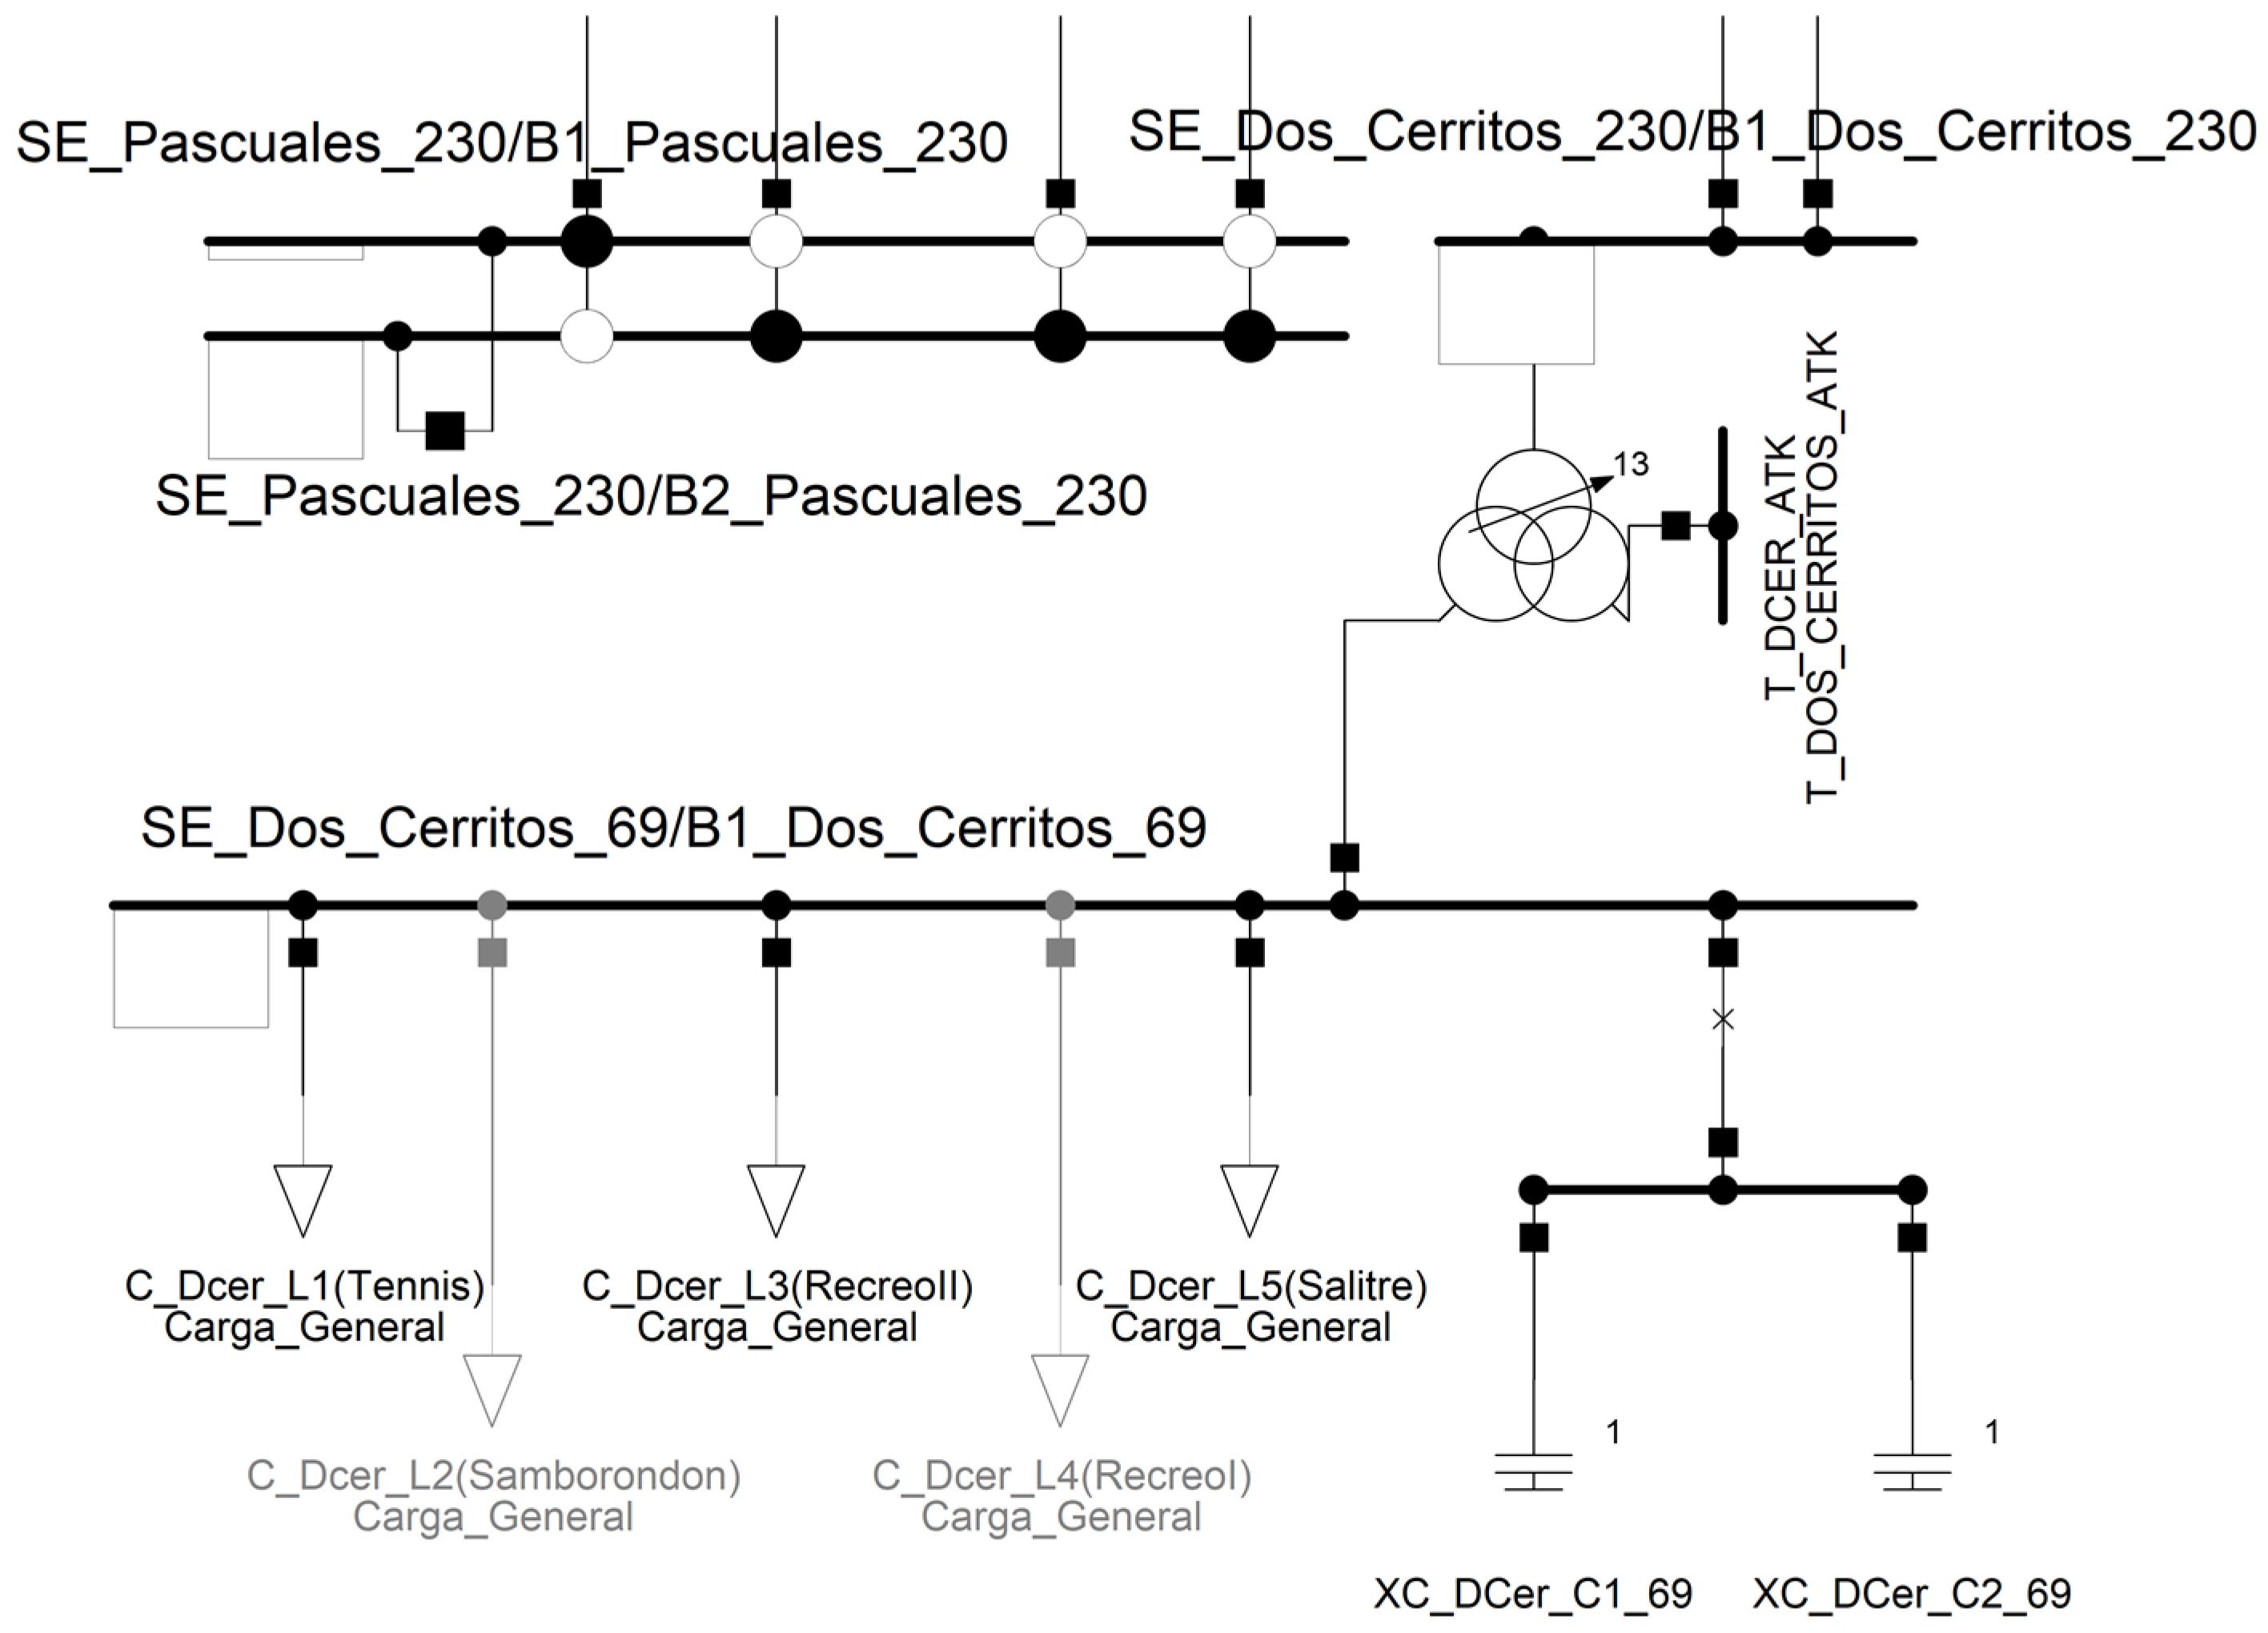
3.4.4. Dos Cerritos Substation
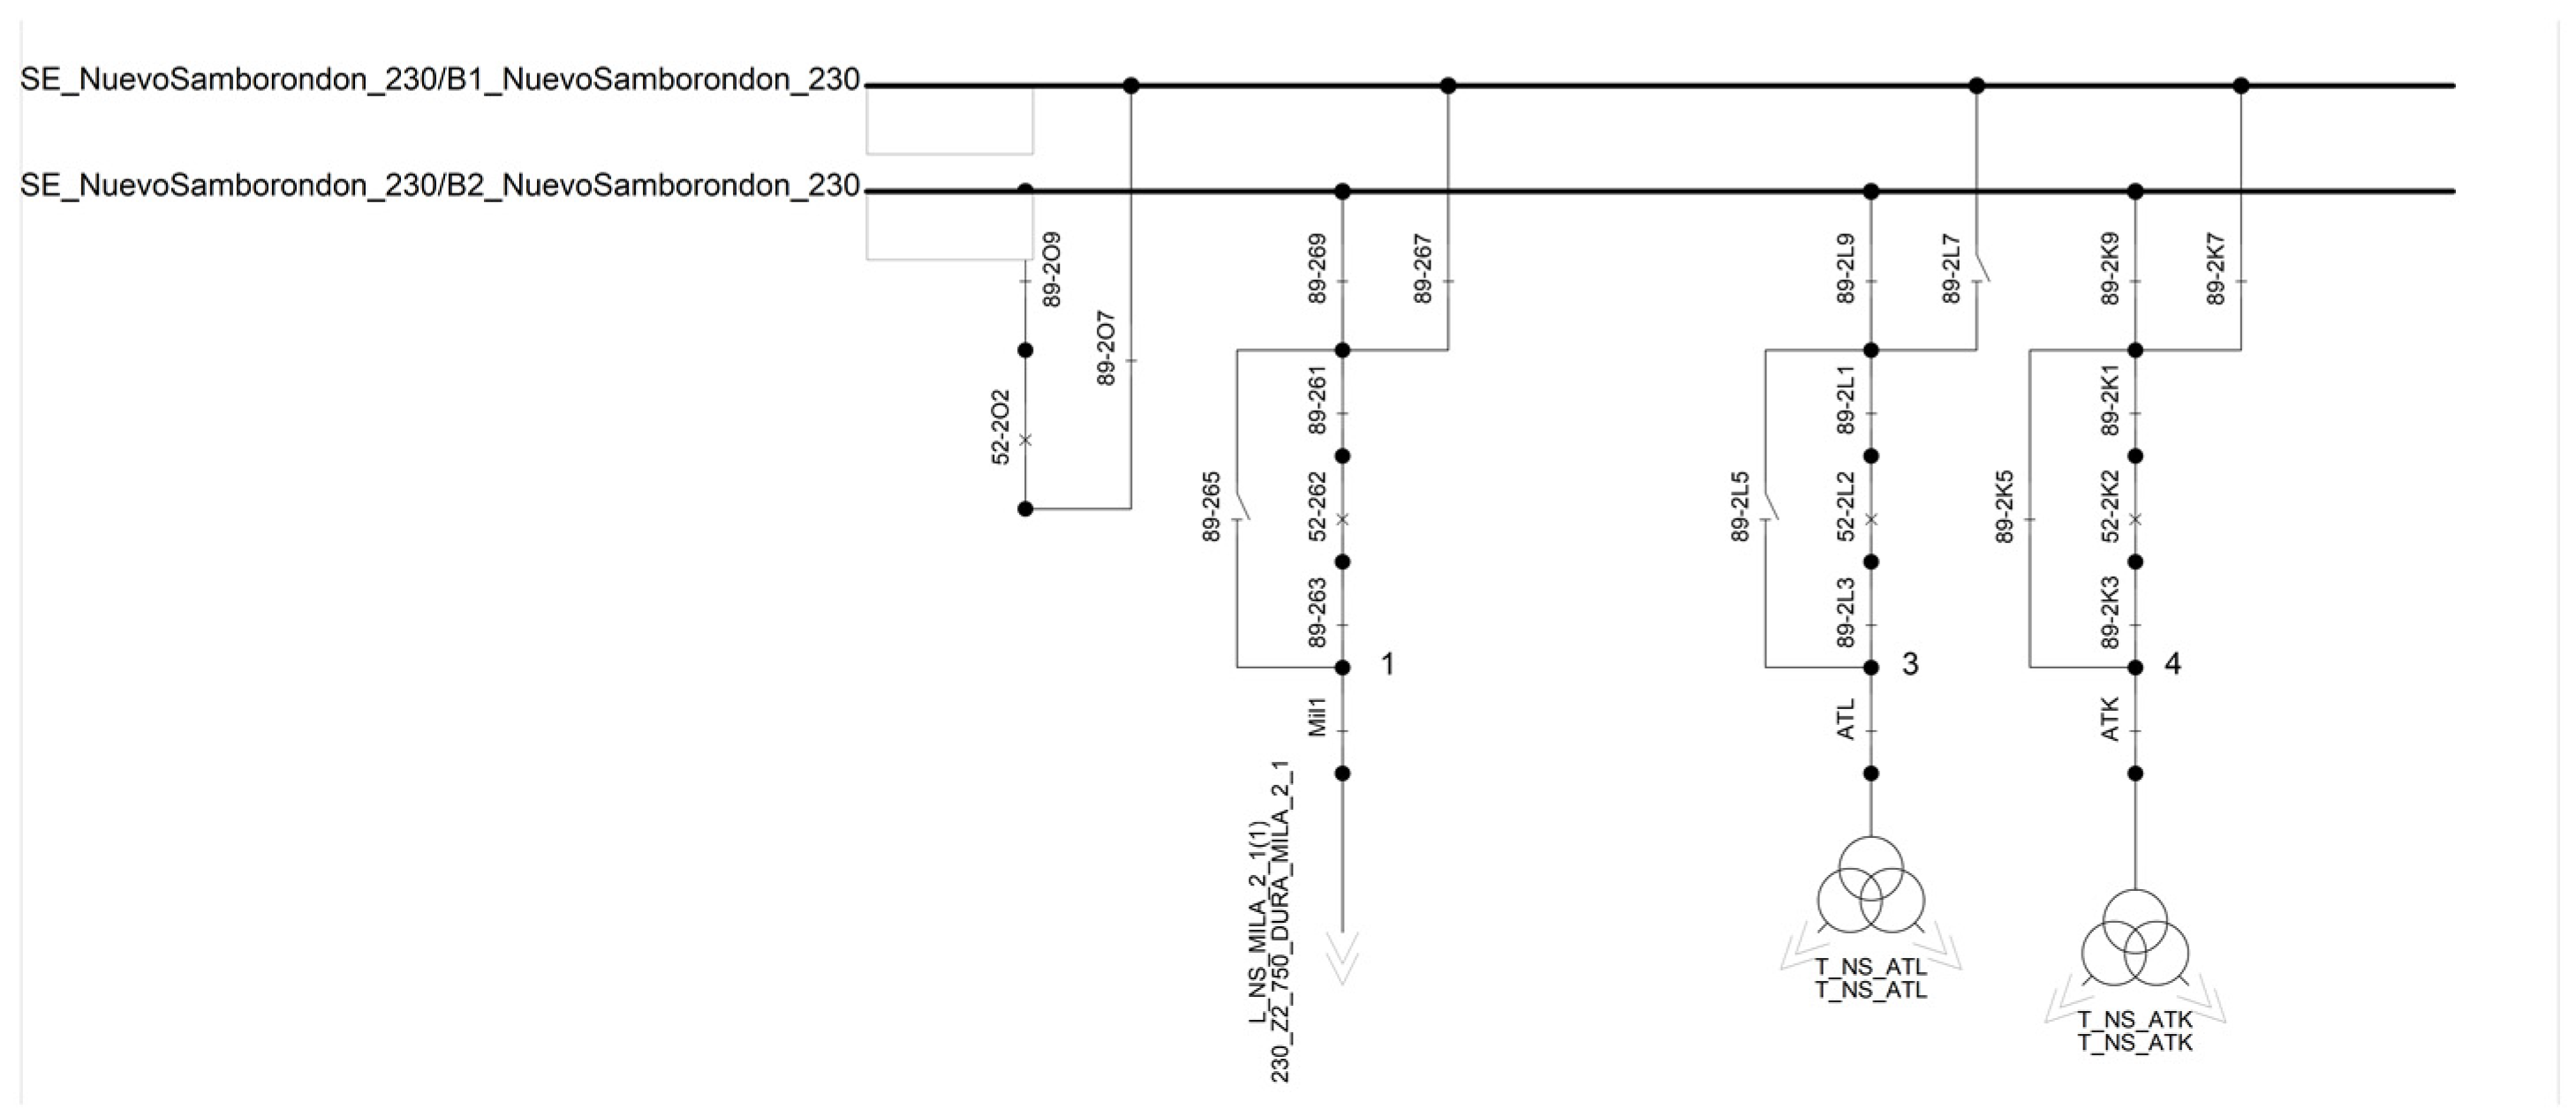
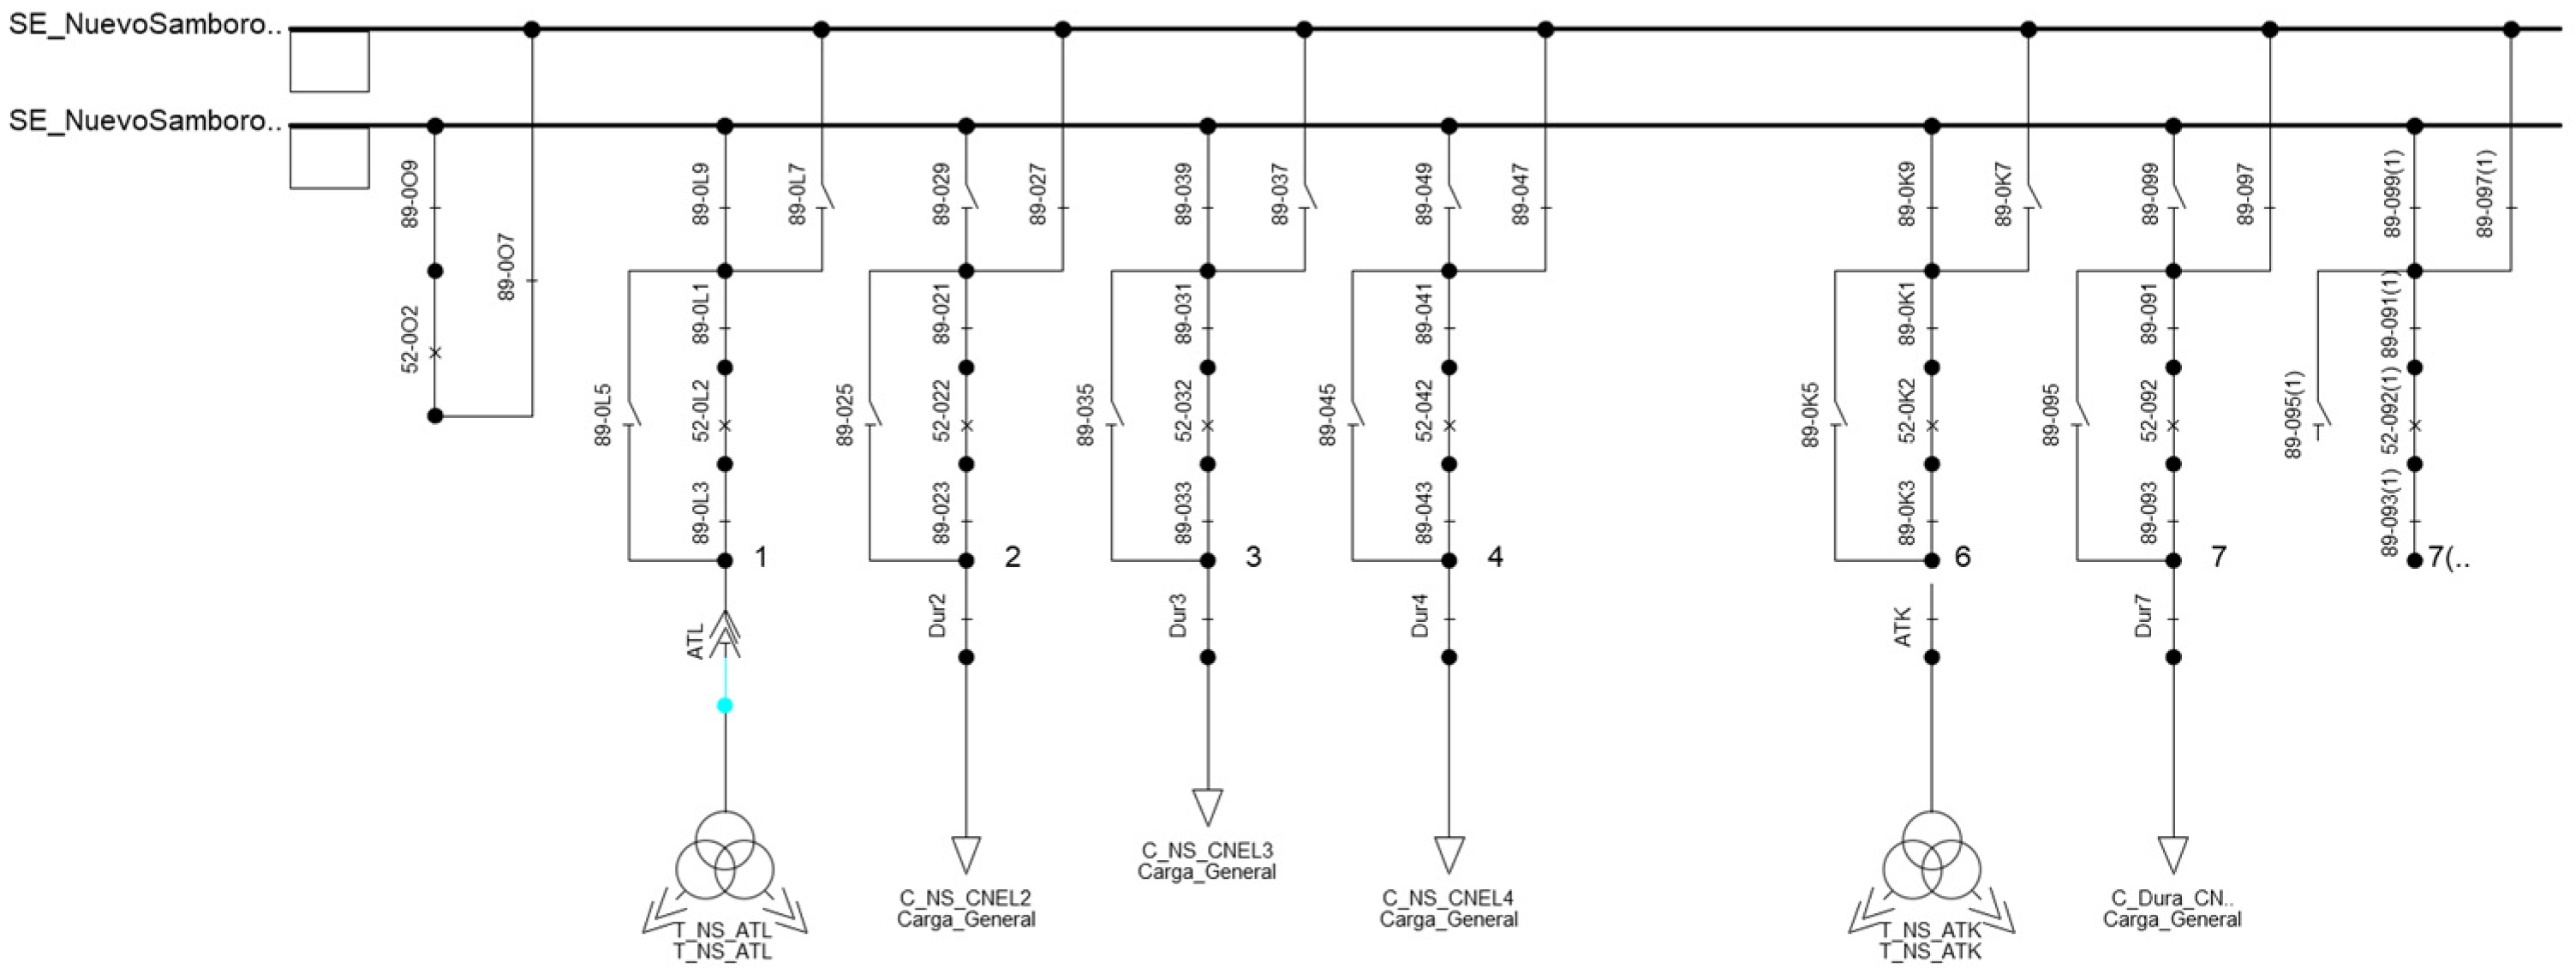
3.4.5. Sitting of the Nuevo Samborondón Substation
3.4.6. High-Voltage Section of the Nuevo Samborondón Substation
3.4.7. Low-Voltage Section of the Nuevo Samborondón Substation
3.4.8. Modelling of Feeder Loads
3.4.9. Load Flow
4. Discussion
5. Conclusions
Author Contributions
Funding
Data Availability Statement
Acknowledgments
Conflicts of Interest
References
- Zhang, B.; Hu, S.; Lakes, T. Coupling Renewal and Sprawl Processes on Block Level to Simulate Urban Residential Growth in Berlin. Sustain. Cities Soc. 2025, 121, 106183. [Google Scholar] [CrossRef]
- Tian, Y.; Tsendbazar, N.-E.; van Leeuwen, E.; Fensholt, R.; Herold, M. A Global Analysis of Multifaceted Urbanization Patterns Using Earth Observation Data from 1975 to 2015. Landsc. Urban Plan. 2022, 219, 104316. [Google Scholar] [CrossRef]
- Noor, S.; Yang, W.; Guo, M.; van Dam, K.H.; Wang, X. Energy Demand Side Management within Micro-Grid Networks Enhanced by Blockchain. Appl. Energy 2018, 228, 1385–1398. [Google Scholar] [CrossRef]
- Vázquez-Canteli, J.R.; Nagy, Z. Reinforcement Learning for Demand Response: A Review of Algorithms and Modeling Techniques. Appl. Energy 2019, 235, 1072–1089. [Google Scholar] [CrossRef]
- EDSA. Nuevo Samborondon|América Latina. Available online: https://www.edsaplan.com/es/project/nuevo-samborondon/ (accessed on 8 March 2025).
- Yépez, J.M. En Samborondón, Guayas, Se Construye La Ciudad de Los USD 1.000 Millones. Primicias 2024. Available online: https://www.primicias.ec/guayaquil/samborondon-guayas-construye-ciudad-usd-1-000-millones-79950/ (accessed on 13 January 2025).
- CELEC-EP. Plan de Expansión de La Transmisión; CELEC-EP: Quito, Ecuador, 2020. [Google Scholar]
- Costa, V.; Campanini, F. Community-Centred Energy Planning: Within and beyond Administrative Borders. Sustainability 2024, 16, 2049. [Google Scholar] [CrossRef]
- Delmastro, C.; Gargiulo, M. Capturing the Long-Term Interdependencies between Building Thermal Energy Supply and Demand in Urban Planning Strategies. Appl. Energy 2020, 268, 114774. [Google Scholar] [CrossRef]
- Resch, B.; Sagl, G.; Trnros, T.; Bachmaier, A.; Eggers, J.B.; Herkel, S.; Narmsara, S.; Gündra, H. GIS-Based Planning and Modeling for Renewable Energy: Challenges and Future Research Avenues. ISPRS Int. J. Geo-Inf. 2024, 3, 662–692. [Google Scholar] [CrossRef]
- CELEC-EP. Con Una Inversión de USD 168 Millones, CELEC EP Inicia La Construcción de Nuevos Sistemas de Transmisión Eléctrica. Available online: https://www.celec.gob.ec/transelectric/uncategorized/con-una-inversion-de-usd-168-millones-celec-ep-inicia-la-construccion-de-nuevos-sistemas-de-transmision-electrica/ (accessed on 8 March 2025).
- CELEC-EP. El Gobierno Nacional Invertirá USD 241 Millones En La Construcción de Nuevas Obras Para El Reforzamiento y Repotenciación Del Sistema Nacional de Transmisión (SNT). Available online: https://www.celec.gob.ec/transelectric/uncategorized/el-gobierno-nacional-invertira-usd-241-millones-en-la-construccion-de-nuevas-obras-para-el-reforzamiento-y-repotenciacion-del-sistema-nacional-de-transmision-snt/ (accessed on 8 March 2025).
- Kamel, E.; Memari, A.M. Automated Building Energy Modeling and Assessment Tool (ABEMAT). Energy 2018, 147, 15–24. [Google Scholar] [CrossRef]
- Kandelan, S.N.; Mohammed, N.A.C.; Grewal, K.S.; Farooque, A.A.; Hu, Y. Geometric Data in Urban Building Energy Modeling: Current Practices and the Case for Automation. J. Build. Eng. 2024, 97, 110836. [Google Scholar] [CrossRef]
- Chouhan, S.; Barrett, D.M.; Inan, H.; Feliachi, A.; Mayfield, H. Model Based Design of West Virginia Super Circuit(WVSC) Microgrid System. In Proceedings of the 2017 North American Power Symposium, NAPS, Morgantown, WV, USA, 17–19 September 2017. [Google Scholar] [CrossRef]
- Mondragón Bizueta, J.P. Diseño de Una Línea de Electrificación Rural de 20 Km En Base a Normativa Nacional Vigente y Simulación En DLT-CAD. Bachelor’s Thesis, Universidad de Piura, Piura, Peru, 2024. [Google Scholar]
- Jhuliams, J.; Castillon, H. Implementación de Una Línea de Sub Transmisión En 22.9 KV Para La Comunidad de Santa Catalina–Huaral. Master’s Thesis, Universidad Nacional del Centro del Perú, Huancayo, Peru, 2023. [Google Scholar]
- Das, C.K.; Bass, O.; Mahmoud, T.S.; Kothapalli, G.; Masoum, M.A.S.; Mousavi, N. An Optimal Allocation and Sizing Strategy of Distributed Energy Storage Systems to Improve Performance of Distribution Networks. J. Energy Storage 2019, 26, 100847. [Google Scholar] [CrossRef]
- Logan, T.M.; Hobbs, M.H.; Conrow, L.C.; Reid, N.L.; Young, R.A.; Anderson, M.J. The X-Minute City: Measuring the 10, 15, 20-Minute City and an Evaluation of Its Use for Sustainable Urban Design. Cities 2022, 131, 103924. [Google Scholar] [CrossRef]
- Ministerio de Desarrollo Urbano y Vivienda (MIDUVI). Norma Ecuatoriana de la Construcción NEC-SB-IE Instalaciones Eléctricas; MIDUVI: Quito, Ecuador, 2018. [Google Scholar]
- Asamblea Nacional del Ecuador. Ley Orgánica Del Servicio Público de Energía Eléctrica; Asamblea Nacional del Ecuador: Quito, Ecuador, 2018. [Google Scholar]
- Agencia de Regulación y Control de Electricidad. Código de Conexión Del Sistema Eléctrico Ecuatoriano; ARCONEL: Quito, Ecuador, 2024. [Google Scholar]
- Agencia de Regulación y Control de Energía y Recursos Naturales No Renovables. Código de Operación Del Sistema Eléctrico Ecuatoriano; ARCONEL: Quito, Ecuador, 2024. [Google Scholar]
- IEEE Standard. IEEE Recommended Practice for Industrial and Commercial Power Systems Analysis (Brown Book); IEEE: Piscataway, NJ, USA, 1998. [Google Scholar]
- Institute of Electrical and Electronics Engineers. IEEE Guide for Application of Power Electronics for Power Quality Improvement on Distribution Systems Rated 1 KV Through 38 KV; IEEE: Piscataway, NJ, USA, 2012. [Google Scholar]
- EnergyPlus Energy Simulation Software for Buildings. Available online: www.energyplus.net (accessed on 16 March 2025).
- OpenStudio Building Energy Modeling Software. Available online: www.openstudio.net (accessed on 16 March 2025).
- Alghoul, S.K.; Rijabo, H.G.; Mashena, M.E. Energy Consumption in Buildings: A Correlation for the Influence of Window to Wall Ratio and Window Orientation in Tripoli, Libya. J. Build. Eng. 2017, 11, 82–86. [Google Scholar] [CrossRef]
- ASHRAE 189.1-2009; ASHRAE Standard for Design of High-Performance Green Buildings. American Society of Heating and Air-Conditioning Engineers: Atlanta, GA, USA, 2009.
- ASHRAE 169-2006-1A; ASHRAE Weather Data for Building Design Standards. American Society of Heating and Air-Conditioning Engineers: Atlanta, GA, USA, 2006.
- Blazek, P.; Bohacik, A.; Fujdiak, R.; Jurak, V.; Ptacek, M. Smart Grids Transmission Network Testbed: Design, Deployment, and Beyond. IEEE Open J. Commun. Soc. 2025, 6, 51–76. [Google Scholar] [CrossRef]
- Mohammed, R.; Majid, J. Smart Energy Management Systems and Renewable Energy Resources; Rizwan, M., Jamil, M., Eds.; AIP Publishing LLCMelville: New York, NY, USA, 2021; ISBN 978-0-7354-2279-7. [Google Scholar]
- IEC 61850; “Communication Networks and Systems in Substations”—14 Parts Issued as International Standard (IS) Between 2002 and 2004 by IEC. International Electrotechnical Commission: Geneva, Switzerland, 2002–2004. Available online: https://iec61850.dvl.iec.ch/ (accessed on 16 March 2025).
- IEC 61850-5; “Communication Networks and Systems in Substations”—Part 5: Communication Requirements for Functions and Device Models. International Electrotechnical Commission: Geneva, Switzerland, 2004.
- IEC 61850-6; “Communication Networks and Systems in Substations”—Part 6: Configuration Description Language for Communication in Electrical Substations Related to IEDs. International Electrotechnical Commission: Geneva, Switzerland, 2009.
- IEC 61850-7-2; “Communication Networks and Systems in Substations”—Part 7-2: Basic Communication Structure for Substation and Feeder Equipment—Abstract Communication Service Interface (ACSI). International Electrotechnical Commission: Geneva, Switzerland, 2010.
- IEC 61850-7-3; “Communication Networks and Systems in Substations”—Part 7-3: Basic Communication Structure for Substation and Feder Equipment—Common Data Classes. International Electrotechnical Commission: Geneva, Switzerland, 2003.
- IEC 61850-7-4; “Communication Networks and Systems in Substations”—Part 7-4: Basic Communication Structure for Substation and Feeder Equipment—Compatible Logical Node Classes and Data Classes. International Electrotechnical Commission: Geneva, Switzerland, 2010.
- IEC 61850-8-1; “Communication Networks and Systems in Substations”—Part 8-1: Specific Communication Service Mapping (SCSM)—Mappings to MMS (ISO 9506-1 and ISO 9506-2) and to ISO/IEC 8802-3. International Electrotechnical Commission: Geneva, Switzerland, 2004.
- IEC 61850-9-1; “Communication Networks and Systems in Substations”—Part 9-1: Specific Communication Service Mapping (SCSM)—Sampled Values over Serial Unidirectional Multidrop Point to Point Link. International Electrotechnical Commission: Geneva, Switzerland, 2003.
- IEC 61850-9-2; “Communication Networks and Systems in Substations”—Part 9-2: Specific Communication Service Mapping (SCSM)—Sampled Values over ISO/IEC 8802. International Electrotechnical Commission: Geneva, Switzerland, 2011.
- Secretaria Nacional de Planificación. Plan de Desarrollo Para El Nuevo Ecuador; Secretaria Nacional de Planificación: Quito, Ecuador, 2024; ISBN 978-9942-22-592-4. [Google Scholar]
- d’Amato, M.; Cucuzza, G. Cyclical Capitalization: Basic Models. Aestimum 2022, 80, 45–54. [Google Scholar] [CrossRef]
- Adela, D.; Victor-Bogdan, O.; Anuta, B. Trends in Real Estate Appraisal: An Emerging Context. Afr. J. Bus. Manag. 2015, 9, 478–489. [Google Scholar] [CrossRef]


| Total Energy GJ | Energy per Total Building Area MJ/m2 | Energy per Conditioned Building Area MJ/m2 | |
|---|---|---|---|
| Total Site Energy | 24,692.88 | 1100.58 | 1100.58 |
| Net Site Energy | 24,363.87 | 1085.92 | 1085.92 |
| Total Source Energy | 68,615.78 | 3058.27 | 3058.27 |
| Net Source Energy | 67,573.84 | 3011.83 | 3011.83 |
| Total Energy GJ | Energy per Total Building Area MJ/m2 | Energy per Conditioned Building Area MJ/m2 | |
|---|---|---|---|
| Total Site Energy | 3592.27 | 458.40 | 508.83 |
| Net Site Energy | 3515.03 | 448.55 | 497.89 |
| Total Source Energy | 9351.18 | 1193.29 | 1324.55 |
| Net Source Energy | 9106.57 | 1162.07 | 1289.90 |
| Total Energy GJ | Energy per Total Building Area MJ/m2 | Energy per Conditioned Building Area MJ/m2 | |
|---|---|---|---|
| Total Site Energy | 3739.82 | 544.29 | 544.29 |
| Net Site Energy | 3567.00 | 519.14 | 519.14 |
| Total Source Energy | 10,756.10 | 1565.43 | 1565.43 |
| Net Source Energy | 10,208.78 | 1485.78 | 1485.78 |
| Zone | Number of Houses | Demand for Home (kW) | Total Demand (MWh/Month) | Total Demand for Home (MW) |
|---|---|---|---|---|
| 1 | 8720 | 1.64 | 10,271.80 | 14.388 |
| 2 | 8820 | 1.64 | 10,362.97 | 14.520 |
| 3 | 9120 | 1.64 | 10,742.08 | 15.048 |
| 4 | 10,040 | 1.64 | 11,818.28 | 16.536 |
| 5 | 10,600 | 1.64 | 12,481.67 | 17.490 |
| 6 | 11,000 | 1.64 | 12,953.70 | 18.150 |
| 7 | 9160 | 1.64 | 10,798.16 | 15.114 |
| 8 | 7200 | 1.64 | 8476.79 | 11.880 |
| Feeder | Active Power MW | Power Factor Ind. | Voltage p.u. | Scaling Factor |
|---|---|---|---|---|
| 1 | 45.19 | 0.9382855 | 1 | 1 |
| 2 | 30.288 | 0.9416115 | 1 | 1 |
| 3 | 32.974 | 0.9530739 | 1 | 1 |
| 4 | 31.314 | 0.9626101 | 1 | 1 |
Disclaimer/Publisher’s Note: The statements, opinions and data contained in all publications are solely those of the individual author(s) and contributor(s) and not of MDPI and/or the editor(s). MDPI and/or the editor(s) disclaim responsibility for any injury to people or property resulting from any ideas, methods, instructions or products referred to in the content. |
© 2025 by the authors. Licensee MDPI, Basel, Switzerland. This article is an open access article distributed under the terms and conditions of the Creative Commons Attribution (CC BY) license (https://creativecommons.org/licenses/by/4.0/).
Share and Cite
Urquizo, J.; Rivera-Torres, H. Urban Resilience and Energy Demand in Tropical Climates: A Functional Zoning Approach for Emerging Cities. Urban Sci. 2025, 9, 203. https://doi.org/10.3390/urbansci9060203
Urquizo J, Rivera-Torres H. Urban Resilience and Energy Demand in Tropical Climates: A Functional Zoning Approach for Emerging Cities. Urban Science. 2025; 9(6):203. https://doi.org/10.3390/urbansci9060203
Chicago/Turabian StyleUrquizo, Javier, and Hugo Rivera-Torres. 2025. "Urban Resilience and Energy Demand in Tropical Climates: A Functional Zoning Approach for Emerging Cities" Urban Science 9, no. 6: 203. https://doi.org/10.3390/urbansci9060203
APA StyleUrquizo, J., & Rivera-Torres, H. (2025). Urban Resilience and Energy Demand in Tropical Climates: A Functional Zoning Approach for Emerging Cities. Urban Science, 9(6), 203. https://doi.org/10.3390/urbansci9060203