Article

Tackling Carbon Footprints: Sustainability Challenges of Hosting the Final Four in Kaunas, Lithuania

by
Dalia Perkumienė
1,*,
Ahmet Atalay
2 and
Gintautas Labanauskas
3
1
Department of Forestry, Faculty of Forestry and Landscape Architecture, Kaunas Forestry and Environmental Engineering University of Applied Sciences, 53101 Kaunas, Lithuania
2
Department of Sport Management, Faculty of Sports Science, Ardahan University, Ardahan 75000, Türkiye
3
Department of Business and Rural Development Management, Faculty of Bioeconomy Development, Agriculture Academy, Vytautas Magnus University, 53361 Kaunas, Lithuania
*
Author to whom correspondence should be addressed.
Urban Sci. 2024, 8(2), 55; https://doi.org/10.3390/urbansci8020055
Submission received: 5 April 2024 / Revised: 12 May 2024 / Accepted: 20 May 2024 / Published: 24 May 2024

Abstract

:
The purpose of this study is to calculate the carbon footprint of the 2023 EuroLeague Men’s Final Four competition and identify the sources of the carbon footprint in sports. This study also aims to predict possible solutions to reduce this footprint. Mixed research methods were used in this study. Firstly, carbon footprint calculations related to the teams and fan travel were carried out. In the second step, interviews were conducted with the managers of the teams that won the basketball Final Four. The interviews were conducted using a semi-structured interview. The total carbon footprint of the four teams participating in the competitions was calculated as 4560.25 kg, and the average of the total carbon footprint of the teams per person was calculated as 189.74 kg. The total carbon footprint of the fans of the four teams was calculated as 4065.686 kg, and the average of the total carbon footprint per capita of the fans was calculated as 3.003 kg. According to the interview findings, the carbon footprint sources in sports were identified as traveling, energy consumption, and waste generation. Turning to renewable energy sources, waste management and sustainable transport alternatives were identified as effective solutions for reducing the carbon footprint. Analysis of the research results showed that the interest and participation in the Final Four and other international organizations are increasing. Due to increasing carbon footprint, these events and competitions should be planned and conducted in accordance with the goals of environmental sustainability. For this purpose, managers and policy makers should turn to clean energy sources, including waste management and recycling strategies, the preparation of sustainable transportation projects, and integrating all these processes into organization activities.

1. Introduction

Human civilization is in danger due to the recent rapid processes of globalization. Problems such as the uncontrolled consumption of natural resources, food insufficiency and its related hunger, and, most importantly, climate change and environmental degradation threaten civilization [1]. Considering the effects and consequences of various factors on the environment, the greatest threat, risk, or challenge facing the entire human civilization is global warming and climate change [2].
The climate change crisis affects and changes the natural environment and, accordingly, the living conditions of people. Therefore, it also directs the transformation of societies [3]. The process of climate change, which is a significant issue, causes serious damage to natural ecosystems and human life. International cooperation and decisive actions are required to effectively address these problems [2]. In this context, it has been inevitable that major threats such as climate change and environmental issues, as well as the increasing carbon footprint, have come to the agenda in recent years, and scientific studies have become increasingly widespread to overcome these problems. In particular, the carbon footprint is considered an important indicator for determining the degree of contribution to climate change, as well as to its measurement. Therefore, it has frequently come to the agenda in recent years and has been the subject of discussions. Supporting carbon footprint analysis and measurements with expert opinions along with enriching them—not only with quantitative data, but also with qualitative data, including participants’ experiences and perspectives—can contribute to understanding this issue. Additionally, comprehensive and detailed results can lead to informed interpretations. Lastly, by integrating carbon footprint data with human factors, it may be possible to better understand the human behaviors and motivations behind environmental impacts.
The carbon footprint problem is an important part of climate change. This issue is considered a significant environmental impact process itself, directly contributing to environmental impact and climate change. Therefore, it forms the basis for understanding, evaluating, and finding solutions for the problem of climate change [4]. This is because the behaviors exhibited by individuals have an impact on the environment and shape climate change. Such a situation may bring financial, social, and, especially, ecological problems [5]. The mentioned problems can directly affect almost half of the world’s population [6]. The carbon footprint is considered an important factor that influences the environmental degradation in the climate change process [7]. Carbon footprint is a concept that is widely used as an indicator in defining environmental problems and the climate change crisis [8].
Carbon footprint is a concept used to express the sum of the carbon dioxide emissions resulting from any possible activity [9]. According to a comprehensive approach, it also can be defined as the negative impact of the activities of individuals or societies in the natural environment. Therefore, it can be considered a frequently discussed tool that has contributed to understanding the problem of climate change and creating the solution to this problem [10].

The Indicators of the Sports Sector Carbon Footprint Problem

Carbon footprint, which is an indicator of climate change and environmental problems and is defined as a threat to human life and the planet [1], is also associated with the sports sector in theory and practice [11]. The sports sector is characterized by extraordinary intensity in terms of the mass participation of athletes and their mobility. Therefore, the negative relationship between the sports sector and the natural environment (carbon footprint) needs to be discussed [12]. In all sport branches, the carbon footprint of sports has gradually grown, and negative environmental impacts have increased. Therefore, sport has become one of the sectors where appropriate measures should be taken to reduce the negative consequences of climate change [13]. Such a situation is confirmed by the fact that teams and fans of all sports branches travel to sports competitions almost every week. The fact that these competitions take place throughout the year results in carbon and greenhouse gas emissions inevitably increasing, especially in the transport sector. As a proof of this situation, a study by Del Bello revealed that the biggest carbon footprint source of the American National Basketball League was transportation, which is due to the fact that the team and fans make long journeys every week [14]. Chard and Mallen drew attention to the environmental impacts caused by transport vehicles, and they stated that most of the energy needs of all transport vehicles are still met from fossil fuel sources [11]. Fossil fuel sources are known as the most significant carbon and greenhouse gas sources [15].
However, the carbon footprint problem in the sports sector is related not only to transport, but also, at the same time, to the energy consumed in sports facilities, waste generation, and the construction of facilities; in addition, the processes related to their operation are also considered carbon footprint sources [14,16,17,18]. The carbon footprint sources of the sports sector are summarized and presented to the readers in Figure 1:
Within the scope of the climate action plans prepared to combat climate change and environmental problems, policy makers are taking steps to minimize the environmental problems and carbon footprint of sporting events, and they are also trying to develop plans and policies [19]. For example, the United Nations has a key role to play in the fight against climate change. It has implemented a Climate Change Action Plan. It has included the sports sector in this plan, and it has set the following targets that are specific to these sports sectors, holding all sports stakeholders accountable:
Preparation of a clear trajectory in all types of sports;
The establishment of undertakings and partnerships are to be conducted according to approved standards;
Measurement and reduction in the greenhouse and carbon gases caused, and the organization of reports on this matter;
Ensuring the unity and solidarity among stakeholders in the sports sector for combating environmental problems;
Using sport as a tool for a climate action plans [20].
There is a public consensus on the problem of climate change, and international public opinion is also working together to tackle the problem [21]. The inclusion of the sports sector in the United Nations’ climate action plan can be considered an indicator of this understanding. However, despite this awareness and unity, these problems, which are addressed with common sense, are still discussed in public, media, and scientific studies [22,23,24].
The negative environmental impacts caused by all branches of the sports sector, particularly when using the carbon footprint as an indicator and measurement tool, have reached alarming levels. Sport has recently been at the center of the scientific and political debate on environmental issues. The catalyst for climate change and its related problems in this area is the carbon footprint. Researchers have focused on these problems with field studies, while managers have tried to take responsibility by applying concrete modern solutions. Managers in the sports sector face great challenges in addressing their carbon footprint in terms of the sustainability of limited natural resources and the opportunities offered by the environment [25], especially with the increasing interest in international sports organizations, such as the Olympics, world championships, and European championships, intense human mobility is observed. This situation accelerates many negative environmental impacts, especially carbon and greenhouse gas emissions [26,27].
Basketball events are typically large-scale gatherings with a broad audience. However, such events can also have various environmental impacts. In particular, large-scale events can create significant environmental effects in areas such as energy consumption, water usage, waste production, and transportation [28]. For example, the intense transportation on game days and the energy needs of facilities can contribute to carbon dioxide emissions and the depletion of natural resources. Therefore, efforts to reduce the environmental impacts of basketball events are becoming increasingly important. Measures such as the use of renewable energy sources, the development of waste management strategies, the promotion of sustainable transportation alternatives, and the implementation of environmental education programs can be effective in reducing the environmental impacts of these events. These efforts can contribute to the improvement of both the sports industry and environmental sustainability in general [29,30].
Therefore, the basketball branch is quite popular in the sports industry. In particular, international events like the Final Four appeal to wide audiences. In this context, it is important to highlight the carbon footprint measurements and environmental impacts of this organization. Additionally, the views and opinions of club managers participating in the Final Four matches held in Kaunas can be decisive in revealing the relationship between sports and the environment. As the Final Four matches are among the most important events in the basketball branch, club managers’ identification of environmental issues related to sports and determination of their views on solving these issues can shed light on the current literature and future studies.
The Euroleague Men’s Final Four competitions, which are one of the most important organizations in the sports sector and are held in a different country every year, were considered as an opportunity to address the carbon footprint problem, and they were thus placed at the center of this research. The aim and objective of this study, which is addressed in terms of the relationship between the sports sector and the carbon footprint problem, consists of two steps. Firstly, it is aimed at calculating the carbon footprint of the four teams and their fans traveling in the Euroleague Final Four competitions in 2023. Then, by interviewing the managers of the teams participating in the competitions, it was aimed at determining the sources of the carbon footprint in sports and solution suggestions for minimizing this footprint.

2. Materials and Methods

2.1. Research Process

The methodological setup of a scientific research process is extremely important for a study to yield accurate results. In this study, an operation schedule was created, and the whole process was carried out with scientific clarity. The process and methodological structure are presented in Figure 2 below:
In this study, a mixture of research methods, i.e., those that are frequently used in interdisciplinary research, was utilized, and the research process was handled in two steps. In the first step, carbon footprint calculations related to the travels made by the teams and fans participating in the Euroleague Men’s Basketball Final Four competitions organized in Kaunas, Lithuania, in 2023 were made. In the second step, interviews were conducted with the managers of the teams (Barcelona, Real Madrid, Olympiakos, and Monaco) that had qualified to participate in the Basketball Final Four. To attain in-depth knowledge and benefit from purposive sampling, the method of expert sampling was utilized to form an interview group that consisted of solely four team managers. Thus, the aim was to engage with individuals relevant to the study’s purpose to obtain accurate and comprehensive information. Additionally, the responsibility of club managers in sustainability policies was crucial to account for in line with the research objectives. Interviews were conducted through a semi-structured interview form to determine the views of the managers on the problems and solution proposals regarding the environment and carbon footprint of the sports sector. The interview group was limited to four club managers.

2.2. Carbon Footprint Calculation Process

2.2.1. Data Set

In this study, the travel distances traveled by the teams and fans participating in the Euroleague Men’s Basketball Final Four held in Kaunas, Lithuania, on 19–21 May 2023 were used as a data set. The teams that qualified for the Final Four were Barcelona, Real Madrid, Olympiakos, and Monaco. Obtaining the traveling distances consisted of two stages. Firstly, information about the type of vehicle preferred for traveling, as well as the starting and destination points, was obtained from the team managers and fans. Then, the departure and arrival points determined via “Google Maps” and the average total distances traveled were calculated according to the vehicle type. The information on the traveling and vehicle type of the clubs was obtained directly from the club managers. A short questionnaire was used to obtain information about the traveling of the fans in terms of data security. The questions in this form were as follows (Box 1):
Box 1. Question form for fans.
For passenger car:
For bus:
For Train:
For airplane:
Journey 1: Starting point………… Destination……..inc. return journey?....yes/no?
For the related organization, both the team and the fans preferred to travel only by plane and bus. The unit of measurement used for traveling by plane was miles. Since the unit of measurement used in the carbon footprint calculation process was kilometers, the distances for traveling by plane were converted into kilometers. The conversion of units of measurement was conducted through Generative AI (ChatGPT) and the website called Convert Miles. The distances traveled by teams and fans by vehicle type and the number of people traveling are presented in Table 1 and Table 2 below:
A total of 96 people from the four teams traveled to participate in the Final Four. The total distance traveled by the plane by these teams was 23,232 km. The total distance traveled by bus was 942 km.
The total number of fans traveling to Lithuania for the competitions was 8802. The total distance traveled by plane was 20,693 km. The total distance traveled by bus was 883 km. For the data collection difficulties, reliability, and accurate calculation process, fans traveling to the host country to watch the competitions were not included in the calculation. Detailed calculations for each team and their supporters, separately and according to the preferred vehicle type, are presented in full detail in both tables above.

2.2.2. Calculating Carbon Footprint Process

Carbon footprint calculations were made based on the journeys made to attend the Final Four competitions. Since the carbon emission value of each vehicle type is different, the emission factors of aircraft and buses were used in the calculation process. Carbon emission values according to the vehicle types considered in the calculation are updated and published every year by the United Kingdom’s Department for Business, Energy & Industrial Strategy. These factors, which are present within the borders of the European Union, were utilized in the calculation process. The emission factors of the vehicle types (aircraft and bus) included in the research are presented in Figure 3 below [31].
For the 2023 Final Four competitions, the formula developed by Wicker and adapted for the data of this study was used for carbon footprint calculations based on the traveling of the teams and fans [30]. In the analysis process, while calculations were made separately by vehicle type, the carbon footprint calculations per person were also obtained by dividing the total number of people for teams and fans. The formula used in the calculation process is presented below.
C F = a   T r a v e l   D i s t a n c e   b y   P l a n e b E m i s s i o n a                                                 + b T r a v e l   D i s t a n c e   b y   b u s b E m i s s i o n b                           /   N u m b e r   o f   T o t a l   P e r s o n
The formula for calculating the average carbon footprint of teams and fans traveling to the Final Four was adapted for the data set of this research:
  • a is the distance traveled by plane;
  • b is the distance traveled by bus.

2.3. Interview Process

The qualitative dimension of the research consisted of interviews with club managers. Qualitative research focuses on words rather than numerical data and results [32]. At the same time, it aims to reveal the current situation and facts as they are [33]. In qualitative research, it is common to keep the interview groups small to obtain in-depth knowledge on the issues requiring expertise [34]. This research was limited to the Euro League Men’s Final Four basketball matches held in Kaunas, Lithuania, in 2023. The teams that finished the regular season in the top four positions participated in these matches. Therefore, it was conducted as a four-team organization. This research seeks answers to the carbon footprint calculations of this organization. In this context, only the managers of these four teams were included in the scope of this study since only four teams participated. As there were no additional teams or stakeholders, the interview group was also limited to four individuals.

2.3.1. Sample Group

The interview group, which was formed by purposive sampling method, consisted of the managers of the four teams participating in the Final Four competitions. In addition, the teams, names, or any other information that could be used to identify them was not shared. For this purpose, the managers in the interview group were coded as CM1, CM2, CM3, and CM4 (where CM stands for club manager).
To conduct accurate and healthy interviews in scientific studies based on interviews, a justified method is needed in determining the interview group [35]. In this context, the purposeful sampling method was used to determine the participant group of this study. With this method, the aim was to conduct detailed research and provide in-depth information. In addition, the fact that the participant group had certain equipment and qualifications was accepted as a basic indicator [36,37]. Purposive sampling involves the intentional selection of individuals who have specific characteristics or experiences deemed important for a study. In this context, to create a particularly narrow interview group within purposive sampling, the expert sampling method was employed according to the study’s objectives. It was planned to include individuals considered experts in their field, or possessing expertise relevant to the research topic, in the study group [38,39].

2.3.2. Data Collection Tool

Interviews were conducted through a semi-structured interview form to determine the views of managers on the problems and solution suggestions regarding the environment and carbon footprint of the sports sector. A semi-structured interview form was prepared by the researchers for the interviews. The preparation of this form was based on a comprehensive literature analysis. In addition, the final version of the form was checked with field and language experts and made ready for application. Interview methods and forms are advantageous due to the fact that they can deliver in-depth information, guide participants, and present a chance to intervene in points that are not understood [40]. The preparation of the interview form involved investigating whether participants had knowledge about the concept of carbon footprint in line with the research objective. Then, the aim was to determine the participants’ views on the causes and solutions of the carbon footprint issues stemming from the sports sector. Finally, within the scope of this research, the goal was to identify the participants’ views and suggestions for reducing the carbon footprint related to travel and transportation. The questions in the interview form used in the research were as follows:
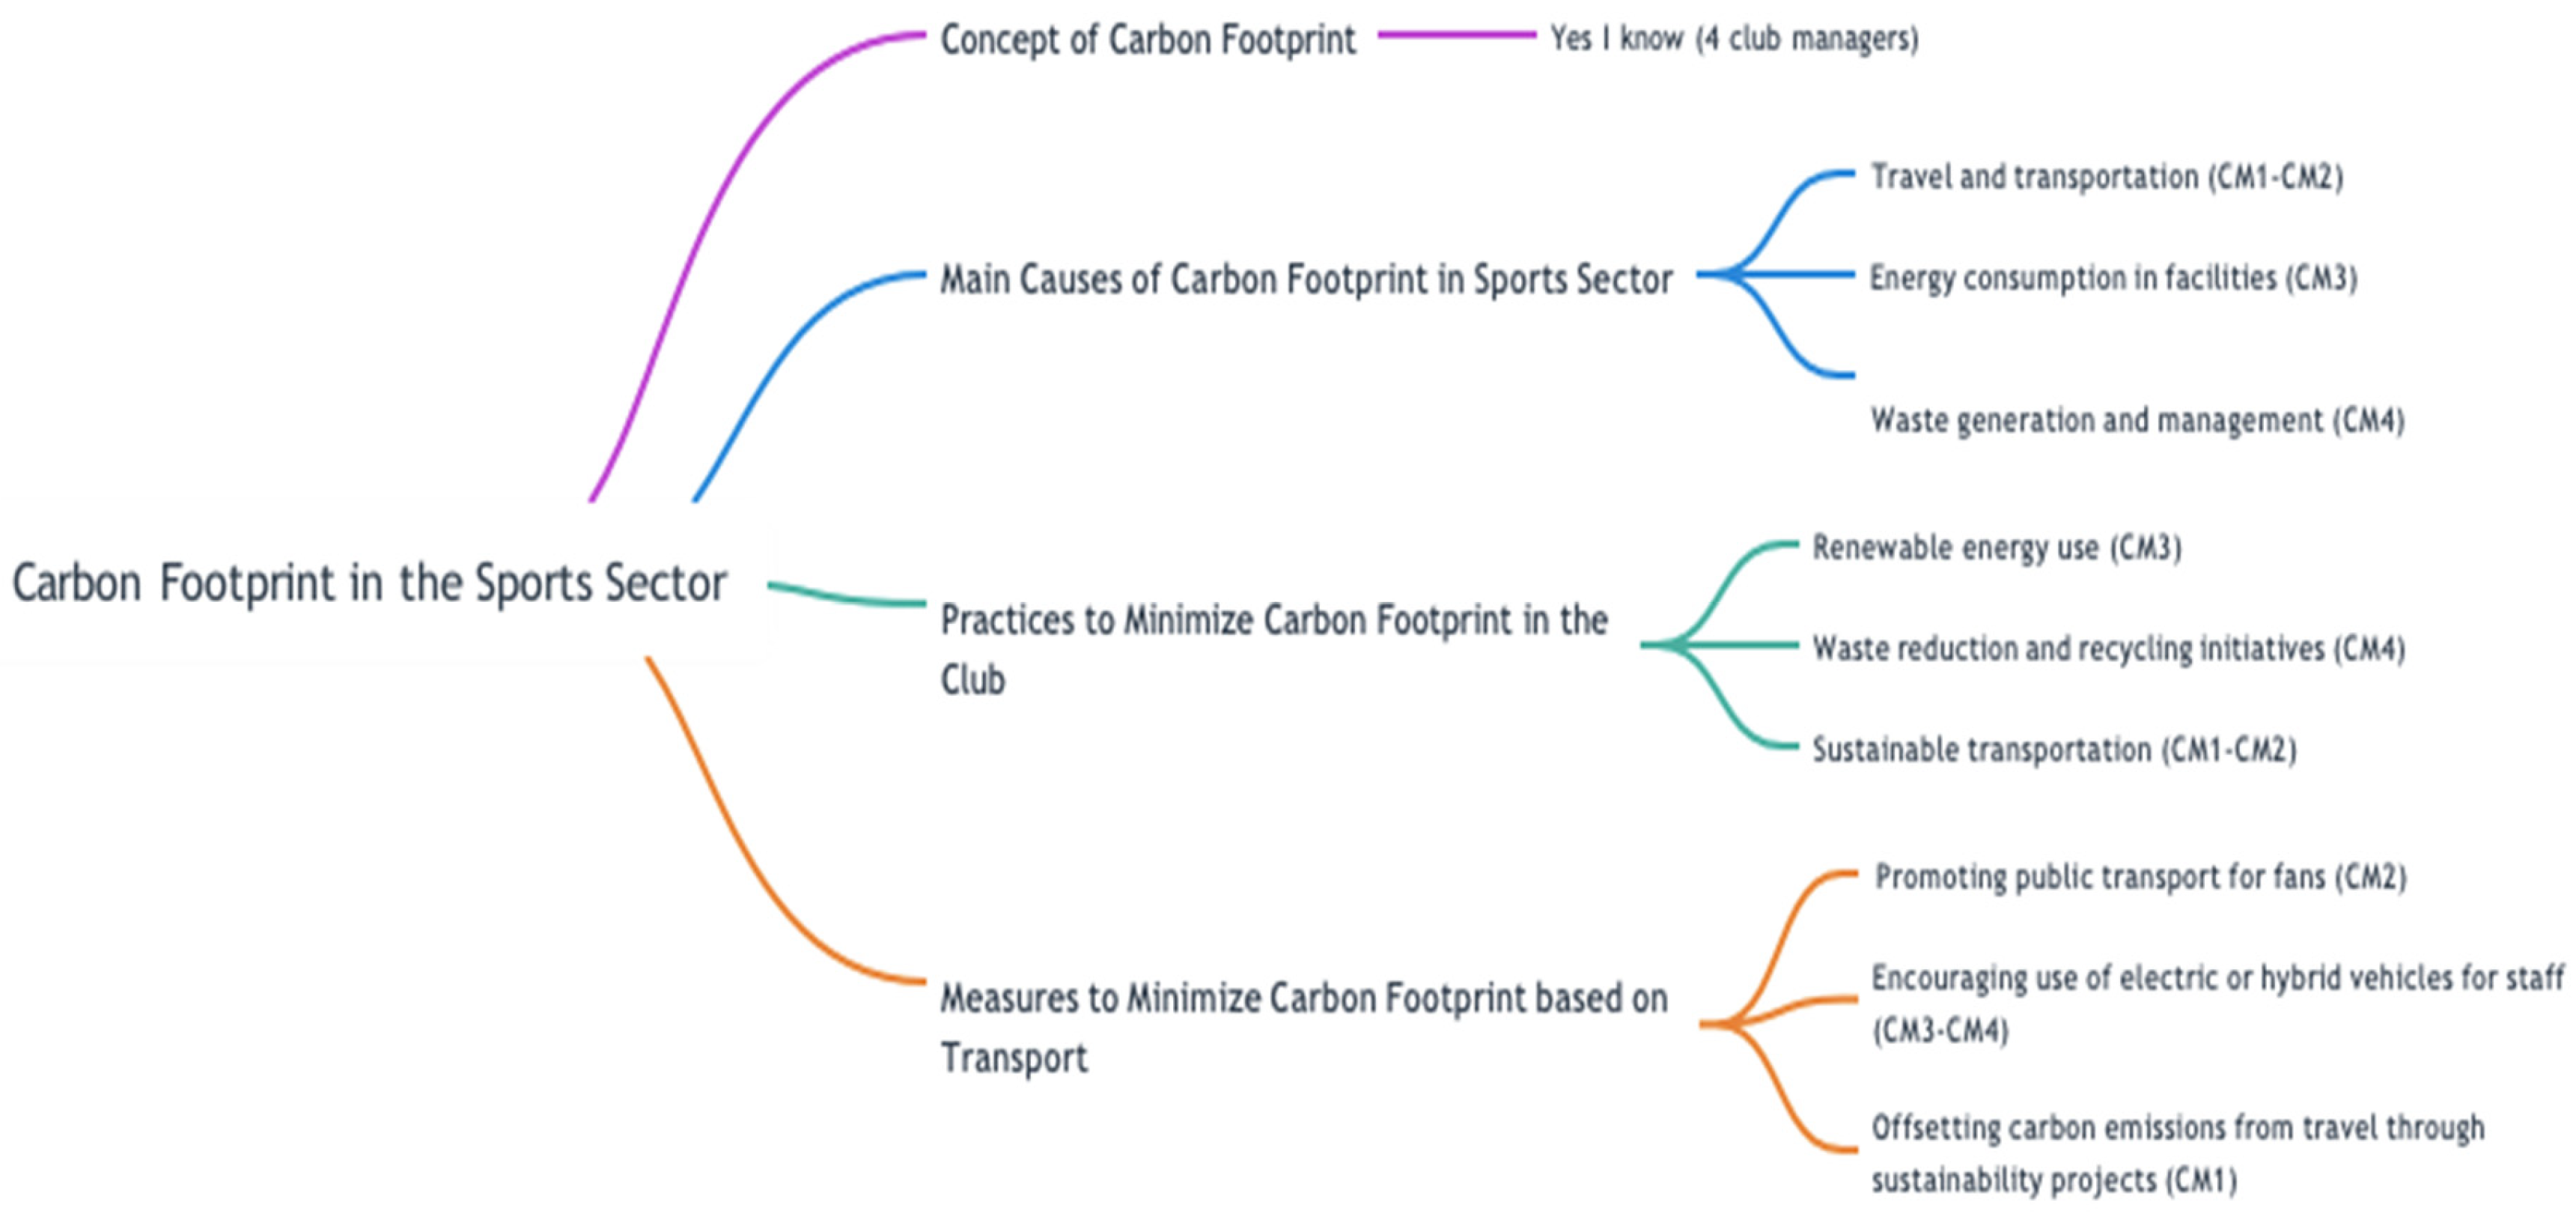
  • Do you know or have any idea about “concept of carbon footprint?
  • What are the main causes of carbon footprint problem in the sports sector?
  • What kind of practices are there in your club to minimize the carbon footprint?
  • What measures can be taken to minimize the carbon footprint based on travel and transportation in the sports sector?

2.3.3. Interview Data Analysis

The data obtained from the interviews with club managers were processed and analyzed using Nvivo 14 software. In addition, the Whimsical AI program 2024 was also used to visualize some of the findings. The data were transformed into findings through descriptive analysis and content analysis. Since it is not the numerical expressions that should be emphasized in interview analyses and content evaluations, but rather the expressions of the participants, the statements of the managers in the interview group were directly quoted [41].

3. Results

The findings and reporting process of this study consisted of two parts. Firstly, carbon footprint (CF) calculations were made based on the travels undertaken by the teams and fans participating in the Euroleague Men’s Basketball Final Four competitions organized in Kaunas, Lithuania, in 2023. In the second step, the interview data obtained from the managers of the teams (Barcelona, Real Madrid, Olympiakos, and Monaco) who were entitled to participate in the Basketball Final Four competitions were transcribed and finalized. The results of the analysis of the data obtained are visualized in tables.

3.1. Findings on Carbon Footprint Calculations

In this section, the carbon footprint (CF) results of the traveling made by the teams and fans participating in the Euroleague Men’s Basketball Final Four are presented. While the calculations were made separately for each of the teams according to the vehicle types, they were also presented as the total average footprint and average per capita footprint of the four teams. Firstly, the travel-related carbon footprint calculations of the four clubs were made, and the results are presented in Table 3 below.
When the calculation results were closely analyzed, the total carbon footprint of the four teams due to the Final Four competitions was calculated as 4560.325 kg. In addition, according to the total number of people in the teams’ caravans, the total carbon footprint per person was calculated as 189.74 kg. The carbon footprint measurements made separately for each team and vehicle type are presented in the table above with all details.
After the carbon footprint calculations of the teams, travel-related carbon footprint calculations of the team fans traveling to Kaunas city from different countries were made, and the results are presented in Table 4 below.
According to the carbon footprint measurements related to the traveling of the fans, the total carbon footprint of the fans of the four teams was calculated as 4065.686 kg. In addition, the average per person footprint measurements was seen as 3.003 kg in total. In addition, carbon footprint measurements were made separately for vehicle type, and the information obtained from each team’s fans are presented in the table above with all the details.

3.2. Findings on the Problems and Solutions for the Carbon Footprint

In this section, the opinions of the club managers participating in the Final Four competitions regarding the problems and solution suggestions regarding the carbon footprint, which has recently been associated with the sports sector, are transcribed, and they are presented in the diagram below. To make sense of the results, the participant opinions are directly quoted and presented to the readers. Firstly, the findings obtained from the interviews with the club managers are presented in Figure 4 below, which was prepared by the authors.
Interviews were conducted with the managers of the teams participating in the Final Four competitions. Based on these interviews, the carbon footprint sources in the sports sector and solution suggestions for minimizing this footprint were determined. The team managers stated that the transportation preferences and traveling, high energy consumption, and intensive waste production are the main sources of the carbon footprint in sports.
Based on the interviews with the team managers about which steps should be taken to solve the carbon footprint problem, solution suggestions were determined and conveyed to the reader. The team managers suggested the following as solutions: orientation toward renewable energy sources in sports; the creation of waste management strategies; and the dissemination of sustainable transport alternatives. In addition, to minimize the carbon footprint caused by transport, it was stated that public transport should be encouraged, especially for fans; electric or hybrid vehicles should be preferred more; and sustainable transport projects should be supported by the clubs.
Firstly, the question “Do you know or any idea about the ‘concept of carbon footprint’?” was asked to the team managers participating in the Final Four competitions. All the club managers (four) stated that they have knowledge about the concept of carbon footprint and that they closely follow environmental issues, especially those concerning the carbon footprint. The opinions of the club managers on the subject are as follows:
It is a problem that has been constantly on the agenda with climate change in recent years. In addition, the relationship between the sports sector and environmental problems is increasing day by day. Therefore, I am aware of what a “carbon footprint” is and what consequences it may have (CM2). I know it as carbon dioxide emissions caused by transport and energy consumption. As we all know, our teams travel every week, which has an impact on carbon dioxide emissions (CM4). The carbon footprint is known as the harmful gases caused by electricity and natural gas, for example, in the hall where we will play the matches here. Exhaust gases from transport vehicles also have a significant impact (CM1).
Secondly, the team managers were asked the question “What are the main causes of carbon footprint problem in the sports sector”? Two of the club managers (CM1-CM2) stated that they are traveling and transportation, one (CM3) stated that it is energy consumption in the halls, and one (CM4) stated that waste generation and management processes are the most important carbon footprint sources. The opinions of the club managers on the subject are as follows:
Absolutely! Travel and transport. Teams travel every week. During the whole season we have traveled long and short distances. We must use the airplane. But it makes no difference. We know that all means of transport produce environmental consequences (CM2). Not only the final competitions, but there are also competitions and trainings all season long. And it is known that basketball halls are active all year round. There is a constant consumption of energy, electricity, and natural gas. It is as if there is no limit. Of course, this situation contributes greatly to carbon emissions. When you consider not only our team but the whole league, I am talking about an incredible consumption and carbon dioxide emission (CM3). Human beings. You can see traces of it everywhere. Everyone, including me. Especially on match days, there is an incredible accumulation of waste. This place is very important. In my opinion, waste is one of the most important factors in the pollution of nature and the environment. Of course, traveling is very frequent, but even in our daily lives we constantly consume things and their packaging causes great damage to nature (CM4).
Thirdly, the team managers were asked the question “What kind of practices are there in your club to minimize the carbon footprint?” Two of the club managers (CM1–CM2) stated that they encourage sustainable travel and transportation in their clubs; one of them (CM3) stated that they tend toward renewable energy sources (obtaining energy with solar energy); and one of them (CM4) stated that they participate in campaigns related to waste reduction and recycling. The opinions of the club managers on the subject are as follows:
As I mentioned above, we travel a lot. At the same time, our fans are traveling to support us both inside and outside the city. This means that the exhaust gases emitted from the vehicles increase and threaten the environment. For this reason, we are working on alternatives such as the provision of electric vehicles within the club. We also call on our supporters from time to time to use public transport rather than individual cars (CM2). Renewable and clean energy. It is actually very simple but very difficult. It is costly. We have studies and initiatives for clean energy systems such as solar energy in our hall. And we aim to get results in a short time. In this way, we can contribute to minimizing the carbon footprint (CM3). Recycling campaigns are frequently on the agenda in our country. As a club, we are trying to support the process by participating in these campaigns to raise awareness. We signed a protocol and accelerated the efforts to recycle the wastes generated especially on competition days (CM4).
Finally, in accordance with the scope of this research, the team managers were asked the question “What measures can be taken to minimize the carbon footprint based on travel and transportation in the sports sector?” Two of the club managers (CM3–CM4) stated that the use of electric and hybrid vehicles should be widespread for the personnel in the clubs; one of them (CM2) stated that public transport should be encouraged for the fans; and the other one (CM1) stated that sustainability studies and projects should be emphasized to balance the carbon emissions from transportation. The opinions of the club managers on the subject are as follows:
With today’s technology, electric vehicles are becoming widespread. We should try to increase the number and use of these vehicles in all clubs, especially in our club. Our club is very willing to supply electric and hybrid vehicles in terms of clean energy and fuel saving (CM4). Our supporters. They try to support us regardless of city or country. We often call on our fans to use public transport when traveling to the matches. Especially in home matches, we show the necessary sensitivity for our fans to use public transport on their way to the hall (CM2). We hope to increase the number of social and scientific projects and campaigns to raise awareness. We believe that the consciousness and awareness on this issue will increase with the increase in studies just like the ones you are doing now. As a club, we expect it to increase by supporting such campaigns and studies (CM1).

4. Discussion

The research focuses on the environmental impacts of the Euroleague men’s Final Four competitions held in Kaunas, Lithuania, in May 2023. In this context, firstly, the carbon footprints of the teams and fans traveling to the Final Four competitions were calculated. Then, interviews were conducted with the managers of the four (4) teams participating in the competitions, and the sources of carbon footprint in the sports sector and solution suggestions for minimizing this footprint were determined.

4.1. Discussion of the Carbon Footprint Measures for Teams and Fans

Firstly, the four teams participated in the Final Four competitions. The total carbon footprint of these teams, which was calculated via the distances traveled by their air and land vehicles, was 4560.325 kg. However, the average per capita carbon footprint of the teams was 189.74 kg. The total carbon footprint was calculated by also accounting for the traveling that was undertaken by the fans of the related teams by air and road vehicles for the competitions. The total carbon footprint was 4065.686 kg. The average per capita carbon footprint of the fans was 3.003 kg.
Despite digitization and technological advancement, fossil fuel resources still have a significant share in meeting energy demand. The main cause of climate change, environmental issues, and carbon gas emissions is these fossil fuel resources [42]. The research on climate change and environmental issues emphasizes that transport choices and travel are the primary source of carbon and greenhouse gases [43,44,45,46]. Carbon and greenhouse gas emissions caused by transport preferences and traveling constitute 20% of total emissions. For example, the total rate of emissions caused by road transport is 70%. The emission rate caused by airline vehicles is 12% [47]. The growing carbon footprint problem due to these two most preferred means of transport is a major concern in terms of environmental problems [48].
Individuals and groups in society need to show sensitivity to frequently discussed issues such as the controlled consumption of natural resources, environmental problems, and climate change. Especially in the sports sector, where mass participation is involved, there is a tendency to focus on the negative relationship with the environment; as such, there is a need to consider the recent adverse environmental effects of sports [49]. Particularly, the waste production and other environmental issues associated with participation in competitions and other sports events are becoming increasingly widespread [50,51].
Sports events and activities are determinants in the emergence of carbon footprint due to mass participation. In particular, the carbon footprint that arises from the transportation preferences and travel distances of teams and fans during these events is one of the primary causes of environmental issues and climate change [52,53]. Furthermore, teams and fans travel to sporting activities held in different countries and cities every year. These travels heavily contribute to the carbon footprint [54].
Research on the relationship between the sports sector and carbon footprint often focuses on transport preferences and traveling as participation in Final Four and other international sports organizations is inevitable and will be continuous. Naturally, research has been carried out in many different branches of the sports sector to date, thus addressing the carbon footprint problem. In the research on the travel-related carbon footprint of German football fans, the carbon footprint resulting from traveling during a season was calculated as 311.1 kg [55]. In a study on football conducted in England, the carbon footprint of Premier League teams due to travel for a season was calculated as 1134 tons on average [13]. Another striking finding should be mentioned for football as the most popular sports branch worldwide. In 2014, an average carbon footprint report was prepared for the World Cup organization held in Brazil. According to this report, the primary sources for the calculated footprint were transport and travel. According to the findings, approximately 40% of the total carbon footprint is caused by traveling [56]. Although not as popular as football, university sports also have a significant carbon footprint; Edwards et al. calculated the total carbon footprint of university teams during an academic year as 3.8 tons due to travel [57].
Significant results on the carbon footprint problem have been found in research on the basketball branch. For example, the average carbon footprint of teams and fans participating in intercollegiate basketball competitions in 2019 was calculated as 201 million kg [58]. In another study focusing on the traveling of basketball fans in the USA, the carbon footprint of fan traveling during the entire season was calculated as 338 million kg [59]. In a study focusing on the travel-related carbon footprint of teams in the national basketball leagues of Turkey and Lithuania, the average carbon footprint of teams in both countries in a season was calculated as 53.02 tons [28].
Within the scope of this study, it can be said that the results of the carbon footprint related to the transportation for the Final Four organization were similar to previous studies. Research shows that travel is the most significant source of the carbon footprint in the sports sector. Indeed, it is known that these travels are inevitable due to the continuation of competitions in all sports throughout the year, with leagues and tournaments ongoing every week. It is certain that teams and fans travel domestically and internationally for matches. Therefore, as competitions continue, the travels of teams and fans will continue to have negative environmental impacts. Additionally, it will continue to contribute to the carbon footprint issue in sports.
In popular sports branches, especially basketball, the traveling of teams and fans is inevitable. People travel short, medium, or long distances for organizations that are held either during the whole season or within a certain date range, such as the Final Four. However, it should not be overlooked that these journeys will have an environmental cost; therefore, the process should evolve into an environmentally friendly understanding, and measures should be taken.

4.2. Discussion Regarding Interviews with Club Managers

Interviews were conducted with the managers of the teams participating in the Final Four competitions. Based on these interviews, the carbon footprint sources in the sports sector and solution suggestions for minimizing this footprint were determined. The team managers stated that transportation preferences and traveling, high energy consumption, and intensive waste production are the main causes of carbon footprint in sports. These statements, which overlap with the findings in the existing literature, emphasize the negative environmental impacts of sports.
In a study conducted by Sorrentini, the negative effects of sports on the environment were examined [60]. According to the results of this study, it was revealed that traveling, accommodation, energy consumption, and waste production are the main causes of carbon footprint. Each carbon footprint source has been extensively researched in the literature. Accordingly, in the study conducted by Thibault on the environmental impacts of an international tournament, it was stated that approximately 70 tons of waste was generated during the organization, of which only 1% was suitable for recycling [18]. In addition, football stadiums, basketball halls, and sports facilities consume a great deal of energy, especially during competition periods. This energy consumption (electricity, natural gas, etc.) is known to cause high amounts of carbon and greenhouse gas emissions [61,62,63,64,65].
Another carbon footprint source subject to the research is transportation preferences and traveling. Due to the structure and nature of sports, teams and fans have to travel all year round. However, as was mentioned above, these types of travel have an intense impact on the environment. Due to this impact, studies conducted in the sports sector reveal that the most important carbon footprint source is traveling [11,66,67,68,69]. The findings on carbon footprint sources in the sports sector overlap with the existing literature. Transport choices and travel, energy consumption, and waste generation can be seen to lead to a negative relationship between sports and the environment. Depending on the continuous participation and increasing interest, this negative relationship may reach alarming dimensions, and the carbon footprint problem may grow.
Based on the interviews with the team managers regarding the negative environmental impacts and the steps to be taken to solve the carbon footprint problem, solution suggestions were determined and conveyed to the reader. The team managers suggested the following as solutions: orientation toward renewable energy sources in sports; the creation of waste management strategies; and the dissemination of sustainable transport alternatives. In addition, to minimize the carbon footprint caused by transport, it was stated that public transport should be encouraged, especially for fans; electric or hybrid vehicles should be preferred more; and sustainable transport projects should be supported by the clubs.
The use of renewable and clean energy sources in sports facilities (stadiums, halls, etc.), hosting sports organizations such as the Final Four, and in the vehicles preferred for transportation to these facilities could help reduce carbon and greenhouse gas emissions while saving energy. It can also be considered as a start for an environmentally friendly sports model [70,71,72,73]. Many measures can be taken to reduce the carbon footprint in sports facilities and organizations. Among these, the use of renewable energy sources is of great importance. Renewable energy sources such as solar panels, wind turbines, or hydroelectric power can provide an effective way to meet the energy needs of facilities [74].
Reducing the wastes generated due to mass participation and their environmental impacts seems to be possible with the dissemination of waste management and recycling policies as the proper storage and sorting of these wastes significantly reduces carbon and greenhouse gas impacts [75,76,77,78]. In addition, the use of materials suitable for recycling and reuse is also very important in terms of minimizing the carbon footprint [79]. Sports facilities and organizations can minimize their environmental impact by managing their waste through strategies such as waste reduction, recycling, and recovery. These efforts promote a more efficient use of resources while allowing waste to be reused without harming the environment [80].
The main subjects in all the processes of organizations such as the Final Four are the managers and policy makers of these organizations. The relationships of these organizations with the environment should be handled carefully, and sports managers and policy makers should assume the necessary responsibility in this regard as the pro-environmental attitudes and behaviors of managers and policy makers in the planning and implementation processes of organizations can be decisive in reducing the carbon footprint [81,82]. Lastly, environmental education and awareness programs can raise awareness among facility staff, athletes, and visitors about environmental issues, and it can promote sustainable behaviors. Such measures can help sports facilities and organizations reduce their carbon footprint and enhance their environmental sustainability [83]. The solution proposals and effective strategies that are commonly highlighted for reducing the environmental impact in the sports industry generally cover similar topics. Observations suggest that research in this area generally includes the following main headings:
Renewable Energy Usage: The use of renewable energy sources to meet the energy needs of sports facilities and events is becoming increasingly common. This includes the use of alternative energy sources such as solar panels, wind turbines, or hydroelectric power [84,85].
Waste Management Strategies: Waste reduction, recycling, and recovery strategies are important steps aimed at reducing waste and environmental impact in sports facilities and events [86,87].
Sustainable Transportation: The use of sustainable transportation alternatives for the transportation of fans and athletes is an effective strategy for reducing the carbon footprint. Measures such as promoting public transportation, using electric vehicles, and creating bike lanes support this strategy [88,89].
Environmental Education and Awareness Programs: Sports organizations and clubs can educate and mobilize fans and communities about environmental issues through environmental education and awareness programs [90].

5. Conclusions

In the research, the transportation-based carbon footprint calculations of the teams and fans participating in the Euroleague men’s Final Four competitions held in Kaunas, Lithuania, in 2023 were made. Then, depending on the interviews with team managers, the carbon footprint sources in sports and suggestions for minimizing this footprint were determined.
The total carbon footprint of the four teams participating in the competitions was calculated as 4560.325 kg, and the average total carbon footprint of the teams per person was calculated as 189.74 kg.
The total carbon footprint of the fans of the four teams was calculated as 4065.686 kg, and the average total carbon footprint per capita of the fans was calculated as 3.003 kg.
  • The main carbon footprint sources in the sports sector, according to the findings of the interviews conducted with the managers, were determined as the following:
    Transport preferences and traveling;
    High energy consumption;
    Intensive waste generation.
  • The findings, as obtained from the interviews with the managers, regarding the solution suggestions for minimizing the carbon footprint in the sports sector were as follows:
    To turn to renewable and clean energy sources;
    Promote waste management strategies and recycling practices;
    Disseminate sustainable transport alternatives that have been identified as effective solutions for reducing the carbon footprint.
After analyzing the results of the interviews with the sports club managers, the following proposals can be made as a solution to reduce the carbon footprint of transport in sports:
  • ✓ Encouraging public transport, especially for fans;
  • ✓ Promoting the use of electric or hybrid vehicles;
  • ✓ It can be concluded that the support of clubs to plans, policies, and projects related to sustainable transport can reduce the carbon footprint caused by transport.
This research was limited to the four teams participating in the basketball Final Four matches. The results obtained were discussed within the scope of this limitation. This study provides opportunities for future research to offer insights, and it can be used to compare its findings with those of other sports disciplines. However, comparative studies with broader participant groups are also possible. Conducting comprehensive research, especially in many other disciplines such as football, can contribute to a wider range of information in the literature.

Author Contributions

Conceptualization, A.A.; methodology, A.A.; validation, G.L., A.A. and D.P.; formal analysis, D.P.; investigation, A.A.; resources, G.L. and D.P.; data curation, D.P.; writing—original draft preparation, G.L., A.A. and D.P.; writing—review and editing, D.P.; visualization, G.L. and A.A.; supervision, A.A. and D.P.; project administration, D.P. and A.A.; funding acquisition, D.P. All authors have read and agreed to the published version of the manuscript.

Funding

This research received no external funding.

Data Availability Statement

The data sets generated during and/or analyzed during the current study are available from the corresponding authors on reasonable request.

Acknowledgments

This article was prepared in the light of the data and evaluations obtained in the project titled “Development of Decision Support System for Carbon Friendly Sports Management”, which is supported by the “Turkish Scientific and Technological Research Council (TUBITAK) 2219 International Postdoctoral Research Fellowship Program for Turkish Citizens”, and it was carried out by Ahmet Atalay.

Conflicts of Interest

The authors declare no conflicts of interest.

References

  1. Čiegis, R.; Vijūnas, M. Sustainable banking: Theoretical and practical aspects. In Sustainable Development: Theory and Practice, 1st ed.; Vilnius University Press: Vilnius, Lithuania, 2013. [Google Scholar]
  2. Eichinger, M. Transformational change in the Anthropocene epoch. Lancet Planet Health 2019, 3, e116–e117. [Google Scholar] [CrossRef] [PubMed]
  3. Heinonen, J.; Ottelin, J.; Ala-Mantila, S.; Wiedmann, T.; Clarke, J.; Junnila, S. Spatial consumption-based carbon footprint assessments—A review of recent developments in the field. J. Clean. Prod. 2020, 256, 120335. [Google Scholar] [CrossRef]
  4. Mulrow, J.; Machaj, K.; Deanes, J.; Derrible, S. The state of carbon footprint calculators: An evaluation of calculator design and user interaction features. Sustain. Prod. Consum. 2019, 18, 33–40. [Google Scholar] [CrossRef]
  5. Dolf, M.; Teehan, P. Reducing the carbon footprint of spectator and team travel at the University of British Columbia’s varsity sports events. Sport Manag. Rev. 2015, 18, 244–255. [Google Scholar] [CrossRef]
  6. Intergovernmental Panel on Climate Change. Impacts Adaptation and Vulnerability. Summary for Policymakers. Climate Change 2022. Available online: https://www.ipcc.ch/report/ar6/wg2/chapter/summary-for-policymakers/ (accessed on 2 February 2024).
  7. Ruževičius, J.; Dapkus, M. Methodologies for calculating the carbon footprint of small organizations. Calitatea 2018, 19, 112–117. [Google Scholar]
  8. Scrucca, F.; Barberio, G.; Fantin, V.; Porta, P.L.; Barbanera, M. Carbon footprint: Concept, methodology and calculation. In Carbon Footprint Case Studies: Municipal Solid Waste Management, 1st ed.; Muthu, S.S., Ed.; Springer: Singapore, 2021; pp. 1–31. [Google Scholar] [CrossRef]
  9. Wiedmann, T.; Minx, J. A Definition of ‘Carbon Footprint’. In Ecological Economics Research Trends; Pertsova, C.C., Ed.; Nova Science Publishers: Hauppauge, NY, USA, 2008; Chapter 1; pp. 1–11. Available online: https://www.novapublishers.com/catalog/product_info.php?products_id=5999 (accessed on 1 February 2024).
  10. Şahin, M.T. Karbon Ayak Izi Uygulamaları: Çimento Fabrikası Örneği. Master’s Thesis, Gebze University, Gebze, Turkey, 2019. [Google Scholar]
  11. Chard, C.; Mallen, C. Examining the linkages between automobile use and carbon impacts of community-based ice hockey. Sport Manag. Rev. 2012, 15, 476–484. [Google Scholar] [CrossRef]
  12. Casper, J.M.; Pfahl, M.E. Environmental behavior frameworks of sport and recreation undergraduate students. Sport Manag. Educ. J. 2012, 6, 8–20. [Google Scholar] [CrossRef]
  13. Preira, R.P.T.; Filimonau, V.; Ribeiro, G.M. Score a goal for climate: Assessing the carbon footprint of travel patterns of the English Premier League clubs. J. Clean Prod. 2019, 227, 167–177. [Google Scholar] [CrossRef]
  14. Del Bello, R. The NBA Takes Action to Reduce Its Carbon Footprint. Available online: https://www.lemonde.fr/en/sports/article/2022/08/24/the-nba-takes-action-to-reduce-its-carbon-footprint_5994611_9.html (accessed on 1 February 2024).
  15. Alola, A.A.; Adebayo, T.S. Analyzing the waste management, industrial and agriculture greenhouse gas emissions of biomass, fossil fuel, and metallic ores utilization in Iceland. Sci. Total Environ. 2023, 887, 164115. [Google Scholar] [CrossRef] [PubMed]
  16. Schmidt, C. Putting the earth in play: Environmental awareness and sports. Environ. Health Perspect. 2006, 114, A286–A295. [Google Scholar] [CrossRef]
  17. Green, B. Sustainability and the NBA. Available online: https://bethesdagreen.org/sustainability-the-nba/ (accessed on 2 February 2024).
  18. Thibault, L. Globalization of sport: An inconvenient truth. J. Sport Manag. 2009, 23, 1–20. [Google Scholar] [CrossRef]
  19. Al-Hamrani, A.; Kim, D.; Kucukvar, M.; Onat, N.C. Circular economy application for a Green Stadium construction towards sustainable FIFA world cup Qatar 2022. Environ. Impact Assess. Rev. 2021, 87, 106543. [Google Scholar] [CrossRef]
  20. United Nations Climate Change. Sports for Climate Action. Available online: https://unfccc.int/climate-action/sectoral-engagement/sports-for-climate-action (accessed on 4 February 2024).
  21. Cook, J.; Oreskes, N.; Doran, P.T.; Anderegg, W.R.L.; Verheggen, B.; Maibach, E.W.; Carlton, J.S.; Lewandowsky, S.; Skuce, A.G.; Green, S.A.; et al. Consensus on consensus: A synthesis of consensus estimates on human-caused global warming. Environ. Res. Lett. 2016, 11, 048002. [Google Scholar] [CrossRef]
  22. Eskander, S.M.S.U.; Fankhauser, S. Reduction in greenhouse gas emissions from national climate legislation. Nat. Clim. Chang. 2020, 10, 750–756. [Google Scholar] [CrossRef]
  23. Lewandowsky, S.; Cook, J.; Fay, N.; Gignac, G.E. Science by social media: Attitudes towards climate change are mediated by perceived social consensus. Mem. Cognv. 2019, 47, 1445–1456. [Google Scholar] [CrossRef]
  24. Corner, A.; Whitmarsh, L.; Xenias, D. Uncertainty, skepticism and attitudes towards climate change: Biased assimilation and attitude polarization. Clim. Change 2012, 114, 463–478. [Google Scholar] [CrossRef]
  25. Cardinale, B.J.; Duffy, J.E.; Gonzalez, A.; Hooper, D.U.; Perrings, C.; Venail, P.; Narwani, A.; Mace, G.M.; Tilman, D.; Wardle, D.A.; et al. Biodiversity loss and its impact on humanity. Nature 2012, 486, 59–67. [Google Scholar] [CrossRef]
  26. Wilby, R.L.; Orr, M.; Depledge, D.; Giulianotti, R.; Havenith, G.; Kenyon, J.A.; Taylor, L. The impacts of sport emissions on climate: Measurement, mitigation, and making a difference. Ann. N. Y. Acad. Sci. 2023, 1519, 20–33. [Google Scholar] [CrossRef]
  27. Wicker, P.; Thormann, T.F. Environmental impacts of major sport events. In Research Handbook on Major Sporting Events, 1st ed.; Edward Elgar Publishing: Cheltenham, UK, 2024; pp. 373–385. [Google Scholar]
  28. Vienažindienė, M.; Perkumienė, D.; Atalay, A.; Švagždiene, B. The last quarter for sustainable environment in basketball: The carbon footprint of basketball teams in Türkiye and Lithuania. Front. Environ. Sci. 2023, 11, 1197798. [Google Scholar] [CrossRef]
  29. Bernard, P.; Chevance, G.; Kingsbury, C.; Baillot, A.; Romain, A.J.; Molinier, V.; Dancause, K.N. Climate change, physical activity and sport: A systematic review. Sports Med. 2021, 51, 1041–1059. [Google Scholar] [CrossRef]
  30. Wicker, P. The carbon footprint of active sport tourists: An empirical analysis of skiers and boarders. J. Sport Tour. 2018, 22, 151–171. [Google Scholar] [CrossRef]
  31. U.K. Department for Business, Energy & Industrial Strategy. Government Conversion Factors for Company Reporting of Greenhouse Gas Emissions. Available online: https://www.gov.uk/government/collections/government-conversion-factors-for-company-reporting (accessed on 3 February 2023).
  32. Punch, K.F. Introduction to Social Research: Quantitative and Qualitative Approaches, 1st ed.; Sage Publication: London, UK, 2013. [Google Scholar]
  33. Philipsen, H.; Vernooij-Dassen, M. Kwalitatief onderzoek: Nuttig, onmisbaar en uitdagend. In Qualitative Research: Practical Methods for Medical Practice, 1st ed.; Bohn Stafleu van Loghum: Houten, The Netherlands, 2007. [Google Scholar]
  34. Chauhan, C.; Parida, V.; Dhir, A. Linking circular economy and digitalization technologies: A systematic literature review of past achievements and future promises. Technol. Forecast. Soc. Change 2022, 177, 121508. [Google Scholar] [CrossRef]
  35. Glesne, C. Introduction to Qualitative Research, 1st ed.; Anı Yayınları: Ankara, Turkey, 2013. [Google Scholar]
  36. Merriam, S.B. Nitel Araştirma Desen ve Uygulama İçin Bir Rehber, 1st ed.; Nobel Yayıncılık: Ankara, Turkey, 2015. [Google Scholar]
  37. Büyüköztürk, Ş.; Çakmak, E.K.; Akgün, Ö.E.; Karadeniz, Ş.; Demirel, F. Bilimsel Araştirma Yöntemleri, 1st ed.; Pegem Akademi Yayınları: Ankara, Turkey, 2018. [Google Scholar]
  38. Obilor, E.I. Convenience and purposive sampling techniques: Are they the same. Int. J. Innov. Soc. Sci. Educ. Res. 2023, 11, 1–7. [Google Scholar]
  39. Thomas, F.B. The role of purposive sampling technique as a tool for informal choices in a social Sciences in research methods. Just Agric. 2022, 2, 1–8. [Google Scholar]
  40. Çepni, S. Araştirma ve Proje Çalişmalarina Giriş, 1st ed.; Celepler Matbaacılık: Trabzon, Turkey, 2009. [Google Scholar]
  41. Creswell, J.W.; Plano Clark, V.L. Designing and Conducting Mixed Methods Research, 1st ed.; Sage Publication: Thousand Oaks, CA, USA, 2011. [Google Scholar]
  42. Civelekoğlu, G.; Bıyık, Y. Investigation of carbon footprint change from the transportation sector (Turkish). Bilge Int. J. Sci. Technol. Res. 2018, 2, 157–166. [Google Scholar]
  43. Cadarso, M.Á.; Gomez, N.; López, L.A.; Tobarra, M.Á. Calculating tourism’s carbon footprint: Measuring the impact of investments. J. Clean. Prod. 2016, 111, 529–537. [Google Scholar] [CrossRef]
  44. Zhuang, X.; Jiang, K.; Zhao, X. Analysis of the carbon footprint and its environmental impact factors for living and travel in Shijiazhuang city. Adv. Clim. Change Res. 2011, 2, 159–165. [Google Scholar] [CrossRef]
  45. Lenzen, M.; Sun, Y.Y.; Faturay, F.; Ting, Y.P.; Geschke, A.; Malik, A. The carbon footprint of global tourism. Nat. Clim. Change 2018, 8, 522–528. [Google Scholar] [CrossRef]
  46. Rico, A.; Martínez-Blanco, J.; Montlleó, M.; Rodríguez, G.; Tavares, N.; Arias, A.; Oliver-Solà, J. Carbon footprint of tourism in Barcelona. Tour. Manag. 2019, 70, 491–504. [Google Scholar] [CrossRef]
  47. Çalışkan Doğan, Z.; Kurt, Ü.; Timur, M.C. İklim değişikliği ve ulaşım sektörü ilişkisinin ekonometrik analizi: Türkiye örneği. In Proceedings of the International Congress of Energy, Economy and Policy, İstanbul, Turkey, 25–26 March 2017. [Google Scholar]
  48. Yaacob, N.F.F.; Mat Yazid, M.R.; Abdul Maulud, K.N.; Ahmad Basri, N.E. A review of the measurement method, analysis and implementation policy of carbon dioxide emission from transportation. Sustainability 2020, 12, 5873. [Google Scholar] [CrossRef]
  49. Deng, W.; Zhou, J. Analysis on sports and environmental protection problems. In Proceedings of the 2nd International Conference on Environmental Science and Energy Engineering, Shanghai, China, 10–11 January 2014. [Google Scholar]
  50. Wang, Y. Research progress of sports and environmental protection problems. J. Hum. Inst. Phys. Educ. 2012, 46, 20–23. [Google Scholar]
  51. Mascagni, K. First world conference on sport and the environment. J. Olymp. Rev. 1995, 4, 31–33. [Google Scholar]
  52. Babiak, K.; Trendafilova, S. CSR and environmental responsibility: Motives and pressures to adopt green management practices. Corp. Soc. Responsib. Environ. Manag. 2011, 18, 11–24. [Google Scholar] [CrossRef]
  53. McCullough, B.P.; Pfahl, M.E.; Nguyen, S.N. The green waves of environmental sustainability in sport. Sport Soc. 2016, 9, 1040–1065. [Google Scholar] [CrossRef]
  54. Carbon Neutrality Platform. Carbon Neutrality for Sports: Take Action Now. Available online: https://net0.com/blog/sports-and-climate (accessed on 21 February 2022).
  55. Loewen, C.; Wicker, P. Travelling to Bundesliga matches: The carbon footprint of football fans. J. Sport Tour. 2021, 25, 253–272. [Google Scholar] [CrossRef]
  56. FIFA−Fédération Internationale de Football Association. Sustainability Report of the 2014 FIFA World Cup Brazil™. Available online: https://digitalhub.fifa.com/m/3756a3d1bce5e27a/original/educsd2hgasief3yeoyt-pdf.pdf (accessed on 6 February 2024).
  57. Edwards, L.; Knight, J.; Handler, R.; Abraham, J.; Blowers, P. The methodology and results of using life cycle assessment to measure and reduce the greenhouse gas emissions footprint of “Major Events” at the University of Arizona. J. Life Cycle Assess. 2016, 21, 536–554. [Google Scholar] [CrossRef]
  58. Cooper, J.A.; McCullough, B.P. Bracketing sustainability: Carbon footprinting March Madness to rethink sustainable tourism approaches and measurements. J. Clean Prod. 2021, 318, 128475. [Google Scholar] [CrossRef]
  59. Triantafyllidis, S.; Davakos, H. Growing cities and mass participant sport events: Traveling behaviors and carbon dioxide emissions. J. Carbon Res. 2019, 5, 49. [Google Scholar] [CrossRef]
  60. Sorrentini, F. The environmental impact of sports activities. Good practices for sustainability: The case of golf. Doc. Geogr. 2021, 2, 219–237. [Google Scholar] [CrossRef]
  61. Ahmed, F.; Pretorius, L. Mega-events and environmental impacts: The 2010 FIFA World Cup in South Africa. Alternation 2010, 17, 274–296. [Google Scholar]
  62. Breech, J. Cowboys Stadium Uses More Electricity than Liberia. Available online: www.cbssports.com (accessed on 2 February 2024).
  63. Foster, P. How Football Is Driving Energy Efficiency and Sustainability Targets, Love Energy Savings. Available online: www.loveenergysavings.com (accessed on 2 February 2024).
  64. Khalid, W.; Rogstam, J. Energy usage prediction model comparing outdoor vs. indoor ice rinks. Energy Build. 2013, 67, 195–200. [Google Scholar] [CrossRef]
  65. Smulders, T. Green Stadiums: As Green as Grass. Master’s Thesis, University of Utrecht, Utrecht, The Netherlands, 2012. [Google Scholar]
  66. Du Preez, E.; Heath, E. Determining the influence of the social versus physical context on environmentally responsible behavior among cycling spectators. J. Sport Tour. 2016, 20, 123–143. [Google Scholar] [CrossRef]
  67. Triantafyllidis, S.; Ries, R.J.; Kaplanidou, K. Carbon dioxide emissions of spectators’ transportation in collegiate sporting events: Comparing on-campus and off-campus stadium locations. Sustainability 2018, 10, 241. [Google Scholar] [CrossRef]
  68. Bunds, K.; Casper, J. Sport, physical culture, and the environment: An introduction. Sociol. Sport J. 2018, 35, 1–7. [Google Scholar] [CrossRef]
  69. Hjorthol, R.; Fyhri, A. Do organized leisure activities for children encourage car-use? Trans. Res. Part A Policy Pract. 2009, 43, 209–218. [Google Scholar] [CrossRef]
  70. Wanless, L.; Seifried, C.; Kellison, T. Renewable energy source diffusion in professional sport facilities. J. Sport Manag. 2023, 1, 40–52. [Google Scholar] [CrossRef]
  71. Goodarzi, S.; Bagheri, G.; Yazdani, H. Developing the model of factors affecting the development of renewable energy use in Iran sport facilities. Sport Manag. J. 2021, 13, 161–181. [Google Scholar]
  72. Zhu, J.; Liang, Z.; Zhang, C.; Wei, X. How are sports management, renewable energy, and green finance related? A survey evidence. Renew. Energy 2023, 206, 39–46. [Google Scholar] [CrossRef]
  73. Javani, V.; Davarn Hagh, E. Energy management in stadiums by using hybrid renewable energy systems. J. Adv. Sport Technol. 2021, 5, 99–108. [Google Scholar]
  74. Atalay, A.; Švagždienė, B. Achieving Environmental Sustainability in the Sports Sector; Springer Publishing: Cham, Switzerland, 2023. [Google Scholar] [CrossRef]
  75. Cabaraban, M.T.I.; Khire, M.V.; Alocilja, E.C. Aerobic in-vessel composting versus bioreactor landfilling using life cycle inventory models. Clean Technol. Environ. Policy 2008, 10, 39–52. [Google Scholar] [CrossRef]
  76. Atchariyasopon, K. Sustainable solid waste management in sports events: A case study of football matches in Thailand. J. Popul. Soc. Stud. 2017, 25, 69–81. [Google Scholar]
  77. Bianchini, A.; Rossi, J. Design, implementation and assessment of a more sustainable model to manage plastic waste at sport events. J. Clean. Prod. 2021, 281, 125345. [Google Scholar] [CrossRef]
  78. Hottle, T.A.; Bilec, M.M.; Brown, N.R.; Landis, A.E. Toward zero waste: Composting and recycling for sustainable venue based events. Waste Manag. 2015, 38, 86–94. [Google Scholar] [CrossRef] [PubMed]
  79. Flaccavento, A. Building a Healthy Economy from the Bottom up: Harnessing Real-World Experience for Transformative Change, 1st ed.; University Press of Kentucky: Lexington, KY, USA, 2016. [Google Scholar]
  80. Daddi, T.; Rizzi, F.; Pretner, G.; Todaro, N.; Annunziata, E.; Frey, M.; Iraldo, F. Environmental management of sport events: A focus on European professional football. Sport Bus. Manag. Int. J. 2022, 12, 208–232. [Google Scholar] [CrossRef]
  81. Macnaghten, P. Embodying the environment in every- day life practices. Sociol. Rev. 2003, 51, 63–84. [Google Scholar] [CrossRef]
  82. Nicolaides, A. The implementation of environmental management towards sustainable universities and education for sustainable development as an ethical imperative. Int. J. Sustain. High. Educ. 2006, 7, 414–424. [Google Scholar] [CrossRef]
  83. Casper, J.M.; Pfahl, M.E.; McCullough, B. Intercollegiate sport and the environment: Examining fan engagement based on athletics department sustainability efforts. J. Issues Intercoll. Athl. 2023, 7, 13. [Google Scholar]
  84. Mutezo, G.; Mulopo, J. A review of Africa’s transition from fossil fuels to renewable energy using circular economy principles. Renew. Sustain. Energy Rev. 2021, 137, 110609. [Google Scholar] [CrossRef]
  85. Sayed, E.T.; Olabi, A.G.; Alami, A.H.; Radwan, A.; Mdallal, A.; Rezk, A.; Abdelkareem, M.A. Renewable energy and energy storage systems. Energies 2023, 16, 1415. [Google Scholar] [CrossRef]
  86. Zhang, J.; Qin, Q.; Li, G.; Tseng, C.H. Sustainable municipal waste management strategies through life cycle assessment method: A review. J. Environ. Manag. 2021, 287, 112238. [Google Scholar] [CrossRef]
  87. Nwosu, A.O.; Chukwueloka, H.E. A review of solid waste management strategies in Nigeria. J. Environ. Earth Sci. 2020, 10, 132–143. [Google Scholar]
  88. Esztergár-Kiss, D.; Shulha, Y.; Aba, A.; Tettamanti, T. Promoting sustainable mode choice for commuting supported by persuasive strategies. Sustain. Cities Soc. 2021, 74, 103264. [Google Scholar] [CrossRef]
  89. Sayyadi, R.; Awasthi, A. An integrated approach based on system dynamics and ANP for evaluating sustainable transportation policies. Int. J. Syst. Sci. Oper. Logist. 2020, 7, 182–191. [Google Scholar] [CrossRef]
  90. Ardoin, N.M.; Bowers, A.W.; Gaillard, E. Environmental education outcomes for conservation: A systematic review. Biol. Conserv. 2020, 241, 108224. [Google Scholar] [CrossRef]
Figure 1. Sources of the carbon footprint in the sports sector (prepared by the authors).
Urbansci 08 00055 g001
Figure 2. Study plan.
Urbansci 08 00055 g002
Figure 3. Emission factors of the vehicles. (prepared by the authors).
Urbansci 08 00055 g003
Figure 4. The problems and solutions for carbon footprint (prepared by the authors).
Urbansci 08 00055 g004
Table 1. Distance traveled by the teams.
TeamsVehicle TypeNumber of PersonsDistance Traveled by Plane (km)Distance Traveled by Bus (km)
BarcelonaAirplane245830233
Bus
Real MadridAirplane266696237
Bus
OlympiakosAirplane225686231
Bus
MonacoAirplane245020241
Bus
Total 9623,232942
Table 2. Distance traveled by the fans.
TeamsVehicle TypeNumber of PersonDistance Traveled by Plane (km)Distance Traveled by Bus (km)
BarcelonaAirplane
Bus12584876221
Real MadridAirplane
Bus13546170207
OlympiakosAirplane
Bus53764782241
MonacoAirplane
Bus8144865214
Total 880220,693883
Table 3. The carbon footprint for the teams.
TeamsCF (kg) Based on Vehicle TypeTotal CF (kg)Per Person (kg)
AirplaneBus
Barcelona1125.21518.4911143.70647.654
Real Madrid1292.93018.8081311.73850.451
Olympiakos1097.91018.3321116.24250.738
Monaco969.31219.126988.43841.184
Total4485.36774.7574560.325189.74
Table 4. The carbon footprint for the fans.
TeamsCF (kg) Based on Vehicle TypeTotal CF (kg)Per Person (kg)
AirplaneBus
Barcelona941.50717.538959.0450.62
Real Madrid1191.36516.4281207.7930.892
Olympiakos923.35719.126942.4820.175
Monaco939.38216.983956.5651.174
Total3995.61170.0754065.6863.003
Disclaimer/Publisher’s Note: The statements, opinions and data contained in all publications are solely those of the individual author(s) and contributor(s) and not of MDPI and/or the editor(s). MDPI and/or the editor(s) disclaim responsibility for any injury to people or property resulting from any ideas, methods, instructions or products referred to in the content.

