
How Do Socio-Demographic Characteristics Affect Users’ Perception of Place Quality at Station Areas? Evidence from Amsterdam, The Netherlands


Abstract
1. Introduction
2. Place Quality in Station Areas and Its Dimensions
2.1. Place Quality in the Context of Transit Services: Wayfinding and Transfer
2.2. Place Quality in the Context of Places for Business Activities: Land Use Diversity and Shopping
2.3. Place Quality and Gateway Experience: Aesthetics, Comfort, and Safety
2.4. Research Questions
3. Methodology
3.1. Survey Design
3.2. Data Collection
4. Results and Interpretation
4.1. Exploratory Factor Analysis
4.2. Path Analysis
4.3. Model Results
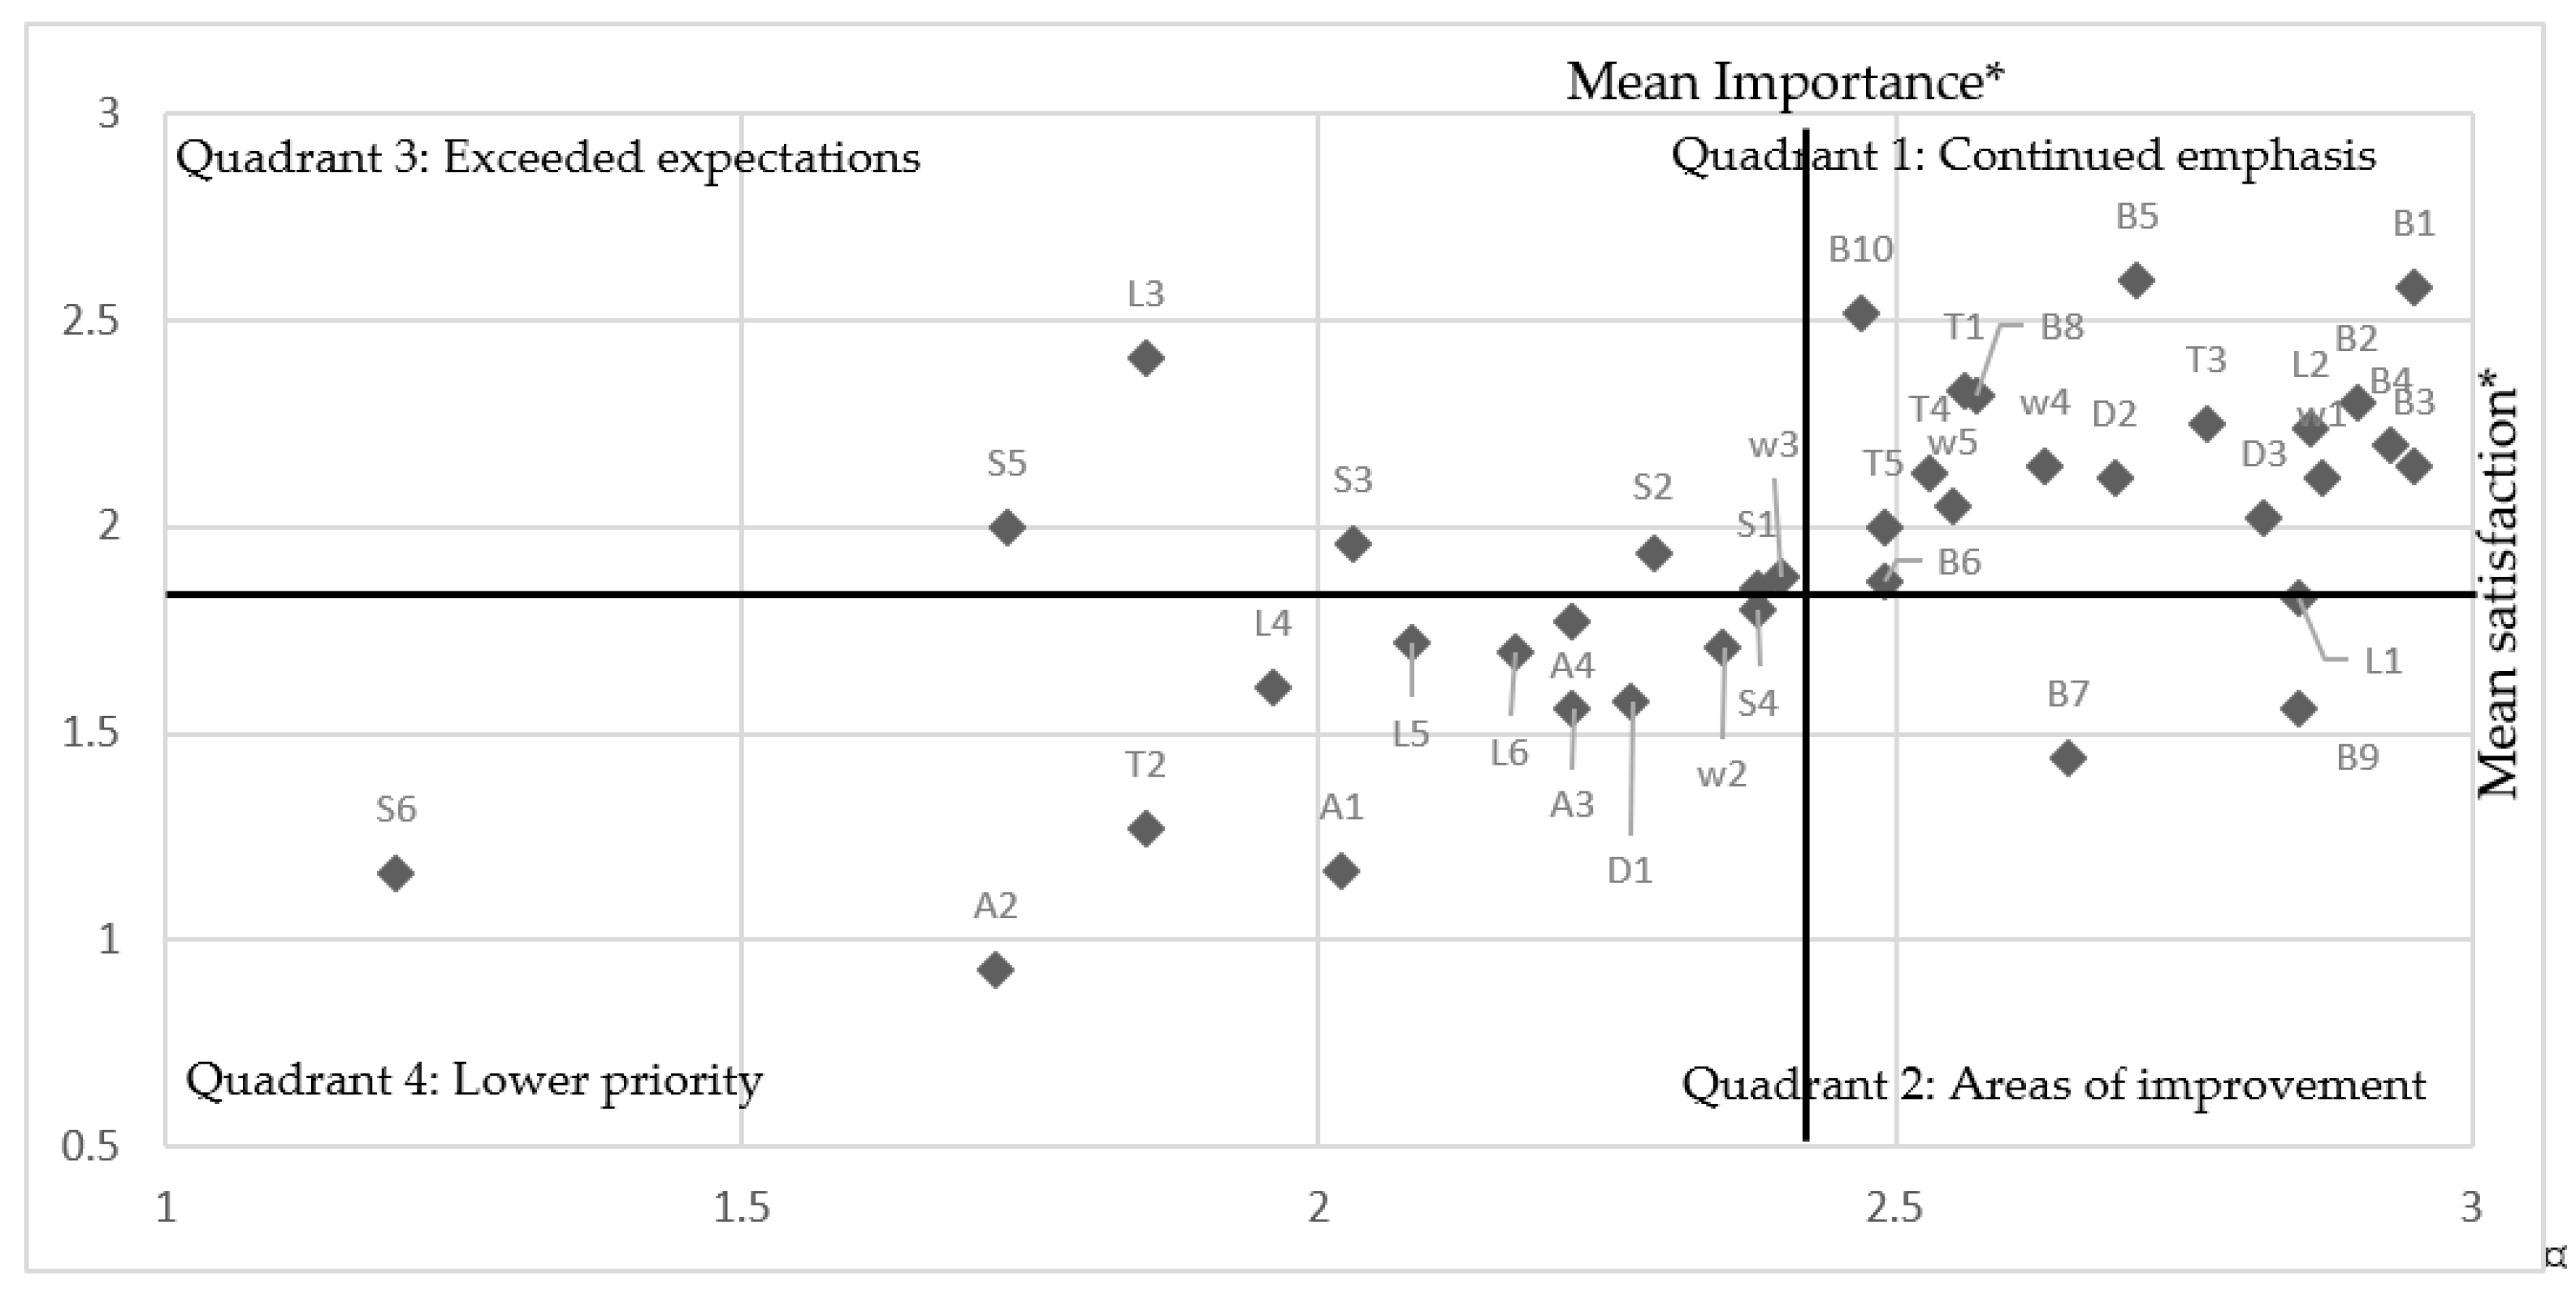
5. I-S Analysis
- The usage of Amsterdam Central station square seems the most urgent aspect to concentrate on, including help in emergency and accessibility facilities for seniors. The dissatisfaction is related to the ongoing renovations. Although the negative effects of the construction site on users are expected to disappear in the future due to the completion of the project, temporary routes with gender- and age-friendly facilities should be still considered to optimize the current usage of the square.
- The second priority goes to help in an emergency, especially in the case of female users. For example, during the nighttime, lighting and the presence of police/rail staff are crucial. Increasing police and introducing CCTV in specific areas, despite the controversy, are still worthy of discussion. In addition, although increasing the diversity of land use in the area is not considered important by users, it also acts as a crucial aspect of creating women-friendly environments.
- As for shops, although shopping activities are important to some users, the youth, nearby residents, and commuters, the actual responses to shopping services by the majority were not positive. Thus, improving the diversity/open hours/accessibility of shopping, which is expected by developers and local government, might require a reduction in other features of place quality such as transfer efficiency, which will negatively impact users’ quality perceptions. The policy implication of this conclusion is that investments in shopping services must be selective, after satisfying the standard needs of food and drink options.
6. Conclusions
Author Contributions
Funding
Institutional Review Board Statement
Informed Consent Statement
Acknowledgments
Conflicts of Interest
References
- Bertolini, L.; Spit, T. Cities on Rails: The Redevelopment of Railway Stations and their Surroundings; Routledge: Lonodn, UK, 1998. [Google Scholar] [CrossRef]
- Bertolini, L. Station areas as nodes and places in urban networks: An analytical tool and alternative development strategies. In Railway Development: Impacts on Urban Dynamics; Springer: Berlin/Heidelberg, Germany, 2008; pp. 35–57. [Google Scholar] [CrossRef]
- Lee, C.; Moudon, A.V. The 3Ds+R: Quantifying land use and urban form correlates of walking. Transp. Res. Part D Transp. Environ. 2006, 11, 204–215. [Google Scholar] [CrossRef]
- Hale, C.A.; Miller, M. Amenity and opportunity at rail stations. Aust. Plan. 2013, 50, 44–54. [Google Scholar] [CrossRef]
- Peters, D. The renaissance of inner-city rail station areas as a key element in the contemporary dynamics of urban restructuring. Crit. Plan. 2009, 16, 163–185. [Google Scholar]
- Stradling, S.G.; Anable, J.; Carreno, M. Performance, importance and user disgruntlement: A six-step method for measuring satisfaction with travel modes. Transp. Res. Part A Policy Pract. 2007, 41, 98–106. [Google Scholar] [CrossRef]
- Cascetta, E.; Cartenì, A. The hedonic value of railways terminals. A quantitative analysis of the impact of stations quality on travellers behaviour. Transp. Res. Part A Policy Pract. 2014, 61, 41–52. [Google Scholar] [CrossRef]
- Triggianese, M.; Roberto, C.; Baron, N.; Kuijper, J. Stations as Nodes: Exploring The Role Of Stations In Future Metropolitan Areas from a French and Dutch Perspective; TU Delft Open: Delft, The Netherlands, 2019; Available online: https://books.bk.tudelft.nl/index.php/press/catalog/view/682/790/686-4 (accessed on 18 October 2021).
- Marinov, M.; Lima, T.; Kühl, B.; Bogacki, A.; Onbasi, C. Analysis of customer services in railway passenger stations using a holistic method—Application to Newcastle central station. Transport. Probl. 2014, 9, 61–70. [Google Scholar]
- Iseki, H.; Ringler, A.; Taylor, B.D.; Miller, M.; Smart, M. Evaluating Transit Stops and Stations from the Perspective of Transit Users. 2007. Available online: https://www.its.ucla.edu/wp-content/uploads/sites/6/2014/06/Appendix-C.pdf (accessed on 15 October 2021).
- de Oña, J.; de Oña, R.; Calvo-Poyo, F. A classification tree approach to identify key factors of transit service quality. Expert Syst. Appl. 2012, 39, 11164–11171. [Google Scholar] [CrossRef]
- Lois, D.; Monzón, A.; Hernández, S. Analysis of satisfaction factors at urban transport interchanges: Measuring travellers’ attitudes to information, security and waiting. Transp. Policy 2018, 67, 49–56. [Google Scholar] [CrossRef]
- Nag, D.; BS, M.; Goswami, A.; Bharule, S. Framework for Public Transport Integration at Railway Stations and Its Implications for Quality of Life. Ssrn Electron. J. 2018, 1054, 1–12. [Google Scholar] [CrossRef]
- Anciaes, P.; Jones, P. Transport policy for liveability—Valuing the impacts on movement, place, and society. Transp. Res. Part A Policy Pract. 2020, 132, 157–173. [Google Scholar] [CrossRef]
- Hernandez, S.; Monzon, A. Key factors for defining an efficient urban transport interchange: Users’ perceptions. Cities 2016, 50, 158–167. [Google Scholar] [CrossRef]
- Loukaitou-Sideris, A.; Peters, D. What is Good Station-Area Planning? Lessons from Experts and Case Studies. Built Environ. 2020, 46, 422–439. [Google Scholar] [CrossRef]
- Trip, J.J. What Makes A City? Planning For ‘Quality of Place’. The Case of High Speed Train Station Area Redevelopment; IOS Press under the imprint Delft University Press: Amsterdam, The Netherlands, 2007. [Google Scholar]
- Trip, J.J. Assessing Quality of Place: A Comparative Analysis of Amsterdam and Rotterdam. J. Urban. Aff. 2007, 29, 501–517. [Google Scholar] [CrossRef]
- Esmaeilpoorarabi, N.; Yigitcanlar, T.; Guaralda, M. Place quality in innovation clusters: An empirical analysis of global best practices from Singapore, Helsinki, New York, and Sydney. Cities 2018, 74, 156–168. [Google Scholar] [CrossRef]
- Murgaš, F.; Klobučník, M. Municipalities and Regions as Good Places to Live: Index of Quality of Life in the Czech Republic. Appl. Res. Qual. Life 2018, 11, 553–570. [Google Scholar] [CrossRef]
- Groenendijk, L.; Rezaei, J.; Correia, G. Incorporating the travellers’ experience value in assessing the quality of transit nodes: A Rotterdam case study. Case Stud. Transp. Policy 2018, 6, 564–576. [Google Scholar] [CrossRef]
- Jaarverslag, N.S. Available online: https://dashboards.nsjaarverslag.nl/reizigersgedrag/amsterdam-centraal (accessed on 30 July 2021).
- Willigers, J.; van Wee, B. High-speed rail and office location choices. A stated choice experiment for the Netherlands. J. Transp. Geogr. 2011, 19, 745–754. [Google Scholar] [CrossRef]
- Zhen, F.; Cao, X.; Tang, J. Exploring correlates of passenger satisfaction and service improvement priorities of the Shanghai-Nanjing High Speed Rail. J. Transp. Land Use 2018, 11, 559–573. [Google Scholar] [CrossRef]
- Sands, B.D. The Development Effects of High-Speed Rail Stations and Implications for California. Built Environ. 1993, 19, 257–284. [Google Scholar] [CrossRef]
- Starmans, M.; Verhoeff, L.; Heuvel, J.V.D. Passenger Transfer Chain Analysis for Reallocation of Heritage Space at Amsterdam Central Station. Transp. Res. Procedia 2014, 2, 651–659. [Google Scholar] [CrossRef][Green Version]
- Diao, M.; Zhu, Y.; Zhu, J. Intra-city access to inter-city transport nodes: The implications of high-speed-rail station locations for the urban development of Chinese cities. Urban. Stud. 2017, 54, 2249–2267. [Google Scholar] [CrossRef]
- Du, J.; Druta, O.; J.V. van Wesemael, P. Place quality in High-Speed Rail station areas: Concept definition. Transp. Land Use 2021, 14, 1–22. [Google Scholar]
- Zacharias, J.; Zhang, T.; Nakajima, N. Tokyo Station City: The railway station as urban place. Urban. Des. Int. 2011, 16, 242–251. [Google Scholar] [CrossRef]
- Zemp, S.; Stauffacher, M.; Lang, D.J.; Scholz, R.W. Generic functions of railway stations—A conceptual basis for the development of common system understanding and assessment criteria. Transp. Policy 2011, 18, 446–455. [Google Scholar] [CrossRef]
- Van Hagen, M. Waiting Experience at Train. Stations. Available online: https://ris.utwente.nl/ws/portalfiles/portal/6066520/thesis_M_van_Hagen.pdf (accessed on 18 October 2021).
- Silva, J.D.A.E.; Bazrafshan, H. User Satisfaction of Intermodal Transfer Facilities in Lisbon, Portugal. Transp. Res. Rec. J. Transp. Res. Board 2013, 2350, 102–110. [Google Scholar] [CrossRef]
- Diana, M. Measuring the satisfaction of multimodal travelers for local transit services in different urban contexts. Transp. Res. Part A Policy Pract. 2012, 46, 1–11. [Google Scholar] [CrossRef]
- Cao, J.; Cao, X. Comparing importance-performance analysis and three-factor theory in assessing rider satisfaction with transit. J. Transp. Land Use 2017, 10, 65–68. [Google Scholar] [CrossRef]
- Pongprasert, P.; Kubota, H. TOD residents’ attitudes toward walking to transit station: A case study of transit-oriented developments (TODs) in Bangkok, Thailand. J. Mod. Transp. 2019, 27, 39–51. [Google Scholar] [CrossRef]
- Wu, R. Passenger Experience of China’s High Speed Rail (HSR) Service. Open J. Soc. Sci. 2018, 06, 253–259. [Google Scholar] [CrossRef][Green Version]
- Terzis, G.; Last, A. Guide—Urban Interchanges—A Good Practice Guide (Vol. Final). European Commission. Available online: https://trimis.ec.europa.eu/sites/default/files/project/documents/guide.pdf (accessed on 18 October 2021).
- Chen, N.; Akar, G. How do socio-demographics and built environment affect individual accessibility based on activity space? Evidence from Greater Cleveland, Ohio. J. Transp. Land Use 2018, 10, 477–503. [Google Scholar] [CrossRef]
- Farr, A.C.; Kleinschmidt, T.; Yarlagadda, P.K.; Mengersen, K. Wayfinding: A simple concept, a complex process. Transp. Rev. 2012, 32, 715–743. [Google Scholar] [CrossRef]
- Filingeri, V.; Eason, K.; Waterson, P.; Haslam, R. Factors influencing experience in crowds—The participant perspective. Appl. Erg. 2017, 59, 431–441. [Google Scholar] [CrossRef]
- Horowitz, A.J.; Thompson, N.A. Generic objectives for evaluation of intermodal passenger transfer facilities. Transp. Res. Rec. 1995, 1503, 104–110. [Google Scholar]
- de Oña, J.; de Oña, R.; Eboli, L.; Mazzulla, G. Index numbers for monitoring transit service quality. Transp. Res. Part A Policy Pract. 2016, 84, 18–30. [Google Scholar] [CrossRef]
- Nathanail, E. Measuring the quality of service for passengers on the hellenic railways. Transp. Res. Part A Policy Pract. 2008, 42, 48–66. [Google Scholar] [CrossRef]
- La Paix Puello, L.; Geurs, K. Adaptive stated choice experiment for access and egress mode choice to train stations. In Proceedings of the World Symposium of Transport Land Use and Research (WSTLUR), Delft, The Netherlands, 24–27 June 2014; Available online: https://ris.utwente.nl/ws/portalfiles/portal/5535542/WSTLUR_LaPaix_Geurs2014.pdf (accessed on 18 October 2021).
- Punter, J. Urban Design and the English Urban Renaissance 1999–2009: A Review and Preliminary Evaluation. J. Urban. Des. 2011, 16, 1–41. [Google Scholar] [CrossRef]
- Park, K.; Ewing, R.; Scheer, B.C.; Tian, G. The impacts of built environment characteristics of rail station areas on household travel behavior. Cities 2018, 74, 277–283. [Google Scholar] [CrossRef]
- Darchen, S.; Tremblay, D.-G. What attracts and retains knowledge workers/students: The quality of place or career opportunities? The cases of Montreal and Ottawa. Cities 2010, 27, 225–233. [Google Scholar] [CrossRef]
- Lawton, P.; Murphy, E.; Redmond, D. Residential preferences of the ‘creative class’? Cities 2013, 31, 47–56. [Google Scholar] [CrossRef]
- Calvo-Poyo, F.; de Oña, J.; Arán, F.; Nash, A. Light Rail Transit Experience in Madrid, Spain. Transp. Res. Rec. J. Transp. Res. Board 2013, 2353, 82–91. [Google Scholar] [CrossRef]
- Calvo, F.; De Oña, J.; Arán, F. Impact of the Madrid subway on population settlement and land use. Land Use Policy 2013, 31, 627–639. [Google Scholar] [CrossRef]
- Kickert, C.C.; Pont, M.B.; Nefs, M. Surveying Density, Urban Characteristics, and Development Capacity of Station Areas in the Delta Metropolis. Environ. Plan. B Plan. Des. 2014, 41, 69–92. [Google Scholar] [CrossRef]
- Rahman, N.A.; Ghani, I.; Teh, M.Z.; Ibrahim, K. Rethinking Urban Public Space: Physical and Functional Analysis through Visual Surveys. IOP Conf. Ser. Earth Environ. Sci. 2020, 409, 012002. [Google Scholar] [CrossRef]
- Li, C.; Yamamoto, T.; Morikawa, T. Analysis of user impressions of railway stations, focusing on the effects of adjunct retail facilities. Wit Trans. Built Environ. 2005, 77, 849–858. [Google Scholar]
- Li, C.; Yamamoto, T.; Morikawa, T. The railway station as shopping destination. Conf. Traffic Transp. Stud. ICTTS 2004, 4, 715–725. [Google Scholar]
- Nuworsoo, C.K.; Deakin, E. Transforming High-Speed Rail Stations to Major Activity Hubs: Lessons for California. In 88th Annu. Meet. Transp. Res. Board 2009, 1, 1–18. [Google Scholar]
- Alexander, M.; Hamilton, K. A ‘placeful’ station? The community role in place making and improving hedonic value at local railway stations. Transp. Res. Part A Policy Pract. 2015, 82, 65–77. [Google Scholar] [CrossRef]
- Diemer, M.J.; Currie, G.; De Gruyter, C.; Hopkins, I. Filling the space between trams and place: Adapting the ‘Movement & Place’ framework to Melbourne’s tram network. J. Transp. Geogr. 2018, 70, 215–227. [Google Scholar] [CrossRef]
- Read, S.; Rooij, R. Integrating Mobility Environments in the City. Available online: http://https://www.corp.at/archive/CORP2008_20.pdf (accessed on 18 October 2021).
- Verhoef, P.; Bosma, J.; Urlings, T.; van der Boog, H.; Heijnsbroek, M.; Rijkes, H. Leveraging Big Data to Make Your Customers Happy. 2018. Available online: https://www.ns.nl/binaries/_ht_1525771196247/content/assets/ns-nl/over-ns/2018/customer-experience-analytics-ns.pdf (accessed on 18 October 2021).
- van Hagen, M.; Bron, P. Enhancing the Experience of the Train Journey: Changing the Focus from Satisfaction to Emotional Experience of Customers. Transp. Res. Procedia 2014, 1, 253–263. [Google Scholar] [CrossRef]
- Wang, B. How To Encourage Public Life In Squares of Chinese Railway Stations through Better Urban. Design; University College London: London, UK, 2014. [Google Scholar]
- Dai, J.; Jia, S.; Lv, F. Evaluation of the Front Square of Harbin West Railway Station Based on POE Method. IOP Conf. Ser. Earth Environ. Sci. 2019, 234, 012003. [Google Scholar] [CrossRef]
- Duckworth-Smith, A.; Babb, C. Indicating Quality of Place for station precinct development: Enhancing ‘place’ in the place/node model. In Proceedings of the 7th State of Australian Cities Conference, Gold Coast, Australia, 9–11 December 2015; Available online: https://apo.org.au/sites/default/files/resource-files/2015-12/apo-nid63332.pdf (accessed on 18 October 2021).
- Ewing, R.; Handy, S. Measuring the Unmeasurable: Urban Design Qualities Related to Walkability. J. Urban. Des. 2009, 14, 65–84. [Google Scholar] [CrossRef]
- Ingvardson, J.B.; Nielsen, O.A. The influence of vicinity to stations, station characteristics and perceived safety on public transport mode choice: A case study from Copenhagen. Public Transp. 2021. [Google Scholar] [CrossRef]
- Durmisevic, S.; Sariyildiz, S. A systematic quality assessment of underground spaces—Public transport stations. Cities 2001, 18, 13–23. [Google Scholar] [CrossRef]
- Peek, G.-J.; van Hagen, M. Creating Synergy in and Around Stations: Three Strategies for Adding Value. Transp. Res. Rec. J. Transp. Res. Board 2002, 1793, 1–6. [Google Scholar] [CrossRef]
- Iseki, H.; Taylor, B. Style versus Service? An Analysis of User Perceptions of Transit Stops and Stations. J. Public Transp. 2010, 13, 23–48. [Google Scholar] [CrossRef]
- Coppola, P.; Silvestri, F. Assessing travelers’ safety and security perception in railway stations. Case Stud. Transp. Policy 2020, 8, 1127–1136. [Google Scholar] [CrossRef]
- Khan, M.F.; Aftab, S.; Fakhruddin. Quality of Urban Environment: A Critical Review of Approaches and Methodologies. Curr. Urban. Stud. 2015, 3, 368–384. [Google Scholar] [CrossRef]
- Li, L.; Loo, B.P. Towards people-centered integrated transport: A case study of Shanghai Hongqiao Comprehensive Transport Hub. Cities 2016, 58, 50–58. [Google Scholar] [CrossRef]
- Carreira, R.; Patrício, L.; Jorge, R.N.; Magee, C. Understanding the travel experience and its impact on attitudes, emotions and loyalty towards the transportation provider–A quantitative study with mid-distance bus trips. Transp. Policy 2014, 31, 35–46. [Google Scholar] [CrossRef]
- Akiyama, T.; Okushima, M. Analysis of Railway User Travel Behaviour Patterns of Different Age Groups. IATSS Res. 2009, 33, 6–17. [Google Scholar] [CrossRef]
- Hernandez, S.; Monzon, A.; de Oña, R. Urban transport interchanges: A methodology for evaluating perceived quality. Transp. Res. Part A Policy Pract. 2016, 84, 31–43. [Google Scholar] [CrossRef]
- Gilbert, R.; Irwin, N.; Hollingworth, B.; Blais, P. Sustainable Transportation Performance Indicators (STPI) Projects. In Reports on Phase 3: CSTCTD. 2002. Available online: https://citeseerx.ist.psu.edu/viewdoc/download?doi=10.1.1.661.7698&rep=rep1&type=pdf (accessed on 18 October 2021).
- Boyas, J.; Wind, L.H.; Kang, S.-Y. Exploring the relationship between employment-based social capital, job stress, burnout, and intent to leave among child protection workers: An age-based path analysis model. Child. Youth Serv. Rev. 2012, 34, 50–62. [Google Scholar] [CrossRef]
- Gao, Y.; Rasouli, S.; Timmermans, H.; Wang, Y. Effects of traveller’s mood and personality on ratings of satisfaction with daily trip stages. Travel Behav. Soc. 2017, 7, 1–11. [Google Scholar] [CrossRef]
- Berry, R.E.; Williams, F.L. Assessing the Relationship between Quality of Life and Marital and Income Satisfaction: A Path Analytic Approach. J. Marriage Fam. 1987, 49, 107. [Google Scholar] [CrossRef]
- Weijs-Perrée, M.; Dane, G.; Berg, P.V.D.; van Dorst, M. A Multi-Level Path Analysis of the Relationships between the Momentary Experience Characteristics, Satisfaction with Urban Public Spaces, and Momentary- and Long-Term Subjective Wellbeing. Int. J. Environ. Res. Public Health 2019, 16, 3621. [Google Scholar] [CrossRef] [PubMed]
- Streiner, D.L. Figuring Out Factors: The Use and Misuse of Factor Analysis. Can. J. Psychiatry 1994, 39, 135–140. [Google Scholar] [CrossRef] [PubMed]
- Ryff, C.D.; Keyes, C.L.M. The structure of psychological well-being revisited. J. Pers. Soc. Psychol. 1995, 69, 719–727. [Google Scholar] [CrossRef] [PubMed]
- Hair, J.F.; Anderson, R.E.; Tatham, R.L.; Black, W.C. Multivariate Data Analysis, 6th ed.; Prentice Hall: Hoboken, NJ, USA, 2006. [Google Scholar]
- Alreck, P.; Settle, R.B. Gender effects on Internet, catalogue and store shopping. J. Database Mark. 2002, 9, 150–162. [Google Scholar] [CrossRef]
- Ng, W.-S.; Acker, A. Understanding Urban Travel Behaviour by Gender for Efficient and Equitable Transport Policies. Int. Transport. Forum 2018, 1, 1–19. [Google Scholar] [CrossRef]
- Coluccia, E.; Louse, G. Gender differences in spatial orientation: A review. J. Environ. Psychol. 2004, 24, 329–340. [Google Scholar] [CrossRef]
- Irschik, E.; Kail, E. Vienna: Progress towards a fair shared city. In Fair Shared Cities: The Impact of Gender Planning; Roberts, S.d.M., Ed.; Ashgate: London, UK, 2013; pp. 193–229. [Google Scholar]
- Newman, M.C.; Kaszniak, A.W. Spatial Memory and Aging: Performance on a Human Analog of the Morris Water Maze. Aging Neuropsychol. Cogn. 2000, 7, 86–93. [Google Scholar] [CrossRef]
- Bates, S.L.; Wolbers, T. How cognitive aging affects multisensory integration of navigational cues. Neurobiol. Aging 2014, 35, 2761–2769. [Google Scholar] [CrossRef] [PubMed]
- Dholakia, R.R. Going shopping: Key determinants of shopping behaviors and motivations. Int. J. Retail. Distrib. Manag. 1999, 27, 154–165. [Google Scholar] [CrossRef]
- Ibraeva, A.; Correia, G.H.D.A.; Silva, C.; Antunes, A.P. Transit-oriented development: A review of research achievements and challenges. Transp. Res. Part A Policy Pract. 2020, 132, 110–130. [Google Scholar] [CrossRef]
- De Oña, J.; de Oña, R.; Eboli, L.; Mazzulla, G. Heterogeneity in Perceptions of Service Quality among Groups of Railway Passengers. Int. J. Sustain. Transp. 2015, 9, 612–626. [Google Scholar] [CrossRef]
- Harms, L.; Bertolini, L.; Brömmelstroet, M.T. Spatial and social variations in cycling patterns in a mature cycling country exploring differences and trends. J. Transp. Health 2014, 1, 232–242. [Google Scholar] [CrossRef]
- Falch, T.; Massih, S.S. The Effect of Education on Cognitive Ability. Econ. Inq. 2010, 49, 838–856. [Google Scholar] [CrossRef] [PubMed]
- Machado-León, J.L.; de Oña, R.; Baouni, T.; de Oña, J. Railway transit services in Algiers: Priority improvement actions based on users perceptions. Transp. Policy 2017, 53, 175–185. [Google Scholar] [CrossRef]


| Dimension | Definition | Indicators |
|---|---|---|
| Wayfinding | The spatial configuration of the station area and walking experience. | Entrances and exits of the station building |
| Visual connection | ||
| Pedestrian experience | ||
| Traffic conditions (vehicles) | ||
| Crowdedness/ liveliness (pedestrians) | ||
| Transfer | How smooth and easy a user could switch between modes, including options, distance, and amenities. | Multiple modes |
| Transfer distance | ||
| Ticket machine | ||
| Kiss and ride | ||
| Elevators and escalators |
| Dimension | Definition | Indicators |
|---|---|---|
| Shopping | The possibilities and attractiveness of shopping | Attractiveness of shops |
| Diversity of shops | ||
| Number of shops | ||
| Extended open hours | ||
| Distance between shops | ||
| Advertisements | ||
| Land use | Land use diversity | Different housing types |
| A mix of public functions (e.g., retail, education, institutional, sports, and recreation) | ||
| Diversity of jobs |
| Dimension | Definition | Indicators |
|---|---|---|
| Comfort | The presence, numbers, and maintenance of amenities, used by people spending longer time in the station area. | Phone charging station |
| Wi-Fi | ||
| Outdoor space to sit and linger | ||
| Accessibility facilities | ||
| Kids play zone | ||
| Noise level | ||
| Air quality | ||
| Trash bin | ||
| Food and drinks | ||
| Toilet facilities | ||
| Lockers | ||
| Shelter from wind, rain, and cold | ||
| Temperature and ventilation | ||
| Aesthetics | Architectural design, landmarks, and other landscape features perceived by users | Quality of station squares |
| Landmarks and architecture | ||
| Streetscape (facade continuity, human scale design, etc.) | ||
| Public art | ||
| Quality of furnishing and decoration | ||
| Safety | The environmental supervision, such as lighting, presence of police and staffs, as well as maintenance of spaces | Well-maintained amenities |
| Good lighting | ||
| Priority for pedestrians over cars | ||
| No dead-ends | ||
| Help in an emergency (existence of police and staff) | ||
| Presence of other people |
| Characteristics | Sample Size | % |
|---|---|---|
| Valid response | 452 | 100 |
| Visiting purpose | ||
| Living at the station area | 178 | 39.4% |
| Working at the station area | 33 | 7.3% |
| Transfer | 241 | 53.3% |
| Visiting frequency | ||
| At least once per day | 32 | 7.1% |
| At least once per week | 150 | 33.4% |
| At least once per month | 203 | 44.9% |
| At least once per year | 67 | 14.8% |
| Gender | ||
| Female | 211 | 46.7% |
| Male | 241 | 53.3% |
| Ethnicity | ||
| Non-western foreigners | 26 | 5.8% |
| Western foreigners | 70 | 15.5% |
| Natives | 356 | 78.8% |
| Age (median age: 57 years old) | ||
| Youth: Under 35 | 41 | 9.1% |
| Adult: 36–65 | 259 | 57.3% |
| Senior: Above 66 | 152 | 33.6% |
| Income per month | ||
| Low (Under 1750) | 129 | 28.5% |
| Medium (1751–4000) | 209 | 46.2% |
| High (Above 4001) | 114 | 25.2% |
| Education | ||
| Low (Elementary, VMBO 1) | 11 | 2.4% |
| Medium (HAVO 2, VWO 3) | 67 | 14.8% |
| High (MBO 4, HBO 5, WO 6) | 374 | 82.8% |
| Household composition | ||
| Single | 204 | 45.1% |
| Adults with child(ren) | 170 | 37.6% |
| Adults without child(ren) | 78 | 17.3% |
| Dimension | Factors | Code | Indicators | Factor Loading | Cronbach’s Alpha |
|---|---|---|---|---|---|
| (Total variance explained: 51.153%; KMO: 0.781; Bartlett’s Test of Sphericity: Approx. Chi-Square: 5827.957, df: 1128) | |||||
| Wayfinding | Wayfinding | W1 | Visual connection | 0.692 | 0.621 |
| W2 | Traffic conditions (vehicles) | 0.560 | |||
| W3 | Crowdedness/ liveliness (pedestrians) | 0.560 | |||
| W4 | Distance between modes | 0.573 | |||
| W5 | Priority for pedestrians over cars | 0.465 | |||
| Transfer | Transfer | T1 | Transfer options | 0.588 | 0.568 |
| T2 | Kiss and ride | 0.490 | |||
| T3 | Transfer time | 0.481 | |||
| T4 | Ticket machine | 0.419 | |||
| T5 | Bike facilities | 0.416 | |||
| Shopping | Shopping | S1 | Diversity of shops | 0.858 | 0.868 |
| S2 | Attractiveness of shops | 0.843 | |||
| S3 | Number of stores | 0.841 | |||
| S4 | Extended opening hours | 0.808 | |||
| S5 | Distance between stores | 0.681 | |||
| S6 | Ads | 0.449 | |||
| Aesthetics | Art and decoration | D1 | Public arts | 0.588 | 0.551 |
| D2 | Quality of furnishings and decoration | 0.531 | |||
| D3 | Air quality and noise level | 0.493 | |||
| Land use and architecture | L1 | Quality of station squares | 0.821 | 0.790 | |
| L2 | Streetscape | 0.805 | |||
| L3 | Architecture and landmarks | 0.747 | |||
| Land use | L4 | Different housing types | 0.552 | ||
| L5 | Diversity of jobs | 0.601 | |||
| L6 | A mix of public functions (e.g., retail, education, institutional, sports, and recreation) | 0.604 | |||
| Comfort | Advanced services | A1 | Wi-Fi | 0.623 | 0.626 |
| A2 | Phone charging station | 0.619 | |||
| A3 | Lockers | 0.562 | |||
| A4 | Outdoor space to sit and linger | 0.500 | |||
| Basic needs and safety | B1 | Good lighting | 0.718 | 0.649 | |
| B2 | Well-maintained amenities | 0.528 | |||
| B3 | Shelter from wind, rain and cold | 0.518 | |||
| B4 | Trash bin | 0.515 | |||
| Safety | B5 | Existence of other people | 0.490 | ||
| B6 | No dead-ends | 0.466 | |||
| B7 | Help in an emergency (existence of police and staff) | 0.416 | |||
| B8 | Elevators and escalators | 0.392 | |||
| B9 | Toilet facilities | 0.384 | |||
| B10 | Food and drinks | 0.320 | |||
| CMIN | df | CMIN/df | RMSEA | GFI | AGFI | IFI | AIC |
|---|---|---|---|---|---|---|---|
| 130.629 | 52 | 2.512 | 0.058 | 0.957 | 0.936 | 0.913 | 182.629 |
| Wayfinding | Transfer | Shopping | Advanced Services | Basic Needs and Safety | Art and Decoration | |||||||
|---|---|---|---|---|---|---|---|---|---|---|---|---|
| Intercept | −0.124 | 0.032 | −0.011 | 0.133 | 0.071 | 0.091 | ||||||
| Estimates | S.E. | Estimates | S.E. | Estimates | S.E. | Estimates | S.E. | Estimates | S.E. | Estimates | S.E. | |
| Female | 0.372 *** | 0.092 | 0.310 *** | 0.092 | 0.222 * | −0.278 ** | 0.093 | |||||
| Age—young | 0.433 ** | 0.162 | −0.500 ** | 0.172 | −0.522 ** | 0.174 | ||||||
| Age—adult | −0.233 * | 0.100 | −0.223 * | 0.101 | ||||||||
| Education—high level | −0.339 ** | 0.129 | 0.265 * | 0.131 | ||||||||
| Purpose—living | −0.251 ** | 0.094 | ||||||||||
| Purpose—working | −0.438 * | 0.180 | −0.392 * | 0.178 | ||||||||
Publisher’s Note: MDPI stays neutral with regard to jurisdictional claims in published maps and institutional affiliations. |
© 2021 by the authors. Licensee MDPI, Basel, Switzerland. This article is an open access article distributed under the terms and conditions of the Creative Commons Attribution (CC BY) license (https://creativecommons.org/licenses/by/4.0/).
Share and Cite
Du, J.; Druta, O.; van den Berg, P.; van Wesemael, P.J.V. How Do Socio-Demographic Characteristics Affect Users’ Perception of Place Quality at Station Areas? Evidence from Amsterdam, The Netherlands. Urban Sci. 2021, 5, 80. https://doi.org/10.3390/urbansci5040080
Du J, Druta O, van den Berg P, van Wesemael PJV. How Do Socio-Demographic Characteristics Affect Users’ Perception of Place Quality at Station Areas? Evidence from Amsterdam, The Netherlands. Urban Science. 2021; 5(4):80. https://doi.org/10.3390/urbansci5040080
Chicago/Turabian StyleDu, Jinglun, Oana Druta, Pauline van den Berg, and Pieter J. V. van Wesemael. 2021. "How Do Socio-Demographic Characteristics Affect Users’ Perception of Place Quality at Station Areas? Evidence from Amsterdam, The Netherlands" Urban Science 5, no. 4: 80. https://doi.org/10.3390/urbansci5040080
APA StyleDu, J., Druta, O., van den Berg, P., & van Wesemael, P. J. V. (2021). How Do Socio-Demographic Characteristics Affect Users’ Perception of Place Quality at Station Areas? Evidence from Amsterdam, The Netherlands. Urban Science, 5(4), 80. https://doi.org/10.3390/urbansci5040080