1. Introduction
With an area of only 116.6 square miles, Dhaka Metropolitan Area (DMA) has a population of approximately 12.6 million people which makes Dhaka as one of the most densely populated cities of the world [
1]. A few gender-based studies tried to explore the travel/activity situation of Dhaka from spatial planning perspective [
2,
3,
4,
5,
6,
7,
8,
9] and very few of them focused on spatial/locational distribution of households. However, as per our knowledge this is the first study analyzing the existing travel behavior of the residents of Dhaka based on geographic distribution of household activities through calculating traveler’s activity space. A qualitative research conducted by Islam (1995) aimed to understand the activity patterns and gender relations of middle-income working women in Dhaka in private and public space [
5] which found that gender division of labor exists and women’s gender roles in the predominantly patriarchal society create fixity constraints for them which eventually limit their public activity space. This study was one of very few and was almost the first of its kind to explore activity and social pattern of women, gender relations and temporal changes in the activity spaces in Dhaka. Another gender-based study related with spatial planning conducted by Gomes (2014, 2015) showed that upgrading women’s socio-economic status expands their activity space and plays an important role in domestic spatial organization of urban houses in Dhaka [
10,
11]. In Uddin, Burton, &Khan (2018) specific environmental barriers were found to reduce female physical activity space [
8]. None of the previous Dhaka studies assessed activity space variation of travelers with respect to their individual and household characteristics; and attitudes/perceptions and whether they can access essential service facilities within their travel/activity area. In this context, it was important to establish a relationship between accessibility to various urban opportunities with travel and spatial behavior and to depict the variability pattern in the activity spaces of travelers to predict the transport and travel needs of people as accessibility to necessary urban facilities plays important role in shaping travel behavior and activity pattern. In addition, it was important to explore the relationship pattern between activity space and land use, socio-economic, travel characteristics.
A pilot study [
12] was undertaken by Sharmeen & Houston (2019) in Dhaka before this full study. The pilot study results suggested the value of collecting more trip-related information in the full survey (see
Supplementary Materials) within a travel diary of the respondents; therefore, additional travel characteristics (travel duration, distance, and cost of each trip) were accommodated in this full survey questionnaire. Sample size and data collection time span (number of days in travel log) were expanded in this full study. Different sets of indicators were evaluated in this paper. A thorough literature review was conducted to identify most suitable models, sets of indicators, and measurement techniques. Based on lessons learned from the Dhaka pilot study, the expanded set of objectives for this full study include: (1) conduct descriptive analysis of travel-activity patterns in two study sub-areas (Dhanmondi and Mirpur) and some combined descriptive analysis by weekdays and weekends; (2) analyze the relationship between travel-activity patterns with built form, socio-economic, travel, and attitudinal characteristics; (3) establish a relationship between accessibility to various urban opportunities with travel and spatial behavior by sub-area; (4) examine intrapersonal and interpersonal variability of household’s activity spaces. Major purpose of the paper is to determine the factors related with travel and the activity space patterns of residents in one of the densest cities of the developing world and to test whether the size of the observed activity spaces is associated with land use, socio-demographics, travel characteristics, and perceptions. This study is expected to respond to a gap in the literature by examining the travel and activity patterns of travelers in Dhaka City to inform future land use and socio-economic planning. Significant factors that affect the spatial distribution of activity locations were explored here and results from the analysis are expected to be used to reflect on transportation policy guidelines. This article is structured as follows: the next section reviews research on activity space calculation methods and the factors determining their sizes and is followed by a description of the research setting, data sources and analytical methods. This is then followed by an outline of the results, using descriptive statistics, artificial neural networks, regression modeling, accessibility, and variability analysis. The paper ends with some discussions and proposals for future research.
2. Literature Review
Several techniques were employed in numerous studies to calculate activity space and to measure the impact of urban form, socio-demographics, and personal attitudes on human activity spaces and travel pattern. A general linear model (GLM) was used to determine weekly activity location in Järv, Ahas, & Witlox (2014) [
13]. To measure the residential density (land use mix/diversity analysis, road connectivity analysis), logistic regression was used [
14]. It was used to examine the influence of the proportion of different land uses on different variables measuring physical activity (walking etc.). Multi-level regression was used in Lee et al., 2016 [
15]. Regression model was used in Tana, Kwan, & Chai (2016) [
16] while hierarchical multiple regression and correlation analysis were used by Vich and Miralles-guasch (2017) [
17]. Guerra et al., 2018 used Logit and OLS models to identify the impact of population density, land use diversity, intersection density, accessibility measures, socio-economic factors, and car ownership status [
18]. Correlation analysis was conducted between age and gender with radius, shape, entropy of activity space [
19].
According to Handy, Boarnet, Ewing, & Killingsworth (2002); common measures of the built environment include land use type, density (e.g., residential density), land use mix and street connectivity (e.g., intersections per km
2) [
20]. While defining unique areas, some activity space-based studies used locational information (e.g., addresses, postal codes). The most common method to calculate activity space has been to establish a circular buffer around a respondent’s geocoded location at a given radius [
21,
22,
23,
24]. A shortcoming is that a circle may not accurately represent the spatial area. Circular buffers are likely to be inaccurate in areas with natural or built features with poor street connectivity. In such cases, areas within the buffer may be inaccessible by the respondent but still used to calculate built environment measures. This method includes all land up to a certain distance from the individual and fails to account for how the existing road network restricts the way an individual can traverse the landscape. The other buffer approaches (polygon-based and line-based network buffer) consider how the road network restricts travel, affecting what is accessible within travel. The polygon-based network buffer uses the end points of certain journeys in the network as the vertices with which to construct an irregular polygon to define the accessible neighborhood. The method presented in Oliver, Schuurman, & Hall (2007), defined the 1 km neighborhood by applying a 50 m buffer to a 950 m line-based network buffer, thus more closely approximating the roads accessible to the individual [
14].
Schönfelder (2006) defined variability as the deviation of behavior from the usual individual routines and habits which were developed over longer time periods. Inter-personal variability is the deviation of the individual behavior from the mean behavior of the respective sample or of the socio-economic group the traveler belongs to. The behavior of an individual or a household varies considerably if they are observed over periods of time which exceed a pre-defined timespan such as one day. This kind of variability is called intra-personal variability [
25].
Dieleman, Dijst, & Burghouwt (2002) in their study found that apart from urban form and design, personal attributes and circumstances have an impact on modal choice and distances travelled [
26]. High income people are more likely to own and use a private car than low-income households which is also a common scenario in Dhaka. Another finding of this study was that families with children use cars more often than one-person households. Trip purpose also found to influence travel mode and distance. Hägerstrand (1970), in his pioneering work titled “What about People in Regional Science?”, mentioned about fixity constraints focusing on the issue that despite being in spatial proximity to any given location, a person cannot travel to it due to some other mandatory works in the given period [
27]. This relates to the spatial-temporal aspect in an individual’s activity space. In recent times, Mei-Po Kwan (2003; 1998; 1999a; 1999b; 2000; 2002) demonstrated different space-time models to show disparities in gender accessibility within the same household [
28,
29,
30,
31,
32,
33].
3. Materials and Methods
Calculation of household activity space [
34,
35] and person-wise analysis by measuring individual activity space both were conducted in this paper. For calculating household activity space, locations were geocoded through creating two types of shapefiles in ArcGIS 10.7.1. Weekday shapefile per household (HH) defines one location shapefile containing all member’s travel location points from a specific HH for five consecutive weekdays (day 1–5: for Dhaka weekdays are from Sunday to Thursday). Weekend shapefile per HH defines another location shapefile containing all member’s travel location points from a specific HH for two consecutive weekend days (day 6–7: Friday and Saturday). Thus, each sample HH has at least three or more activity locations and visited at least two non-home places. With these, intrahousehold variability of activity spaces between weekday and weekend were assessed/examined following Dharmowijoyo, Susilo, & Karlstrom(2016); Dharmowijoyo, Susilo, & Karlström (2014) [
36,
37]. Regarding the construction of activity spaces for weekdays and weekend, all declared destinations for 5 weekdays and 2 weekend days were combined, respectively, but frequency of visiting each destination (for example: 5 times vs. 1 time per week) were not considered.
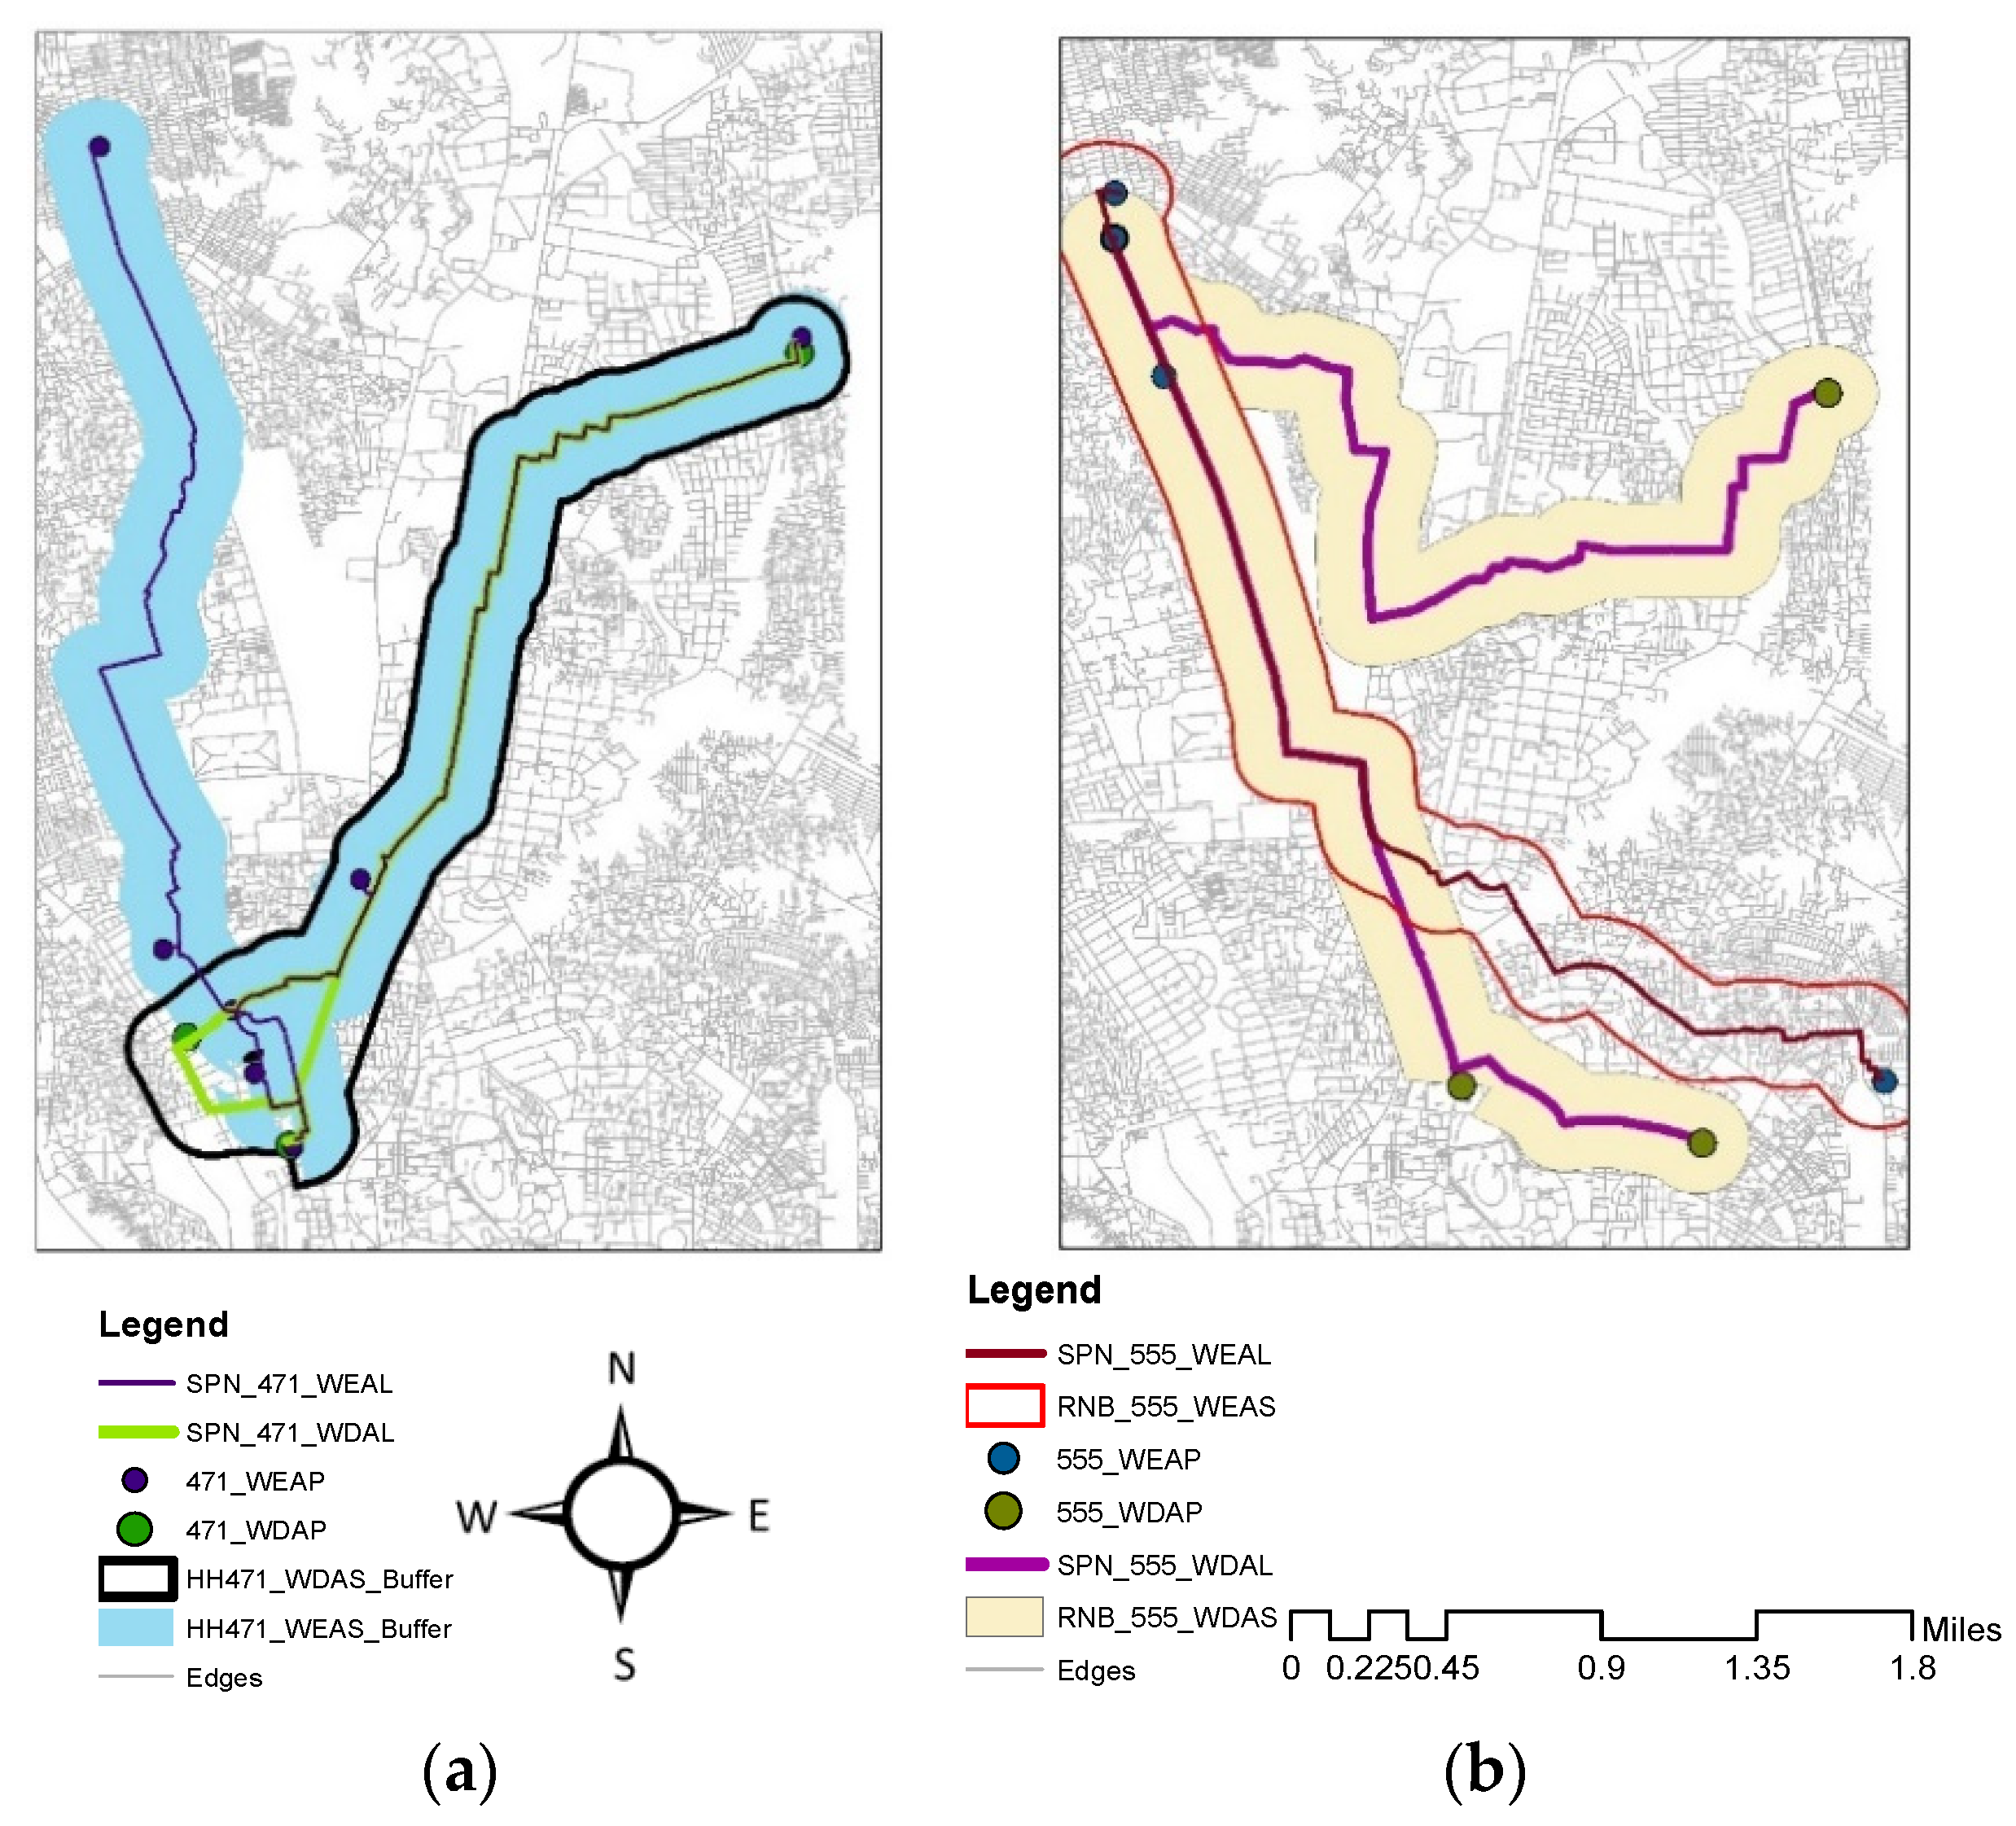
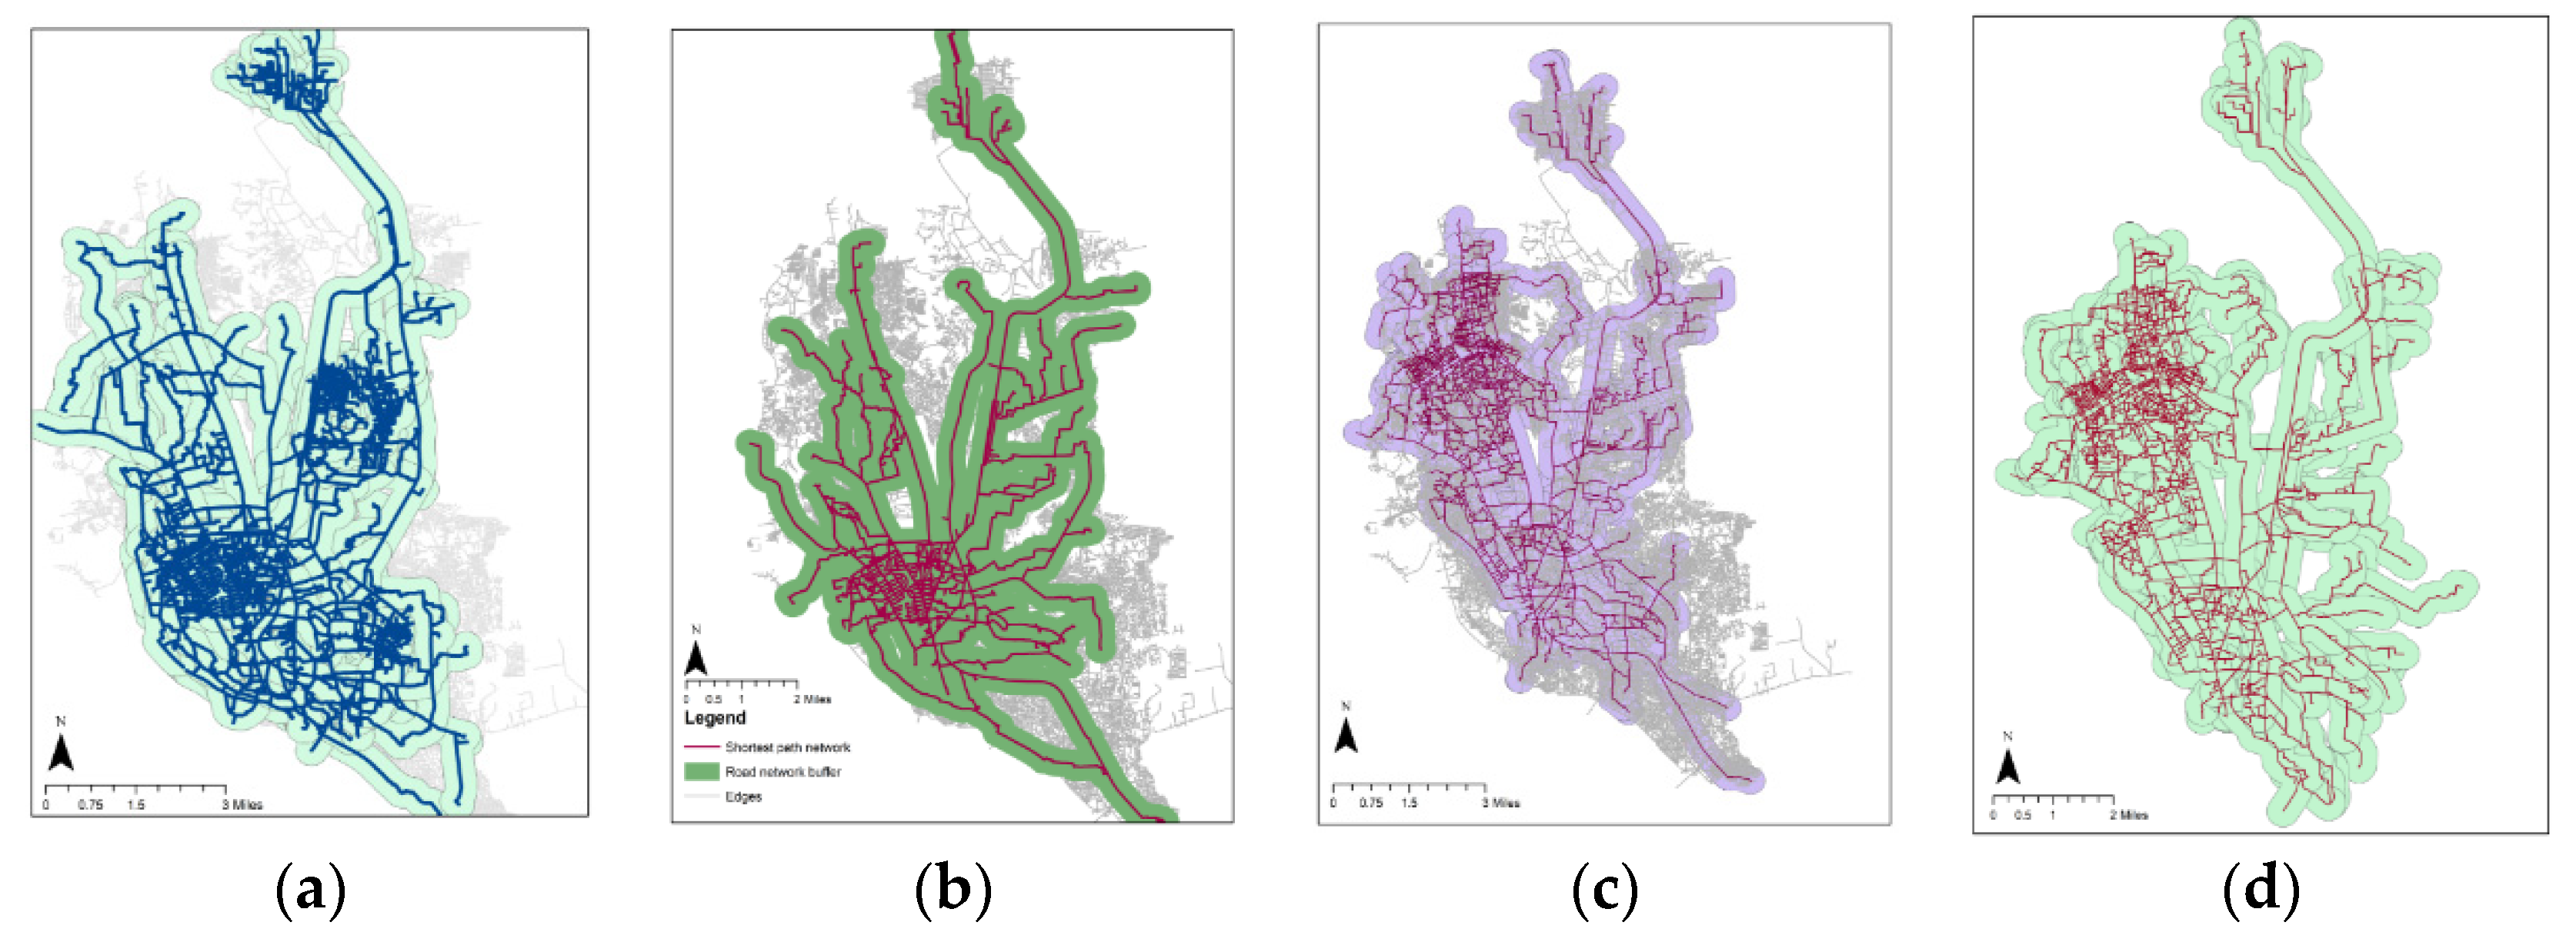
In this paper, to calculate activity length and area (activity space), ArcGIS-based activity space measure of shortest path network with Road network buffer measure was used as land use characteristics generally show greater associations with walking using line-based road network buffers rather than circular buffers. The selection of network or circular buffers has a considerable influence on the results of analysis. Careful consideration of the most appropriate buffer with which to calculate land use characteristics is important: 0.5 and 1 mile network buffer (residential network buffers covered by activity spaces stratified by sociodemographic characteristics); 1 km circular and line based road network buffer (RNB) (polygon-based network buffer, buffered line-based network buffer: 50 m buffer to a 950 m line-based network buffer resulting in a 1000 m buffer); 200 m buffer daily path area was used in the previous literature to calculate activity space [
14,
15,
38]. In this paper, a 0.25-mile (400 m) road network buffer was used considering a previous study finding [
39] on average trip length of walk mode (15 min) in Dhaka Metropolitan. Therefore, a 400 m buffer was chosen based on the average travel distance covered in a 5 min walk trip (assuming 5 min as a comfortable walking distance for all age groups of travelers), to ensure that parcels along the roads would be included but that most parcels located further from the road (e.g., behind those adjacent to the road) would not be selected. This method is based on the idea that land use encountered along roads is most important in characterizing a neighborhood in the way it is experienced by residents walking through it, and land not accessible to the pedestrian, even if physically nearby, is not part of their 400 m walking neighborhood. In this paper home-based activity space [
40] was calculated. ArcGIS network analyst was used to calculate the 400 m shortest path network-based buffer along the road network from each respondent’s postal code centroid (home location) to the destinations visited. Only the portion of parcels that were within 400 m of the roadway were included in calculations. This may represent a better approximation of potential destinations locally accessible to the individual respondent.
Descriptive analysis of the variables with comparison of activity spaces across the two study sub-areas were conducted as per the first objective. Second objective of the paper was to analyze the effects of residential location characteristics (urban form), socio-demographics, attitudes, and trip characteristics on the resulting average activity spaces. D variables (development density, intersection density, accessibility to various service facilities / destination accessibility) were selected to quantify land use characteristics following Park, Ewing, Sabouri, & Larsen (2019) [
41]. Most of the studies of travel and activity pattern employed different regression analysis due to the method’s ability of incorporating numerous variables [
13,
14,
15,
16,
17,
18,
21,
36,
42]. The regression equation can be presented in many ways, for example:
where
Yi refers to the dependent variable,
Xi (
X1….
Xn) refer to the independent variables,
β0 is a constant and
β1….
Βn are the coefficients to be estimated. Multiple linear regression was employed as the preliminary analytical method to investigate the potential impacts in this paper. We examined both weekday and weekend travel in separate models since previous research indicates weekday travel-activity patterns can significantly differ from weekend patterns [
13]. We examined individual and household differences on the size of activity spaces using regression model to assess the relative influence of household, socio-demographic, and accessibility factors on these measures of spatial behavior for both weekday and weekend trips. Our model assumption is that the dependent variable is a linear function of the independent variables and takes the following form:
where
f() is a linear function;
AS is an activity space measure (RNBAREA: road network buffer area and SPNLENGTH: shortest path network length),
HH is a vector of household factors including presence of children, household size, employed persons, presence of elderly persons, car ownership status and household vehicles, number of cars used;
SD is a vector of socio-demographic factors for age, gender, employment status, occupation, income, marital status, educational level, population density.
TP includes individual travel pattern indicated through use of carpool, work from home or not, public transit use, average number of trips, trip duration, cost, distance traveled.
ASF denotes accessibility to various service facilities (job, shop, school etc.) and
UF indicates land use characteristic (intersection density). Lastly,
PP indicates people’s perception derived from exploratory and confirmatory factor analysis of 36 Likert scale statements.
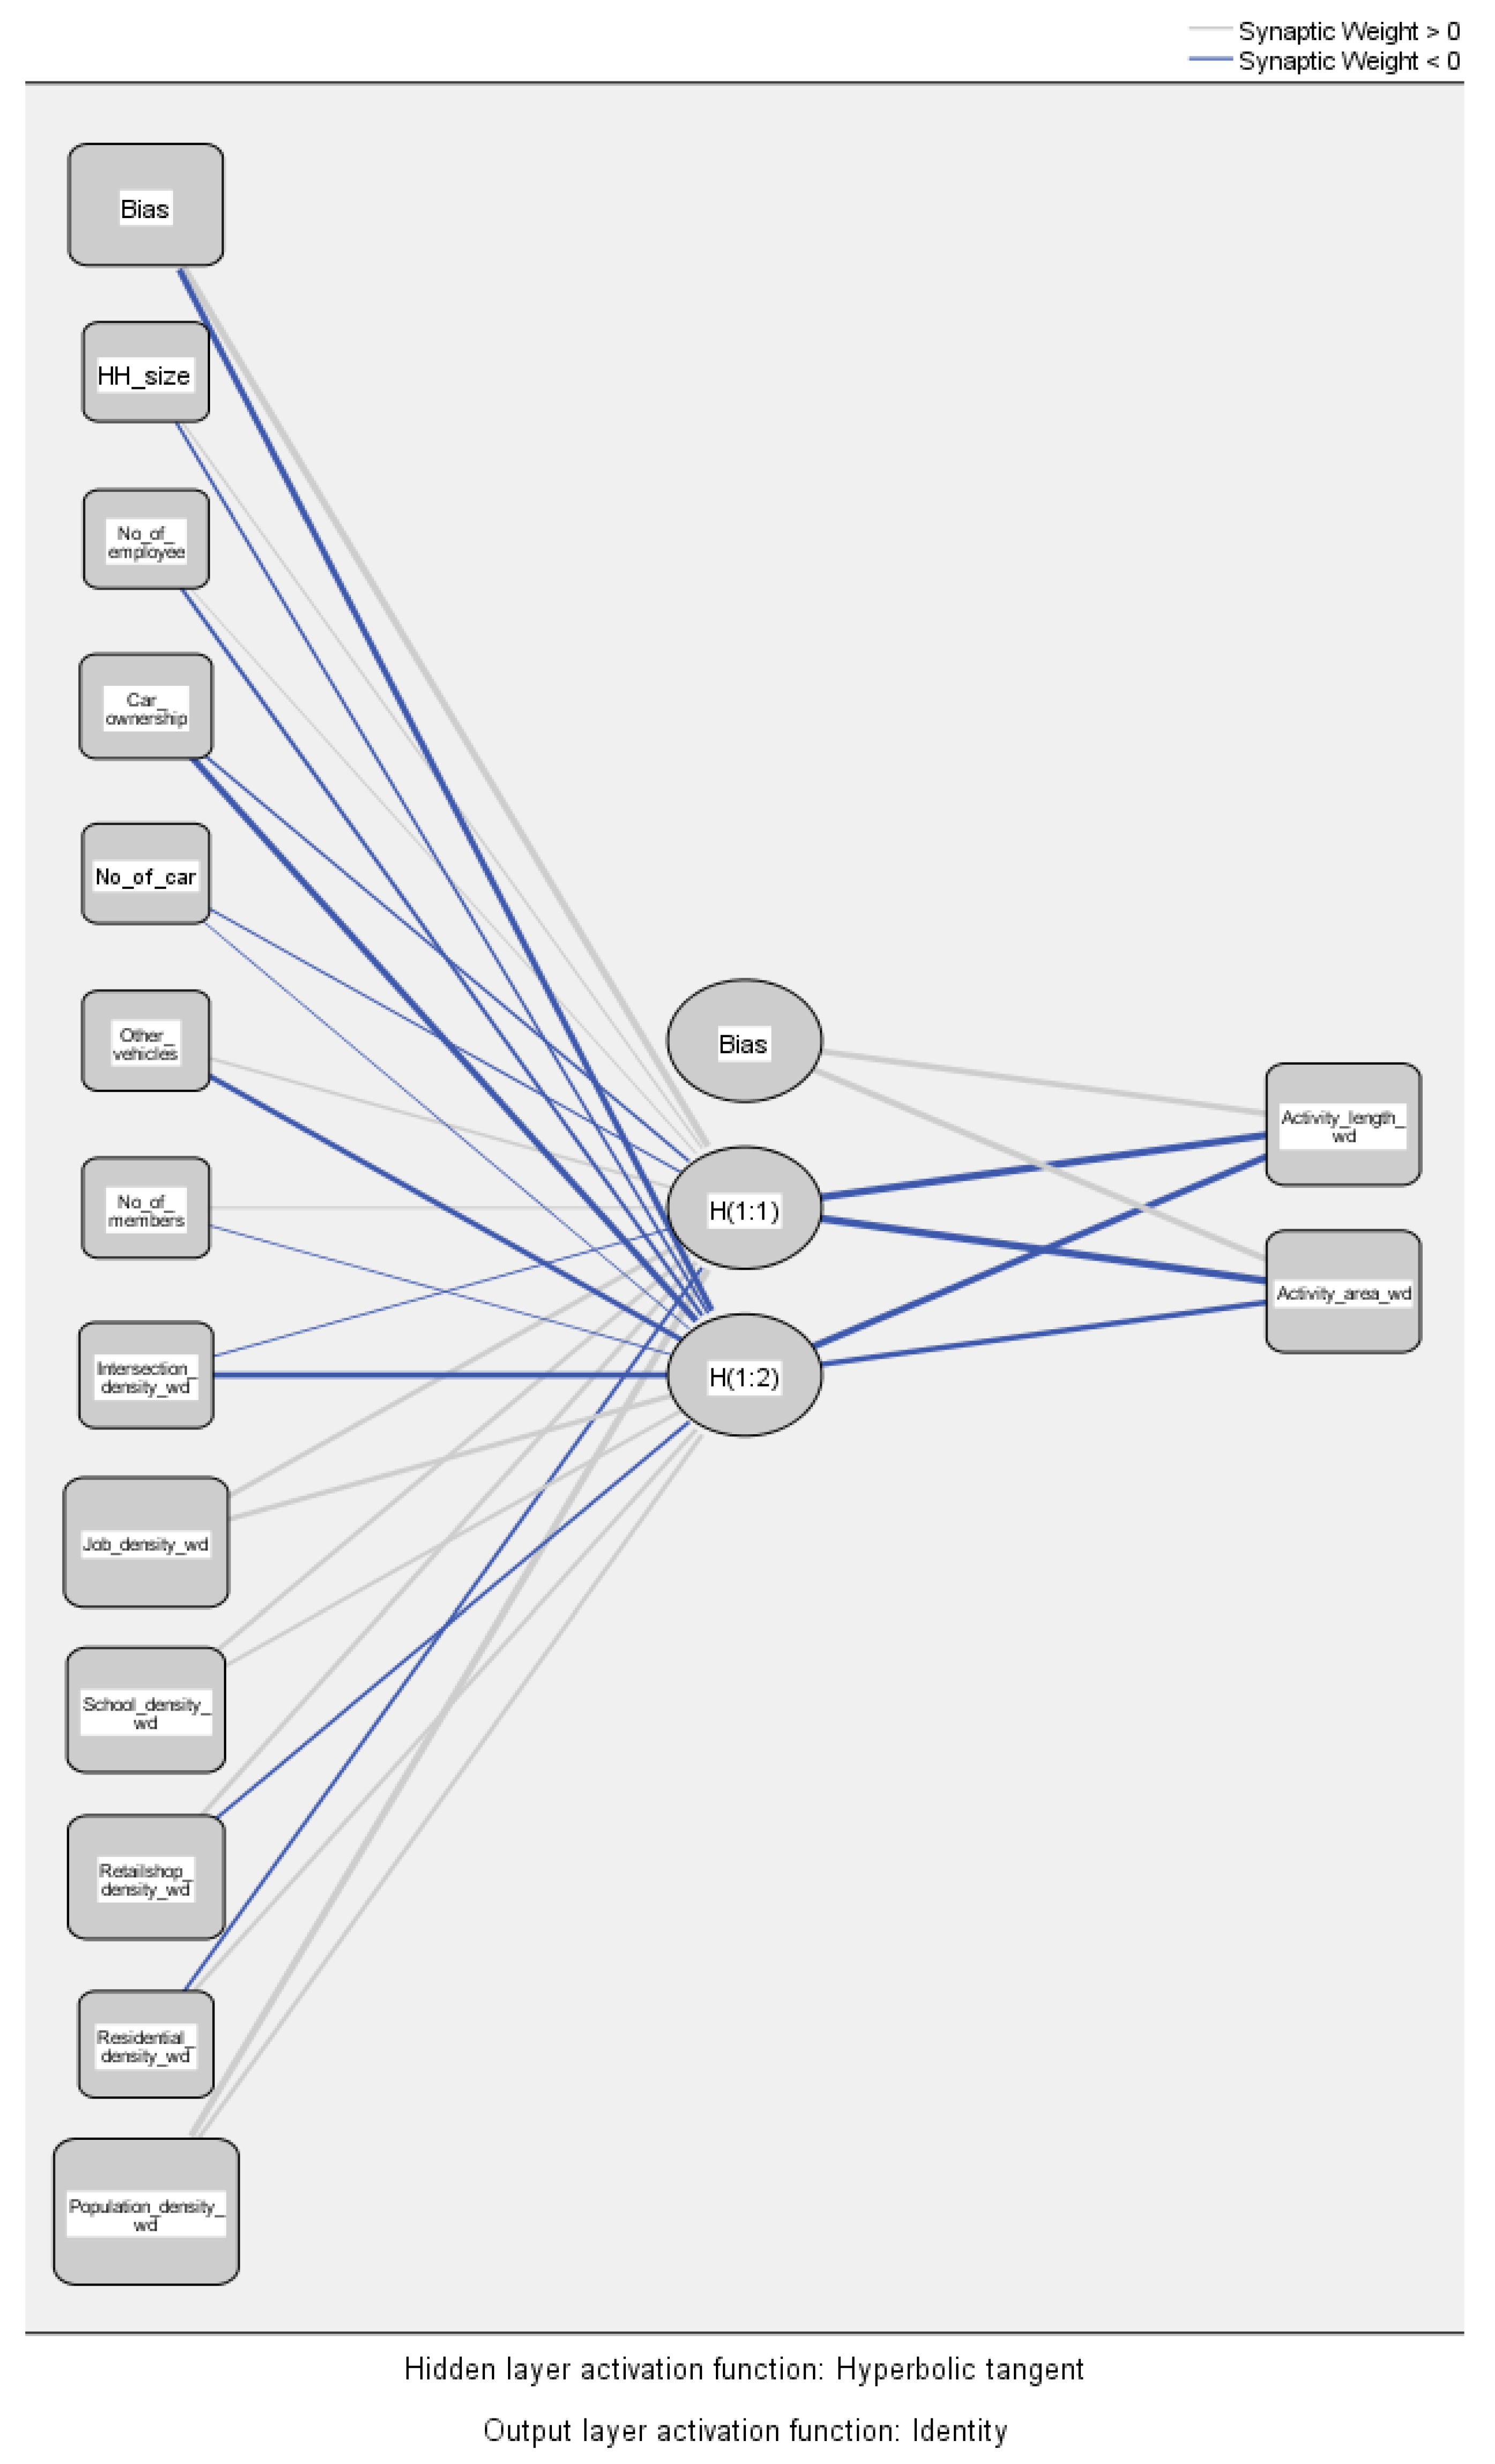
Another model we have used in this paper is the artificial neural networks (ANN) model which is an alternative to the multiple regression analysis to better explain the dependent variable (activity space). This analytical approach can overcome some limitations of the other model stated. It can handle nominal, ordinal, and scale variables either as dependent or independent and can handle nonlinearity relatively easily without knowing beforehand exactly which type of nonlinearity exists. This can solve highly nonlinear problems; the mixture of data types can be as input into the ANN, making no assumptions regarding the distribution of the data, and can use many variables or factors, some of which may be redundant [
43]. According to Maithani, Jain, & Arora (2007), ANN based modeling fits into the category of regression-type model, the aim of which is to establish a functional relationship between a set of spatial predictor variables that are used to predict the locations of the change in urban landscape [
44]. This is a non-parametric technique for quantifying and modeling complex travel behavior and patterns. Among the 7 types of artificial neural networks available for analyzing data, multilayer perceptron (MLP) was used in this paper. The MLP consists of three types of layers, i.e., input, hidden and output layers. The ANN is described by a sequence of numbers indicating the number of neurons in each layer.
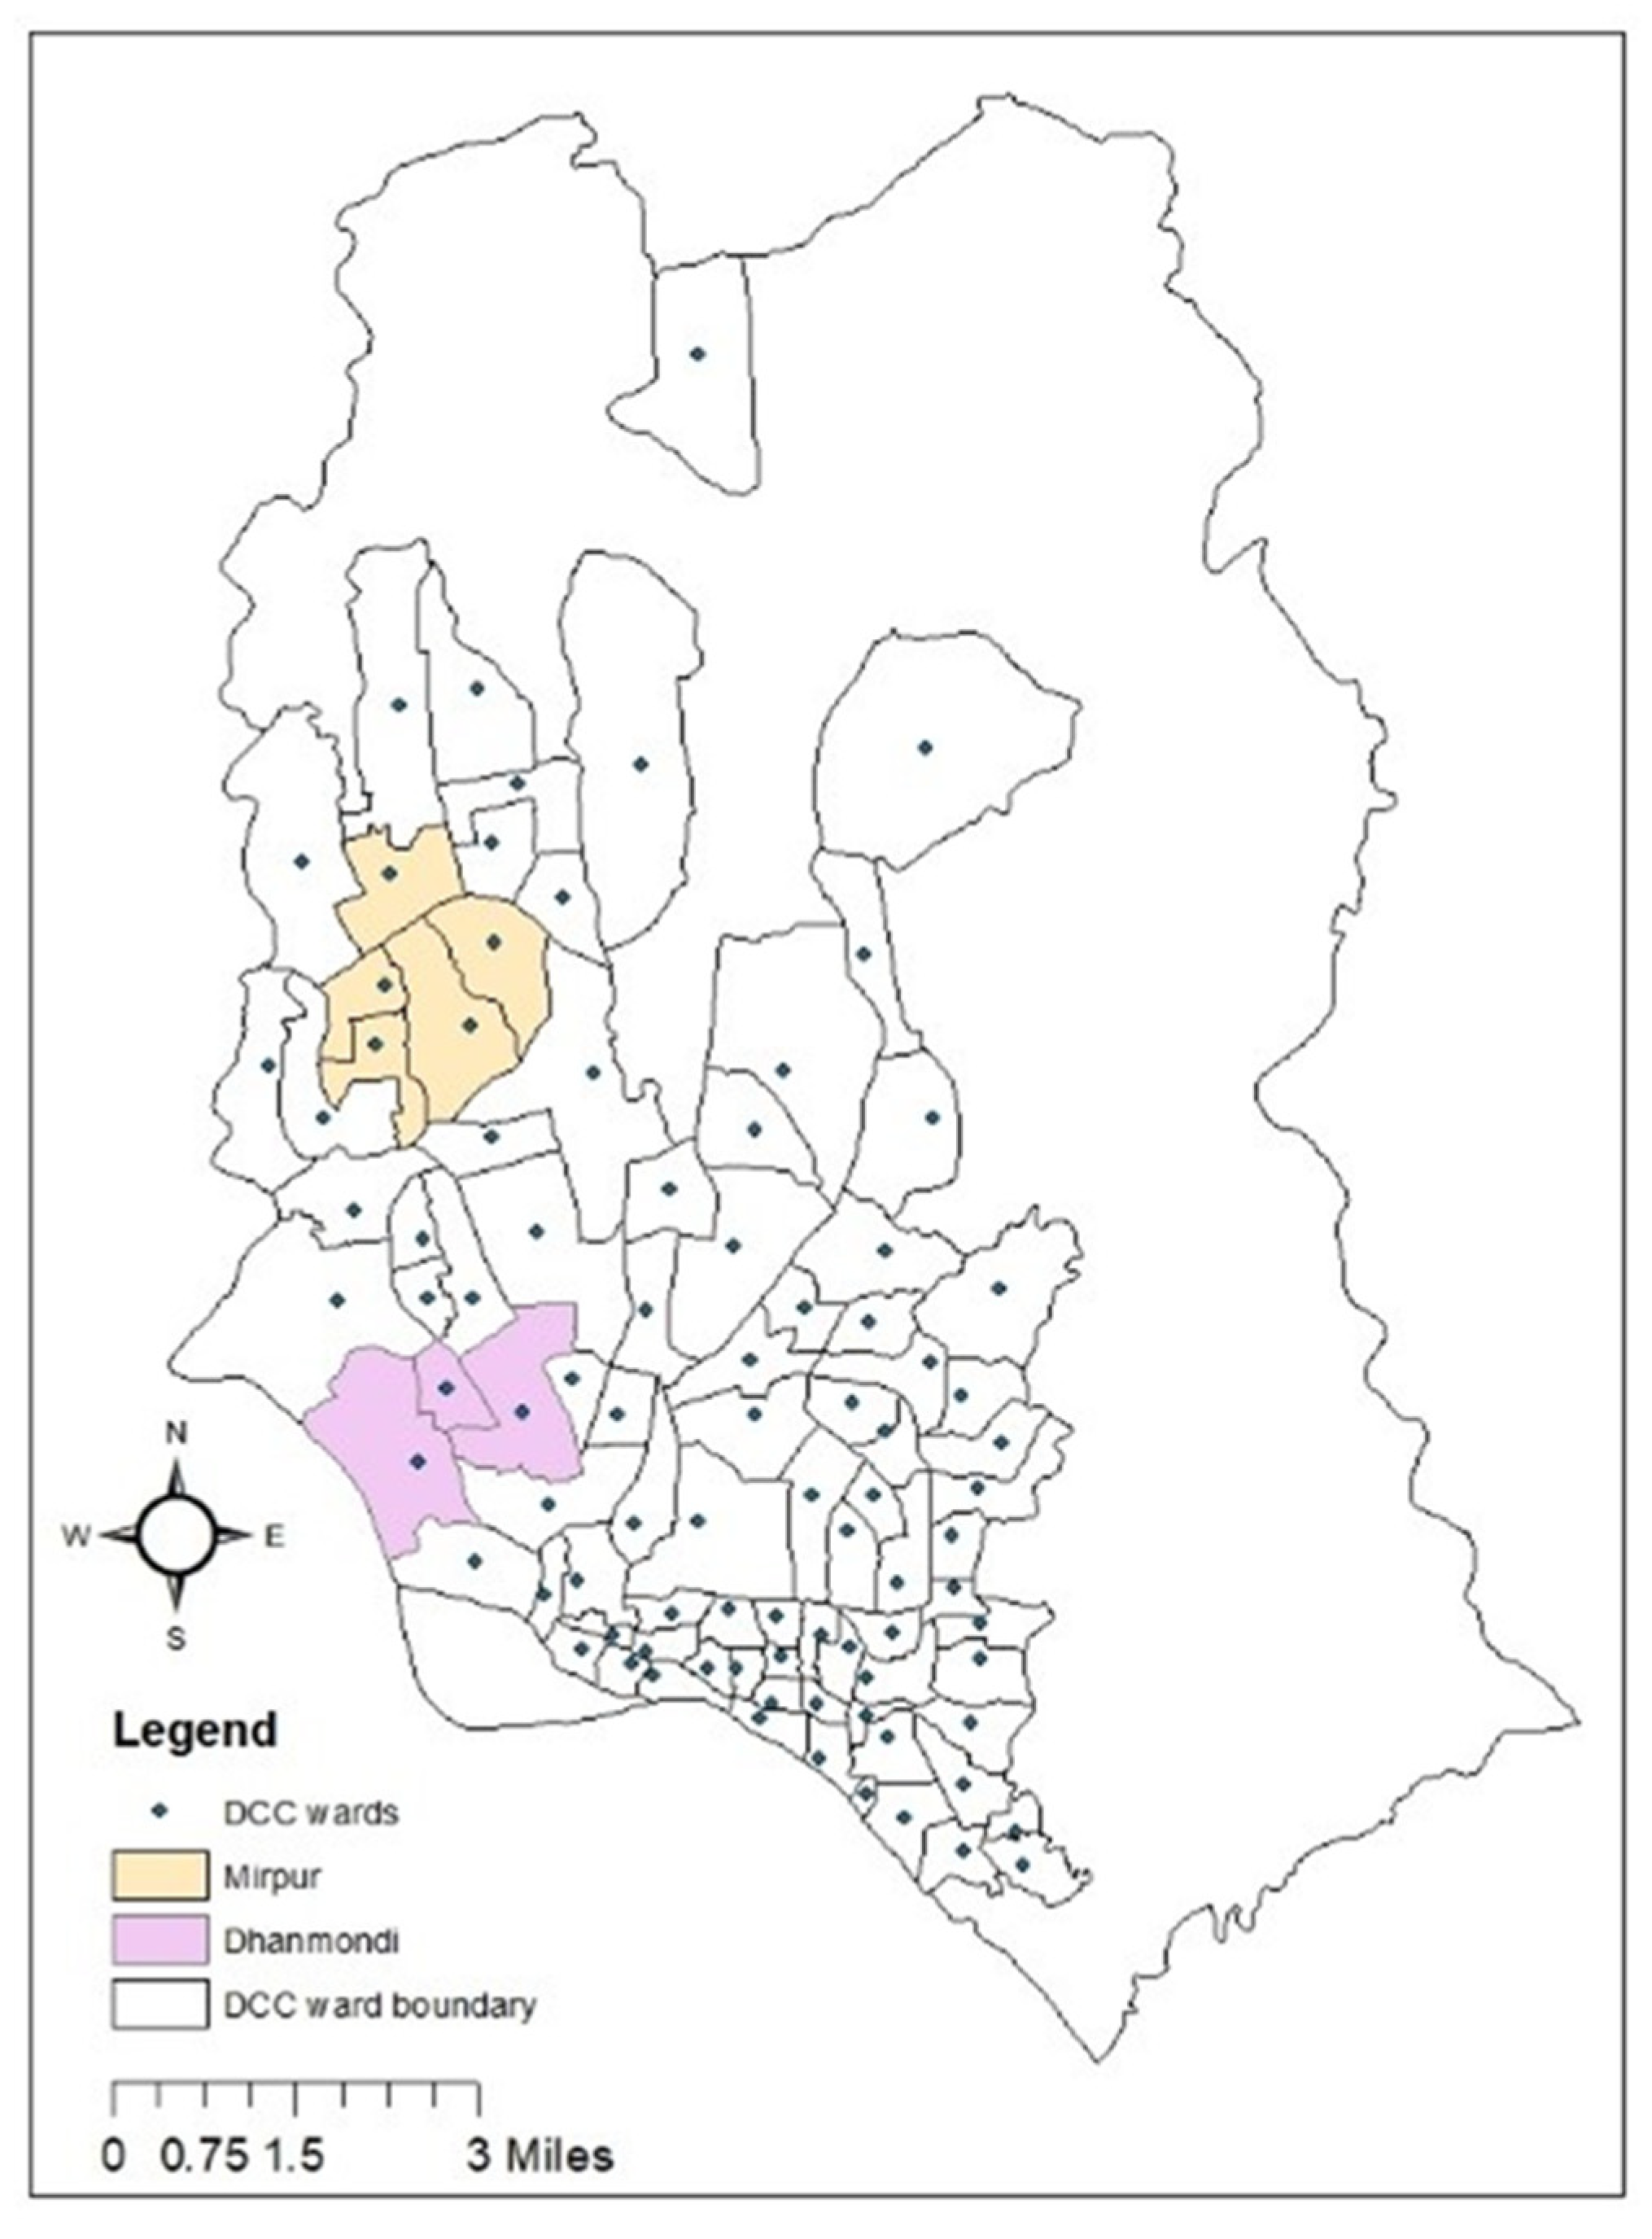
This study focused on two separate sub-areas: Mirpur from Dhaka North City Corporation and Dhanmondi from Dhaka South City Corporation based on their distinctive socio-economic and transportation characteristics. The majority of Mirpur is an unplanned residential area; building and road networks here follow no specific pattern and in most of the cases, residential buildings violate the setback and floor-area ratio (FAR) rules of city building regulations. On the other hand, in Dhanmondi, residential areas are mixed with commercial areas. Lots of mixed-use buildings are there. Planned residential area with grid iron pattern road network is the main feature in Dhanmondi. Profile of the two study sub-areas (description of the case city, why these neighborhoods were represented, how they are similar/different), survey design and primary data collection procedure (what households were contacted, sampling method, how was the survey carried out) were discussed in detail within our pilot data analysis-based paper [
12] which was also published in
Urban Science. Two study sub-areas in Dhaka are shown in
Figure 1.
Overall, 1000 households and 1790 travel logs from these households were taken as study sample. As numbers of surveyors were few so, the total survey period was quite long. Although the weeks surveyed vary across households, it was tried to ensure that the results could not be affected by characteristics of surveyed weeks, for instance dry/wet seasons. Accordingly, we attempted to select a normal week to survey each of the households. In the travel log (trip diary), provided to each member from the selected households aged greater than 10 years (if children under this age mostly visit with other adult family members), they were asked about the specific address of their destinations. Parcel data instead of precise xy coordinates for activity locations were used while geocoding in ArcGIS. Institutional Review Board (IRB) approval was needed before any primary data collection for research and IRB approval was taken from University of California, Irvine (UCI), whereas, as an exempt category of research, no such kind of approval is necessary in Bangladesh for primary data collection. Any non-household member who presented in the household during survey time did not fill out surveys. Confidentiality was maintained for collecting female travel logs. One precondition of IRB approval was to make sure people feel protected and can provide their answers especially in case of female respondents without a male controlling them. Mostly one family from each housing unit was surveyed in case of housing units with multiple families. Address list from the municipalities were obtained and every 10th household from that list was contacted. Study sample was stratified within the population as per sub areas. So, it can be said that stratified random sampling method was followed in case of recruiting households. A “normal week” with weekend was studied for each household as the distributions of activities over the weekends are also important. All members from the selected households who traveled outside during the respective selected survey weeks (keeping the home location as the origin of the first trip of each day) filled out the logs. Each trip along with all trip segments respondents take during each day of the week was considered. The route taken was not declared. While calculating activity area, the shortest path was assumed as the actual path taken. Multiple plausible routes were not tested which is a limitation of this method. In case of secondary databases, road network data and land use dataset sources were Local Government Engineering Department (LGED), Capital development authority RAJUK, 2016; and Dhaka Structure Plan 2016-35 [
45]. Previously for pilot data analysis [
12], the 2010 dataset was used but for this paper, the most recent available datasets were used.
5. Discussion
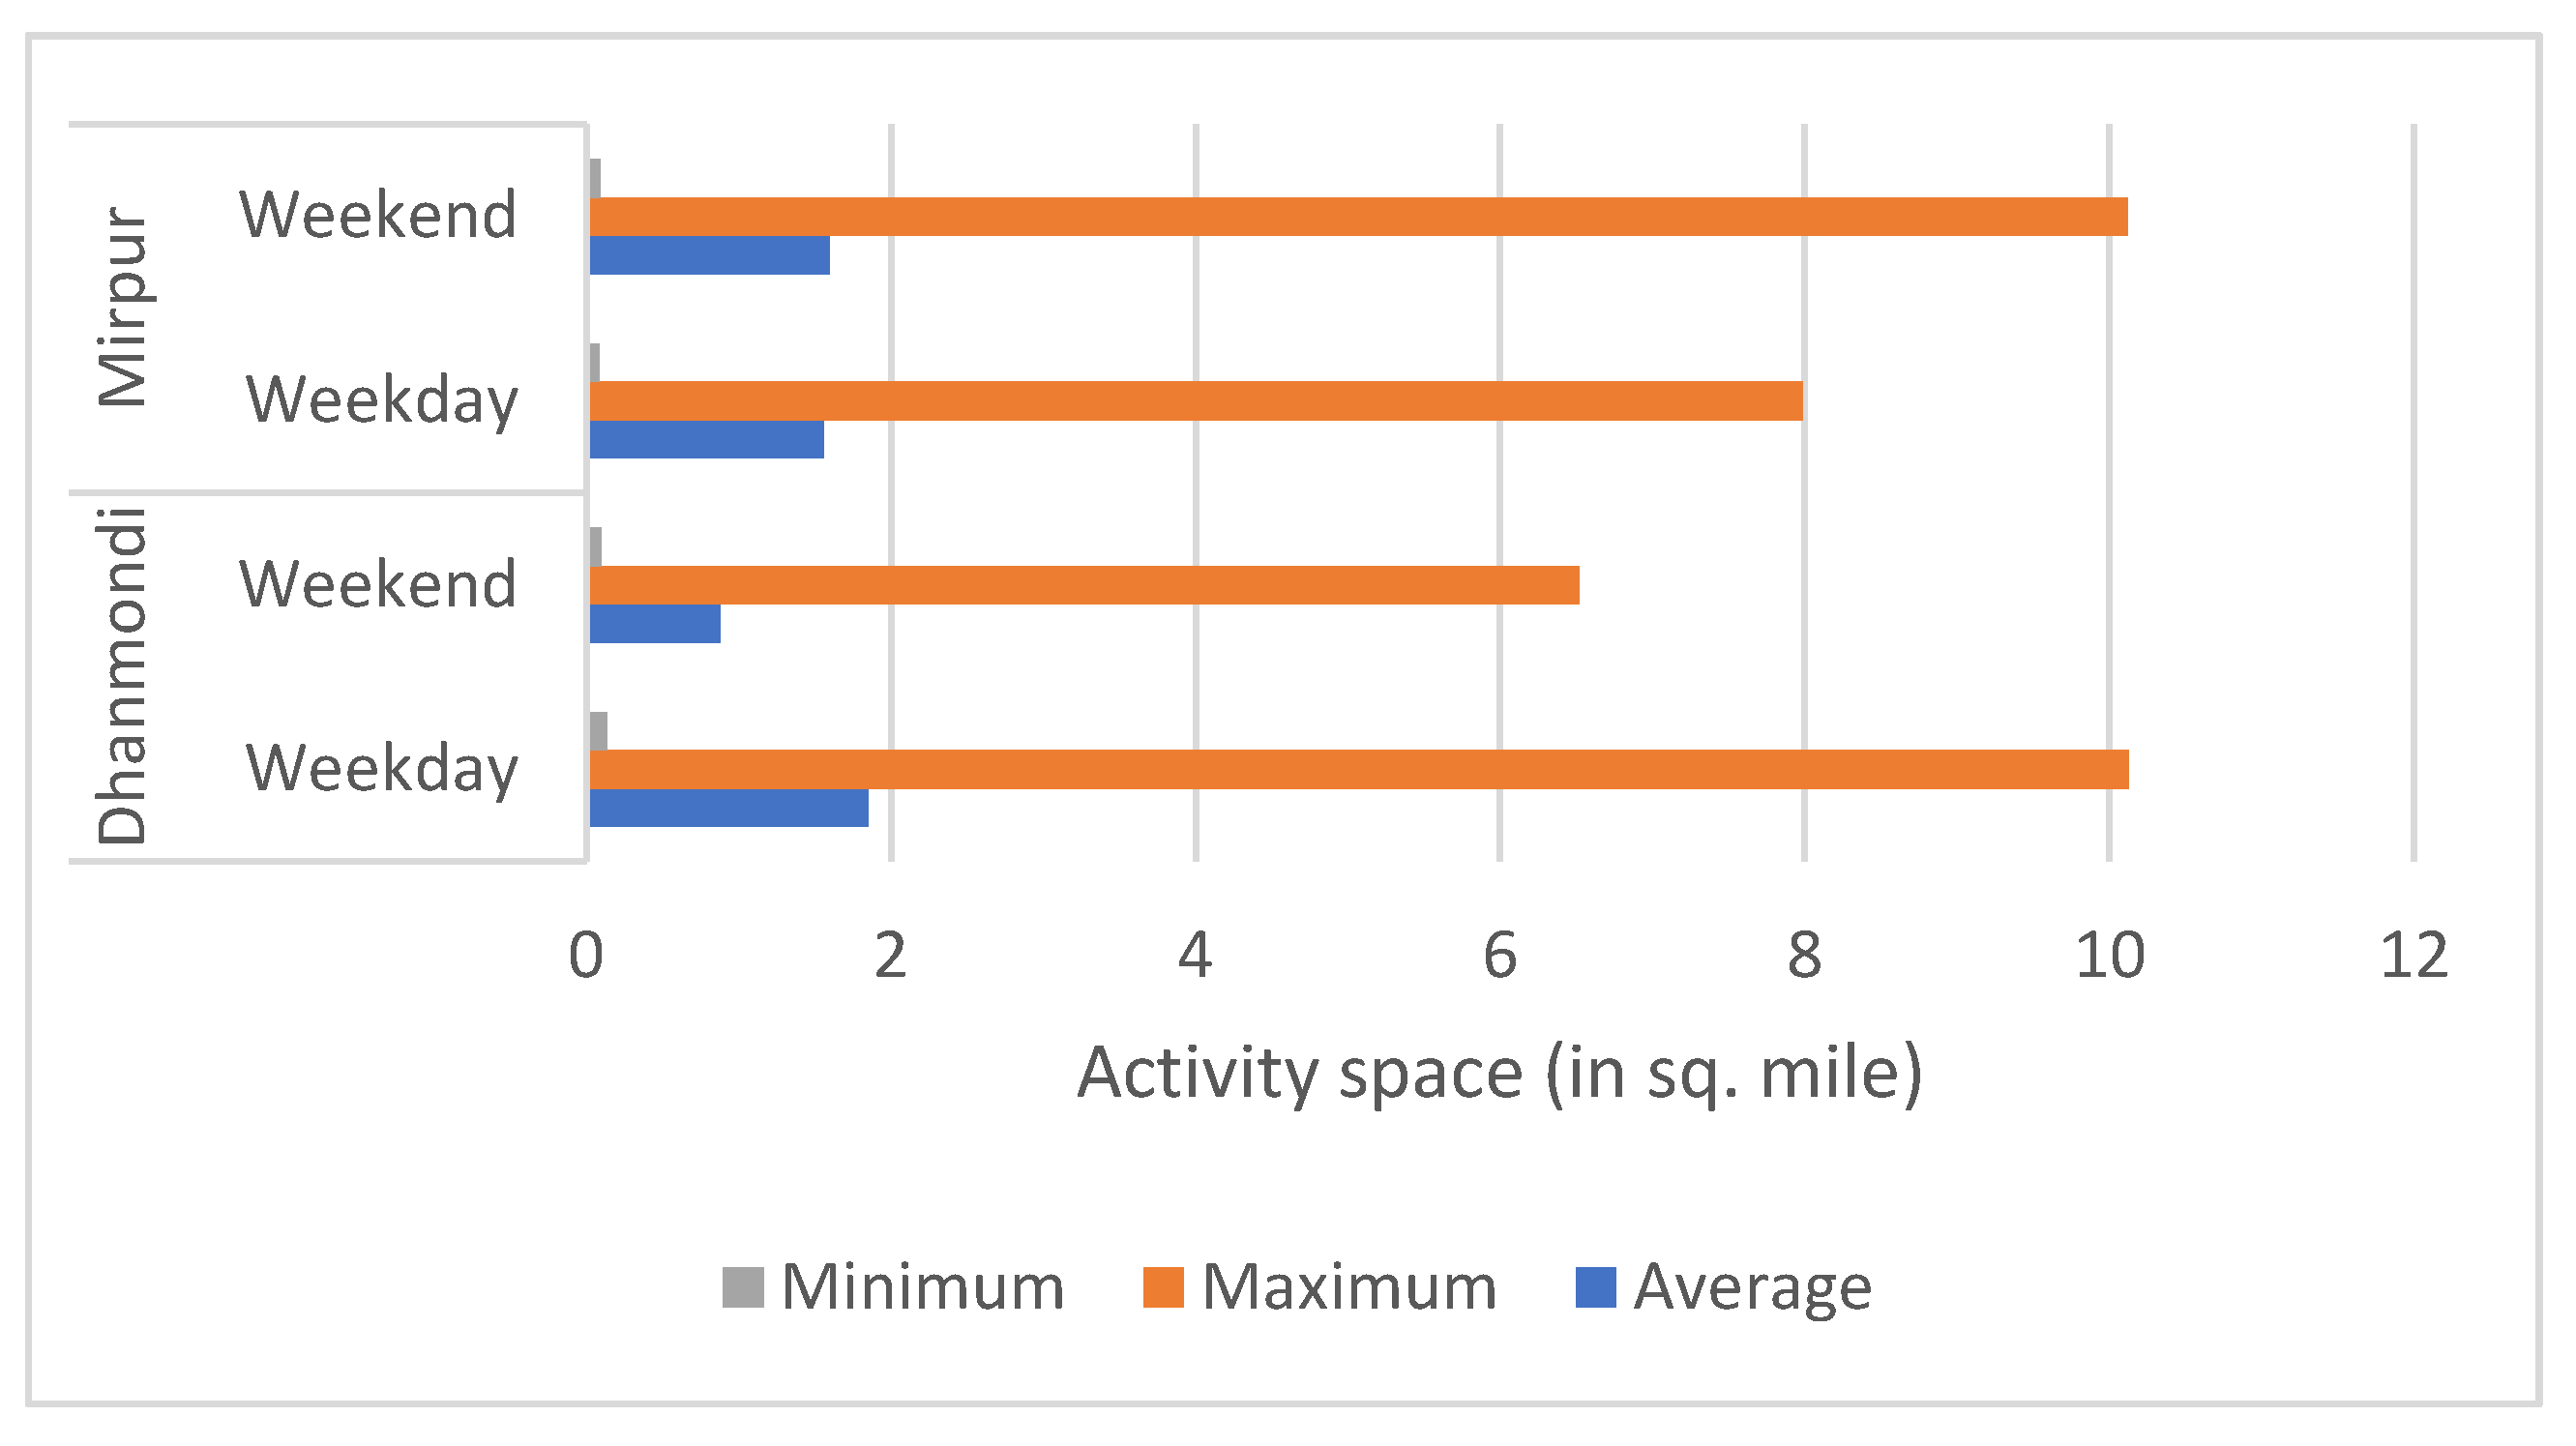
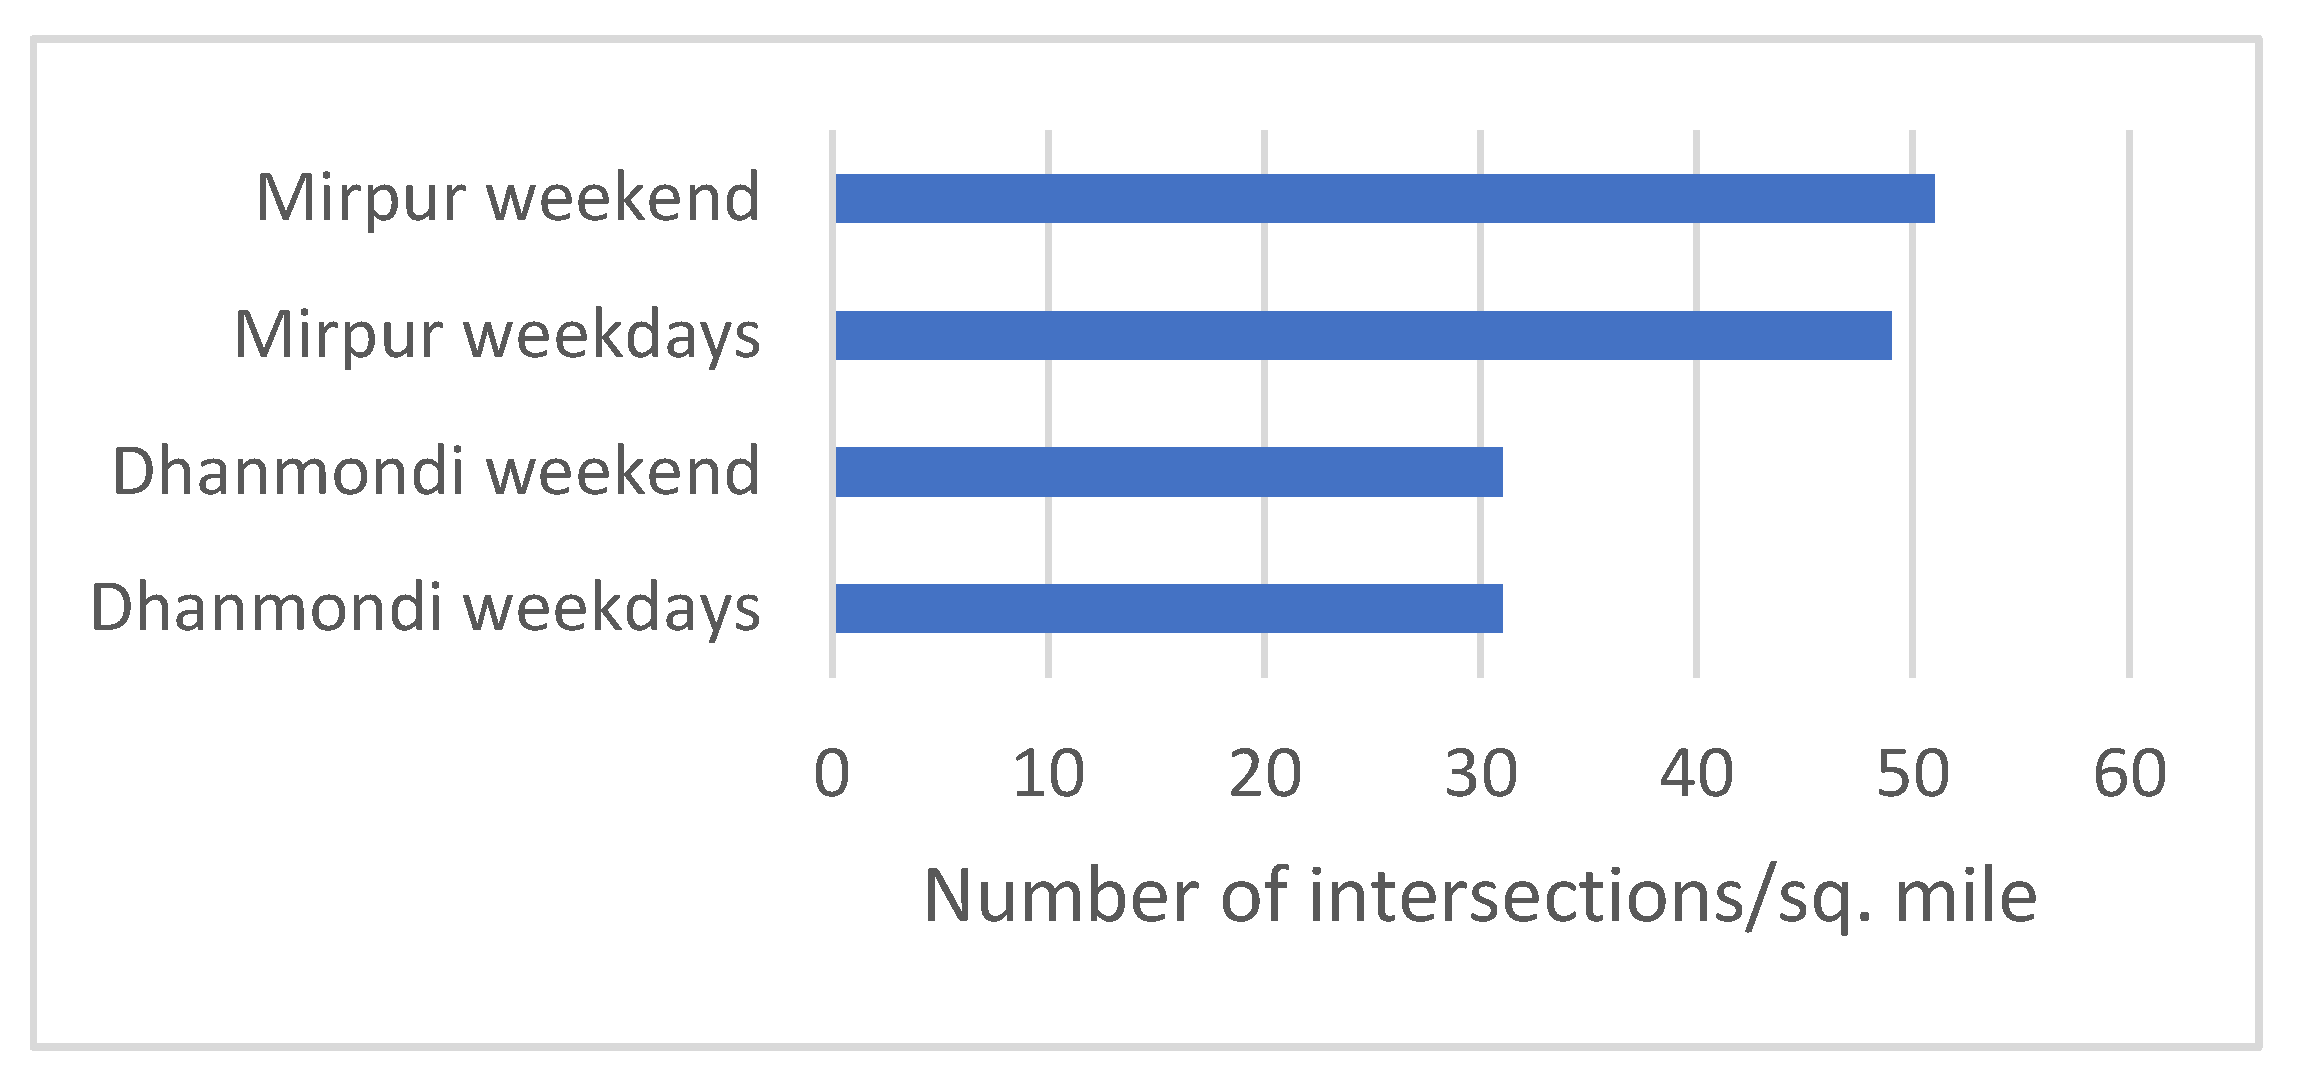
Average weekday activity space for the respondents from Dhanmondi (1.85 sq. miles) was larger than that of respondents from Mirpur (1.55 sq. miles) which indicates slightly more dispersed activity locations for Dhanmondi over Mirpur during weekdays. On the other hand, average weekend activity space for the respondents from Mirpur (1.6 sq. miles) was much larger than that of respondents from Dhanmondi (0.88 sq. miles). An initial hypothesis regarding this finding was that the Mirpur area is predominantly residential, with less commercial and other facilities, and therefore, Mirpur respondents needed to travel greater distances to satisfy their weekend needs as people travel for shopping etc. in commercial areas during weekends. In the case of road connectivity, Mirpur showed relatively better connectivity than Dhanmondi, displaying more intersections per square mile within a respondent’s activity areas.
Cronbach’s alpha values derived from confirmatory factor analysis for most of the attitude-based factors were found as more than 70% which indicates sufficient internal reliability. So, it can be said that selection of perception related statements was satisfactory for this study. Among the 10 attitudinal factors, five factors (perceived neighborhood amenities, car attachment, monetary concerns, transit preferences, perceived daily travel area and environmental concern) showed a significant impact on weekend activity space of individual respondents but no significant influence on weekday activity space.
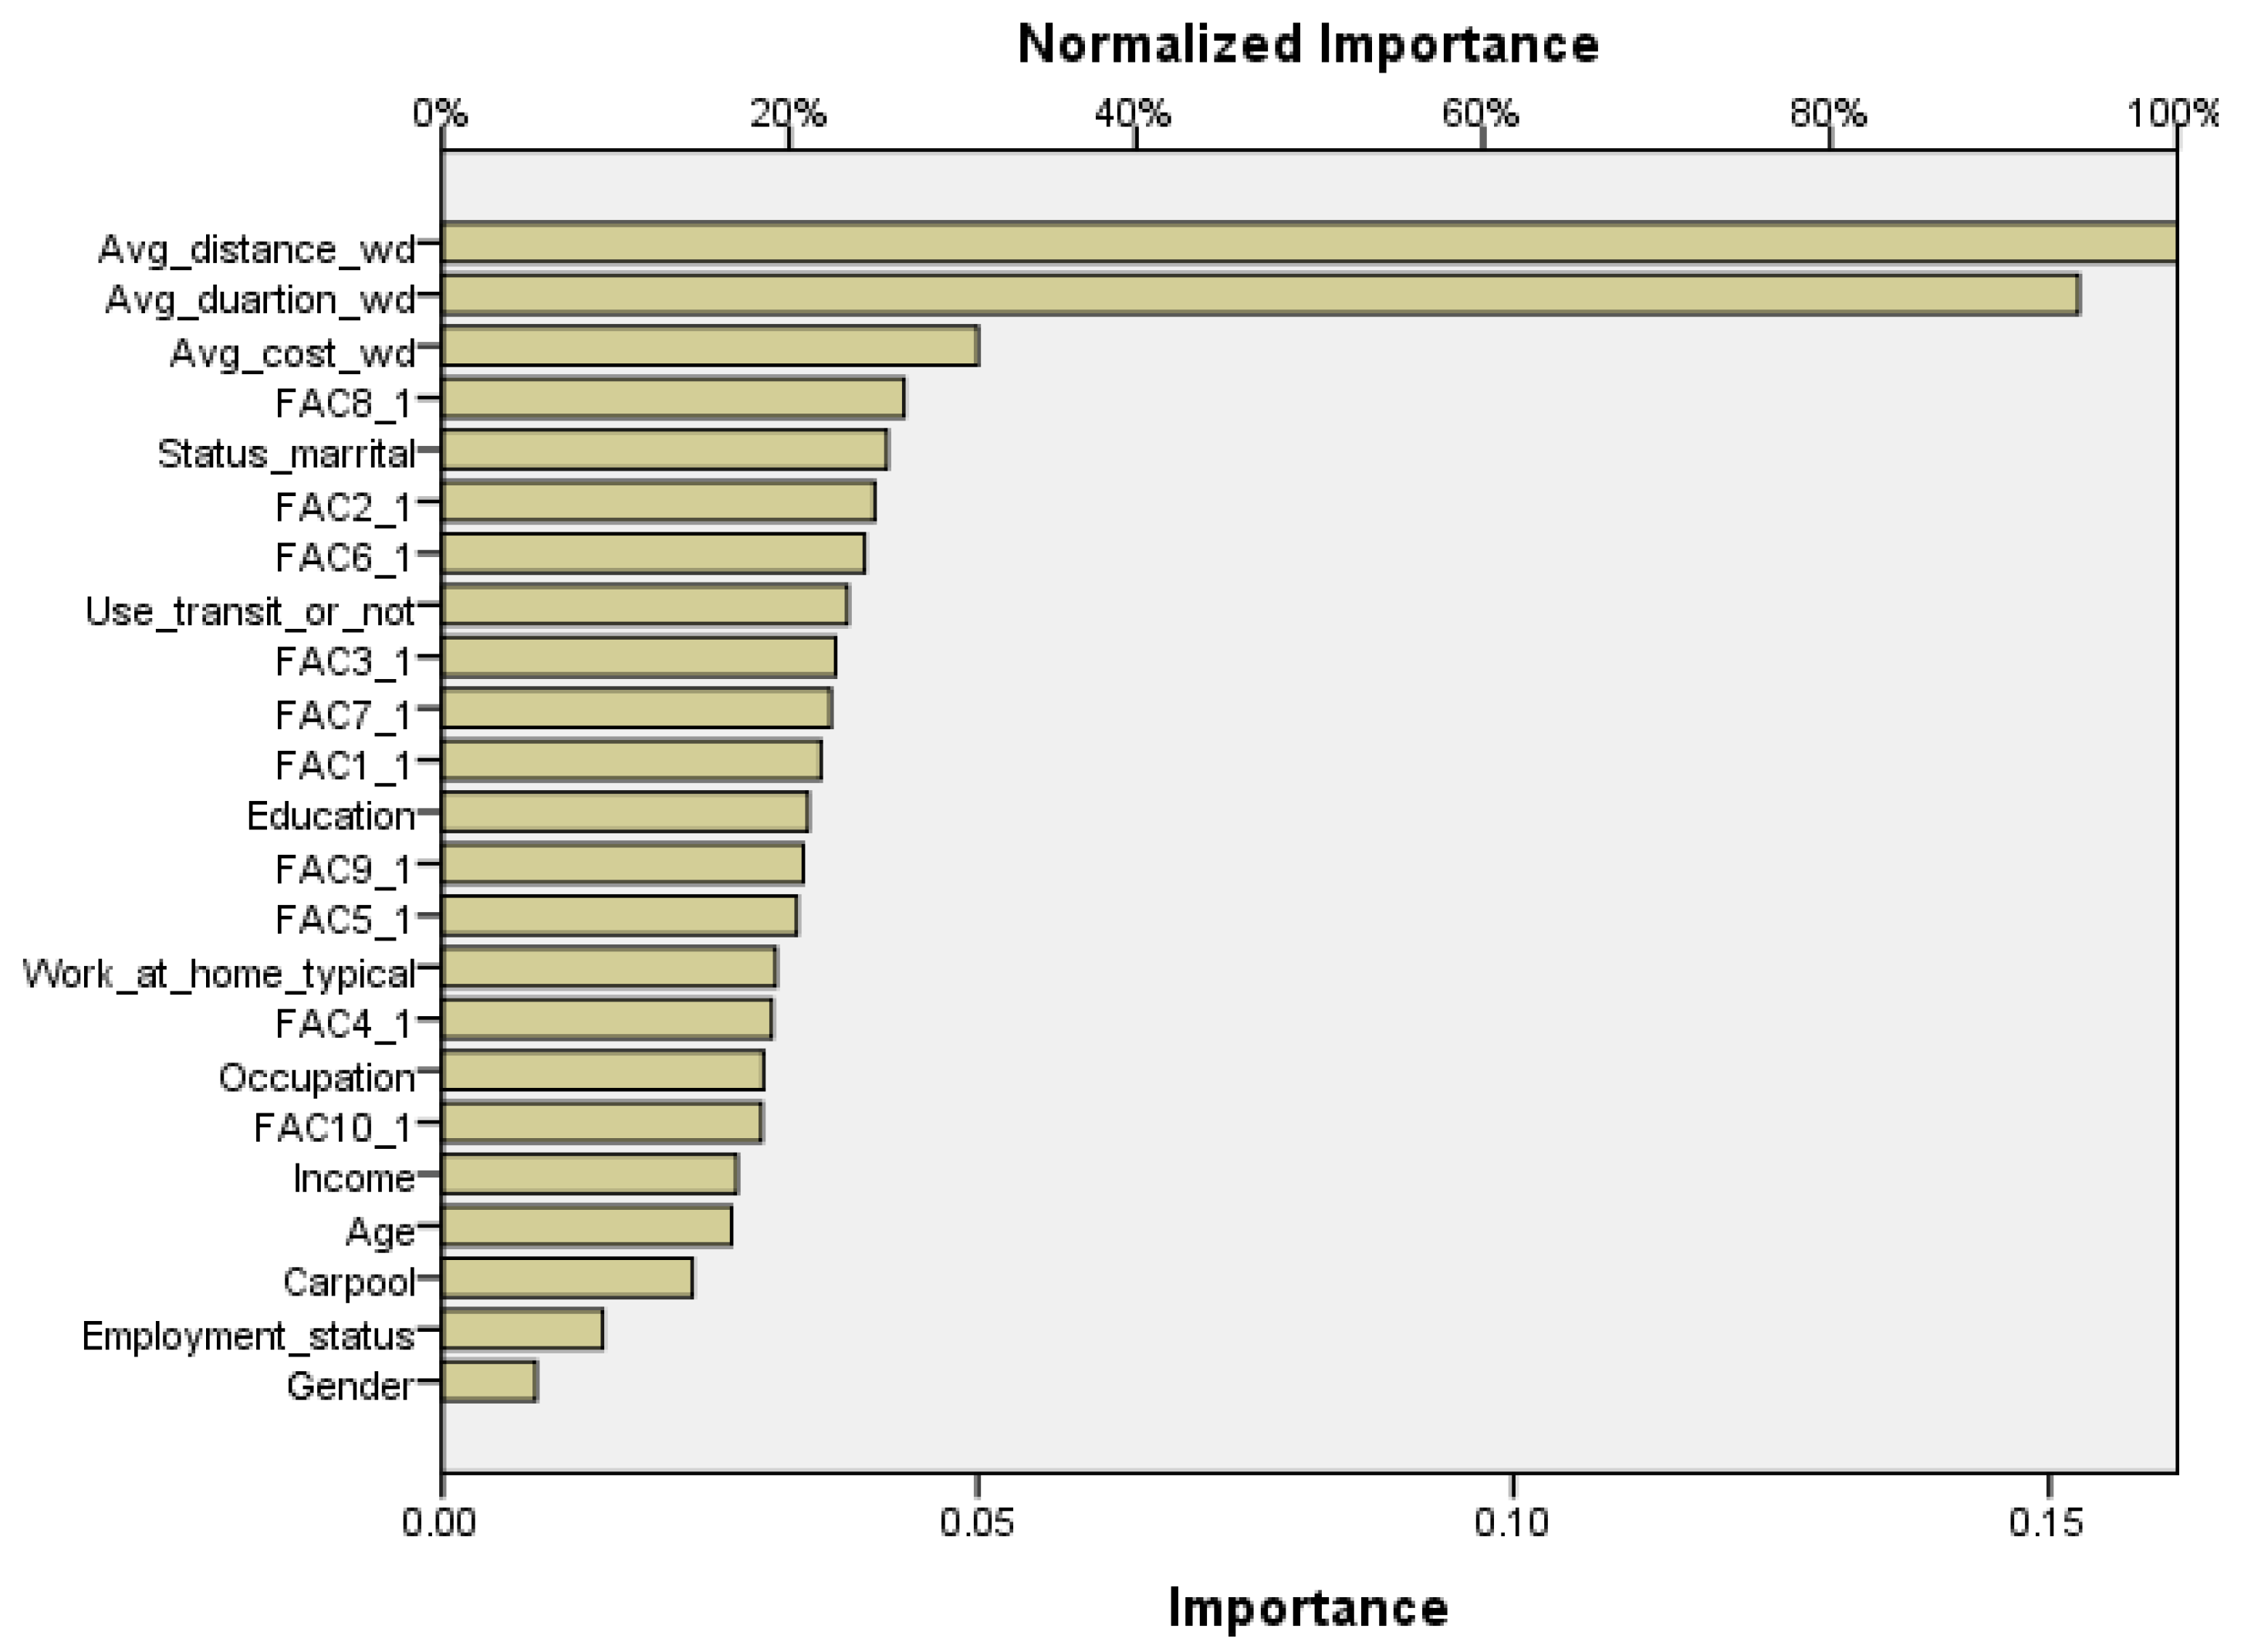
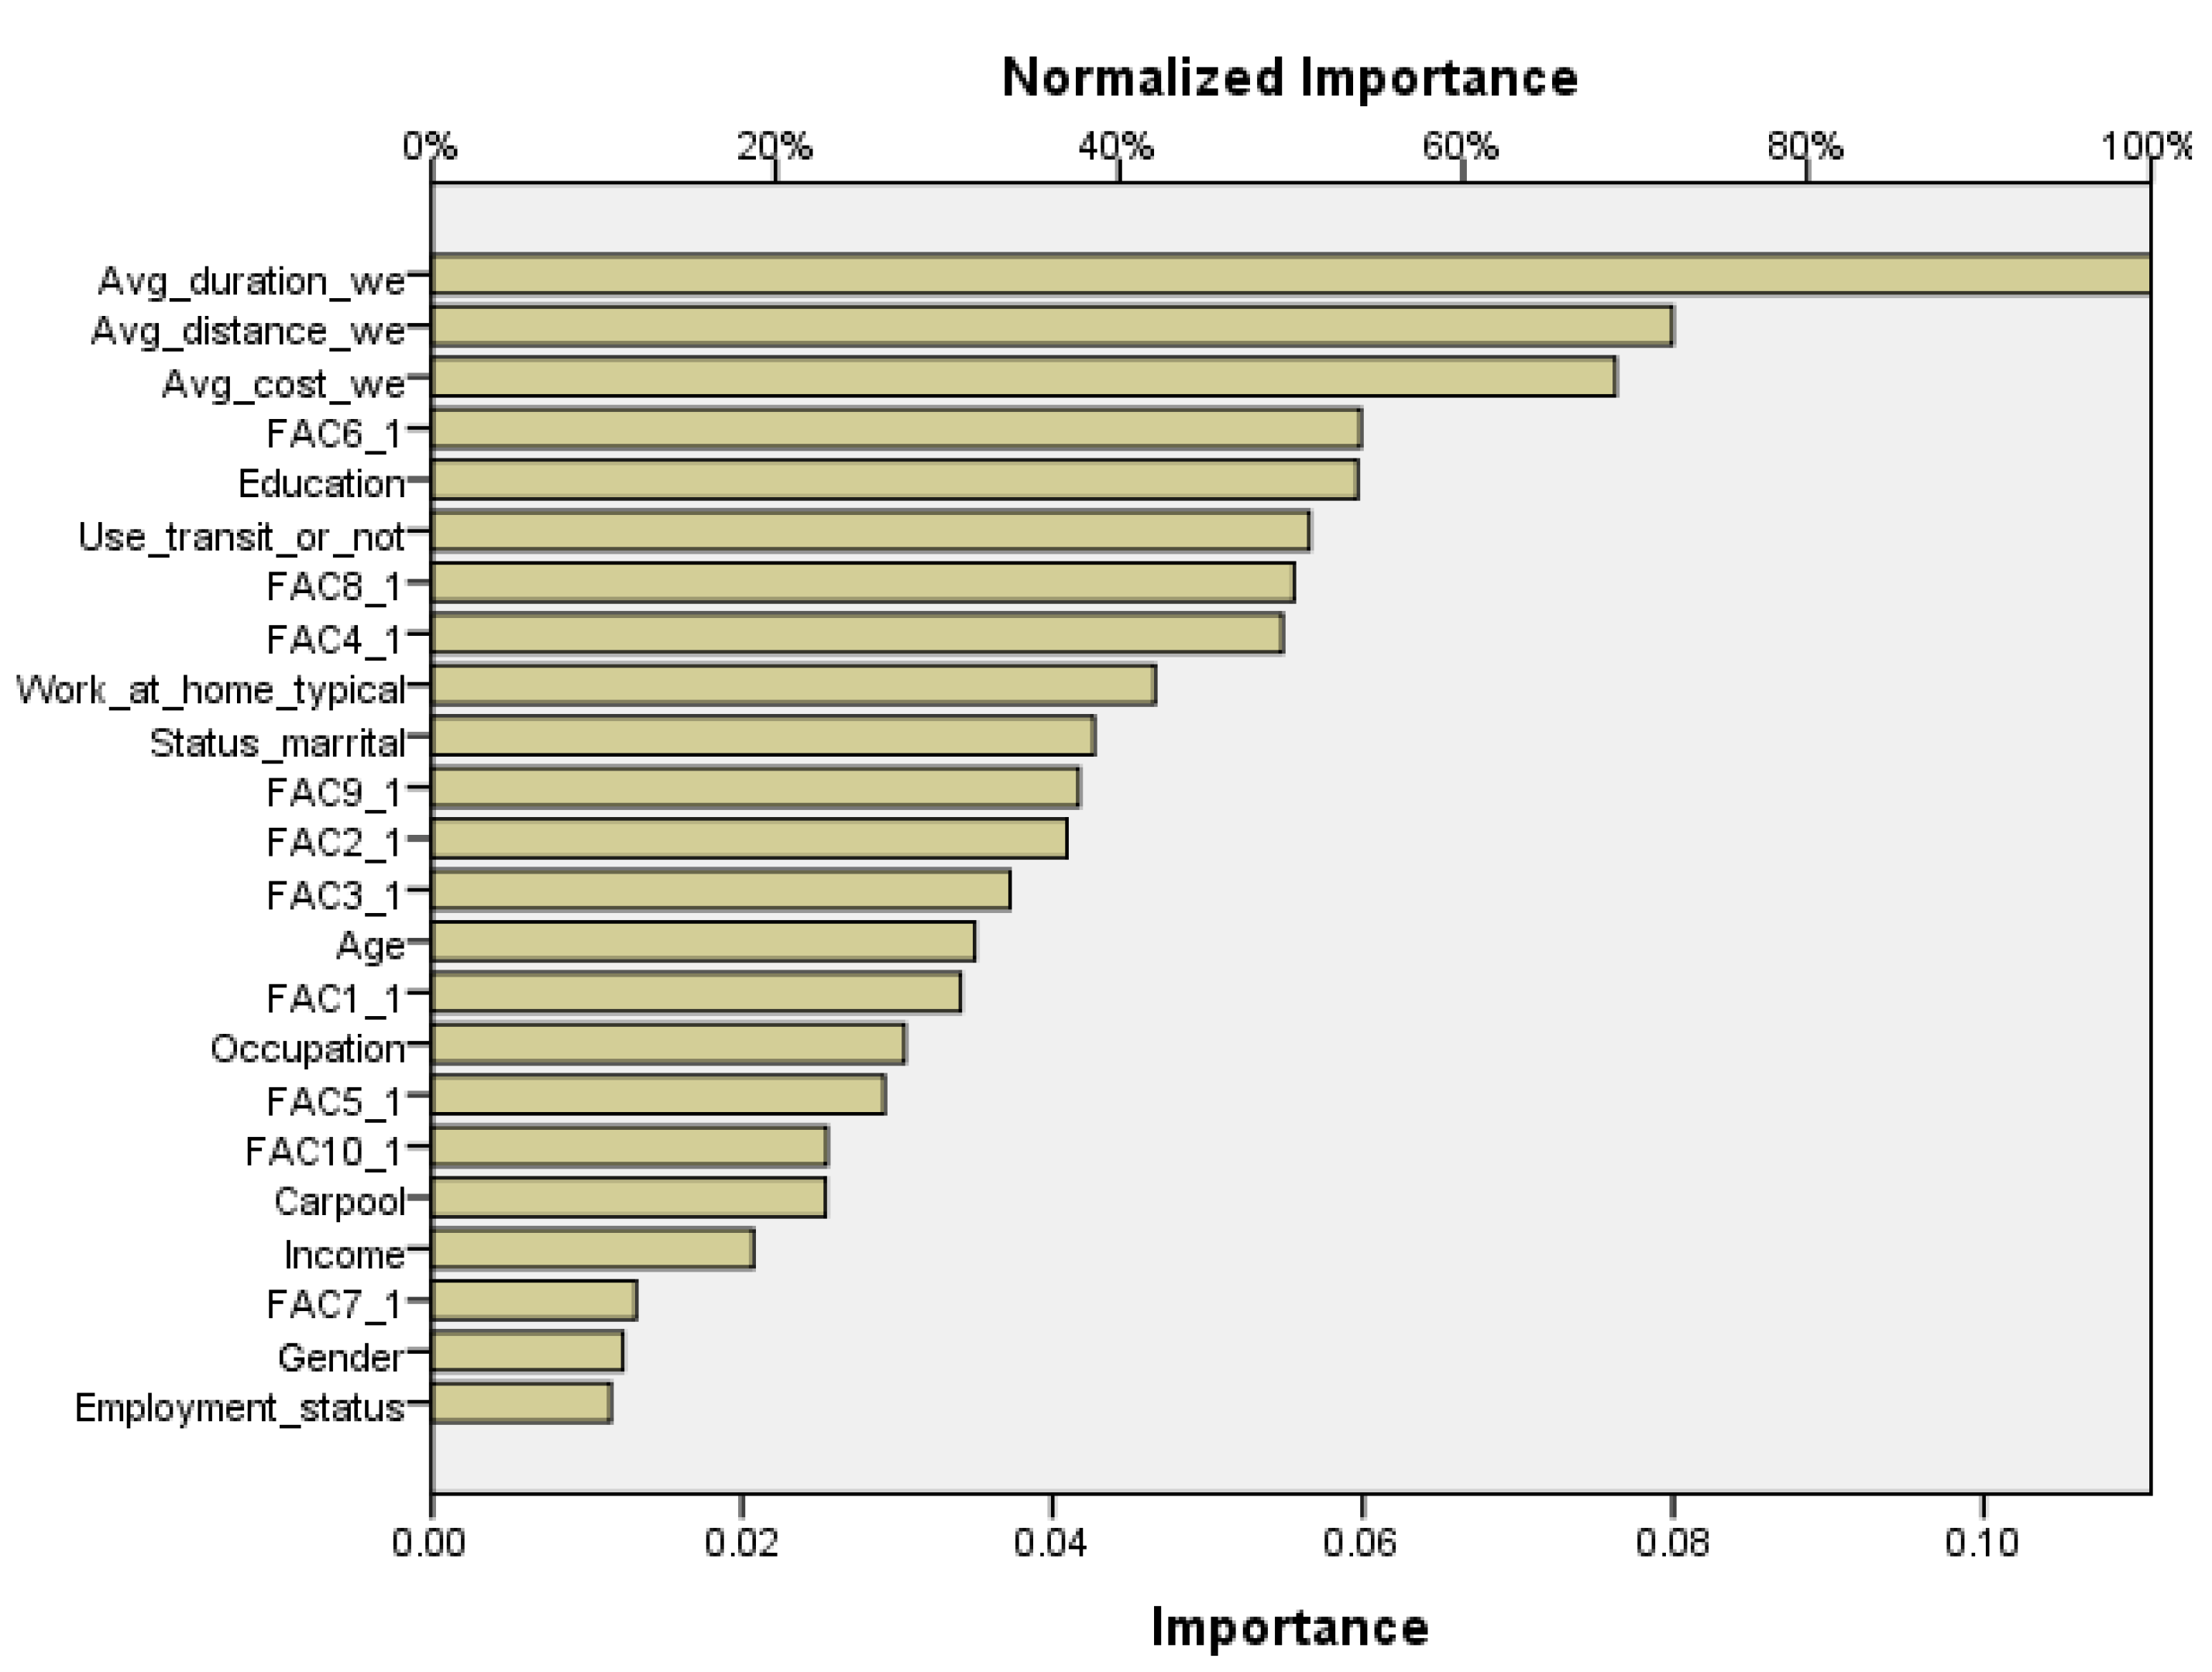
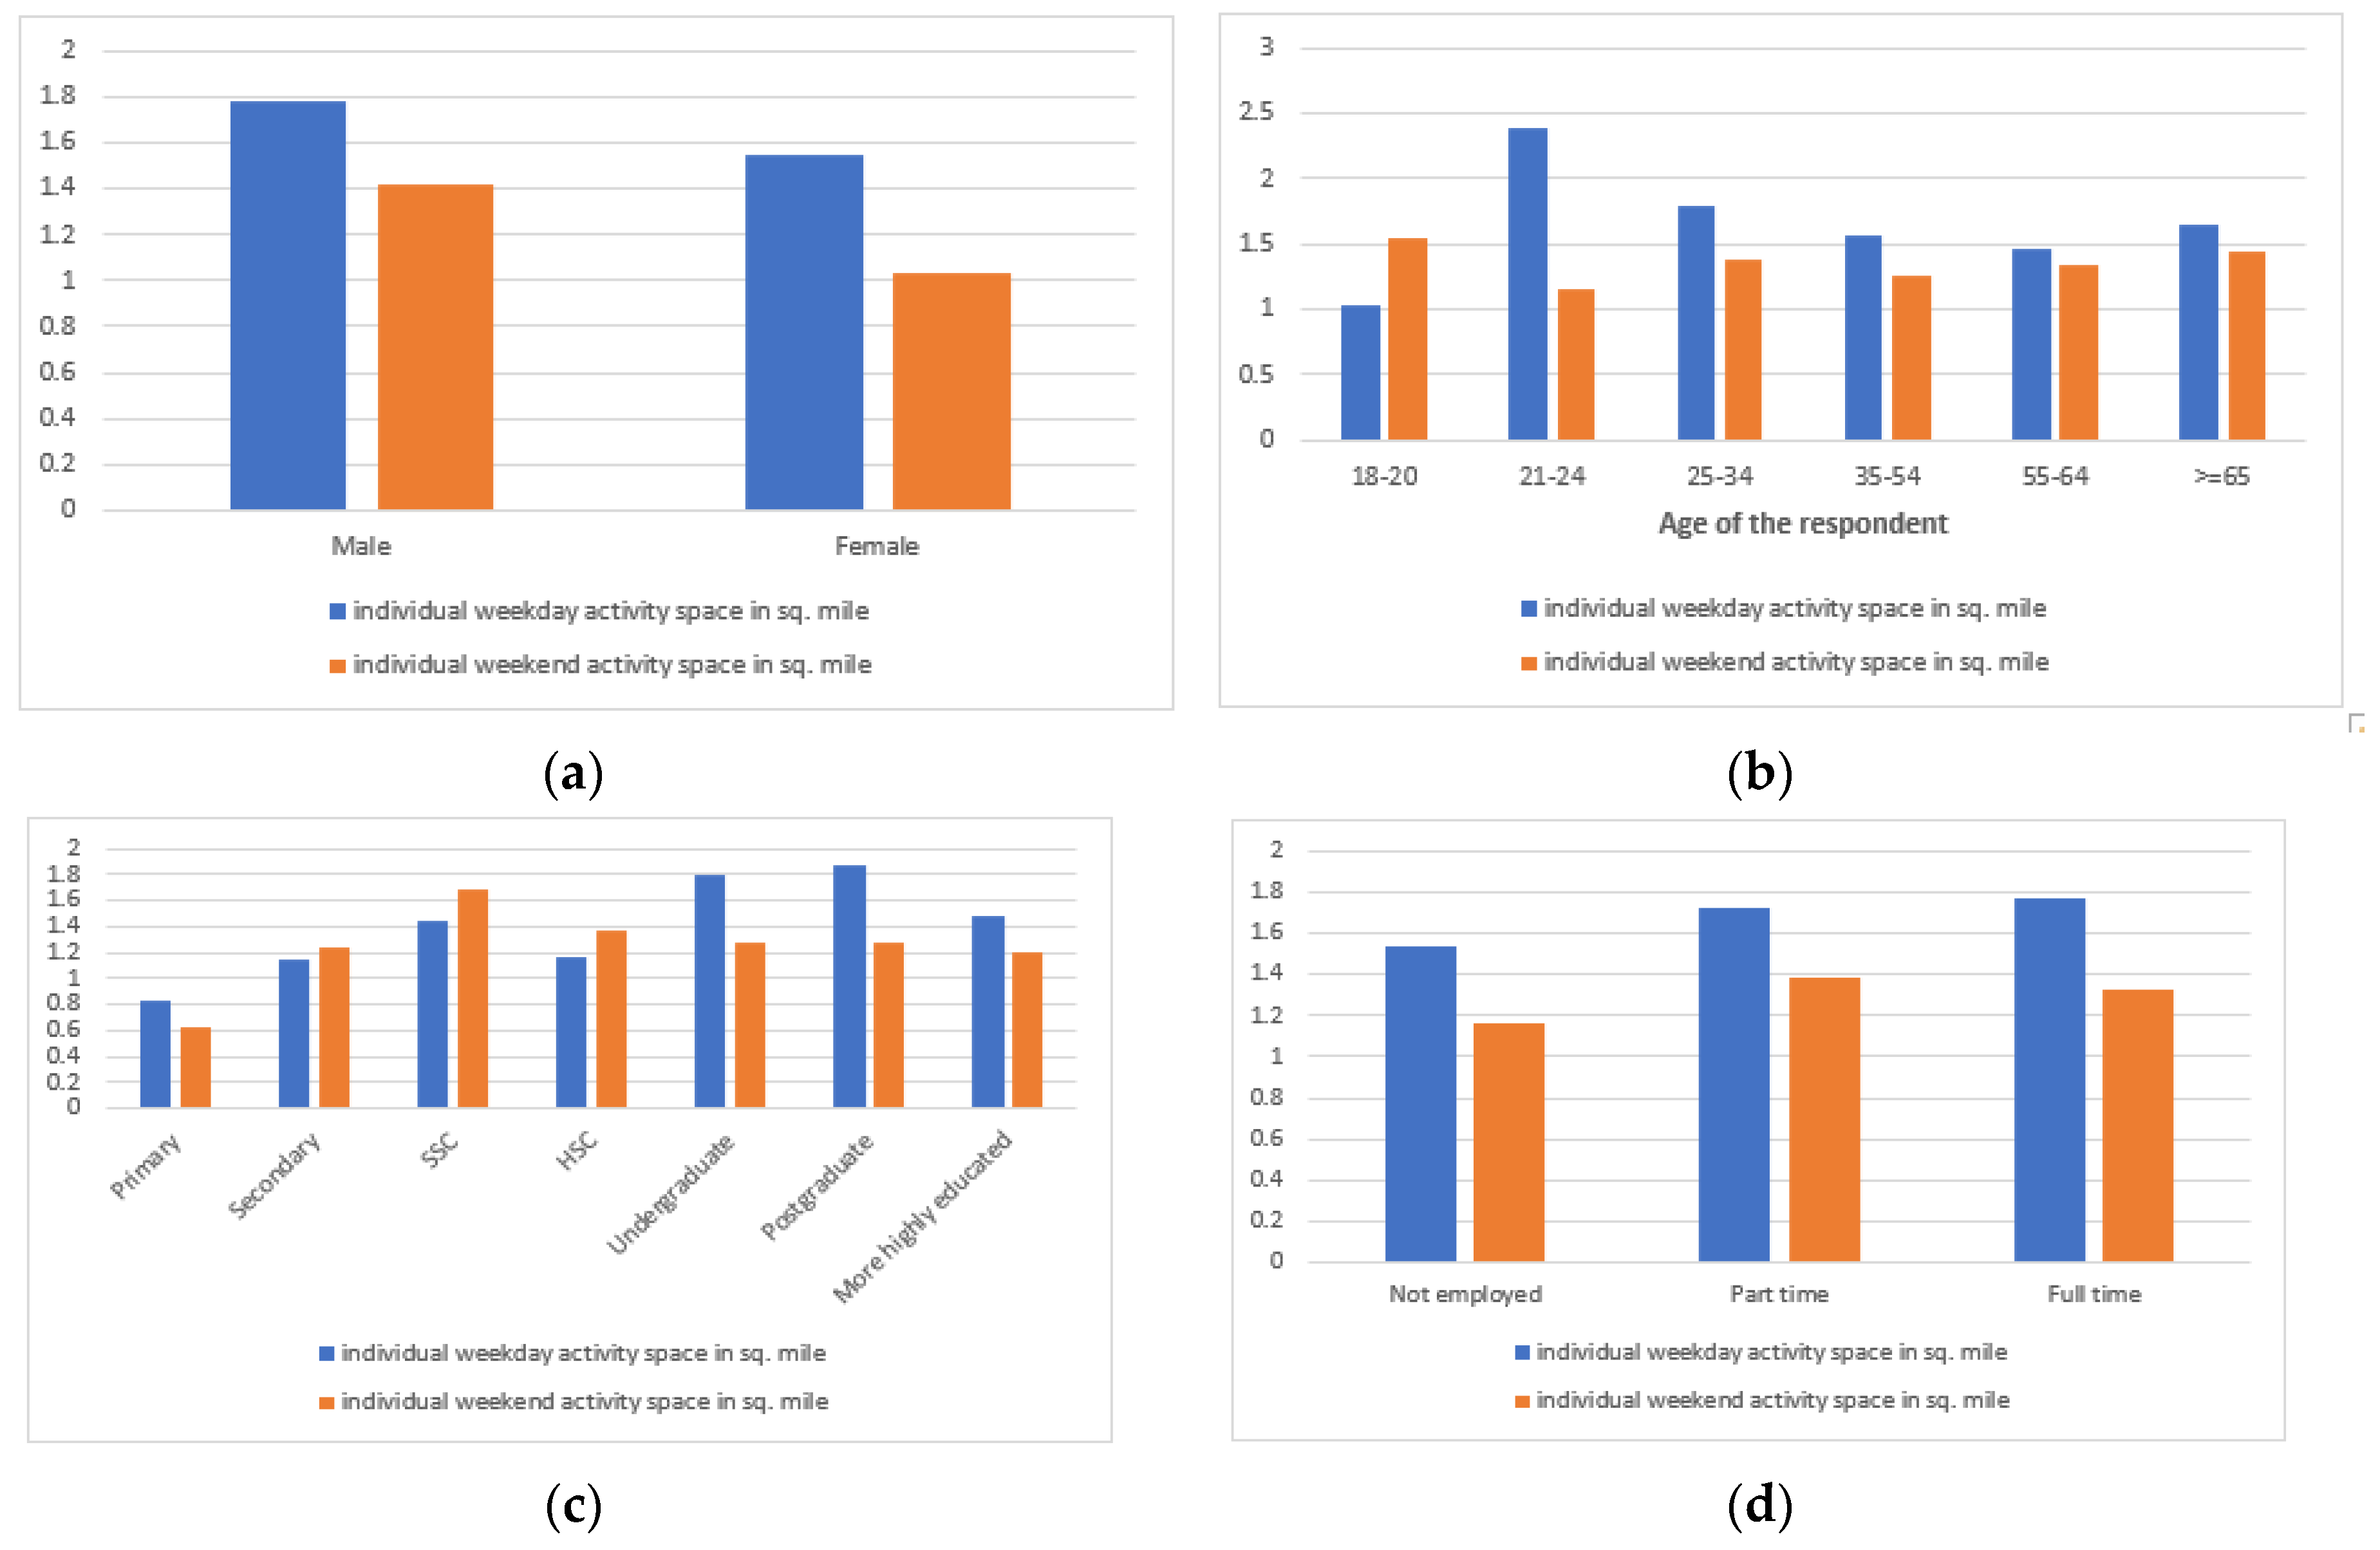
In case of an individual respondent’s weekday and weekend model developed by an artificial neural network, bias towards trip characteristics (distance, duration, and cost) were found in the results. Individual models showed relatively more error percentage in explaining the dependent variable in comparison to the household models. On the other hand, individual models developed with the help of multiple regression analysis also showed significance of the trip-related variables (travel distance, duration etc.), but apart from that in the weekday model, young age group and lower income group significantly affected the dependent variable (activity space) and transit use, lower-middle income group (monthly income USD 177–354) were found as significant variables in the case of the weekend model. From the co-efficient values, it was found that female, unemployed, and retired respondents; comparatively young age group, high income group, lower education level, and single persons had a smaller activity space during weekdays. In the case of weekend travel, people who worked from home, females, unemployed, govt. service holder and retired respondents; aged people, both low- and high-income group, both lower and more highly educated people and unmarried (single) respondents had a smaller activity space.
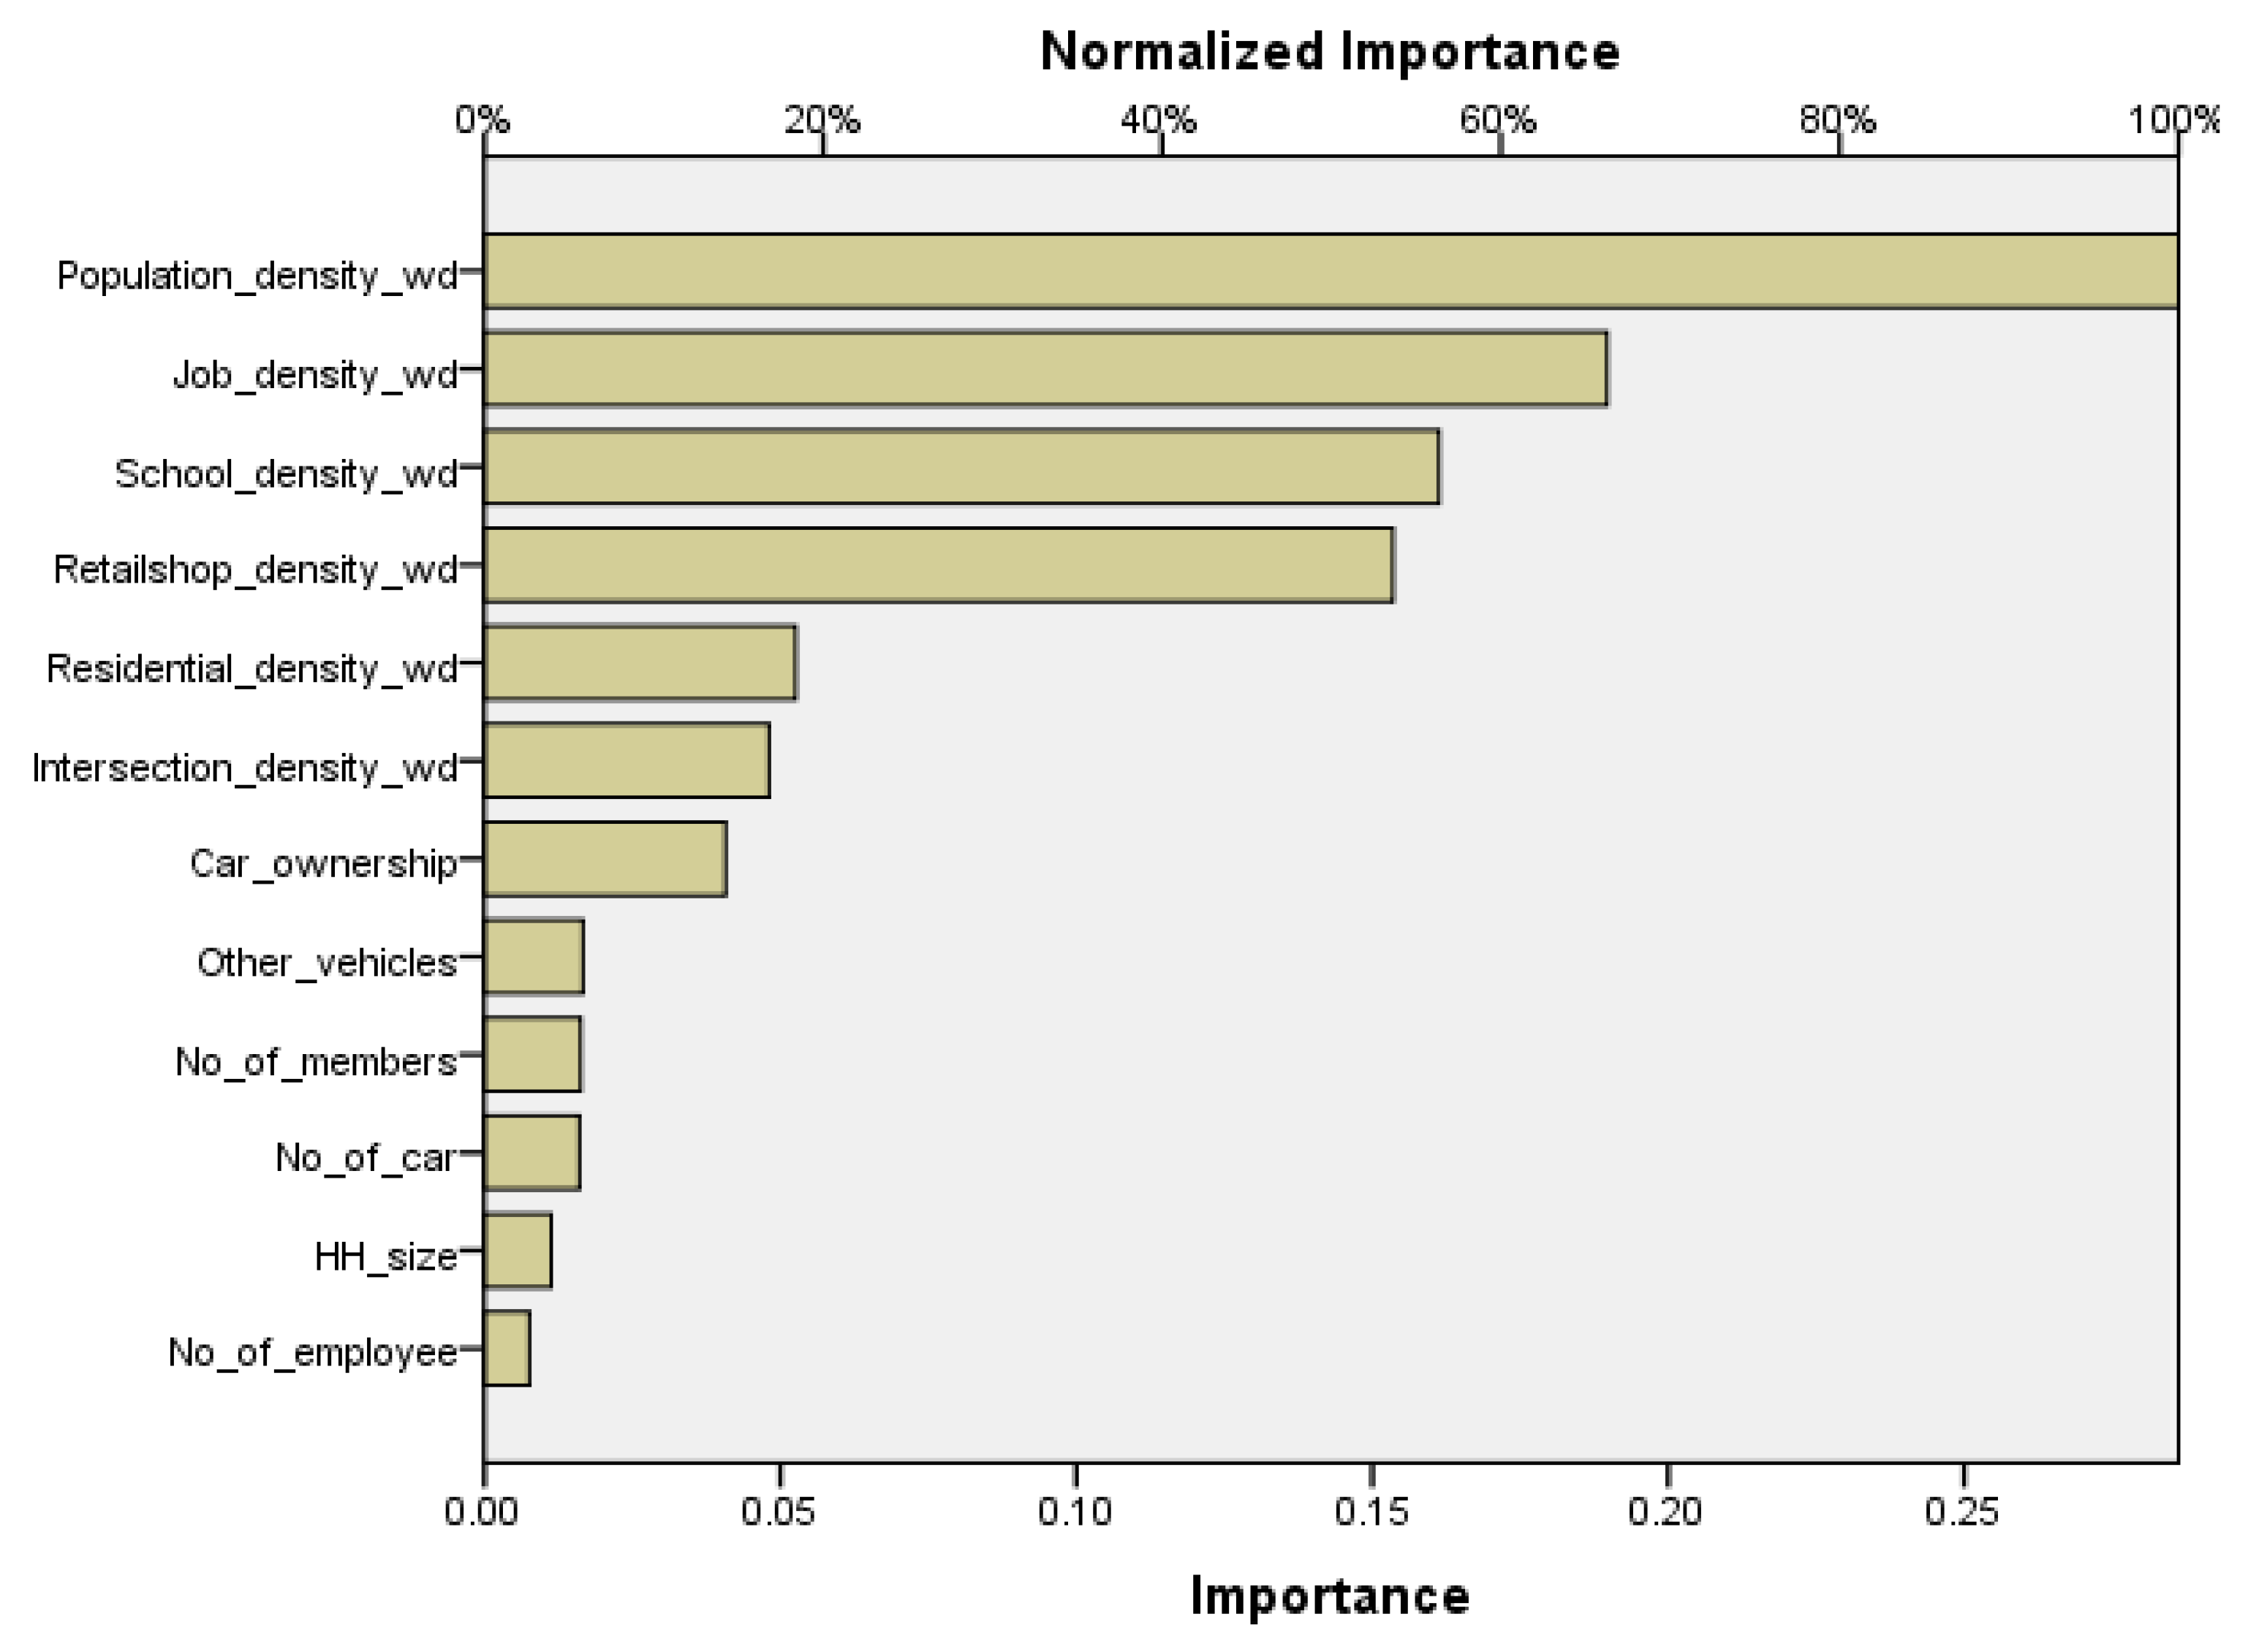
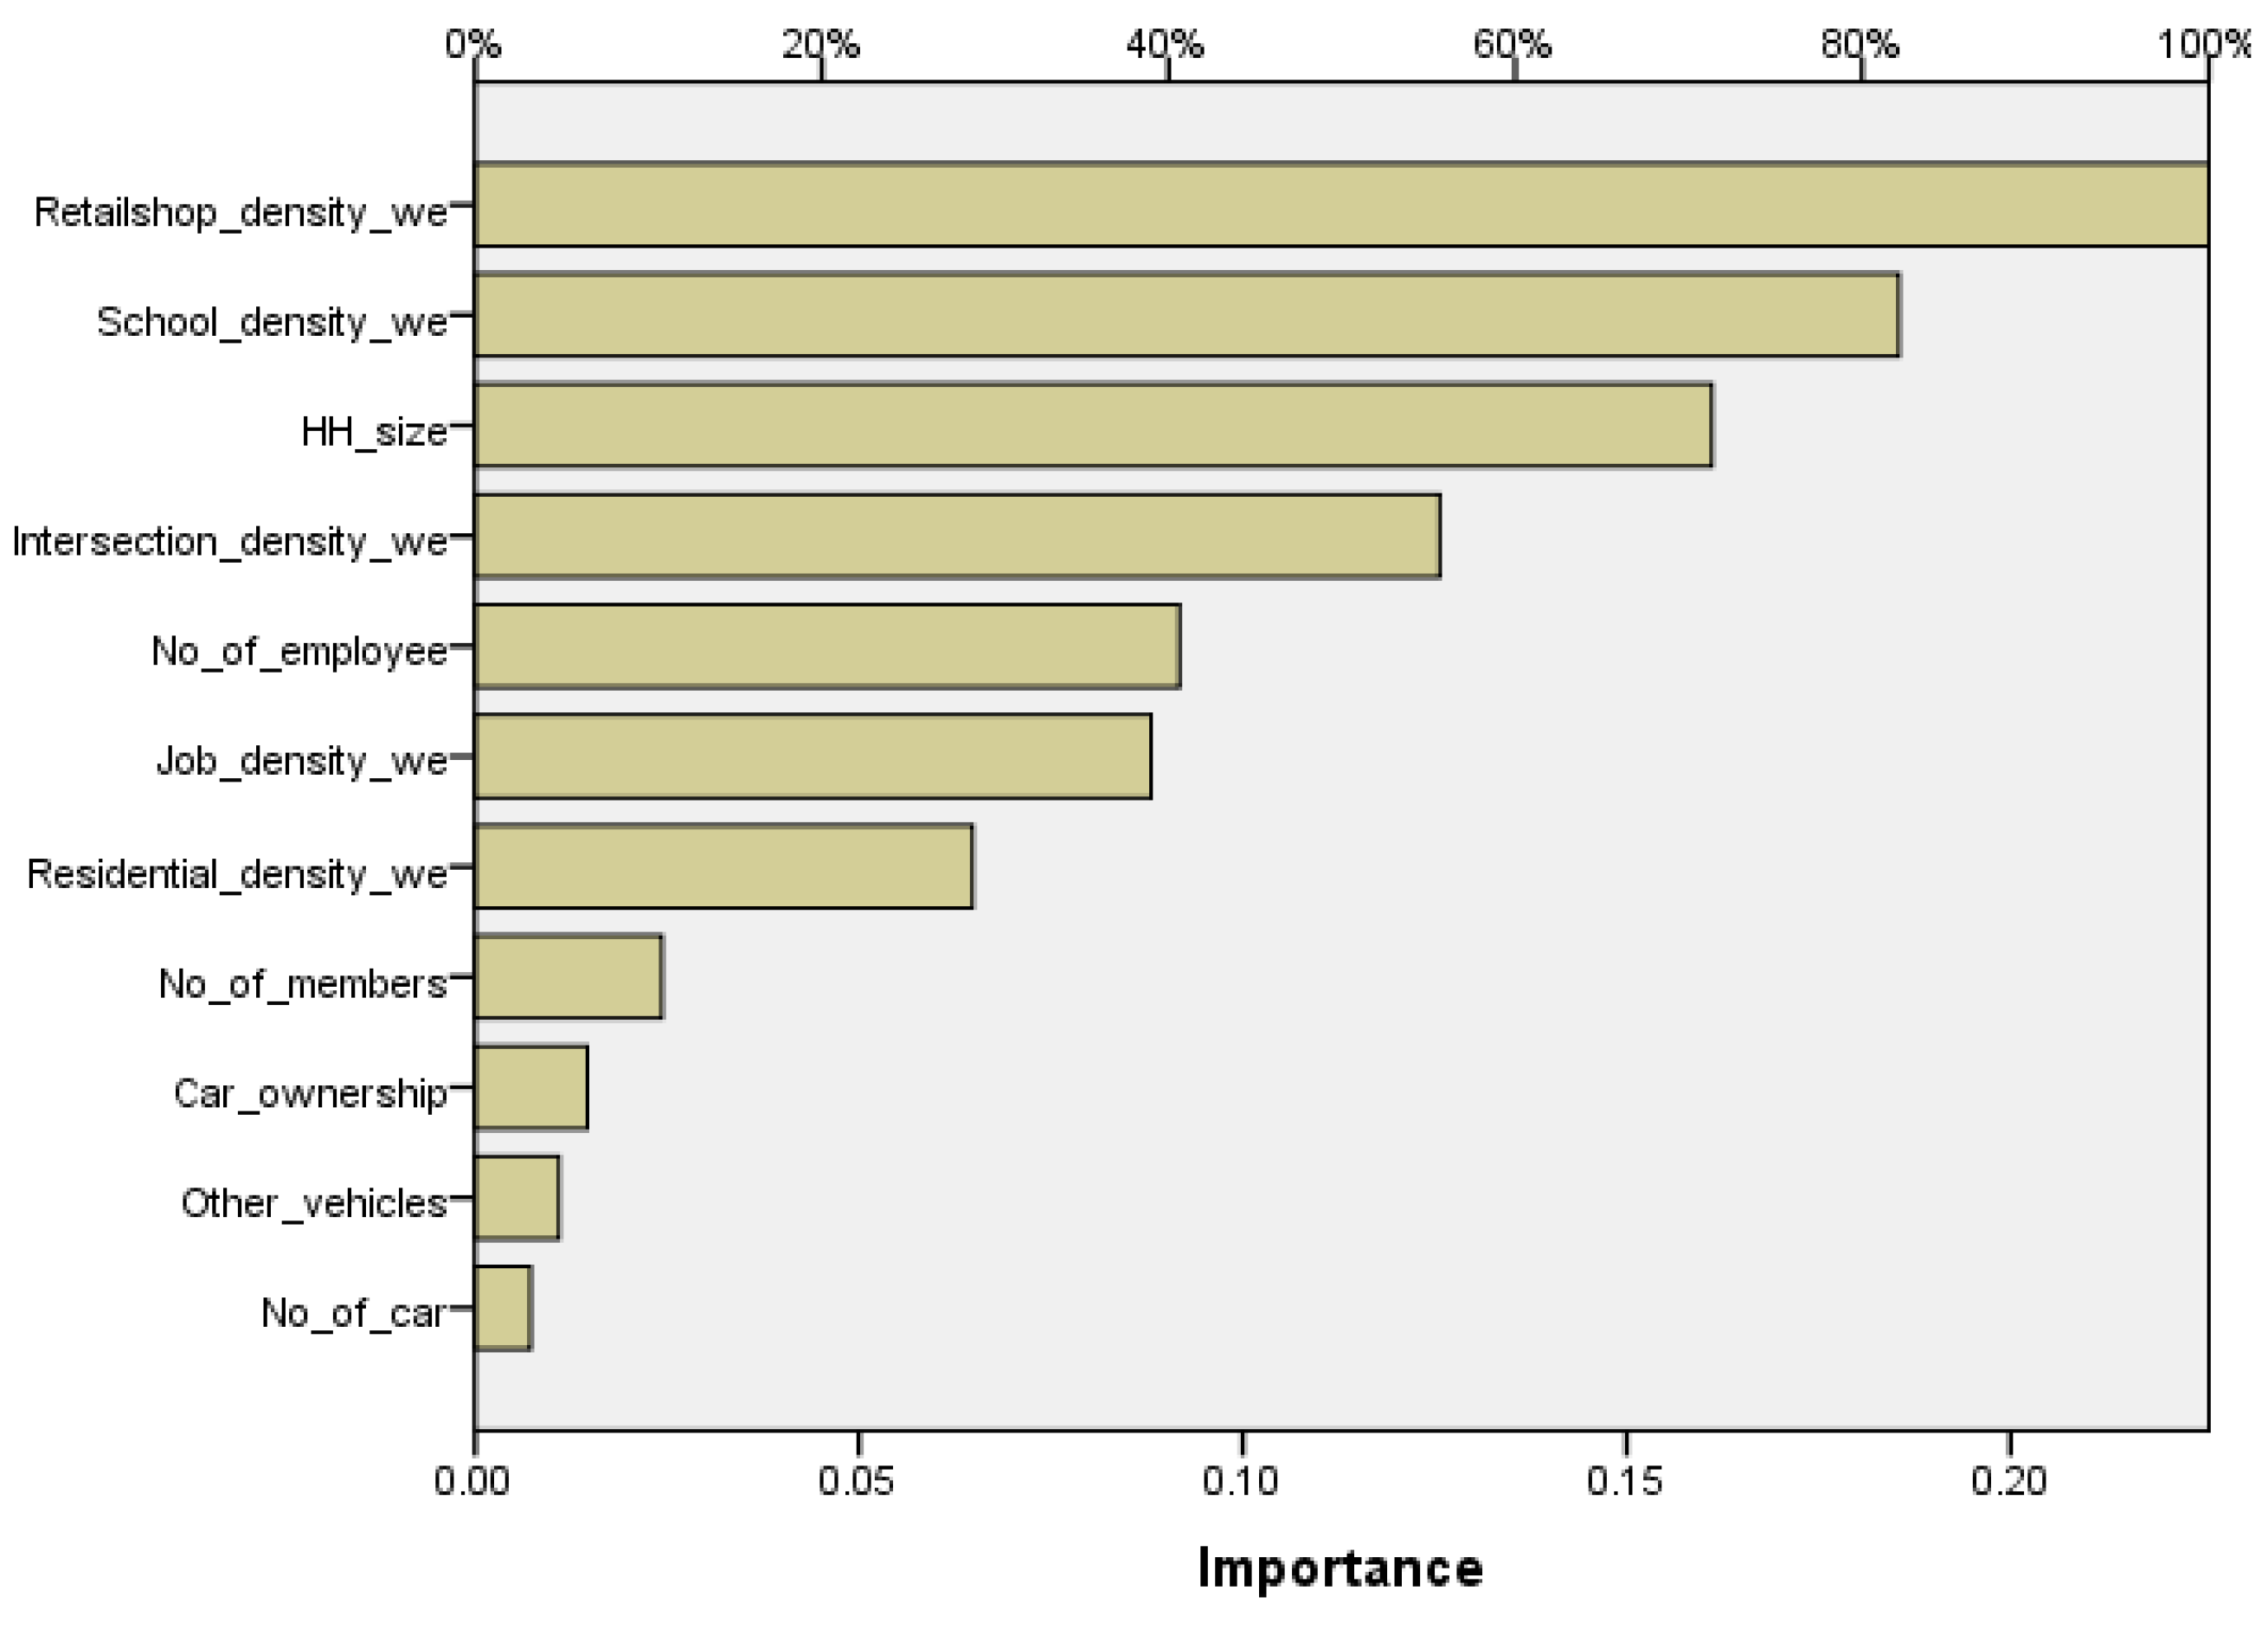
While interpreting household model developed for weekdays and weekends, household models were found to be much better in terms of model fit (regression) and minimum error level (ANN model) in comparison to the individual ones. Model estimation results showed that mainly D variables (density and destination accessibility) and household size were consistently the most significant explanatory variables that influenced the magnitude of the household’s activity space indices during weekends. D variables were not used in individual models as individual socio-economic characteristics, attitudes, travel/trip characteristics were included as explanatory variables in that model. On the other hand, in the household model, household characteristics, land use characteristics (urban form: D variables), population characteristics were included as these features are similar for all members of one household as these are location-based variables (spatial variable). Higher density population and higher density of offices (job locations) within a household’s activity space decreased the weekday activity space. Besides these, better traffic conditions with well-connected road networks and large household sizes also reduced activity space of households during weekdays. Like with the weekday findings, D variables (higher density of offices, schools, shops) and more car use reduced activity space during weekend for households. Unlike the weekday findings, smaller households were found to have a smaller activity space for weekends.
While interpreting the model summary of the four multiple regression models developed in this paper, comparatively low R2 and adjusted R2 values were observed in the case of the first two models. It can be explained since attitude-related variables (subjective behavior of people) were included as predictor (independent) variables for the first two models, while land use characteristics were included in the latter two models and represent a better model fit. R-square, even when small, can be significantly different from 0, indicating that the regression model has statistically significant explanatory power. A small R-square could have important implications. In social or behavioral science, to examine the effectiveness of a factor, the size of R2 does not matter.
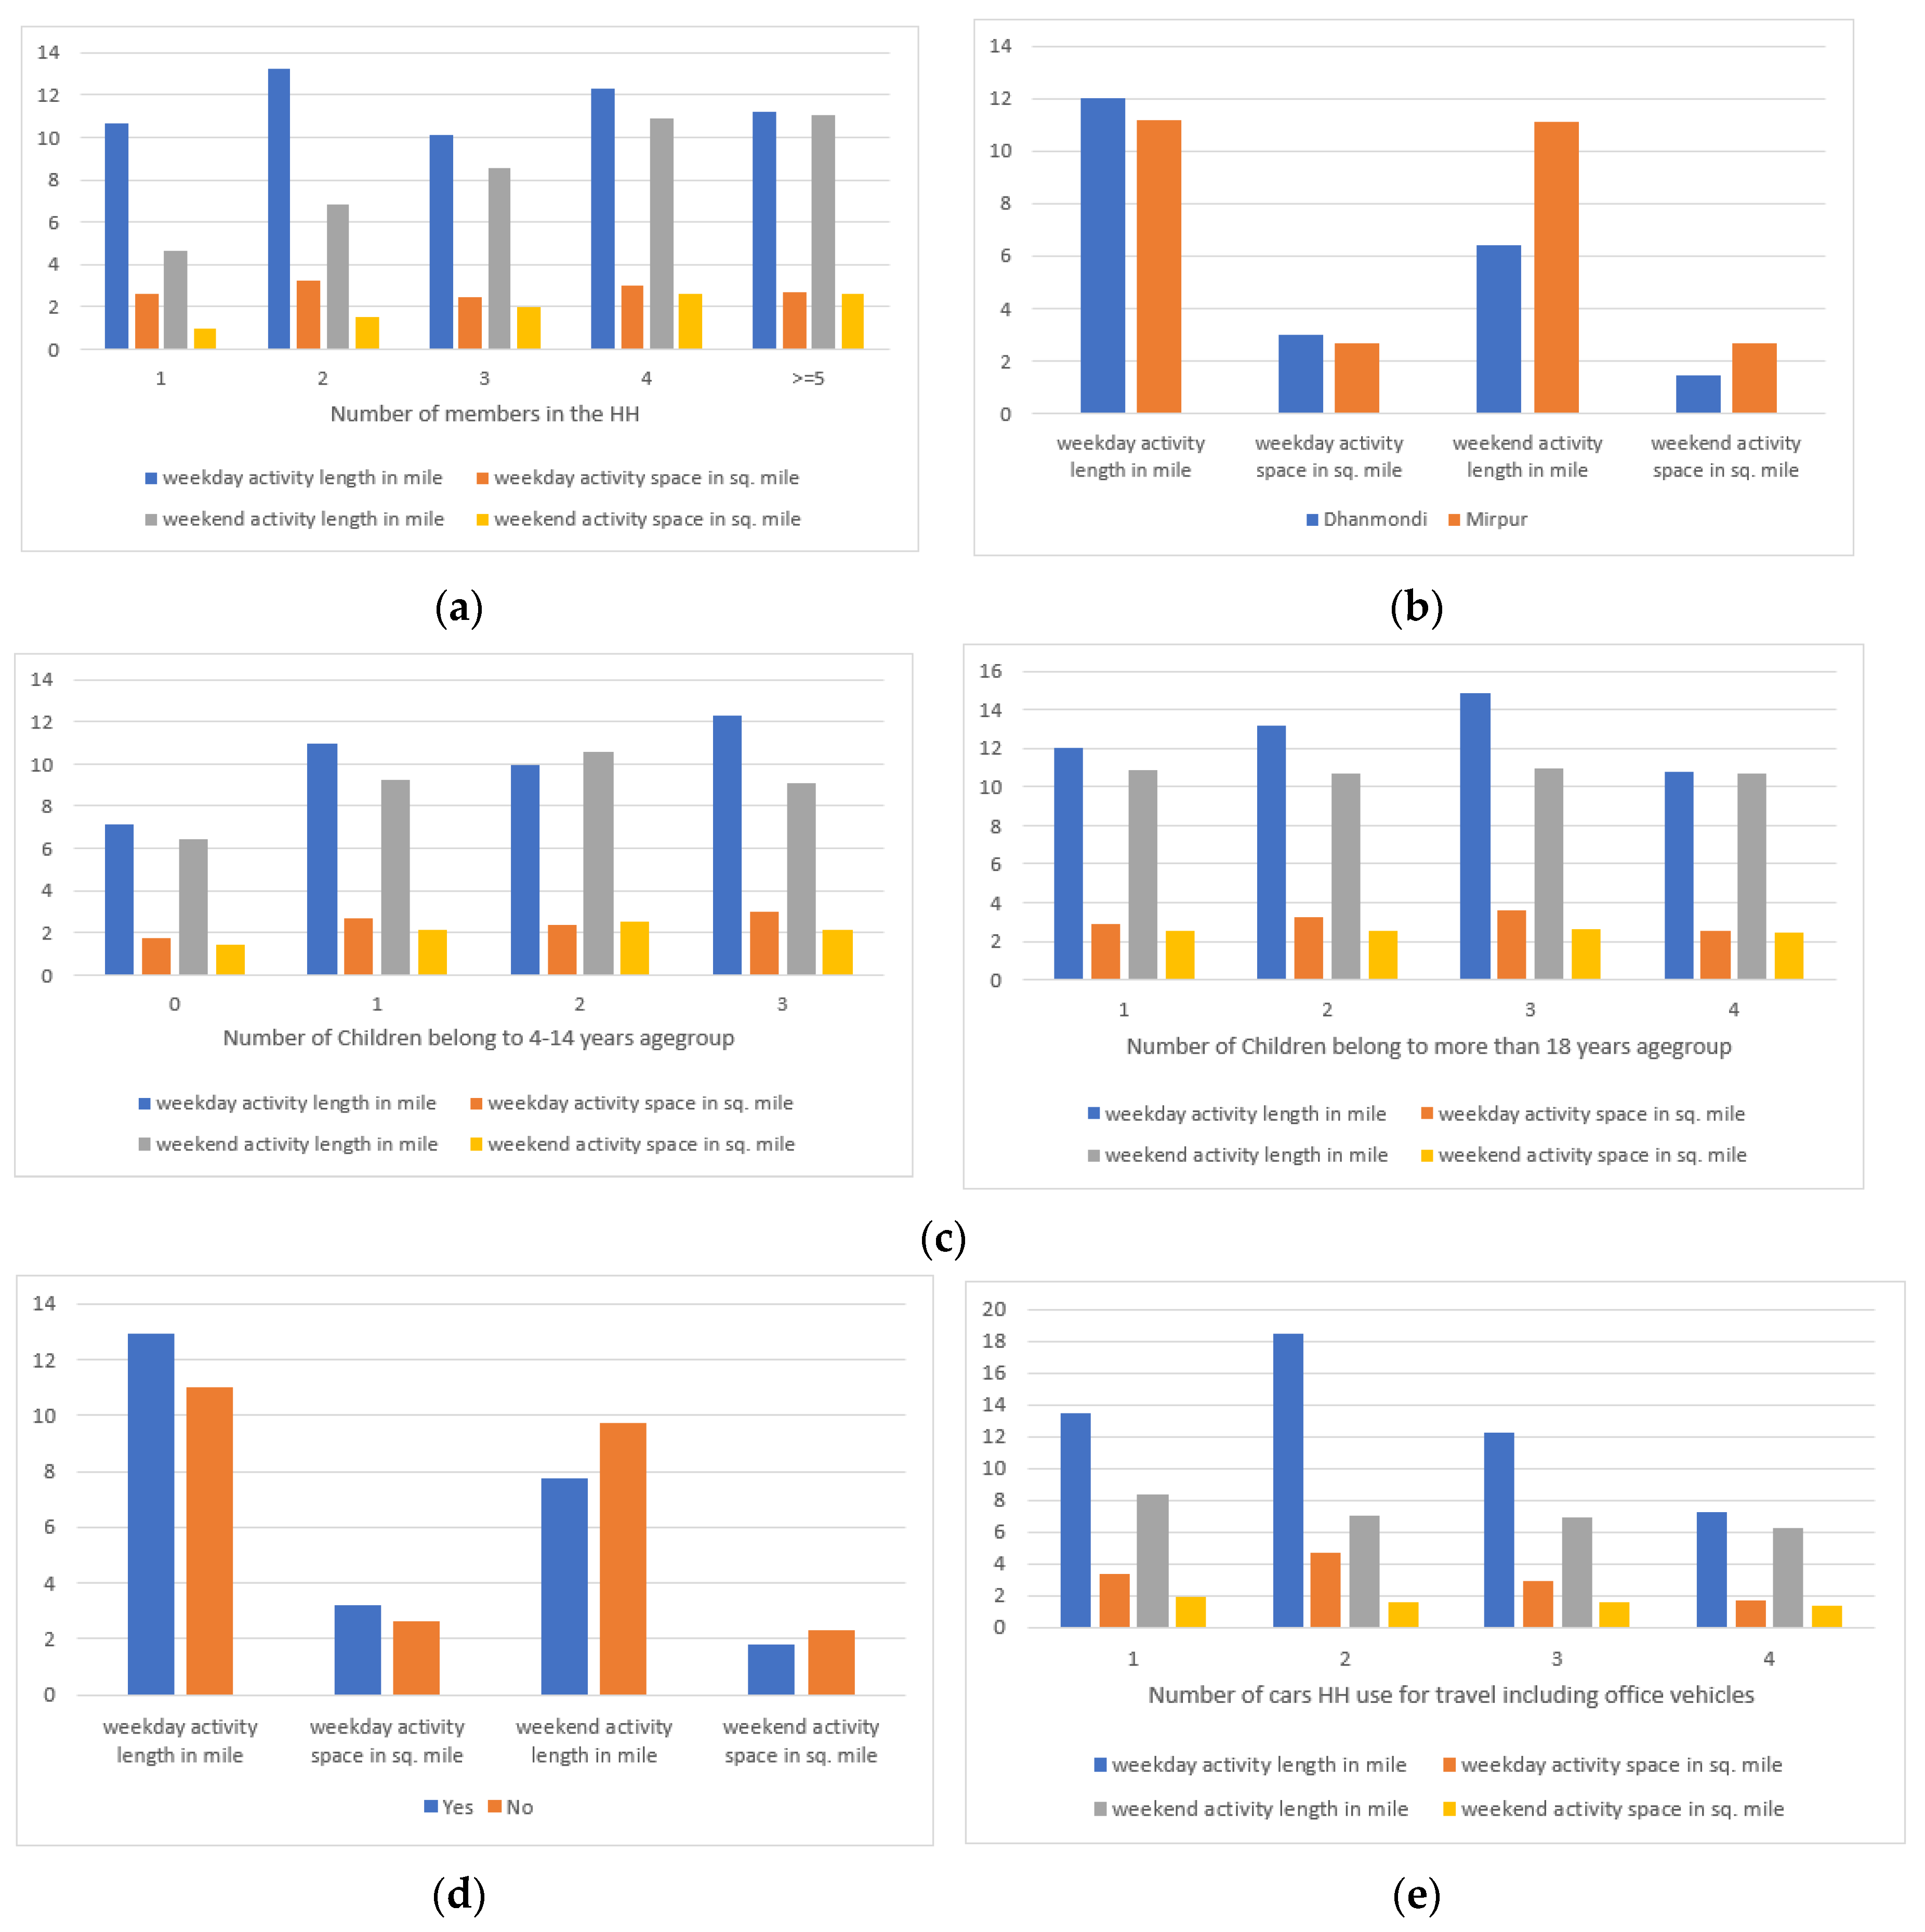
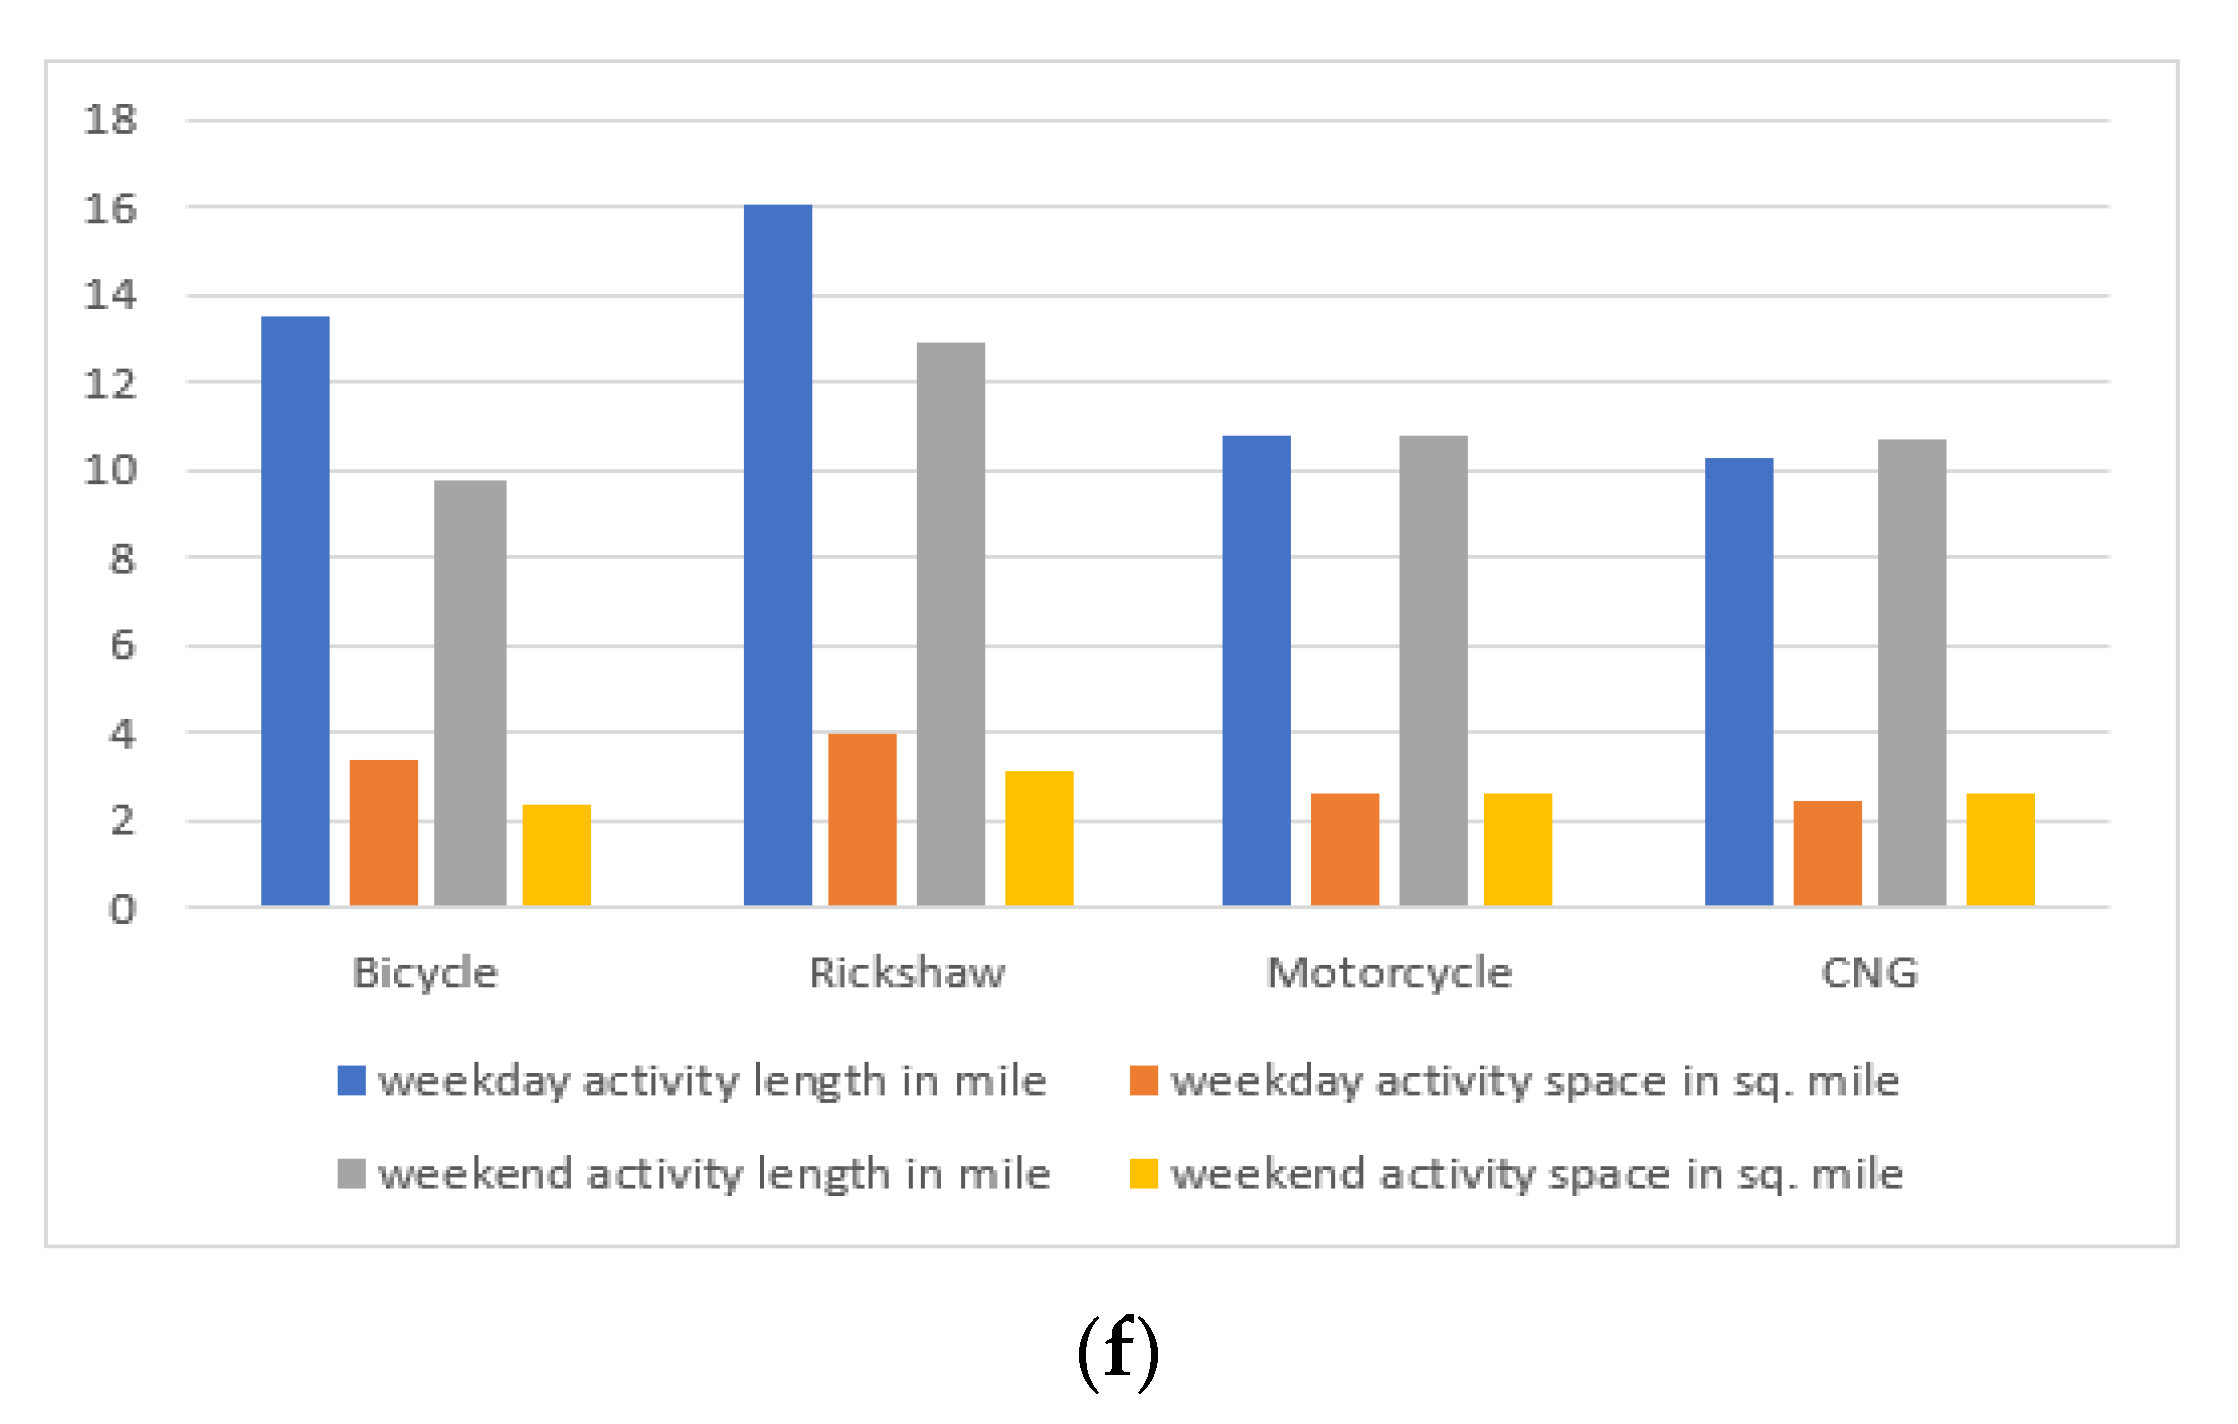
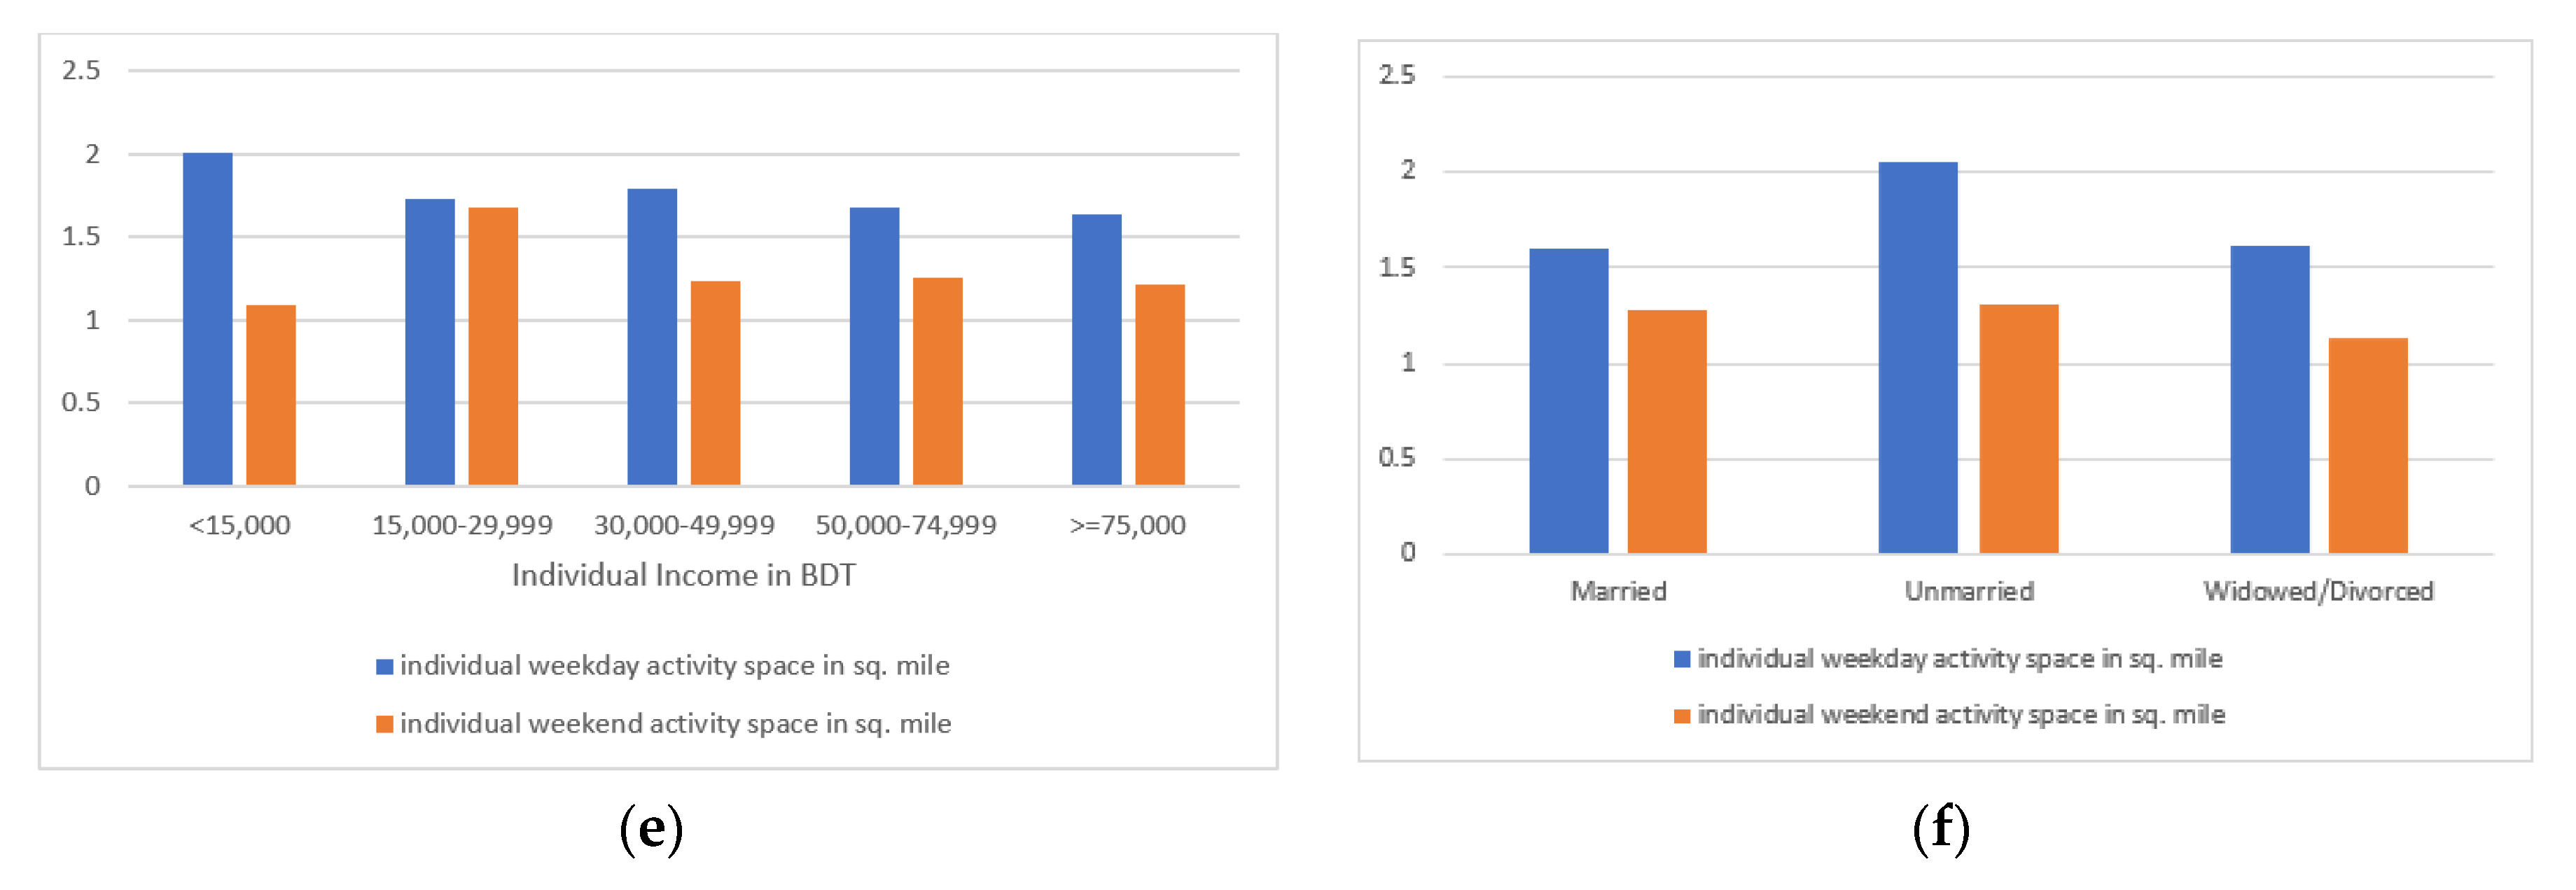
From the accessibility of opportunities analysis, each household was found to have at least one school, hospital, retail shop and restaurant facility for both weekday and weekend trips within their activity space. Using a travel diary collected on seven consecutive days in the DMA area, we examined weekday-to-weekend variability of individual and household activity spaces. Furthermore, household and individuals’ interpersonal and intrapersonal variability in activity space indices were examined systematically. The RNB of activity locations increased during the weekday. However. households with two dependent children from the 4–14 years age group, with two elderly persons above 65 years, with motorized vehicles ownership (motorcycle and CNG ownership, not car) and without-car households tended to have activity centroids farther from their home locations during weekends. Dhanmondi respondents had a larger activity space during weekdays in comparison to the Mirpur weekday activity space. Additionally, weekday-to-weekend variability was much larger in Dhanmondi in comparison to Mirpur. Single-person or more-than-two-member households had a smaller activity space during weekdays. Individual day-to-day variability was less during weekdays than at the weekend. Male respondents were found to have a larger activity space in comparison to females during both weekdays and weekends which is somewhat expected due to the social context of Bangladesh. Comparatively young age group respondents with an education level of a higher secondary degree visited more distant places during weekends in comparison to weekdays. High-income respondents had lower activity space values in comparison to other income category people and visited activity locations farther from home on weekdays in comparison to their weekend travel.
In our case of a developing country, it was found that D variables and travel, household characteristics were more significant than socioeconomic characteristics and perceptions (personal attitude) in shaping daily activity locations across urban space. Household activity space models showed better model fit than individual models. This conclusion should, however, be treated with caution as context varies from place to place. Even though objective (quantitative) measures were proved to be more powerful rather than subjective human behavior and characteristics here, we cannot say that these findings can also be generalized for developed world cities. It is indeed true that most studies on activity spaces are Western-based, and this study might add new insights from a developing country like Bangladesh; however, the extent to which the findings of this study are different or comparable to those Western studies requires a similar detailed study. Some suggestions for further work are as follows: study sub-area-wise models can be developed and household characteristics (HH size, number of cars used etc.) can be included as predictors in an individual model which was not done in this paper.
The difference between the activity space measurement methods is mainly related to the street pattern. For grid road networks (high connectivity), the difference between the circular method and network-based methods is moderate with the latter offering only slight improvements in the representation of a local neighborhood. However, for irregular road networks (lower connectivity) in suburban settings, the circular method becomes a much less useful approximation compared to those that account for the structure of the road network. As this study’s two sub-areas hold both characteristics regarding road networks (Dhanmondi with grid iron pattern and Mirpur with irregular road network connectivity), the use of shortest path network with road network buffer as an activity space measurement tool can be said to be sufficient. Two major limitations of some activity space studies are mentioned in Chen and Akar (2016) [
53]. One limitation is related to the residential self-selection effect. If the survey database does not contain individual panel data or have attitudinal variables, the ability to deal with residential self-selection issues will be limited. However, the inclusion of socio demographics can control for this effect to some extent. Another limitation is not to have specific longitudes and latitudes of origins, destinations, and residential locations provided by survey organization. This restriction affects the accuracy of calculating activity spaces to a certain degree. However, the grid-cell approach can provide an alternative for operationalizing activity space when data are limited. However, our study database does not have any of these limitations.


